Page 1
NREL is a national laboratory of the U.S. Department of Energy, Office of Energy Efficiency and Renewable Energy, operated by the Alliance for Sustainable Energy, LLC.
Integrated Lithium-Ion Battery Model Encompassing Multi-Physics in Varied Scales: An Integrated Computer Simulation Tool for Design and Development of EDV Batteries
Gi-Heon Kim*, Kandler Smith, Kyu-Jin Lee, Shriram Santhanagopalan, Ahmad Pesaran
*: [email protected]
The 11th InternationalAdvanced Automotive Battery Conference
January 24 – 28, 2011, Pasadena, CaliforniaInternational Battery Modeling Workshop
NREL/PR-5400-50248
Page 2
Innovation for Our Energy Future
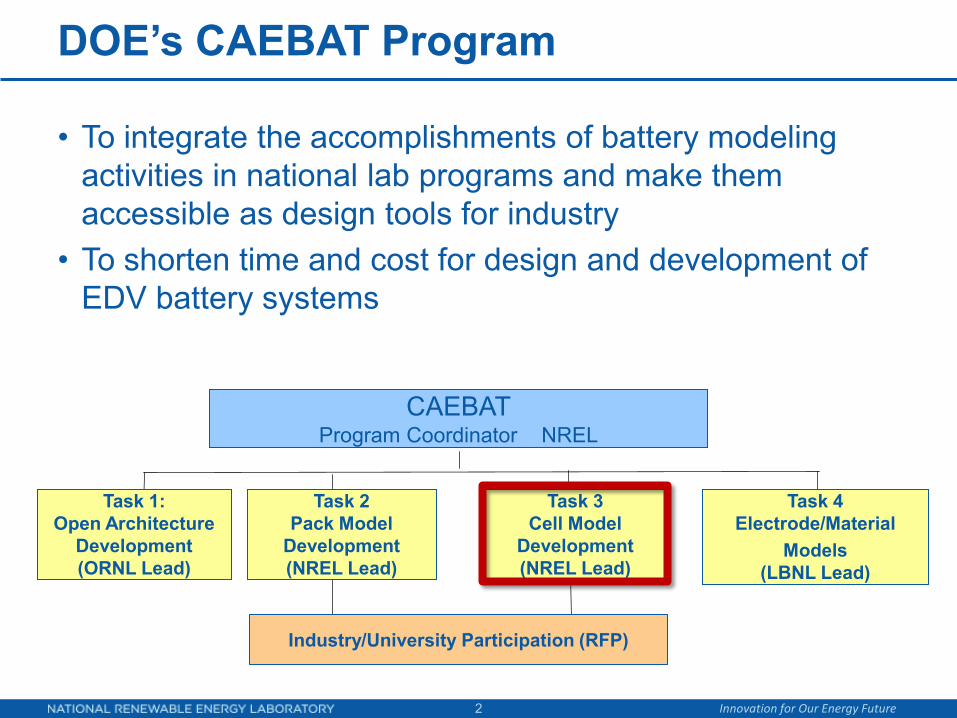
CAEBATProgram Coordinator NREL
Task 1:Open Architecture
Development(ORNL Lead)
Task 2Pack Model
Development(NREL Lead)
Task 4Electrode/Material
Models(LBNL Lead)
Major Activities and Responsibilities
Task 3Cell Model
Development(NREL Lead)
DOE’s CAEBAT Program
2
• To integrate the accomplishments of battery modeling activities in national lab programs and make them accessible as design tools for industry
• To shorten time and cost for design and development of EDV battery systems
Industry/University Participation (RFP)
Page 3
Innovation for Our Energy Future
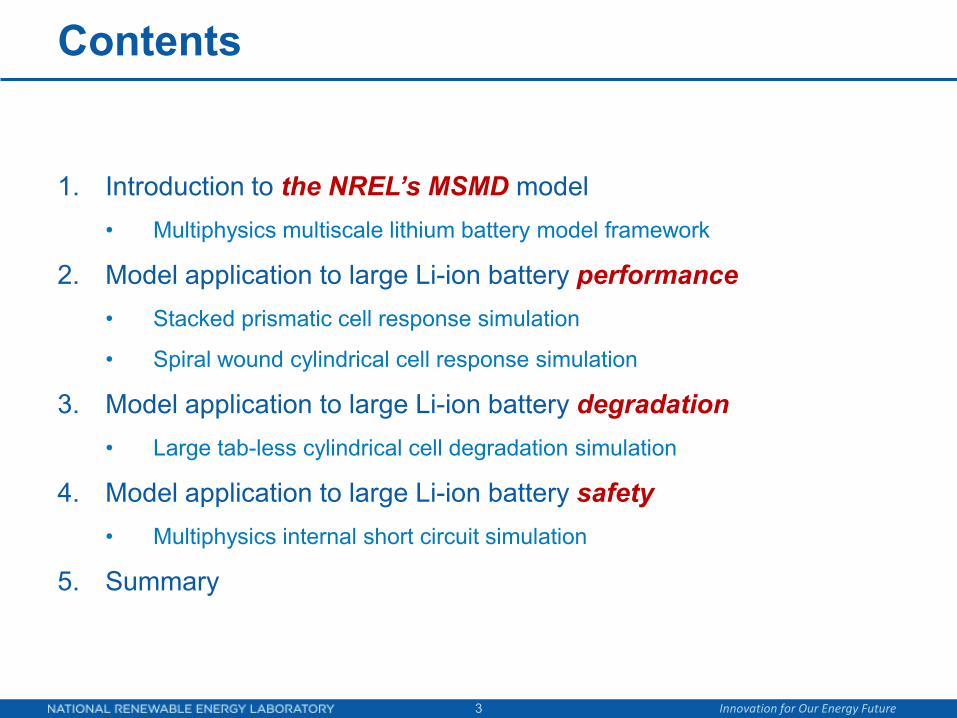
Contents
3
1. Introduction to the NREL’s MSMD model• Multiphysics multiscale lithium battery model framework
2. Model application to large Li-ion battery performance• Stacked prismatic cell response simulation
• Spiral wound cylindrical cell response simulation
3. Model application to large Li-ion battery degradation• Large tab-less cylindrical cell degradation simulation
4. Model application to large Li-ion battery safety• Multiphysics internal short circuit simulation
5. Summary
Page 4
Innovation for Our Energy Future
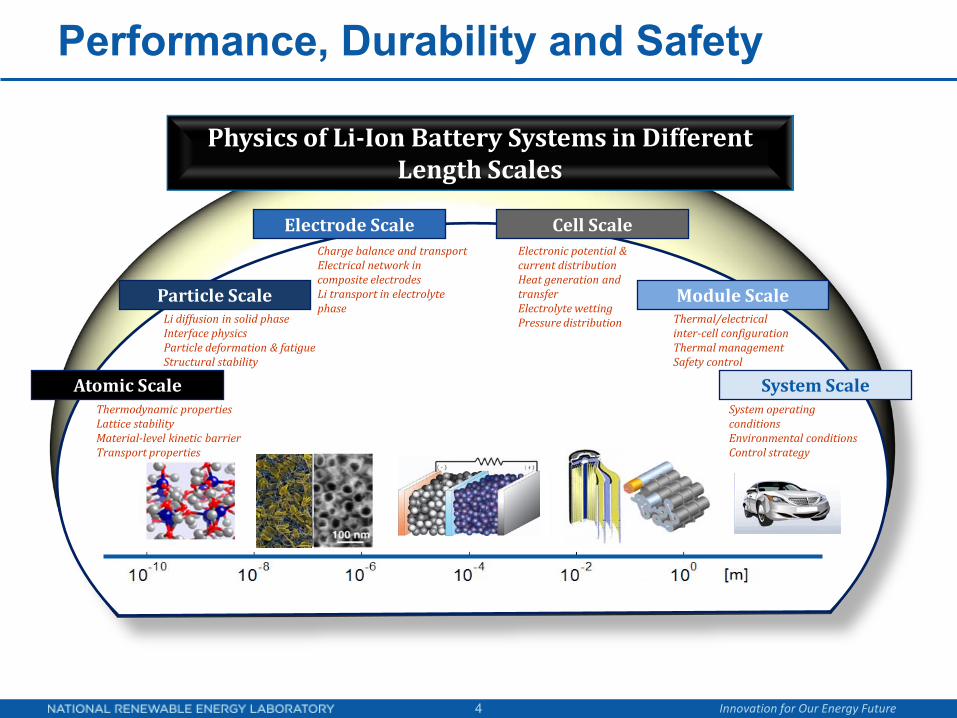
Performance, Durability and Safety
4
Physics of Li-Ion Battery Systems in Different Length Scales
Li diffusion in solid phaseInterface physicsParticle deformation & fatigueStructural stability
Charge balance and transportElectrical network in composite electrodesLi transport in electrolyte phase
Electronic potential ¤t distributionHeat generation and transferElectrolyte wettingPressure distribution
Atomic Scale
Particle Scale
Electrode Scale Cell Scale
System ScaleSystem operating conditionsEnvironmental conditionsControl strategy
Module ScaleThermal/electricalinter-cell configurationThermal managementSafety control
Thermodynamic propertiesLattice stabilityMaterial-level kinetic barrierTransport properties
Page 5
Innovation for Our Energy Future
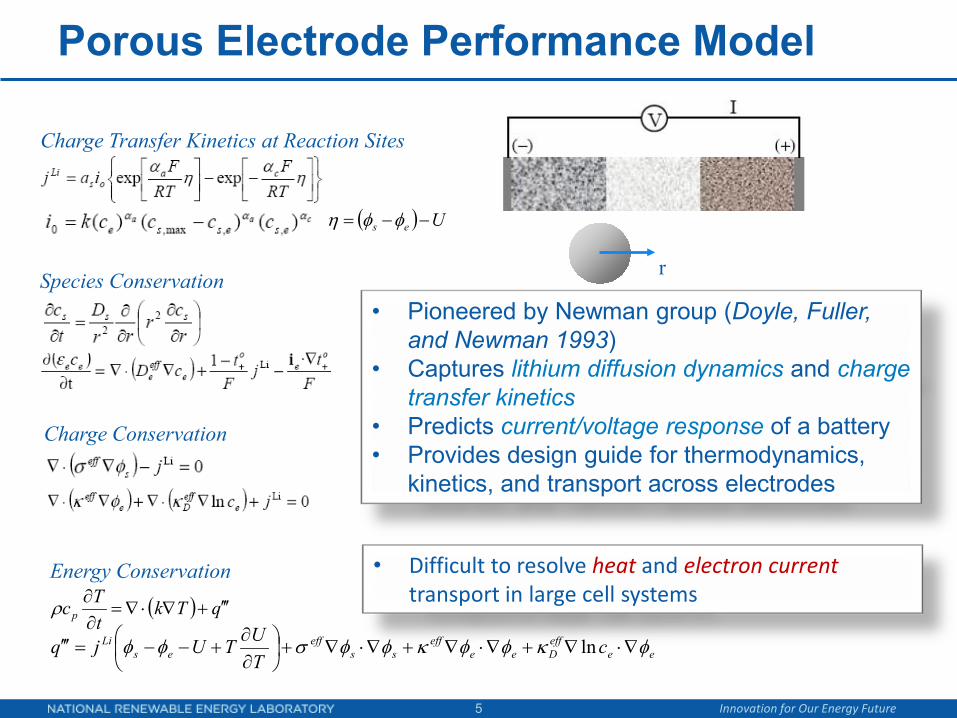
Charge Conservation
r
( ) Ues −−= φφη
Porous Electrode Performance Model
5
( ) qTktTcp ′′′+∇⋅∇=∂∂ρ
• Pioneered by Newman group (Doyle, Fuller, and Newman 1993)
• Captures lithium diffusion dynamics and charge transfer kinetics
• Predicts current/voltage response of a battery• Provides design guide for thermodynamics,
kinetics, and transport across electrodes
eeeffDee
effss
effes
Li cTUTUjq φκφφκφφσφφ ∇⋅∇+∇⋅∇+∇⋅∇+
∂∂
+−−=′′′ ln
Charge Transfer Kinetics at Reaction Sites
Species Conservation
Energy Conservation • Difficult to resolve heat and electron current transport in large cell systems
Page 6
Innovation for Our Energy Future
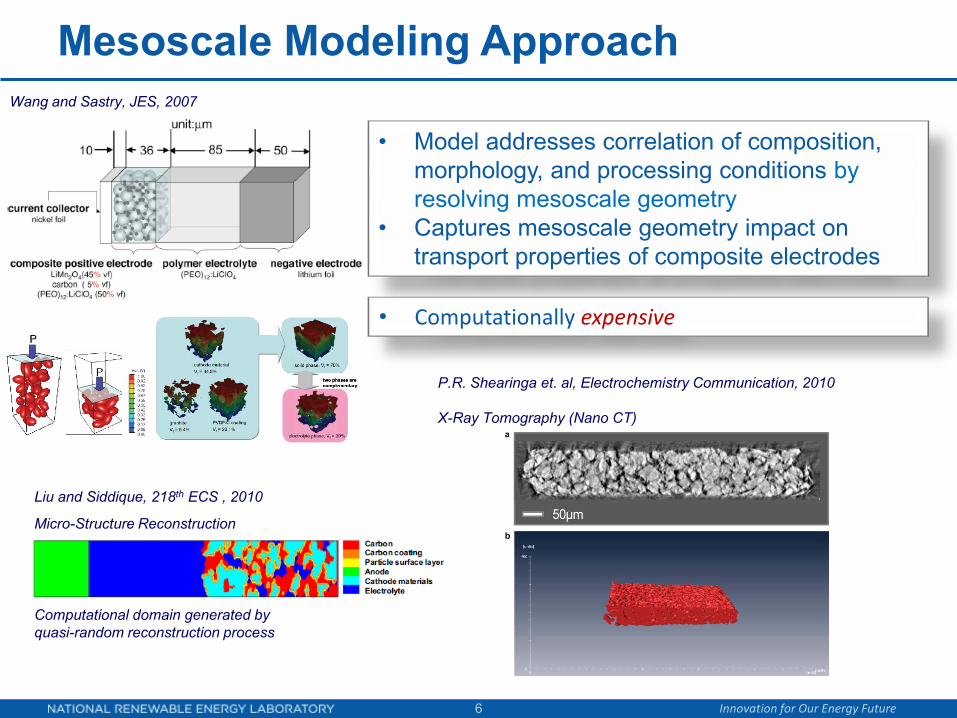
Mesoscale Modeling Approach
6
Wang and Sastry, JES, 2007
• Model addresses correlation of composition, morphology, and processing conditions by resolving mesoscale geometry
• Captures mesoscale geometry impact on transport properties of composite electrodes
• Computationally expensive
Liu and Siddique, 218th ECS , 2010
Micro-Structure Reconstruction
Computational domain generated by quasi-random reconstruction process
P.R. Shearinga et. al, Electrochemistry Communication, 2010
X-Ray Tomography (Nano CT)
Page 7
Innovation for Our Energy Future
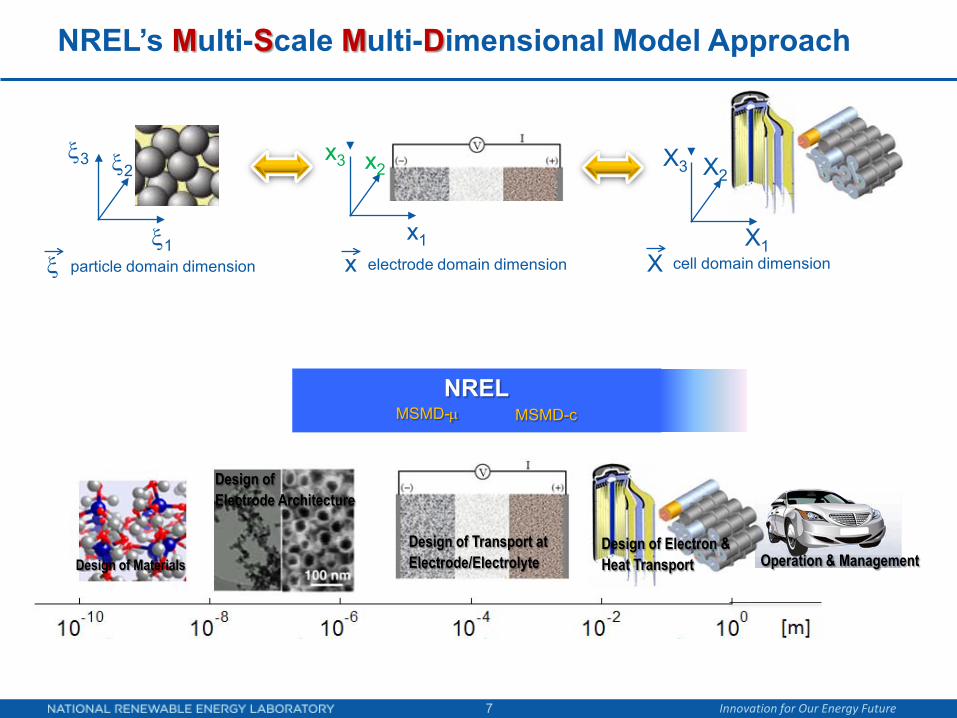
NREL’s Multi-Scale Multi-Dimensional Model Approach
7
Design of Materials
Design of Electrode Architecture
Design of Transport atElectrode/Electrolyte
Design of Electron &Heat Transport Operation & Management
MSMD-µNREL
MSMD-c
ξ1
ξ2ξ3
x1
x2x3
X1
X2X3
particle domain dimension electrode domain dimension cell domain dimensionξ x X
Page 8
Innovation for Our Energy Future
NREL’s Multi-Scale Multi-Dimensional Model Approach
8
Design of Materials
Design of Electrode Architecture
Design of Transport atElectrode/Electrolyte
Design of Electron &Heat Transport
MSMD-µNREL
MSMD-c
ξ1
ξ2ξ3
x1
x2x3
X1
X2X3
particle domain dimension electrode domain dimension cell domain dimensionξ x X
• Introduce multiple computational domains for corresponding length scale physics
• Decouple geometries between submodel domains• Couple physics in two-way using predefined inter-domain
information exchange• Selectively resolve higher spatial resolution for smaller
characteristic length scale physics• Achieve high computational efficiency• Provide flexible & expandable modularized framework
Page 9
Innovation for Our Energy Future
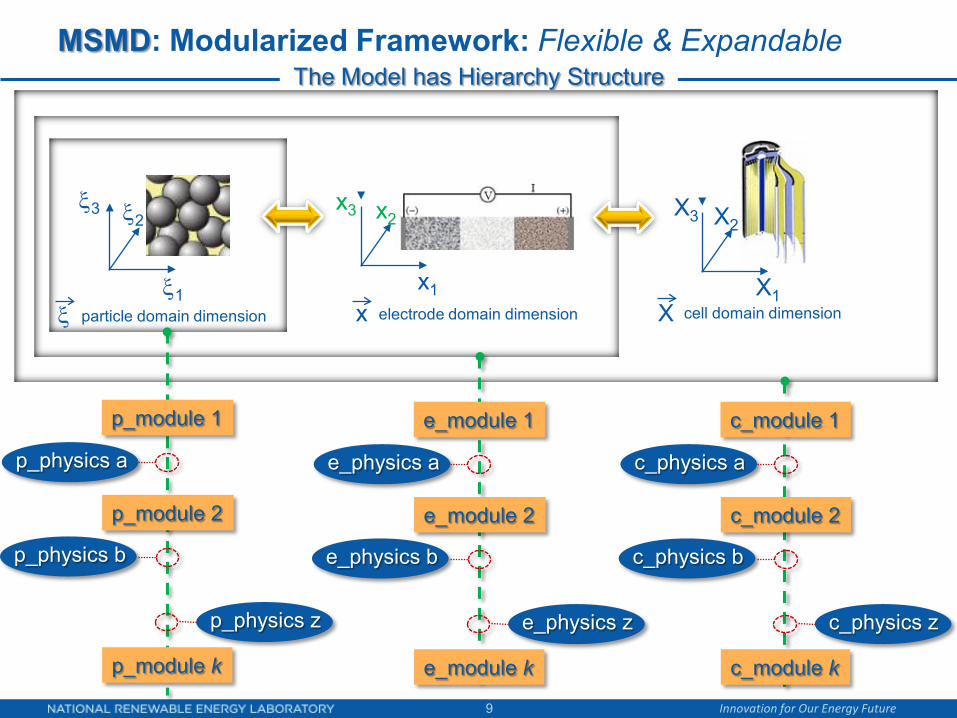
The Model has Hierarchy StructureMSMD: Modularized Framework: Flexible & Expandable
9
ξ1
ξ2ξ3
x1
x2x3
X1
X2X3
particle domain dimension electrode domain dimension cell domain dimensionξ x X
p_module 1
p_module k
p_module 2
p_physics b
p_physics z
p_physics a
e_module 1
e_module 2
e_module k
e_physics b
e_physics z
e_physics a
c_module 1
c_module 2
c_module k
c_physics b
c_physics z
c_physics a
Page 10
Innovation for Our Energy Future
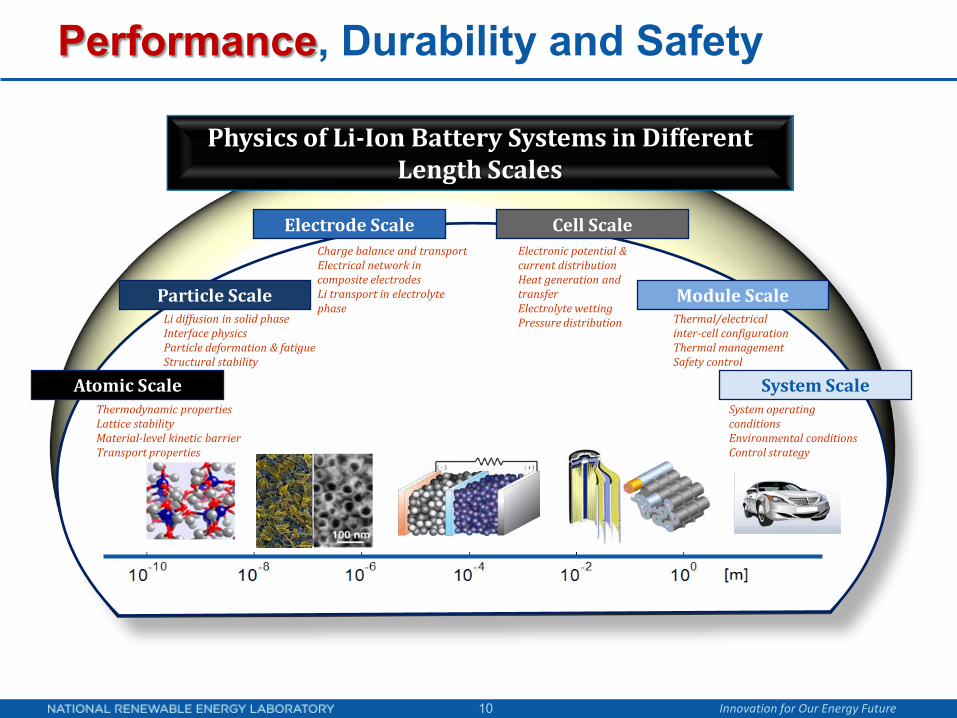
Performance, Durability and Safety
10
Physics of Li-Ion Battery Systems in Different Length Scales
Li diffusion in solid phaseInterface physicsParticle deformation & fatigueStructural stability
Charge balance and transportElectrical network in composite electrodesLi transport in electrolyte phase
Electronic potential ¤t distributionHeat generation and transferElectrolyte wettingPressure distribution
Atomic Scale
Particle Scale
Electrode Scale Cell Scale
System ScaleSystem operating conditionsEnvironmental conditionsControl strategy
Module ScaleThermal/electricalinter-cell configurationThermal managementSafety control
Thermodynamic propertiesLattice stabilityMaterial-level kinetic barrierTransport properties
Page 11
Innovation for Our Energy Future
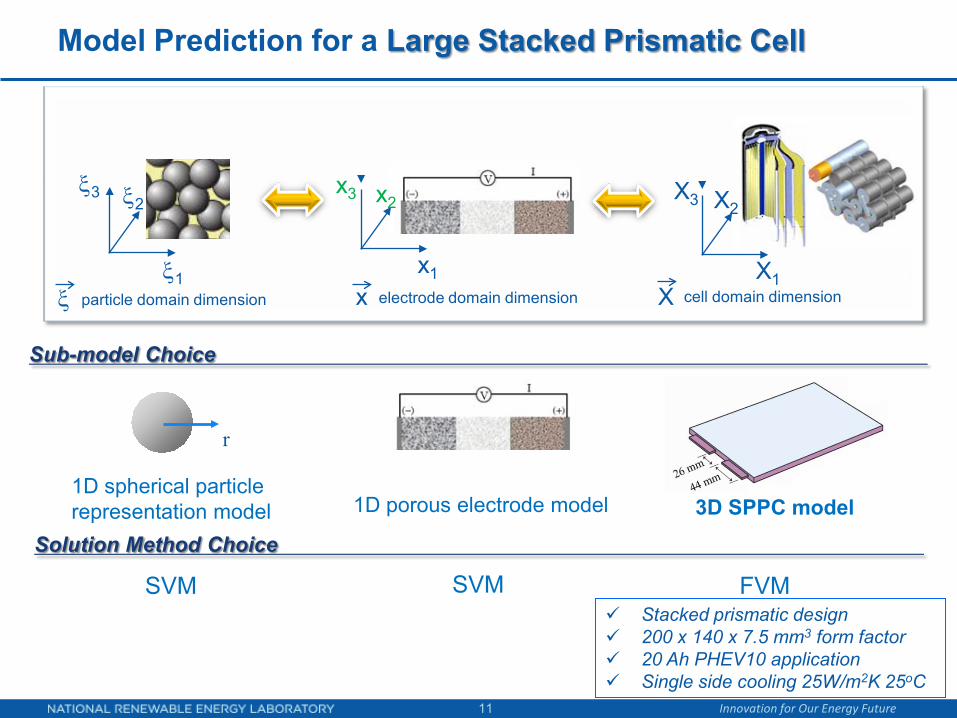
Model Prediction for a Large Stacked Prismatic Cell
11
ξ1
ξ2ξ3
x1
x2x3
X1
X2X3
1D spherical particle representation model
particle domain dimension electrode domain dimension cell domain dimensionξ x X
r
1D porous electrode model 3D SPPC model
Stacked prismatic design 200 x 140 x 7.5 mm3 form factor 20 Ah PHEV10 application Single side cooling 25W/m2K 25oC
SVM
Sub-model Choice
Solution Method Choice
SVM FVM
Page 12
Innovation for Our Energy Future
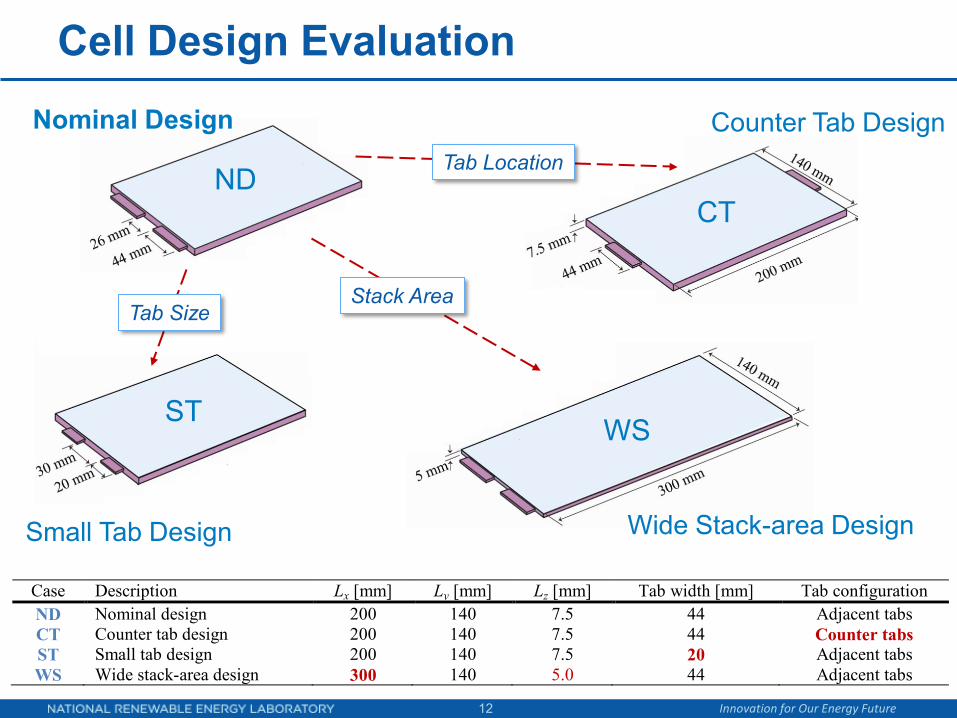
Cell Design Evaluation
12
Case Description Lx [mm] Ly [mm] Lz [mm] Tab width [mm] Tab configuration ND Nominal design 200 140 7.5 44 Adjacent tabs CT Counter tab design 200 140 7.5 44 Counter tabs ST Small tab design 200 140 7.5 20 Adjacent tabs WS Wide stack-area design 300 140 5.0 44 Adjacent tabs
Nominal Design
Small Tab Design
Counter Tab Design
Wide Stack-area Design
ND
ST
CT
WS
Tab Location
Stack AreaTab Size
Page 13
Innovation for Our Energy Future
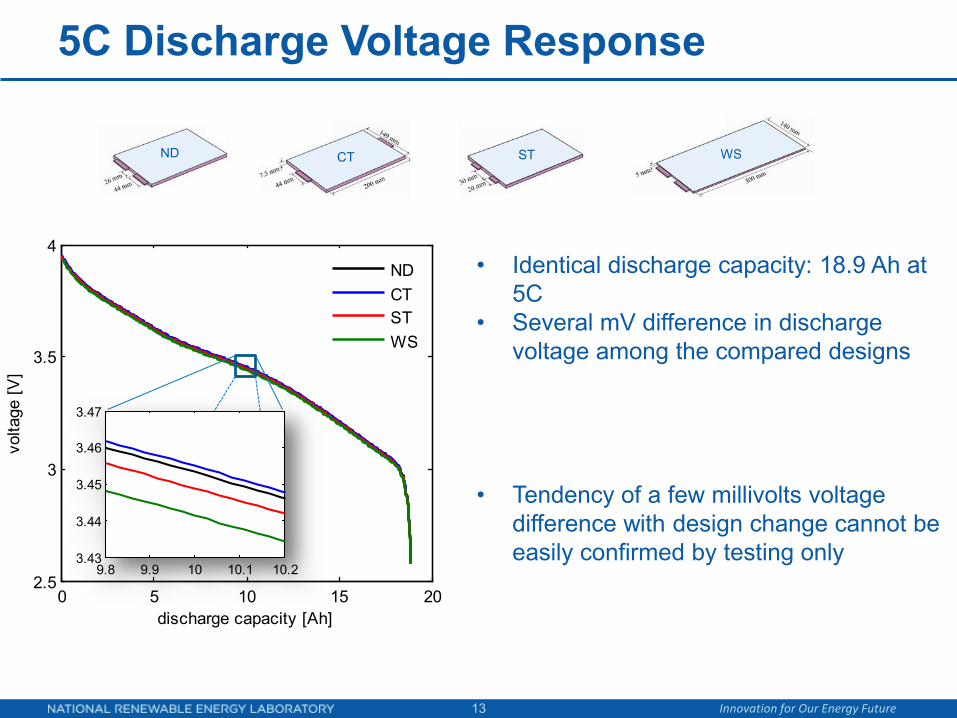
5C Discharge Voltage Response
13
• Identical discharge capacity: 18.9 Ah at 5C
• Several mV difference in discharge voltage among the compared designs
• Tendency of a few millivolts voltage difference with design change cannot be easily confirmed by testing only
0 5 10 15 202.5
3
3.5
4
discharge capacity [Ah]
volta
ge [V
]
NDCTSTWS
9.8 9.9 10 10.1 10.23.43
3.44
3.45
3.46
3.47
CT WSND ST
Page 14
Innovation for Our Energy Future
0 5 10 15 202.5
3
3.5
4
discharge capacity [Ah]
volta
ge [V
]
NDCTSTWS
Cell Internal SOC Imbalance
14
0
49.5
50
50.5
51
51.5
52ND
ST
CT
WS
Page 15
Innovation for Our Energy Future
SOC Deviation during Discharge
15
0 5 10 15 200
5
10
15
20
25
30
35
discharge capacity [Ah]
dQ/d
V [A
h/V
]
V
0 5 10 15 200
0.5
1
1.5
2
2.5
3
discharge capacity [Ah]
∆ S
OC
[%]
NDCTSTWS
SOCmax-SOCmin dQ/dV
• Results imply that Flat voltage slope would promote cell internal SOC imbalance HEV cycling at “flat section” would cause larger internal imbalance
• Modifying thermodynamics vs Optimizing electrical/thermal configuration
CT WSND ST
Page 16
Innovation for Our Energy Future
Thermal Response during Discharge
16
0 5 10 15 200
5
10
15
20
25
30
35
40
discharge capacity [Ah]
heat
gen
erat
ion
[W]
NDCTSTWS
0 5 10 15 2025
30
35
40
45
50
55
discharge capacity [Ah]
tem
pera
ture
(°C
)
0 5 10 15 2025
30
35
40
45
50
55
discharge capacity [Ah]
tem
pera
ture
(°C
)
0 5 10 15 2025
30
35
40
45
50
55
discharge capacity [Ah]
tem
pera
ture
(°C
)
Total Heat Generation
STCT WS
Temperature
• Similar average temperatures: ND, CT, ST• Smaller ∆T at CT• Larger ∆T at ST• Heat generation is highest with WS, but the
EOD average T is lowest
ND
Single side cooling on top surface With h = 25 W/m2K At Tamb= 25 oC
Page 17
Innovation for Our Energy Future
CT
WS
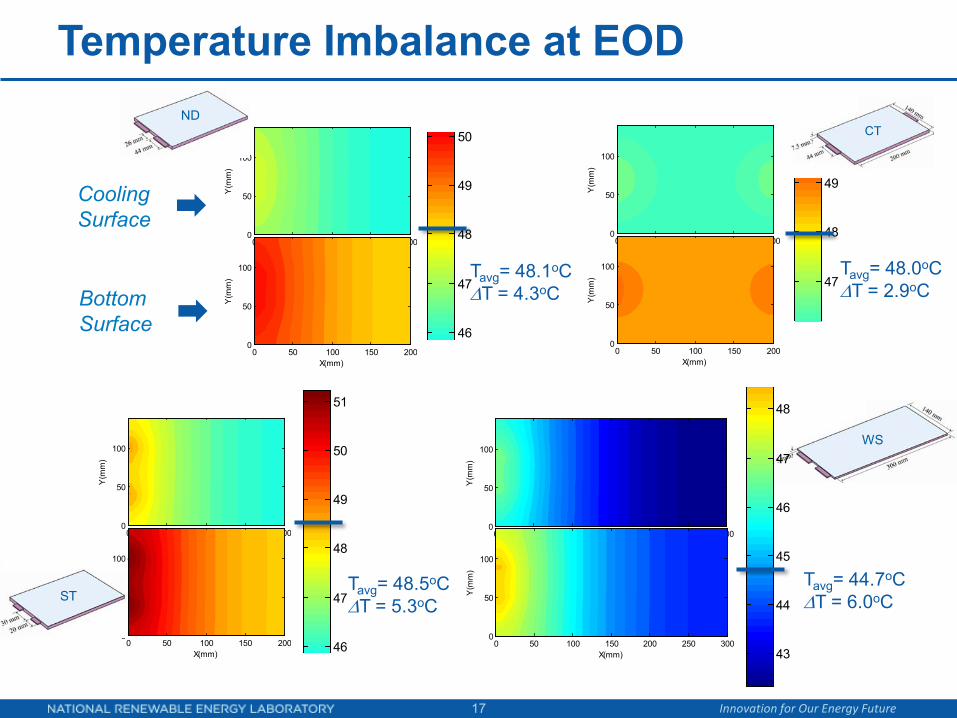
Temperature Imbalance at EOD
17
X(mm)
Y(m
m)
0 50 100 150 2000
50
100
X(mm)
Y(m
m)
0 50 100 150 2000
50
100X(mm)
Y(m
m)
0 50 100 150 2000
50
100
X(mm)
Y(m
m)
0 50 100 150 2000
50
100
X(mm)
Y(m
m)
0 50 100 150 2000
50
100
X(mm)
Y(m
m)
0 50 100 150 2000
50
100X(mm)
Y(m
m)
0 50 100 150 200 250 3000
50
100
X(mm)
Y(m
m)
0 50 100 150 200 250 3000
50
100
46
47
48
49
50
47
48
49
46
47
48
49
50
51
43
44
45
46
47
48
ND
ST
Tavg= 48.1oC∆T = 4.3oC
Tavg= 48.0oC∆T = 2.9oC
Tavg= 48.5oC∆T = 5.3oC
Tavg= 44.7oC∆T = 6.0oC
Cooling Surface
BottomSurface
Page 18
Innovation for Our Energy Future
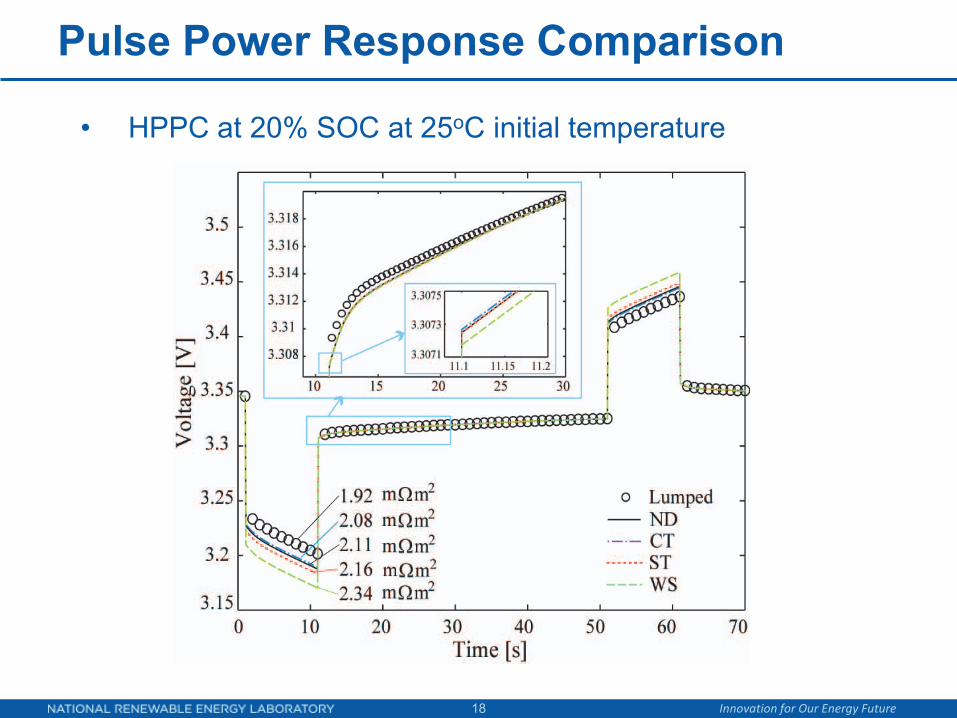
Pulse Power Response Comparison
18
• HPPC at 20% SOC at 25oC initial temperature
Page 19
Innovation for Our Energy Future
Vehicle Use Evaluation
19
0 5 10 150
0.5
1
1.5
2
2.5
3
time [minute]
∆ S
OC
[%]
NDCTSTWS
0 5 10 150
20
40
60
80
100
time [minute]
Sta
te o
f Cha
rge
[%]
NDCTSTWS
0 5 10 15-1000
-500
0
500
1000
time [minute]
Pow
er [W
]
SOCavg SOCmax-SOCmin
Battery Power per Cell
• PHEV10 mid-size sedan • 15 minutes US06 Driving Profile• Battery power from Vehicle simulation
Thermodynamics + Cell Design + System Control
Page 20
Innovation for Our Energy Future
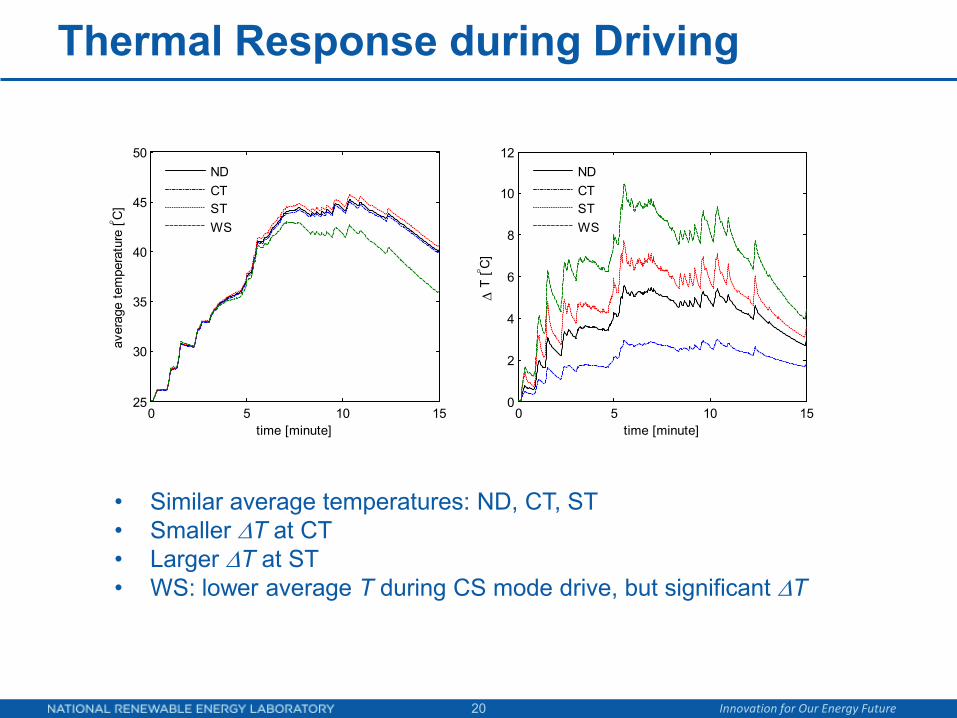
Thermal Response during Driving
20
0 5 10 150
2
4
6
8
10
12
time [minute]
∆ T
[°C
]
NDCTSTWS
0 5 10 1525
30
35
40
45
50
time [minute]
aver
age
tem
pera
ture
[°C
]
NDCTSTWS
• Similar average temperatures: ND, CT, ST• Smaller ∆T at CT• Larger ∆T at ST• WS: lower average T during CS mode drive, but significant ∆T
Page 21
Innovation for Our Energy Future
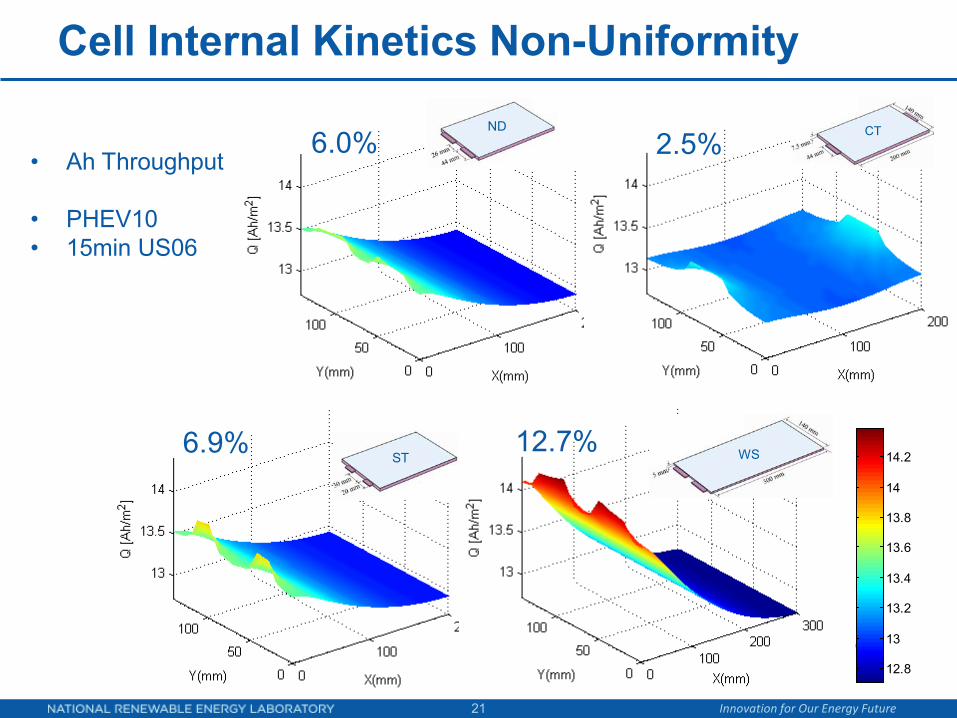
Cell Internal Kinetics Non-Uniformity
21
0
12.8
13
13.2
13.4
13.6
13.8
14
14.2
6.0% 2.5%
6.9% 12.7%
CT
WS
ND
ST
• Ah Throughput
• PHEV10• 15min US06
Page 22
Innovation for Our Energy Future
Model Prediction for a Spirally Wound Cylindrical Cell
22
ξ1
ξ2ξ3
x1
x2x3
X1
X2X3
1D spherical particle representation model
particle domain dimension electrode domain dimension cell domain dimensionξ x X
r
1D porous electrode model 3D SWC model
Spirally wound cell design D40, H100 mm form factor 10 Ah PHEV10 application
SVM
Sub-model Choice
Solution Method Choice
SVM FVM
Page 23
Innovation for Our Energy Future
Spirally Wound Cell (SWC) Model
Stacking process: Forming a pair between inner electrodes
current collector
current collectorSeparator
Winding process: Forming a second pair between outer electrodes
electrode
electrode
Spirally Wound Cell :
Paring Inner electrodes
Separator
electrode
electrode
Paring Outer Electrodes
• One pair of wide current collector foils• Two pairs of wide electrode layers• Complex electrical configuration
23
Page 24
Innovation for Our Energy Future
Model Case
24
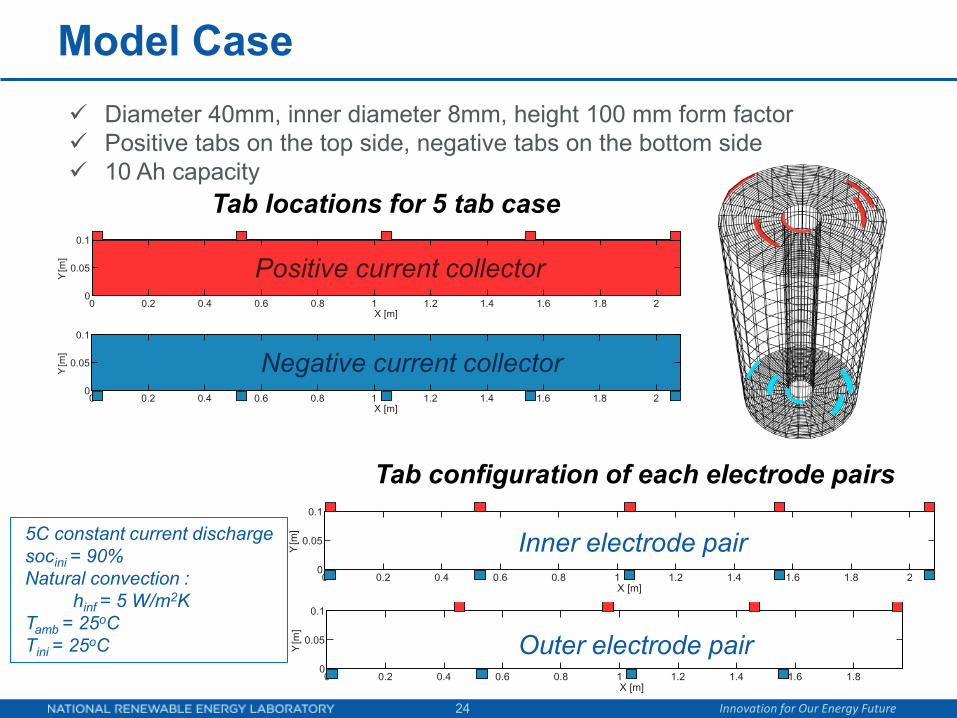
Diameter 40mm, inner diameter 8mm, height 100 mm form factor Positive tabs on the top side, negative tabs on the bottom side 10 Ah capacity
5C constant current dischargesocini = 90%Natural convection :
hinf = 5 W/m2KTamb = 25oC Tini = 25oC
0 0.2 0.4 0.6 0.8 1 1.2 1.4 1.6 1.8 20
0.05
0.1
X [m]
]m[
Y
0 0.2 0.4 0.6 0.8 1 1.2 1.4 1.6 1.8 20
0.05
0.1
X [m]
]m[
Y
Tab locations for 5 tab case
Negative current collector
0 0.2 0.4 0.6 0.8 1 1.2 1.4 1.6 1.8 20
0.05
0.1
X [m]
]m[
Y
0 0.2 0.4 0.6 0.8 1 1.2 1.4 1.6 1.80
0.05
0.1
X [m]
]m[
Y
Tab configuration of each electrode pairs
Positive current collector
Inner electrode pair
Outer electrode pair
Page 25
Innovation for Our Energy Future
X [m]
Y [m
]
0.2 0.4 0.6 0.8 1 1.2 1.4 1.6 1.8 20
0.05
0.1
122124126128
SWC Model Results
25
X [m]
Y [m
]
0.2 0.4 0.6 0.8 1 1.2 1.4 1.6 1.8 20
0.05
0.1
0
0.01
0.02
X [m]
Y [m
]
0.2 0.4 0.6 0.8 1 1.2 1.4 1.6 1.80
0.05
0.1
122124126128
Electrochemical reaction rate
Electric potential
X [m]
Y [m
]
0.2 0.4 0.6 0.8 1 1.2 1.4 1.6 1.8 20
0.05
0.1
-0.02
-0.01
5 tabs in each current collector 5 min after 5C discharge
Inner electrode pair
Outer electrode pair
Positive current collector
Negative current collector
0 2 4 6 83
3.2
3.4
3.6
3.8
Time [min]
V out [V
]
Topview
Bottomview
Current mainly flows in the winding direction
More energetic reactions near tabs
Page 26
Innovation for Our Energy Future
0 2 4 6 825
30
35
40
45
50
Time [min]
Tem
pera
ture
[o C]
X [m]
Y [m
]
0.2 0.4 0.6 0.8 1 1.2 1.4 1.6 1.8 20
0.05
0.1
0.3
0.3
26
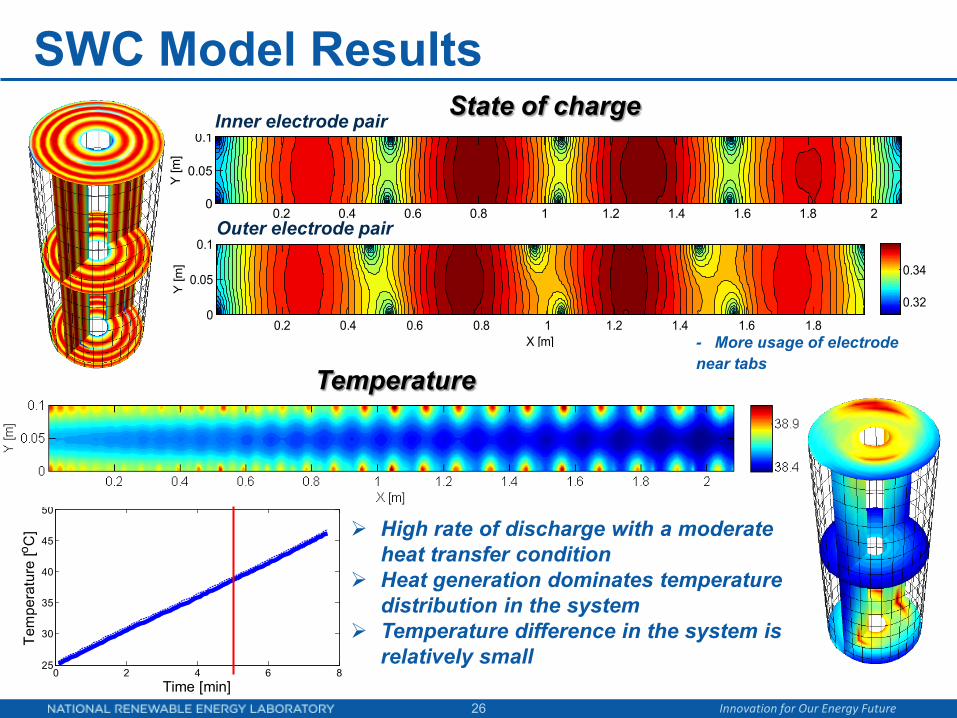
State of charge
TemperatureX [m]
Y [m
]
0.2 0.4 0.6 0.8 1 1.2 1.4 1.6 1.80
0.05
0.1
0.32
0.34
SWC Model ResultsInner electrode pair
Outer electrode pair
High rate of discharge with a moderate heat transfer condition
Heat generation dominates temperature distribution in the system
Temperature difference in the system is relatively small
- More usage of electrode near tabs
Page 27
Innovation for Our Energy Future27
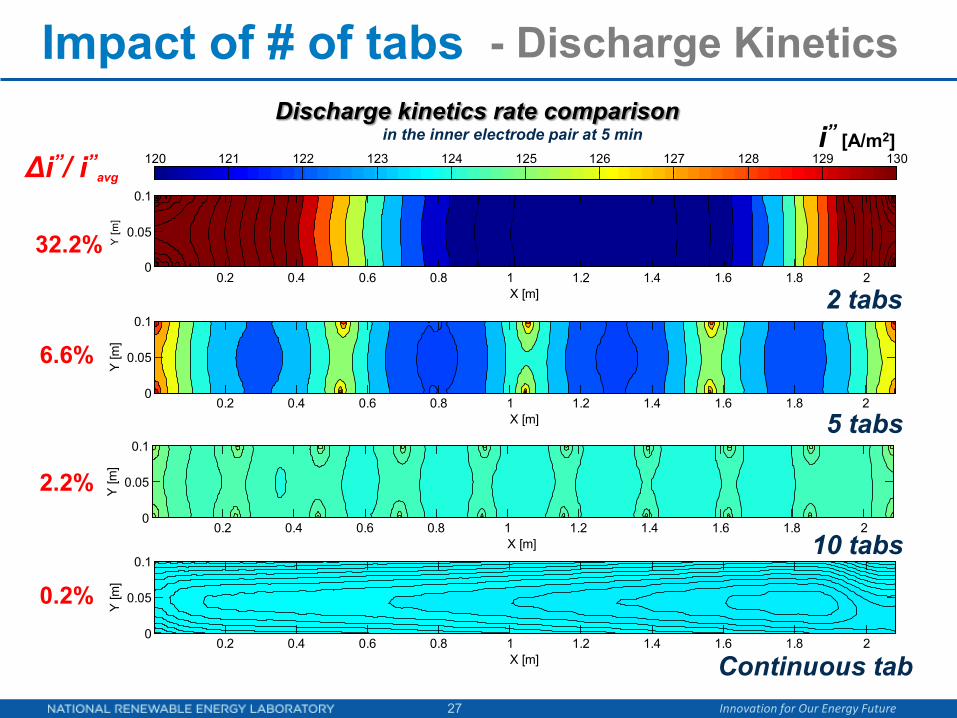
Discharge kinetics rate comparison
- Discharge KineticsImpact of # of tabs
X [m]
Y [m
]
0.2 0.4 0.6 0.8 1 1.2 1.4 1.6 1.8 20
0.05
0.1
120 121 122 123 124 125 126 127 128 129 130
X [m]
Y [m
]
0.2 0.4 0.6 0.8 1 1.2 1.4 1.6 1.8 20
0.05
0.1
X [m]
Y [m
]
0.2 0.4 0.6 0.8 1 1.2 1.4 1.6 1.8 20
0.05
0.1
X [m]
Y [m
]
0.2 0.4 0.6 0.8 1 1.2 1.4 1.6 1.8 20
0.05
0.1
i” [A/m2]
0.2%
2.2%
6.6%
32.2%
Δi”/ i”avg
2 tabs
5 tabs
Continuous tab
10 tabs
in the inner electrode pair at 5 min
Page 28
Innovation for Our Energy Future28
- TemperatureImpact of # of tabs
X [m]
Y [m
]
0.2 0.4 0.6 0.8 1 1.2 1.4 1.6 1.8 20
0.05
0.1
X [m]
Y [m
]
0.2 0.4 0.6 0.8 1 1.2 1.4 1.6 1.8 20
0.05
0.1
-0.4 -0.3 -0.2 -0.1 0 0.1 0.2 0.3 0.4T-Tavg[°C]
Temperature comparison
0.19°C
0.37°C
0.78°C
3.25°C
2 tabs
5 tabs
Continuous tab
10 tabs
ΔTat 5 min discharge
Page 29
Innovation for Our Energy Future
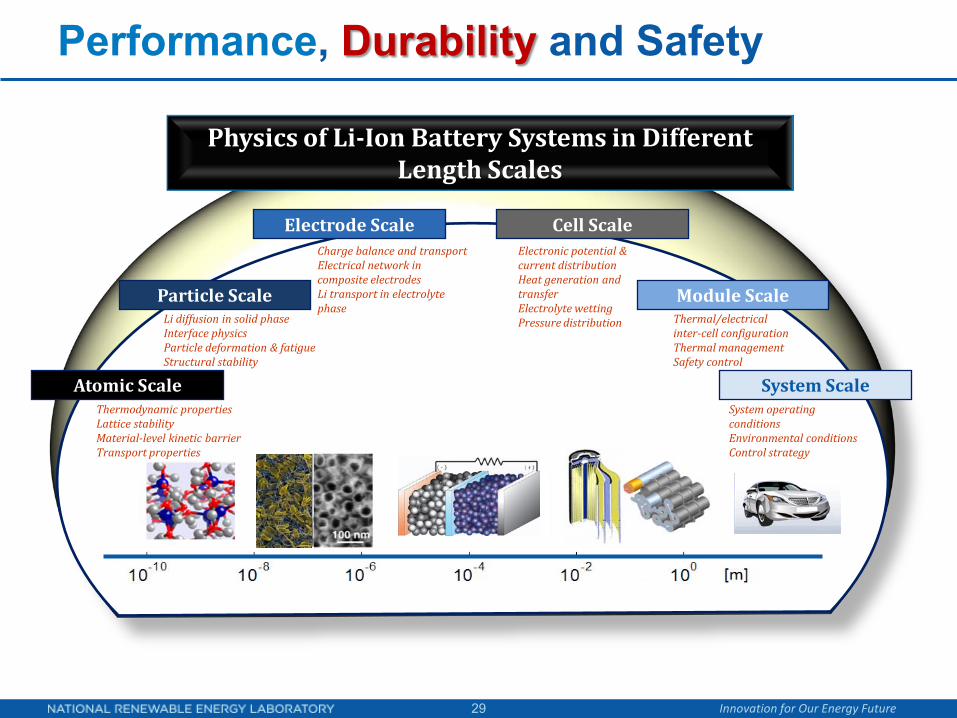
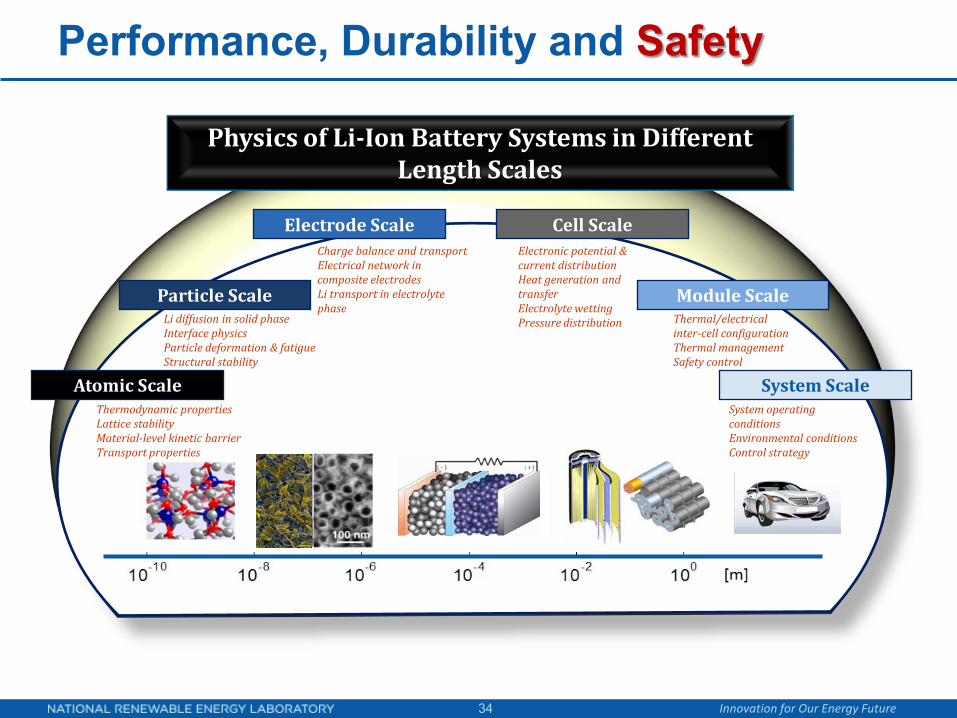
Performance, Durability and Safety
29
Physics of Li-Ion Battery Systems in Different Length Scales
Li diffusion in solid phaseInterface physicsParticle deformation & fatigueStructural stability
Charge balance and transportElectrical network in composite electrodesLi transport in electrolyte phase
Electronic potential ¤t distributionHeat generation and transferElectrolyte wettingPressure distribution
Atomic Scale
Particle Scale
Electrode Scale Cell Scale
System ScaleSystem operating conditionsEnvironmental conditionsControl strategy
Module ScaleThermal/electricalinter-cell configurationThermal managementSafety control
Thermodynamic propertiesLattice stabilityMaterial-level kinetic barrierTransport properties
Page 30
Innovation for Our Energy Future
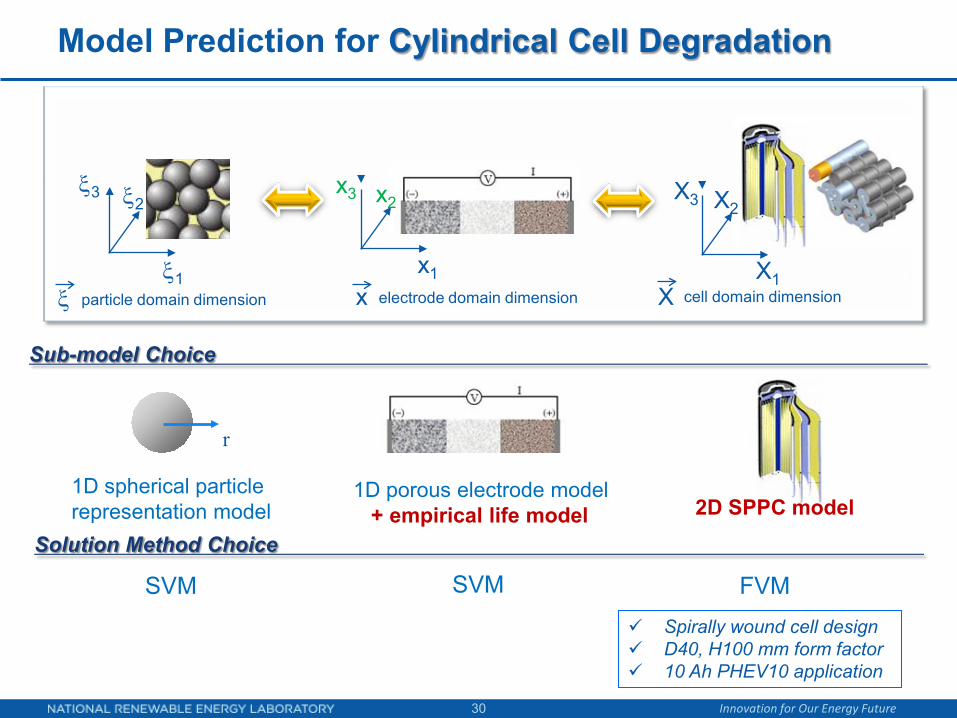
Model Prediction for Cylindrical Cell Degradation
30
ξ1
ξ2ξ3
x1
x2x3
X1
X2X3
1D spherical particle representation model
particle domain dimension electrode domain dimension cell domain dimensionξ x X
r
1D porous electrode model+ empirical life model 2D SPPC model
Spirally wound cell design D40, H100 mm form factor 10 Ah PHEV10 application
SVM
Sub-model Choice
Solution Method Choice
SVM FVM
Page 31
Innovation for Our Energy Future
Life Modeling ApproachNCA datasets fit with empirical, yet physically justifiable formulas
31
ResistanceGrowth
RelativeCapacity
•Data shown above: J.C. Hall, IECEC, 2006.•Model also fit to DOE/TLVT, Southern CA Edison & NASA data
Qactive = e0 + e1 N
R = a1 t1/2 + a2 N
Calendar fade• SEI growth (partially
suppressed by cycling)• Loss of cyclable lithium • a1, d1 = f(∆DOD,T,V)
Q = min ( QLi , Qactive )
QLi = d0 + d1 t1/2
Cycling fade• active material structure
degradation and mechanical fracture
• a2, e1 = f(∆DOD,T,V)
• Portability + Physical interpretation• Applicable to complex real-world storage and cycling scenarios
Rela
tive
Cap
acit
y (%
)
Time (years)
r2 = 0.942
Li-ion NCA chemistry
Res
ista
nce
Gro
wth
(mΩ
)
Tafel-Wohler model describing a2(∆DOD,V)
Page 32
Innovation for Our Energy Future
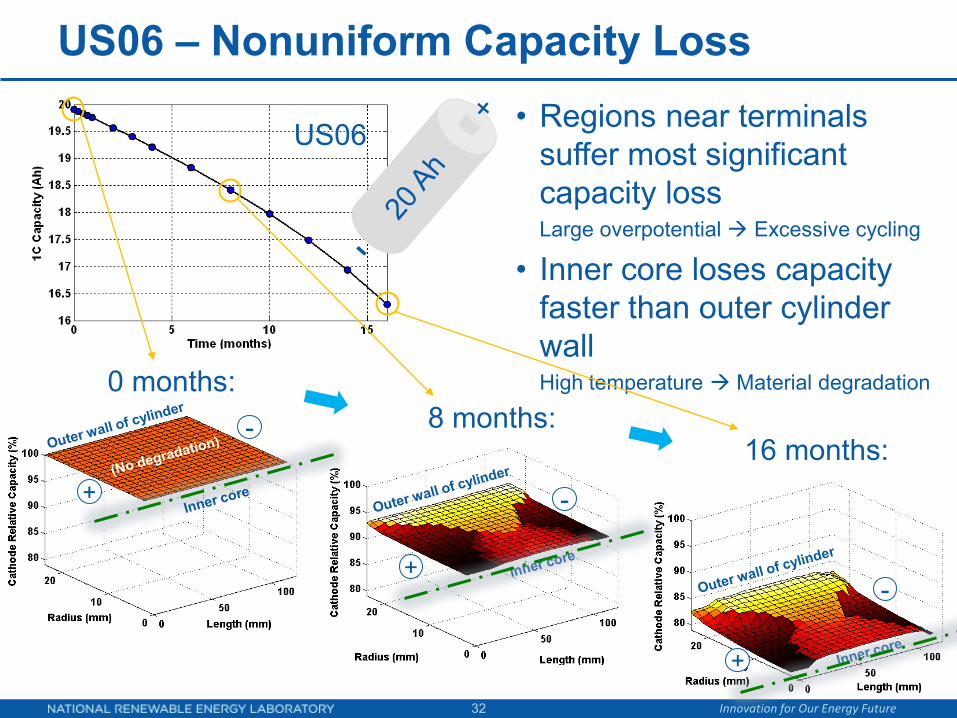
US06 – Nonuniform Capacity Loss• Regions near terminals
suffer most significant capacity lossLarge overpotential Excessive cycling
• Inner core loses capacity faster than outer cylinder wallHigh temperature Material degradation0 months:
8 months:16 months:
+
-
+
-
+
-
US06
32
Page 33
Innovation for Our Energy Future
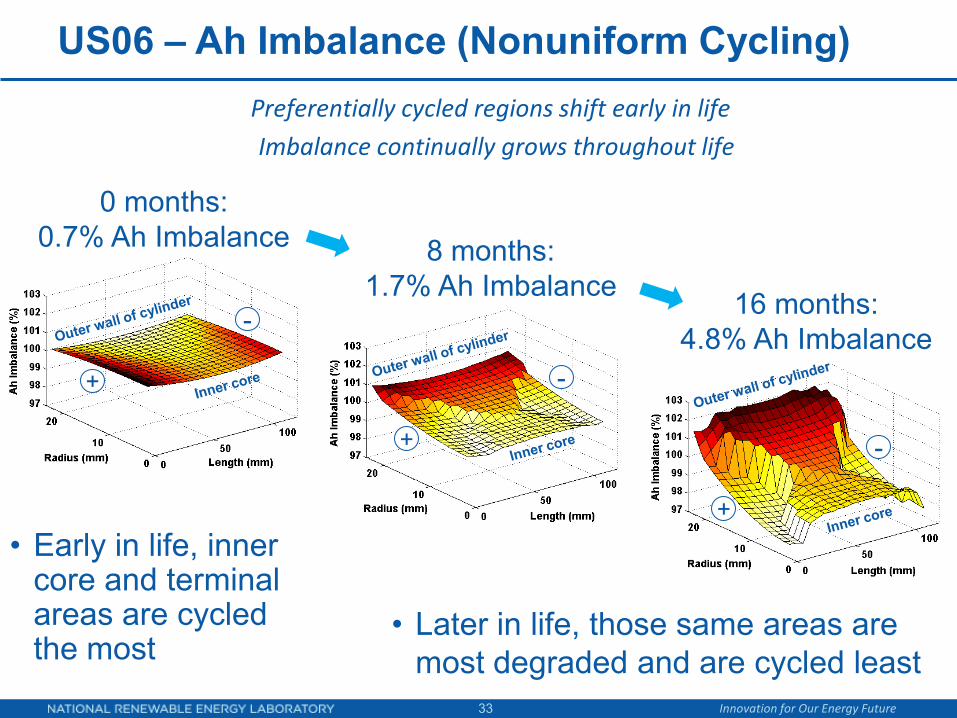
US06 – Ah Imbalance (Nonuniform Cycling)
33
0 months:0.7% Ah Imbalance 8 months:
1.7% Ah Imbalance 16 months:4.8% Ah Imbalance
• Later in life, those same areas are most degraded and are cycled least
+
-
+
-
+
-
Preferentially cycled regions shift early in life
Imbalance continually grows throughout life
• Early in life, inner core and terminal areas are cycled the most
Page 34
Innovation for Our Energy Future
Performance, Durability and Safety
34
Physics of Li-Ion Battery Systems in Different Length Scales
Li diffusion in solid phaseInterface physicsParticle deformation & fatigueStructural stability
Charge balance and transportElectrical network in composite electrodesLi transport in electrolyte phase
Electronic potential ¤t distributionHeat generation and transferElectrolyte wettingPressure distribution
Atomic Scale
Particle Scale
Electrode Scale Cell Scale
System ScaleSystem operating conditionsEnvironmental conditionsControl strategy
Module ScaleThermal/electricalinter-cell configurationThermal managementSafety control
Thermodynamic propertiesLattice stabilityMaterial-level kinetic barrierTransport properties
Page 35
Innovation for Our Energy Future
Modeling Thermal Runaway
35
Constructed empirical reaction models using calorimetry data for component decompositions: approach practiced by J. Dahn’s group
Enhanced understanding of the interaction between heat transfer and exothermic abuse reaction propagation for a particular cell/module design
Provided insight on how thermal characteristics and conditions can impact safety events of lithium-ion batteries
20 40 sec8 28
Total Volumetric Heat Release from Component Reactions
4 2416 3612 32
Internal T External T
(°C)
0 20 40 (sec)
SEI decomposition positive/electrolyte negative/electrolyte
Page 36
Innovation for Our Energy Future
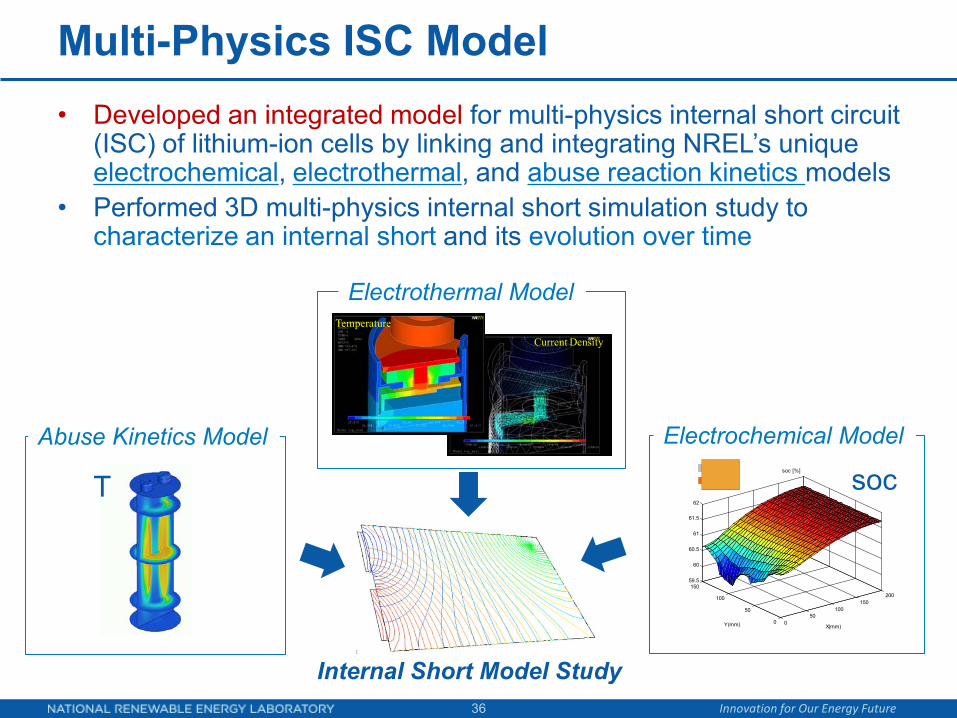
Multi-Physics ISC Model
36
• Developed an integrated model for multi-physics internal short circuit (ISC) of lithium-ion cells by linking and integrating NREL’s unique electrochemical, electrothermal, and abuse reaction kinetics models
• Performed 3D multi-physics internal short simulation study to characterize an internal short and its evolution over time
Current Density
Temperature
Electrothermal Model
Abuse Kinetics Model Electrochemical Model
050
100150
200
0
50
100
15059.5
60
60.5
61
61.5
62
X(mm)
soc [%]
Y(mm)
Internal Short Model Study
socT
Page 37
Innovation for Our Energy Future
40 mm
35 mm
3 mm
Shorted Spot
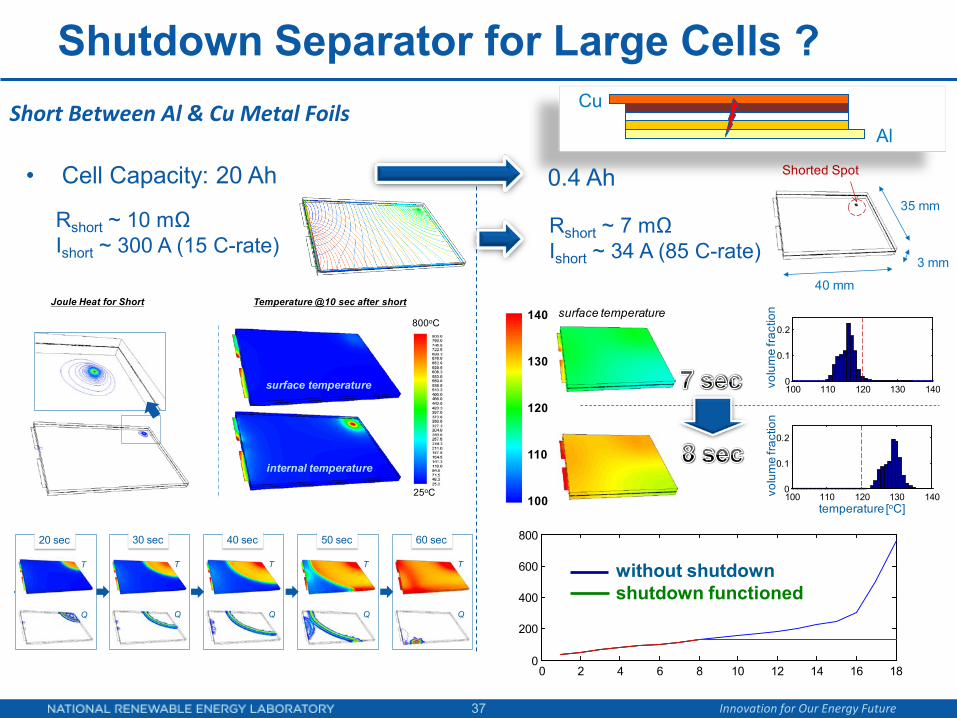
Shutdown Separator for Large Cells ?
37
Short Between Al & Cu Metal FoilsAl
Cu
• Cell Capacity: 20 Ah 0.4 Ah
Rshort ~ 10 mΩIshort ~ 300 A (15 C-rate)
Rshort ~ 7 mΩIshort ~ 34 A (85 C-rate)
Joule Heat for Short Temperature @10 sec after short
800oC
25oC
surface temperature
internal temperature
T
Q
30 sec
T
Q
40 sec
T
Q
50 sec
T
Q
60 sec
T
Q
20 sec
100 110 120 130 1400
0.1
0.2
100 110 120 130 1400
0.1
0.2
110
140
120
130
100
surface temperature
temperature [oC]
volu
me
fract
ion
volu
me
fract
ion
0 2 4 6 8 10 12 14 16 180
200
400
600
800
without shutdownshutdown functioned
Page 38
Innovation for Our Energy Future
Summary
38
1. Introduction to the NREL’s MSMD model
• The MSMD model is a modularized multiphysics multiscale lithium battery model framework
2. Model application to large Li-ion battery performance
• The model enhances understanding of interactions among varied scale physics beyond what’s possible with experimentally measurable quantities only
• Thermal/electrical design variation of a cell impacts internal battery kinetics
3. Model application to large Li-ion battery degradation
• Internal imbalance of cell use grows continually throughout life
4. Model application to large Li-ion battery safety
• Cell heating pattern is affected by cell characteristics (e.g. Ah, rate)
Page 39
Innovation for Our Energy Future
Acknowledgments
39
Vehicle Technology Program at DOE• Dave HowellCAEBAT operation at DOE• Stephen Goguen, Brian Cunningham
Thank you for your attention!


![HANGING SCALES/CRANE SCALES - Aviga HFO 159 page 166 1020,-from € Hanging scales/Crane scales Lisa Mayer Product specialist Hanging scales/Crane scales Tel. +49 [0] 7433 9933 - 219](https://static.documents.pub/doc/80x56/5afd22507f8b9a68498c727e/hanging-scalescrane-scales-hfo-159-page-166-1020-from-hanging-scalescrane.jpg)


