70
i Integrated Model for Project Risk & Uncertainty Management Ilyas B. Alhassan Tahir Mehmod Degree of Master Thesis (1yr), Royal Institute of Technology Stockholm, Sweden

i
Integrated Model for
Project Risk & Uncertainty Management
Ilyas B. Alhassan Tahir Mehmod
Degree of Master Thesis (1yr),
Royal Institute of Technology Stockholm, Sweden
ii
INTEGRATED MODEL
FOR
PROJECT RISK &
UNCERTAINTY
MANAGEMENT
Ilyas B. Alhassan
Tahir Mehmood
Master’s Degree Thesis Project in Partial Fulfillment for the Award of Master
of Science in Project Management and Operational Development (One Year)
The Royal Institute of Technology, KTH, Stockholm, Sweden
Royal Institute of Technology
School of Industrial Engineering and Management
Examiner: Roland Langhe Internal Supervisor: Roland Langhe
External Supervisor(Elekta): Johannes Morelius

iii
ABSTRACT
ll projects taste unexpected events that can impact their objectives in the
form of lost or gain, or even deviation from a required or planned
outcome. Elekta as a product development organization is continuously
developing innovative products through projects and product innovation. Projects
development and execution naturally involve significant risks. This thesis project
aimed at developing a prototype integrated quantitative and qualitative risk
management model for handling project risks and uncertainties within Elekta.
Interviews were first used to analyze the characteristics of the risk management
process in Elekta with reference to ISO 31000. Eventually, it revealed that the process
is not well structured, and thus provide insufficient support for managing project risks
and uncertainties. The model was built in spread sheet (@ risk) and piloted on an
ongoing project. The results have shown that the model can help improving the
current schedule and cost risk analysis plus provide a means of analyzing risks at a
good level of detail, that is, on the basis of the level of impact each risk may have on
each specified project objectives. The model also provides a higher level and less
rigorous approach for handing minor project risks. The demonstrations also showed
that the model could also be applied to aggregate the individual risks to visualize
project and portfolio level risks. We recommended that the model can be extended to
consider opportunity management in good depth.
A

iv

v
ACKNOWLEDGMENTS
e praise and thank God for His favors throughout this endeavor. We
express our gratitude and appreciation to our supervisors; Roland Langhé
(KTH) and Johannes Morelius (Elekta, Stockholm) for their support,
guidance, suggestions, comments and encouragement. Their attention was central to
the success of this study.
To all the project managers and other staff members of Elekta that we interacted with
during our study, we appreciate your diverse support and we are grateful to Elekta for
proving the funding for this study. To our colleague thesis students at Elekta, more
grease and power to your elbows! It was nice meeting you.
Nonetheless, we wish to thank our families and friends for their indirect support. To
all our course mates in the Project Management and Operational Development
Program at KTH, thanks for making lectures and course work at KTH interesting and
expedient.
Thank you all for being creditable part of our project.
Ilyas B. Alhassan & Tahir Mehmood
W

vi

vii
TABLE OF CONTENTS
ABSTRACT ...................................................................................................................... iii
1 INTRODUCTION..................................................................................................1
1.1 Background and the Research Problem ...............................................................3
1.2 Research Aim .......................................................................................................4
1.3 Research Questions ..............................................................................................4
1.4 Research Scope and Limitations ..........................................................................4
1.5 Outline of the Thesis Report ................................................................................5
2 REVIEW OF LITERATURE ...............................................................................6
2.1 Overview of Project Risk and Uncertainty Management ....................................6
2.2 Project Risk and Uncertainty Management Models and Frameworks...............10
2.3 ISO 31000 ..........................................................................................................11
2.3.1 Communication and Consultation..........................................................................12
2.3.2 Establishing the Context ........................................................................................13
2.3.3 Risk Assessment ....................................................................................................13
2.3.4 Risk Evaluation ......................................................................................................18
2.3.5 Risk Response ........................................................................................................18
2.3.6 Monitoring and Review .........................................................................................19
3 RESEARCH METHODS ....................................................................................20
3.1 Literature Review...............................................................................................20
3.2 Research Strategy...............................................................................................21
3.3 Data collection ...................................................................................................21
3.4 Framework for data analysis ..............................................................................23
3.5 Reliability and Validity of the Study .................................................................24
4 ANALYSIS OF PRESENT SITUATION ..........................................................25
4.1 The Risk Identification Process .........................................................................25
4.2 The Risk Analysis Process .................................................................................27
4.3 The Risk Evaluation Process .............................................................................28
4.4 The Risk Response Process ....................................................................................... 28

viii
4.5 Communication and Consultation ............................................................................ 29
4.6 The Monitoring and Control Process ....................................................................... 29
5 RESULTS AND DISCUSSION ............................................................................. 32
5.1 Conceptual framework of the Model ....................................................................... 32
5.2 Piloting the Model ...................................................................................................... 40
6 CONCLUSIONS AND ............................................................................................ 49
RECOMMENDATIONS ......................................................................................................... 49
6.1 Conclusions ................................................................................................................. 49
6.2 Recommendations ...................................................................................................... 50
7 REFERENCES ......................................................................................................... 52
8 APPENDIXES ........................................................................................................... 54
8.1 Appendix A: ................................................................................................................ 54

ix
TABLE OF FIGURES
Figure 1.1 Relationship between uncertainty and risk ................................................... 2
Figure 2.1 The Risk Management Process (ISO 31000, 2009). .................................. 12
Figure 2.2: Probability - Impact Matrix. ...................................................................... 14
Figure 2.3: Overall risk as a function of its components (Kerzner, 2001)................... 14
Figure 2.4 : Example of a decision tree. PMBOK, 1996. ............................................ 16
Figure 2.5 Simulation results visualizes in a Histogram (Lecture notes, 2010). ......... 16
Figure 2.6 : Summary of the Quantitative Risk Analysis Approach (Cooper et al,
2005). ........................................................................................................................... 18
Figure 2.7: Quantitative Risk Analysis in Spreadsheet (Cooper et al, 2005). ........... 18
Figure 3.1 The research approach. ............................................................................... 20
Figure 4.2: Present usage of tool/techniques for Risk Identification. .......................... 26
Figure 4.1: Key for subsequent graphs ........................................................................ 26
Figure 4.3: Present usage of tool/techniques for Risk Analysis. ................................ 27
Figure 4.4: Present usage of tool/techniques for Risk Evaluation. .............................. 28
Figure 4.5: Usage of tools/techniques for Communication and Consultation. ............ 29
Figure 4.6: Present usage of tool/techniques for monitoring and review. ................... 30
Figure 5.1: The Integrated Risk and Uncertainty Management Model. ...................... 32
Figure 5.2: Snapshot of simulation in @risk for schedule analysis. ............................ 41
Figure 5.3: Simulation result for schedule analysis. .................................................... 42
Figure 5.4: Simulation result for schedule analysis. .................................................... 43
Figure 5.5: Snapshot of simulation in @risk for cost analysis. ................................... 45
Figure 5.6: Simulation result for cost analysis............................................................. 46
Figure 5.7: Simulation result for cost analysis............................................................. 47

x

xi
OPERATIONAL DEFINITIONS Technical terms in this report are defined as in the ISO 31000 risk management standard.

1
CHAPTER 1
1 INTRODUCTION
model has been proposed for handling project risks and uncertainties in
this thesis. Here we intend to provide the general information requisite to
understand more detailed information in rest of the report. That is, we
introduce in general terms the concept and purpose of project risk and uncertainty
analysis, the background of the research, the aim and objectives of the study, the
research questions, the scope and limitations of the study as well as the description of
the study unit.
Projects are normally created to achieve specific demands and benefits by means of
producing a unique product or service within clearly specified objectives. These
include but not limited to; scope, time and cost as well as the quality of the end
product (PMBOK, 2008). Any event or occurrence that will affect these specified
objectives positively or negatively constitutes a risk.
All Projects by definition are unique but beset with risks and uncertainties. A zero risk
project is not worth undertaking. The extent of uncertainties and risks vary according
to the size and complexity of projects. Risk and uncertainty analysis therefore helps
decision makers to choose wisely under conditions of doubt. The analysis also assists
project staff to discover things that can enhance the project objectives or things that
can go wrong in the project process and offer ways to address them. Uncertainty,
however, is an abstract and fuzzy concept and many project managers lack the
suitable tool box to accurately define it for effective analysis.
Risk and uncertainty are related but different concepts and dealing with them in
projects is a continual concern for project stakeholders (Martland, 2004). Chapman
and Ward (2002) defined uncertainty as the “lack of certainty, involving variability
A
2
Opportunity
Uncertainty
Risk Threat
and ambiguity”. They went further to defined Variability as “uncertainty about the
size of parameters which may result from lack of data, lack of detail, lack of
definition, lack of experience and so on, which may be quantified if this is useful” and
finally, they defined ambiguity as “the aspects of uncertainty not addressed in terms
of variability”.
These definitions implied that the term uncertainty is a general term that has two
parts; i.e. variability and ambiguity. This study focused more on the variability
component of uncertainty as we have an objective to address variability in project cost
and schedule estimations. For the purpose of convenience and clarity, uncertainty is
defined in this study as the potential of different outcomes. That is, we are faced with
uncertainty when the outcome of a given event is variable and this reflects the
unknowns and randomness inbuilt in both natural and man-made systems. Uncertainty
in this sense is therefore related to our inability to specify something with precision
and this causes a major problem during decision making.
Risk on the other hand is a more precise term that refers to the effect of uncertainty on
project objectives (ISO 31000). Thus, risk is an exposure to the consequences of
uncertainty - the possibility that the outcome of an uncertainty will have positive or
negative effects on the project objectives. Uncertainty thus evolves into risk and risk
can either be favorable or
unfavorable to the project
objectives. Favorable future
events or outcomes are
called opportunities and
unfavorable events are
known as threats. The
evolution process from
uncertainty to risk can be
iterative since the identified
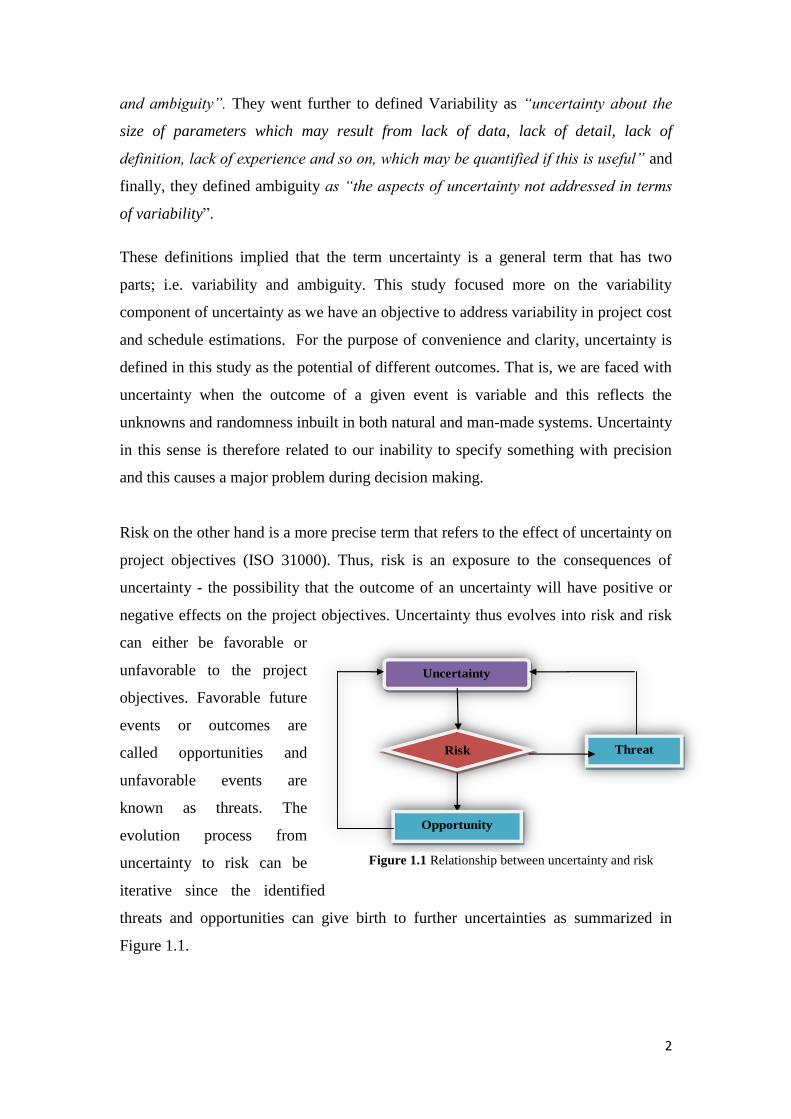
threats and opportunities can give birth to further uncertainties as summarized in
Figure 1.1.
Figure 1.1 Relationship between uncertainty and risk

3
1.1 Background and the Research Problem
With about 3300 employees globally, Elekta is a global innovative medical
technology related firm that provides unique clinical solutions for the treatment of
cancer and brain disorders. Elekta uses well advanced tools and dose planning
systems for the radiotherapy and radio surgery together with software systems. This
enhances the efficiency of workflows all the way through the entire range of cancer
care. The product business areas of Elekta includes; Elekta Neuroscience, Elekta
Oncology, Elekta Software, and Elekta Brachytherapy solutions.
The thesis project focuses on the Elekta’s office in Stockholm, Sweden (business area
Neuroscience), hereafter defined as Elekta. Some products of Elekta Neuroscience
include; Leksell Gamma Knife® , Extend™ Program, Leksell Stereotactic System®,
Elekta Neuromag®, SonoWand Invite™, etc.
Elekta Neuroscience is continuously developing innovative products through projects
and product innovation projects naturally involve significant risks Many of these risks
can however be identified in advance to plan response in order to effectively reduce
their effect on the project objectives. Yet, the existing way of handling risk and
uncertainty in Elekta is unable to effectively; identify the uncertain parameters in the
activities of a given project, define or assign numerical or qualitative levels for these
parameters to determine risk values and aggregate them to visualize project and
portfolio risk levels. There are particular errors associated with the deterministic
estimation of time and cost due the fact that projects are usually conducted in dynamic
environments. This makes cost and schedule analysis difficult at the early stages of a
project. This study therefore intended to improve Elekta’s project risk and uncertainty
management by developing a framework for dealing with risk and uncertainty.
Special attention was given to stochastic quantification of activity duration and costs
as well as quantification of project duration and cost. This can be helpful for
identifying measures that can be taken to improve schedule and cost performance
through the development of cost and schedule uncertainties (uncertainty of staying
within budget and schedule).

4
1.2 Research Aim
The aim of the study was to develop a prototype project risk and uncertainty
management model that can be applied at different levels of project aggregation-
Project, program and portfolio levels, in Elekta, Stockholm. The following
objectives were specified in order to achieve the research aim:
1. Assess and understand how project risks and uncertainties are currently
managed in Elekta.
2. Establish the model functional logic or conceptual framework to
systematically describe how the model will work.
3. Identify and specify the model contents
4. Develop and test the proposed model on some ongoing projects within Elekta.
1.3 Research Questions
The study seeks to address the following questions:
1. How are project risks and uncertainties managed in Elekta? What are
weaknesses of this approach compare to best practices and what can be
improved?
2. What models and frameworks are available and which of them are suitable to
be applied in this case study?
3. What will be the structure and inputs to the model?
4. How will the suggested model be practically implemented at both project and
portfolio levels?
1.4 Research Scope and Limitations
The scope of the study was limited to the development of a project risk and
uncertainty model for the purpose of project risk management in Elekta, Stockholm
and not a general kind of risk management model for Elekta. The study did not intend
to analyze cause-effect relationships, but the focus was to explore, describe,
understand, and suggest a model to improve the current risk model in Elekta. Also,
given the time available for this thesis project, the study was not able to implement
and monitor the performance of the proposed model in Elekta for further
improvements. In addition, no software was developed to automate the prototype

5
model since it was cost-effective, easy and efficient to adopt and existing appropriate
software packages spreadsheet (@risk) for the implementation of the model.
The research strategy chosen for this project was case study strategy and it is therefore
narrow in scope and cannot be used to make generalization about the characteristics
of the process of risk and uncertainty management in similar organizations. Also, the
empirical data collected for analyzing the present situation was designed to describe
risk and uncertainty management in Elekta and this somehow puts a limit on how the
study can explain why things were the way they were.
1.5 Outline of the Thesis Report
This report contains five chapters and the rest of the chapters are organized as
follows: Chapter 2 is an overview of the relevant literature relating project risk and
uncertainty management. Chapter 3 presents how the study was conducted. It
discussed how the data was collected and the different steps used to develop the
proposed model. Chapter 4 focuses on how the current situation was analyzed.
Chapter 5 presents and discusses the proposed model and how the model was piloted
and finally, Chapter 6 presents the conclusions and recommendations of the study.

6
CHAPTER 2
2 REVIEW OF LITERATURE
2.1 Overview of Project Risk and Uncertainty Management
his chapter presents a literature review on the concept of risk and
uncertainty and how they are related to project management. The review
showed that considerable research exists on the topic. Some of them related
to the objectives of this study are prioritized and summarized in this chapter.
In project context, Cooper et al (2005) defined risk as “the chance of something
happening that will have an impact upon a project objectives and it include a
possibility of loss or gain or variation from desired or planned outcome, as a
consequence of the uncertainty associated with deciding on a particular course of
action” This definition is similar to the ISO/IEC Guide 73 and AS/NZS4360 (2004)
definitions that risk in projects involves the perception of uncertainty and it is a
measure of the probability and consequence of not achieving a project goal. It can be
deduced from these definitions that the risk of a given event has two basic
dimensions. One dimension is the probability of occurrence for that event and the
other dimension is the impact of the event if it should occur. Hence, risk in this sense
is a function of the likelihood and the impact of an outcome. That is, Risk =
likelihood of uncertain event * Severity of the consequences (
). The higher the likelihood or impact of a given
event, the higher the risk associated with that event (see figure 2.3). This implied that
both impacts and likelihoods must be carefully analyzed in project risks management.
The cause of risk is another dimension of risk. A risky situation can be generated by
something, or the lack of something, this source of danger is known as hazard. We
T

7
can overcome some kinds of hazards to a good extent by knowing them and
identifying ways to overcome them. This second concept leads to a second
representation of risk as a function of hazard and safeguard-
. Risk increases with hazard but decreases with
safeguard. This second equation implies that project risk management needs to be
structured to effectively and efficiently identify hazards and to allow safeguards to be
develop to overcome them (Kerzner, 2001).
Dealing with risks in projects can generally be achieved by means of either qualitative
or quantitative approaches or by combining the two approaches depending on the
purpose of the analysis. Qualitative risk analysis involves prioritizing risks on the
basis of their probability and impact of occurrence (see figure 2.3). Quantitative risk
analysis or uncertainty analysis involves obtaining numerical estimates of the effects
of risk on project objectives. For instance, estimates of the uncertainty in project cost
and schedule estimations are derived when the estimates are generated and
represented as distributions. A better way to perform cost and schedule estimations is
therefore by using stochastic (Monte Carlo) simulation. This provides detail
information for decisions makers by evaluating the overall uncertainty in a project. In
stochastic simulation, uncertain inputs are represented using ranges of possible values
known as probability distributions. For example, inputs to a quantitative cost
estimation model will include probabilities representing uncertainties in the
occurrence of events, distributions of the model parameters, and the main correlations
and other relationships between parameters. Probability distributions are thus a much
more realistic way of describing uncertainty in a given estimation process (Cooper et
al, 2005).
Risk exists in all aspects of life and this makes risk management a universal activity,
although in most cases it is an unstructured activity, based on common sense, relevant
knowledge, experience, and instinct (Chapman and Ward, 2003). Project risk
management is considered as critical discipline by most organizations handling
projects. This is confirmed by the Project Management Institute’s project
management guide and the other guides that represent the best practices in project
management. Cooper et al (2005) pointed out that the main purpose of risk
management is to reduce the dangers of not meeting the defined project objectives

8
such as budget, schedule, and quality as well as to identify and take opportunities that
can enhance these objectives. Project risk management therefore help project
managers as well as staff to focus in the future where uncertainty exists and develop
action plans for responding project risks. It is therefore to must to consider risk
management at the early stages of the project planning and its management activities
and it ought to be continued throughout the project life cycle. Dealing with project
risk requires some form of structuring, leading to a number of related definitions of
the risk management process. For example, the AS/NZS4360 (2004) defines the risk
management process as “The systematic process to understand the nature of and to
deduce the level of risk, and the risk management process is the systematic
application of management policies, procedures, and practices to the tasks of
establishing the context, identifying, analyzing, evaluating, responding, monitoring,
reviewing and communicating risk”, on the other hand, Project Management Institute
(PMI, 2008) describes the risk management process to involve “risk management
planning, identification, analysis, response planning, and monitoring and control on
the project”.

9
Sub-processes in the Risk Management Process
1 2 3 4 5 6 7 Source
Risk
Identification
Risk Analysis Risk
Prioritization
Jurison (1999)
Risk
Identification
Risk Analysis Risk
Monitoring
Bandyopadhya
y et, al (1999)
Risk
Identification
Risk Analysis
Risk Planning
Risk
Monitoring
(Sommerville
2001)
Risk
Identification
Risk
Evaluation
Risk Control Risk
Monitoring
Beck et al.,
(2002)
Risk
Identification
Risk Analysis Risk Planning Risk
Tracking
Risk
Control
Cornford
(1998)
Review
define goals
Identify and
monitor
Analysis Plan risk
control
Control
Risk
Kontio (1996)
Identify Risk
Analyze
Risks
Prioritize
& map risk
Resolve
risks
Monitor
Risks
Smith & Merritt
(2002)
Goal
Definition
Review
Risk
Identification
Risk
Analysis
Risk
Planning
Risk
Tracking
Risk
Control
Bruckner et, al
(2001)
Risk
Identification
Risk
Analyze
Risk
Plan
Risk
Track
Risk
Control
Risk
Communication
Higuera and
Haimes (1996)
Risk
management
mandate
definition
Goal
Review
Risk
Identification
Analysis
Risk
Risk
control
planning
Risk control
Monitor
Risks
Boehm and
Bose (1994)
Table 2.1: Risk Management Processes. Alhawari et al (2011).
Besides these definitions, various definitions of the risk management process have
been used by different organizations. Table 2.1 summarizes some of the definitions.
These definitions point out that the key word in project risk management is
systematic, because the more disciplined or structured a risk management approach,
the more its ability to control and manage risks. On the other hand, uncertainty
management according to Chapman and Ward (2003) goes beyond the management
of perceived threats and opportunities, and their implications, it involves the
identification and management of all the several sources of uncertainty that give rise
to and shape the perception of threats and opportunities. It means exploring and
understanding the sources of project uncertainty before attempting to manage it. With
no predetermination about what is desirable and what is not. The central concerns are

10
to understand where and why uncertainty is relevant in a specific project context, and
where it is not.
2.2 Project Risk and Uncertainty Management Models and
Frameworks
The attempt to systematize and improve best practice in risk and uncertainty
management motivated global development of many but similar risk management
approaches. However, these existing models and frameworks do not usually integrate
both risk and uncertainty models together, the model developed in this study
attempted to integrate both.
Examples of risk management frameworks include:
PMBOK, Project Management Body of Knowledge, Project Management
Institute (PMI), USA (2008);
Association for Project Management, UK (1997), PRAM Guide;
AS/NZS 4360 (2004), Risk Management, Standards Association of Australia;
ISO 31000 (2009), Risk Management- Principles and Guidelines;
ISO 10006 (2003), Quality Management Systems-Guidelines for Quality
Management in projects;
IEC 62198 (2001), Project Risk Management—Application Guidelines;
Office of Government Commerce (OGC), UK (2002), Management of Risk;
and
Treasury Board of Canada (2001), Integrated Risk Management Framework.
Generally, these standards often outline the relevant areas of risk management. The
basic structures of these standards according to Kutsch and Hall (2009) are similar.
They offer very limited details on how to practically apply the risk management
process, hence, the need to develop a customized and operational project risk
management model for Elekta.
Although the PMBOK and AS/NZS 4360 have been consulted, the risk management
framework that was adopted in this study is the ISO 31000. The ISO 31000 has
therefore been review briefly in the following section.

11
2.3 ISO 31000
The International Organization for Standardization (ISO) is global federation of
national standard bodies and the ISO 31000 was written by the ISO technical
committee on risk management with the object of making risk management effective.
The ISO 31000 risk management process is outlined in figure 2.1 below. The standard
reveals that its proper implementation and maintenance can help an organization in
improvements such as:
“⎯ increase the likelihood of achieving objectives;
⎯ encourage proactive management;
⎯ be aware of the need to identify and respond risk throughout the organization;
⎯ improve the identification of opportunities and threats;
⎯ comply with relevant legal and regulatory requirements and international norms;
⎯ improve mandatory and voluntary reporting;
⎯ improve governance;
⎯ improve stakeholder confidence and trust;
⎯ establish a reliable basis for decision making and planning;
⎯ improve controls;
⎯ effectively allocate and use resources for risk response;
⎯ improve operational effectiveness and efficiency;
⎯ enhance health and safety performance, as well as environmental protection;
⎯ improve loss prevention and incident management;
⎯ minimize losses;
⎯ improve organizational learning; and
⎯ improve organizational resilience” (ISO 31000).

12
Figure 2.1 The Risk Management Process (ISO 31000, 2009).
These risk management processes are similar to those used by engineers to figure out
potential safety and reliability problems in design. For instance, industries such as the
automotive industry apply techniques like Fault Tree Analysis and Failure Mode and
Effect Analysis (FMEA) (McDermott, 1996). Similarly, hazard analysis may be
applied on new medical devices. Although these engineering techniques appear to be
applicable to project risk management yet they are basically different as they cannot
be applied until a design exists. Moreover, they are focused on finding errors in the
design often in the form of safety and reliability. These analyses tools were therefore
not suitable in this study. Project risk management rather focuses widely on the
business success of the whole project including engineering (design) related aspects
of the project and others that can hinder the project objectives.
The components of the ISO-31000 are described in following sections.
2.3.1 Communication and Consultation
This process focused on who should be involved in the specific risk management
process. Good communication and consultation with team members and other
stakeholder is crucial in the risk management process. The object of this process is to
get all involved parties informed to avoid horrible surprises which can have far
reaching consequences on future business deals. Thus, customers and owners can
understand and appreciate the risks and trade-offs in projects. Regular reporting is an

13
important form of communication where the risk register and the risk response plans
form the basis. Risk reports summarize the projects risks and their response statuses.
2.3.2 Establishing the Context
This process answers the question, what are we intend to achieve? And involves
setting up a structure to govern the risk management process. Thus, it is concern with:
establishing the project environment within which the risk assessment will occur,
specifying the objectives of the risk management, and identifying criteria for
measuring the consequences of identified risks.
2.3.3 Risk Assessment
The risk assessment process according to ISO 31000 comprises of the processes of
identifying risks, analyzing the identified risks and then evaluating them. Thus, the
goals of the risk assessment process are; to determine the consequence of each risk if
that risk should occur, to determine the likelihood of occurrence of the consequences,
and to transform the consequence and likelihood ratings into risk levels and risk
priorities. The three sub-processes that make up the risk assessment process are
described in the following sections.
Risk Identification
The risk identification process answers the question what might happen in a given
project? And it involves finding, recognizing and describing risks by using sources
such as historical data, theoretical analysis, expert opinions, stakeholders, and so on.
The objective of this process is to generate a comprehensive list of all the possible
risks and other information needed to start creating a risk register, which is the set of
all possible risks in a project. The standard recommends that an organization should
apply risk identification tools and techniques that suitable for it objectives.
Risk Analysis
What is the meaning of the risks that has been indentified in terms of the project
objectives? Risk analysis is the process of understanding the nature of the identified
risks and determining their levels of risk (risk estimation). That is, using available and
relevant information to determine in a structured manner how regularly specified
events may occur and the size of their consequences. This kind of analysis provides
inputs for risk evaluation and for making decisions about risk response such as if a
given risk needs to be responded or not and selecting the suitable response technique.

14
Risk analysis often involves considerations of the consequences of risk (both negative
and positive consequences) and the likelihood that those consequences can occur.
The likelihood and the consequence can then be combined to determine the risk level.
The degree of risk analysis can vary depending on the nature of the risk, the data
available and the purpose of the analysis. The analysis can qualitative, semi-
qualitative or quantitative, or a combination of these depending on the specific
situation. The model proposed in this study combined both qualitative and
quantitative analysis methods.
Figure 2.2: Probability - Impact Matrix.
Figure 2.3: Overall risk as a function of its components
(Kerzner, 2001).
Qualitative Risk Analysis – is built on the use of nominal or descriptive scales (e.g.
Low, Medium, High) to describe the probabilities and impacts of risks. This initial
assessment can then be extended to a semi-qualitative risk analysis by assigning
numerical values to the descriptive scales. For example, 1 = Low, 2 = Medium and 3
= High, or similar suitable scales. The numbers are then used to calculate risk scores
or factors. Thus, qualitative risk analysis involves assessing the impacts and
likelihoods of the identified risk in order to determine their magnitude and priority.
Qualitative analysis tools and techniques include: Probability/Impact Matrices, expert
judgment, tracking of the top ten risk items, etc. A probability/impact matrix is a list
of the relative probability of a risk occurring on one side and the relative impact of the
risk occurring on the other side (as shown in figures 2.2 and 2.3). The risks are then
grouped according to their risk value as low, medium or high risks. Consequently,
analysis with qualitative methods is done without rigorous numerical calculations but
rather rough estimates are made about the likelihood of occurrence. This means that

15
the value of risk cannot be satisfactorily calculated with qualitative methods.
However, it may be the most suitable way to do the analysis at hand.
Uncertainty or Quantitative Risk Analysis - Unlike the qualitative risk analysis
described in the previous section, quantitative or uncertainty analysis apply numerical
ratio scales rather than descriptive scales to estimate likelihoods and consequences.
Analysis with quantitative methods is done with rigorous numerical calculations to
obtain more accurate estimates of the likelihood of occurrence. This means that the
value of risk can be satisfactorily calculated with quantitative methods. Quantitative
analysis however has higher data requirements than qualitative analysis. The most
popular uncertainty analysis (risk quantification) techniques are decision tree analysis
and Monte Carlo (or stochastic) simulation.
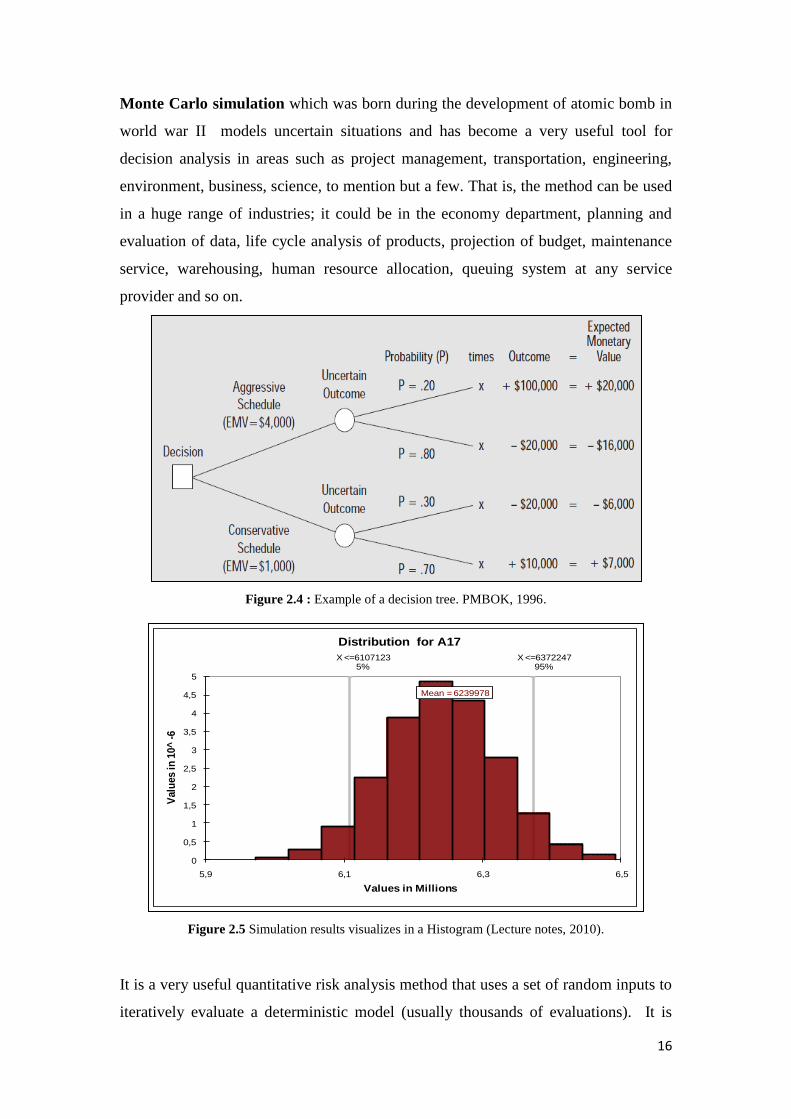
Decision tree analysis involves the use of a tree-like structure drawn from left to
right and branches out like a tree lying on it sides, to develop and document project
managers understanding of the problem and to ease project team collaboration and
communication. Thus, a decision tree is a diagram representation of expected value
(EV) calculations and it is made up of three components (decision, chance and
terminal or end nodes) connected by branches. Figure 2.4 illustrates a decision tree
analysis. The expected Monetary Value (EMV) of result is given by the product of an
outcome and the probability of the outcome. The Expected Monetary Value of a
decision is the sum of all outcome generated by that decision. Hence, in this example,
the aggressive schedule has expected the value of monetary $4,000 and is preferred
over conservative schedule with the value of monetary $1,000.
Decision trees are suitable for analyzing sequential risks compounding over time and
also for daily problems in which one desires to pick up the best alternative quickly
and proceed, but not for multiple risks occurring simultaneously and this is one of the
key strengths of the Monte Carlo Simulation. Shuyler (1950) confirms that the
decision tree method also becomes difficult to use for solving certain kind of
problems as it makes calculations impractical when there is combinatorial expulsion
of branches, however, Monte Carlo technique easily handles many possible outcomes.
16
Monte Carlo simulation which was born during the development of atomic bomb in
world war II models uncertain situations and has become a very useful tool for
decision analysis in areas such as project management, transportation, engineering,
environment, business, science, to mention but a few. That is, the method can be used
in a huge range of industries; it could be in the economy department, planning and
evaluation of data, life cycle analysis of products, projection of budget, maintenance
service, warehousing, human resource allocation, queuing system at any service
provider and so on.
Figure 2.4 : Example of a decision tree. PMBOK, 1996.
Figure 2.5 Simulation results visualizes in a Histogram (Lecture notes, 2010).
It is a very useful quantitative risk analysis method that uses a set of random inputs to
iteratively evaluate a deterministic model (usually thousands of evaluations). It is
Mean = 6239978
X <=61071235%
X <=637224795%
0
0,5
1
1,5
2
2,5
3
3,5
4
4,5
5
5,9 6,1 6,3 6,5
Valu
es in
10^
-6
Values in Millions
Distribution for A17
17
thus, an improvement of the traditional single-valued deterministic model where we
solve equations with probability distributions instead of just single values; therefore
making Monte Carlo not just a calculation but the testing a situation several times
with randomly generated inputs. Central to the application of Monte Carlo Simulation
is the ability to select input distributions that closely fits the data or that represent the
present state of knowledge. The outcome data from the simulation are usually
visualized in graphs such as histograms (see figure 2.5), cumulative distribution, bars,
confidence intervals etc.
How does Monte Carlo simulation works? Monte Carlo simulation is a highly
iterative process. That is, it analyzes an uncertain situation by developing models of
possible outcomes from a range of input values (a probability distribution). Figures
2.6 and 2.7 summarized the Monte Carlo simulation process. The following are the
sequence of the typical four stages in a Monte Carlo simulation as outlined by
(Schuyler, 1950; Sheel, 1995):
i. Build a mathematical model: the first step is to express the analysis situation
into a mathematical model (equation). That is, first define the problem and
determine all the input and output variables and determine the exact
relationship among the variable. For example, to do a simple profit analysis,
we can develop the simple model ‘profit = selling price – cost price’. Where
profit is the output variable and selling/cost prices are the input variables.
ii. Identify the uncertain (stochastic) input variables in the mathematical
expression developed in step (i). Uncertainty is modeled by specifying likely
probability distributions to represent the uncertain input variables. In this step,
a good knowledge of the characteristics of standard probability distributions
such as normal, binomial, poison, weibull, exponential, triangular, uniform,
beta, cumulative, pert, negative binomial distributions and so on can help us to
select input distributions that best fit the random or uncertain variables we are
dealing with.
iii. Simulate the stochastic model iteratively until the number of trials is enough to
produce the expected level of precision (thousands of different combinations
of the input variables) and obtain the possible outcome values and their
probability distributions. That is, from the input distributions, we then

18
substitute the trial values of the stochastic variables into the deterministic
model and run the model several times (> 1000).
iv. The last step involves analyzing the results and making decisions. The
simulation results and the outcome probabilities can then be used to decide
wisely on a desired course of action.
This Monte Carlo simulation process has been automated by several computer
programs in the market including; @risk, Chrystal ball, Excel solver, XLSim,
Abalone, BOSS, CompHEP, GEANT, MOCADI, Monte Carlo N-Particle Transport
Code, Monte Carlo Universal, OpenBUGS, PYTHIA, WinBUGS.
Figure 2.6 : Summary of the Quantitative Risk Analysis
Approach (Cooper et al, 2005).
Figure 2.7: Quantitative Risk Analysis in Spreadsheet
(Cooper et al, 2005).
2.3.4 Risk Evaluation
Risk evaluation is part of the risk assessment process that aimed at finding what the
most important risks are. It is concerned with comparing the risks from the analysis
results to determine their significant and to prioritize them for response.
2.3.5 Risk Response
What can be done about the risks we have assessed? Risk response consequently
involves the selection and implementation of one or more options to modify the risks.
Risk response thus involves: Finding options to change the likelihood or impacts of
risks, assesses the cost and benefits of the selected response options and select the
best for the project at hand and then, develop and implement risk response or action
plan. Summaries of risk action plans are usually provided for high risks. Some of the
most frequently used risk response options include:
i. Risk avoidance – avoids the risks by not starting or not continuing with the
activity that can give rise to the risk.

19
ii. Risk transfer
iii. Explore the risk – involves taking the risk or increasing it so as to pursue the
opportunity.
iv. Eliminating the risk source
v. Mitigating - Changing the likelihood or consequences of the risk occurring
vi. Risk sharing – involves sharing the risk with party or parties – including
contracts and risk financing
vii. Accepting the risk
2.3.6 Monitoring and Review
How do we keep the risks under control? The purpose of this process is to
consistently monitor and review the risk as the risk management plan is implemented.
It facilitates the detection and management of risks. Developing risk watch list (the
list of major risks in a project).

20
CHAPTER 3
3 RESEARCH METHODS
his chapter presents how the study was designed and conducted using a
combination of research methods. Thus, it was to help achieve the research
objectives and ultimately the research aim, the following research strategy,
data collections techniques, framework for data analysis, Validity and reliability
criteria were employed. Figure 3.1 below summarizes the study approach.
Figure 3.1 The research approach.
3.1 Literature Review
Literature review was used as the data collection method to gather information on
risk/uncertainty management in general. The information obtained from this review
was then used as an input to establish the model’s conceptual framework. The results
of the literature review are presented in chapter 2. To reduce the potential of ideas
presented in no clear order, we focused the literature review on areas relevant to our
study objectives. Thus, the study made use of several sources of literature such as
relevant books, reports, journals of project management, as well as risk management
standards and guides including PMBOK, UK PRAM Guide, AS/NZS 4360 guide,
T

21
ISO 31000, IEC 62198, and Treasury Board of Canada’s Integrated Risk Management
Framework. Documented project risk management resources in the study area were
also reviewed.
3.2 Research Strategy
Case study research strategy was the research strategy adopted in the study since its
focus was a specific individual unit of an organization which has its specific
challenges and unique working environment. Case study is a well accepted inductive
research strategy well rooted in observation of empirical data for the study particular
characteristics in particular setups. Thus, a case study usually explores present and
past issues that affect one or more units such as organization, group, department or
person (Adams et al, 2007). This definition coincides with Cohen and Manion’s
(1995) description of a case study research as a study that observes the characteristics
of an individual unit such as a child, a class, a school, an organization, a community
and so on, and the purpose of such observation is to investigate and analyze the unit
of observation. It is particularly used for investigating organizations and for
identifying best practice as intended in this study. Case study was therefore the
appropriate strategy for this study because the study focuses on observing, analyzing,
building a model and making suggestions for improving project risk management in
Elekta, which is an individual unit of analysis.
3.3 Data collection
Secondary and primary data which were both qualitative and quantitative in nature
were used in this study. The secondary data refers to the existing reports, templates,
project schedules and similar documents available in Elekta as well as the other
literature sources. The primary data refers to the interviews that were administered to
help explore and understand risk and uncertainty management in Elekta base on the
experience of the employees. One-to-one interviews were selected for the
investigation on the basis of two reasons. First, access to all concerned project
managers who have some experience in managing projects in Elekta and can share
their experiences and feelings about project risk management. Second, this mode of
research is cost effective as all employees that we are going to interview can be found
in one office location. No extra travelling or phone calls or such things were required,
22
thus making it data collection cost effective. The need for primary data collection was
also relevant because no such previous data had been collected to describe or analyze
project risk and uncertainty management in Elekta.
Thus, cross sectional data were collected on how projects risks are currently managed
in Elekta so as to understand and suggest improvement without re-inventing the
wheel. The target population was all project managers in PMO Elekta-Stockholm.
All these project managers were available at work during the data collection period,
thus making the sampling strategy information based sampling (focused on project
managers) instead of random based since the entire population was reachable. This
made it easier to make a valid generalization of the responses within study unit. The
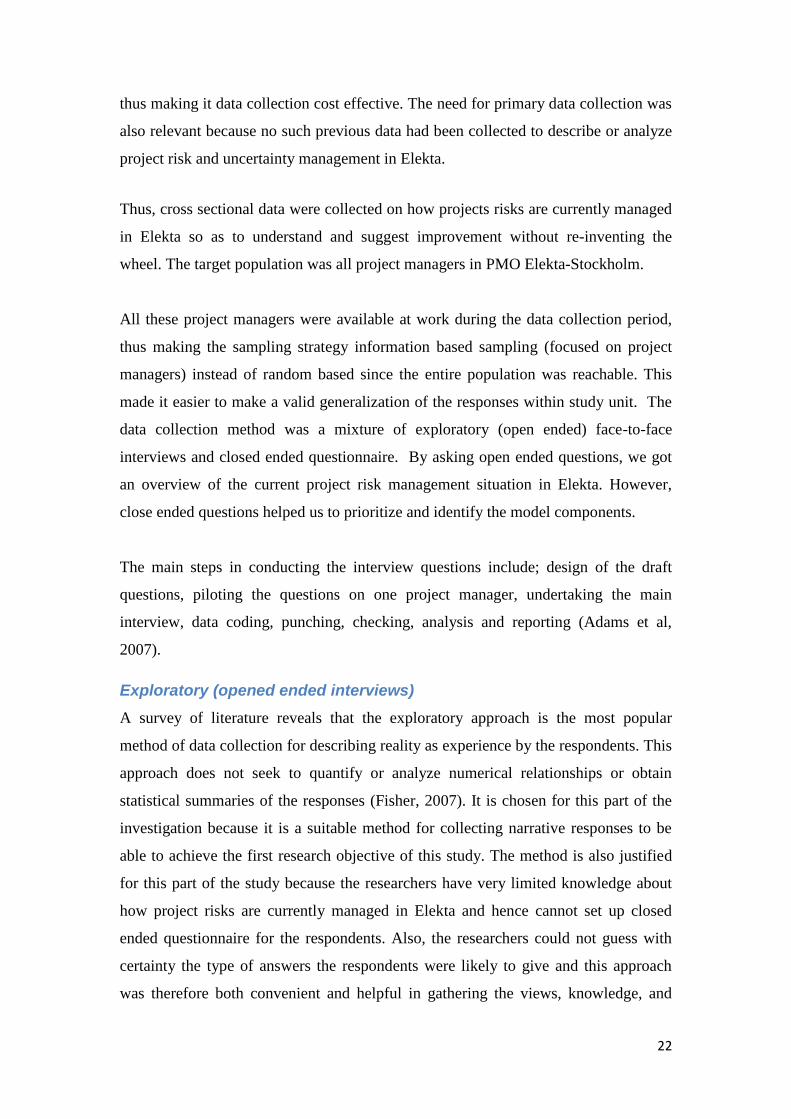
data collection method was a mixture of exploratory (open ended) face-to-face
interviews and closed ended questionnaire. By asking open ended questions, we got
an overview of the current project risk management situation in Elekta. However,
close ended questions helped us to prioritize and identify the model components.
The main steps in conducting the interview questions include; design of the draft
questions, piloting the questions on one project manager, undertaking the main
interview, data coding, punching, checking, analysis and reporting (Adams et al,
2007).
Exploratory (opened ended interviews)
A survey of literature reveals that the exploratory approach is the most popular
method of data collection for describing reality as experience by the respondents. This
approach does not seek to quantify or analyze numerical relationships or obtain
statistical summaries of the responses (Fisher, 2007). It is chosen for this part of the
investigation because it is a suitable method for collecting narrative responses to be
able to achieve the first research objective of this study. The method is also justified
for this part of the study because the researchers have very limited knowledge about
how project risks are currently managed in Elekta and hence cannot set up closed
ended questionnaire for the respondents. Also, the researchers could not guess with
certainty the type of answers the respondents were likely to give and this approach
was therefore both convenient and helpful in gathering the views, knowledge, and

23
experiences of the individual respondents on the existing risk management process in
good detail with minimized biases that could result from suggesting responses to the
respondents. Face-to-face interviews were employed since the target population could
be reached in persons at Elekta’s office.
Collecting data through interviews can be achieved in three ways - unstructured,
semi-structured or structure manner. In structured interviews, the interviewer read out
a pre-set and similar set of questions in a manner that avoids influencing the outcome
of the results. The interviewer prepares a set of questions in advance in the case of
semi-structured interviews, but the flow of the conversation dictates which question
will be chosen next. Unstructured interviews however involve casual conversations
between the interviewer and the interviewee with the purpose of fully exploring a
single topic. In this study, the structured interview format was selected since the ISO
risk management framework which is already structured in nature as used as a
standard for evaluation.
Closed ended questions
The closed ended questionnaire was relevant to identifying and prioritizing the
components of the model. This method was appropriate for achieving the third
research objective (specifying the model contents). Thus, the closed ended questions
were instrumental for comparing the views of the respondents by obtaining statistical
summaries for their responses on each variable
The Likert scale was used in assessing the value of the model variables with regards
to Elekta’s projects. This technique was quick and easy for collecting data and had the
advantage of showing the strength of both individual and collective expert responses
on what the components of the model should be. It also made it easy to analyze the
results.
3.4 Framework for data analysis
The questions for the opened ended questions focused on how the generic risk
management processes or themes including; identifying risks, analyzing risks,
evaluating risks, responding risks, communicating risks, as well as monitoring and
reviewing risks, were implemented in Elekta compared with those processes outlined

24
in ISO 31000, which served as the framework for evaluating Elekta’s project risk
management procedures as revealed by the interviews. The information obtained from
each question or theme was then used to asses and suggests improvement to the
particular risk management process that question focused on.
The numerical and subjective data gathered by using closed ended questions will be
described by using statistical summaries that will help in understanding the data.
3.5 Reliability and Validity of the Study
Validity is the extent to which a claim or conclusion is based on sound logic. A valid
research according to Biggam (2008) is therefore a research that is acceptable by the
research community (academics and practitioners who undertake research) and that
validity is judged by the suitability of the selected research strategy, data collection
and analysis techniques. Validity in this study was thus ensured by selecting tested
and accepted: research strategy, data collection, and analysis techniques that were
appropriate for the study.

25
CHAPTER 4
4 ANALYSIS OF PRESENT
SITUATION
o understand the risk management process in Elekta as input for building the
model, the ISO 31000 hypothesis of a standard risk management system
was used to evaluate the risk management process in Elekta. The sections
below summarize the characteristics of each of the main risk management processes
as applied in Elekta.
In all, nine (9) interviewees were contacted to take part in the structured in the
interview and the response rate was 100% (i.e. the number of responses suitable for
analysis divided by the number of respondents approached). The interview questions
are shown in appendix A. No female was interviewed since all members of the target
population were males. Table 4.1 below summarizes some demographic information
of the focus group.
Gender Experience (years)
Job Title
Male Female < =3 > =5 PM PM/Consultant PM/Product Mananeger
9 0 2 7 7 1 1
Table 4.1: Interview Respondents.
4.1 The Risk Identification Process
We found that appropriate approaches have been adopted identifying project risks.
The results presented in Figure 4.2 confirmed that most of the project managers
brainstorming session at the early stage of project, and the risk register is the next
T

26
most used tool in the risk identification process. Also, the project managers used
different techniques at different degrees. For example majority said that the project
team figure out the project risks which are further documented. Few of them conduct
a silence brainstorming session where everybody think and write at least 5 risks which
are further discussed in meeting with smaller project group.
Figure 4.2: Present usage of tool/techniques for Risk Identification.
Lesson learnt from previous projects is not always the part of risk identification
process. Some mangers told that they take expert opinions (managers who have done
similar projects) but not always.
Figure 4.2 shows the usage of tool/techniques being used for risk identification.
Numerical values shows frequency of usage. 1 shows never, 2 shows rarely, 3 shows
sometimes, 4 shows very often and 5 shows always. The same scale is used for rest of
graphs of other processes. It is clear from the Figure 4.2 that brainstorming is used
from very often to always, as a tool for risk identification. Documentation of these
risks is usually done very often. Interviewing, SWOT analysis, expert judgment,
Figure 4.1: Key for subsequent graphs

27
standard templates, risk categorization, checklist analysis, documentation reviews and
root cause analysis are done rarely to sometimes. Delphi techniques and diagramming
techniques are also used from never to rarely.
4.2 The Risk Analysis Process
This is the area where approximately all of managers are doing the same. The values
of probability and consequences are assigned in an old traditional way. One of two
scales either 1-5 or 1-3 are selected. Based on individual perception, values for
probability and consequence of each risk are given by all project team members. After
that there is a voting process which is used to reach on a consensus about these
values.
Figure 4.3: Present usage of tool/techniques for Risk Analysis.
Summary of the responses from all of 9 interviewees regarding risk analysis is shown
in Figure 4.3. It tells that risk analysis is done always through voting. Use of expert
judgment and probability and impact matrix is made sometimes. Risk urgency
assessment, probability and impact matrix and risk categorization are used rarely to
sometimes during risk analysis.
There are serious issues associated by analyzing this way. There is no unique scale
being followed. So it is very hard to visualize risks at portfolio level.
28
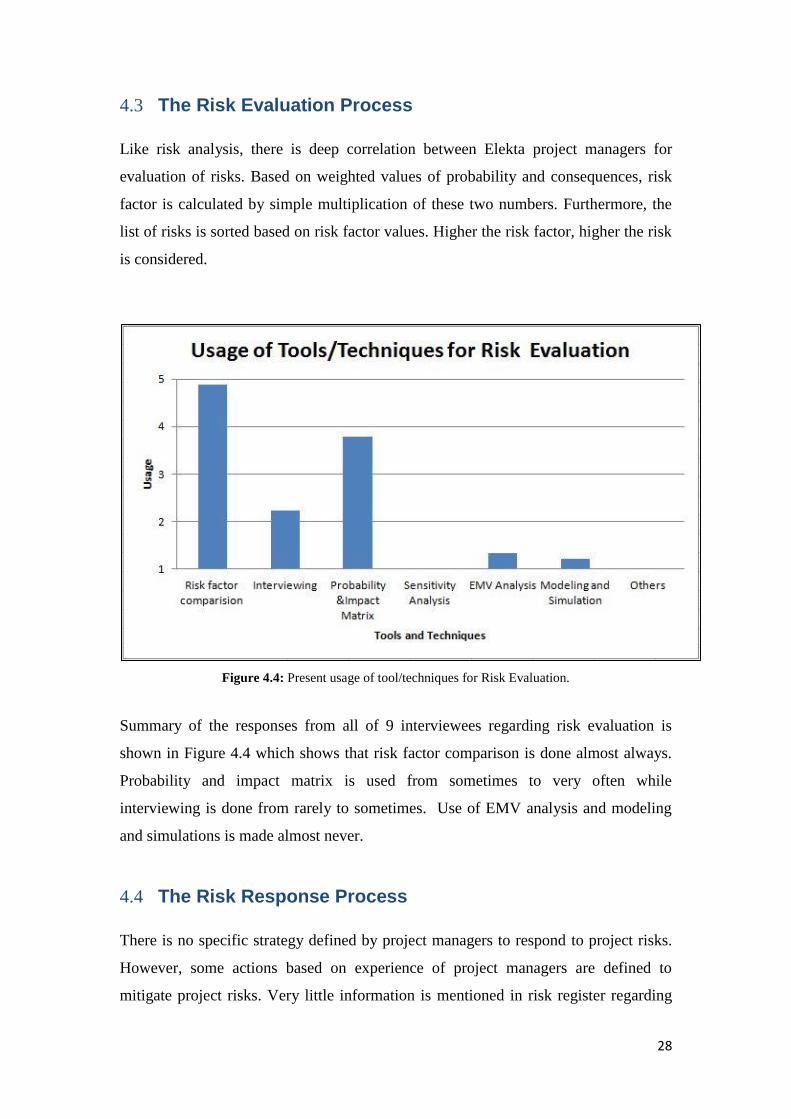
4.3 The Risk Evaluation Process
Like risk analysis, there is deep correlation between Elekta project managers for
evaluation of risks. Based on weighted values of probability and consequences, risk
factor is calculated by simple multiplication of these two numbers. Furthermore, the
list of risks is sorted based on risk factor values. Higher the risk factor, higher the risk
is considered.
Figure 4.4: Present usage of tool/techniques for Risk Evaluation.
Summary of the responses from all of 9 interviewees regarding risk evaluation is
shown in Figure 4.4 which shows that risk factor comparison is done almost always.
Probability and impact matrix is used from sometimes to very often while
interviewing is done from rarely to sometimes. Use of EMV analysis and modeling
and simulations is made almost never.
4.4 The Risk Response Process
There is no specific strategy defined by project managers to respond to project risks.
However, some actions based on experience of project managers are defined to
mitigate project risks. Very little information is mentioned in risk register regarding

29
risk response. Reason for selecting particular response is also not part of risk response
plan.
4.5 Communication and Consultation
Although risks are reported periodically to the steering group, the communication of
risk is basically limited to project teams. Consequently, other stakeholders are left out
and the implication of this is that customers and owners are not given the opportunity
to understand and appreciate the risks and trade-offs in projects. Figure 4.5 below
summarizes the techniques and tools used in the communication process. Regular
project meetings is the commonly use technique, followed by reporting using specific
templates.
Figure 4.5: Usage of tools/techniques for Communication and Consultation.
In summary, the investigation of the project risk management process revealed that
the process is done to some extent with varying techniques and tools, however, it has
not so systematic since project managers use different approaches and techniques to a
large extend.
4.6 The Monitoring and Control Process
Most of the managers admitted that there is poor follow-up for project risks. There is
no defined system which test health of current uncertainty management process.
However, serious project risks are followed up during regular project meetings.
1
2
3
4
5
Usage of Tools/Techniques for Risk Cummunication

30
Summary of the responses from all of 9 interviewees regarding monitoring and
control is shown in Figure 4.5. It shows that project risk reviews are done from
sometimes to very often whereas project risk response audits, technical performance
measurements and additional risk response planning are done rarely.
Figure 4.6: Present usage of tool/techniques for monitoring and review.
This is the area which needs the most concentration. Project managers make a good
start when identifying project risks but most of the time there is lack of good follow-
up. Our analysis suggests that there is an urgent need of defining a process which not
only ensures sound follow-up of identified project risks, but also examine the health
of whole system dealing with project uncertainties.
The investigation revealed that project risk management is done to some extent;
however, it is not well organized and systematic. Most of things are done based on
past experience and no particular model/standard is being followed.

31

32
CHAPTER 5
5 RESULTS AND DISCUSSION
5.1 Conceptual framework of the Model
he main outcome of this study is the proposed Integrated Risk and
Uncertainty Management Model. This chapter presents and discusses its
components, its functionality as well as the results from piloting the model
on an ongoing project. Figure 5.1 below illustrates the components and conceptual
framework of the model and described in more detail in the following sections.
Figure 5.1: The Integrated Risk and Uncertainty Management Model.
T

33
The model is made of three major phases which are then further broken down into
sub-processes.
Phase 1 - Establish the context: That is what we intend to achieve? It involves
reviewing the project objectives and specifying the objectives of the risk management.
The outcome of this process is to decide on whether quantitative (uncertainty
analysis) or qualitative process should be followed.
Phase 2 - Qualitative analysis: This process is made up of the following sub-
processes. The role and responsibilities during the execution of each sub-process are
specified in the model.
(Note: The risks register needs to be updated after every step)
Asses risks in the project:
This sub-process is made of three steps as shown in figure 5.1 above: Identify,
Analyze and Evaluate the Risks.
Step 1: Identify and categorize and record all possible risks in a given project.
The most important management question in this step is what might happen that can
affect the project objectives. The purpose is to determine the risks that are likely to
affect the project objectives and to document their characteristics. The outcome of the
risk identification step is a comprehensive list of all known risks and this will form
the basis for the risk register. The need to identify and manage new risks that may
come up as the project is being run.
To identify the risks in a project, the following techniques can be applied:
1. Review Risk Database and Lessons Learnt: Use past experience and
knowledge effectively. Review historical record about risks available in the
risk database and lessons learnt documentations from previous similar projects
to an idea about possible project risks and note them down.
2. Brainstorm: this involves identifying and listing all candidate project risks in a
group workshop lead by a facilitator without assessing the importance of these
risks in the initial stages of the brainstorming session.
3. Would bring better visualization of challenges that might come during the
project.
4. Use interviews: involves asking people with similar project experience,
stakeholders, experts, and anybody within your reach who has an idea about

34
risk in the specific project field by using face-to-face, phone, e-mail, or instant
messaging interactions.
5. Give risk ID numbers, categorize, and record all the identified risks into the
risk register. Suggested risk ID numbers could be R1, R2, R3,… etc. We
suggest that the risks are categorized or classified both by their nature and by
their value. Clustering risk by nature such as technical, software, hardware,
human resource, financial, schedule, safety, environmental, performance,
legal, business, etc can be helpful in identifying risk owners, whether as
individuals or as units due their skills and competences and to then to facilitate
the location of additional contingency resources. The risks also need to be
clustered on the basis of their value their impacts on project objectives (Low,
Medium, High or similar valuations), the risk analysis and evaluation steps
below provide the means to do clustering of risks by value. The object of
clustering risks by their value is to help prioritize risks in order to make
decisions about them.
Step 2: Perform qualitative and Semi - qualitative Risks Analysis.
The task here is to determine the likelihoods and consequences of all the risks
identified in a specific project by using historical data, expert judgments etc. to
carefully analyze how many times a specific risk has occurred and what are its
impacts. Estimate their risk factors (values) and then use these risk values to evaluate
each risk. Hence, the qualitative risk analysis and risk evaluation steps are done
together as one step. Two approaches are provided for executing this combines step
depending on the level of detail required. In both approaches, the likelihood, the
impact and the risk factor scales ranges from 1 to 5 as opposed to 1 to 3 or 1 to 10
scales. This is because the 1 to 3 is too aggregate and does not give sufficient detail
for the ratings and the 1 to 10 scale is also too detail for our purpose. However, to
avoid confusion, we give the following interpretations for the scales:
Likelihood or probability rating:
5 = Almost certain (i.e. Very High, May occur once per project)
4 = Highly likely (i.e. High, Likely to arise at least in every 5 projects)
3 = Likely (i.e. Moderate, May arise at least in every 10 projects)
2 = Unlikely (i.e. Low, May arise at least in every 15 projects)
1 = Rare (i.e. Very Low, May arise at least in every 20 projects)

35
Impact or consequence rating:
5= Extreme (i.e. Project cost estimates increased by more than 15%, Project Times
increase by more than 30 days (1 month),
4 = Serious
3= Moderate
2= Minor
1= Negligible
Risk Factor rating
5=Very High
4=High
3=Medium
2=Low
1=Very Low
The first approach is the most popular approach for doing qualitative analysis. Thus, a
probability impact matrix is built for assessing the likelihood, consequence and risk
factor/score value a given risk can have on a project objectives (see figure 2.2).
As opposed to the macro level analysis and evaluation of risks in the first approach,
the second approach assumes that the likelihood that a particular risk may occur is
constant on all the project objectives but the impact of the risk if it should is not
equally distributed across all the project objectives. Thus, the impact may vary over
the objectives; some objects may have worst affect while other may not be affected at
all. To incorporate this assumption into the model, the risk formula is modified by
introducing a third variable, which is the importance of a given project objective as
perceived by the project stakeholders.
Hence, the relationship: Risk (probability, Impact) = probability * Impact becomes
Risk (Probability, Impact Project, Objective) = P * Ii * Wi …………………….. (5.1)
Where Wi = the weight of the ith
objective, Ii = the impact of the risk on the ith
objective, and P = the probability of the risk occurring (which is the same for a
specific risk for all the objectives). Since it will be more demanding to perform the
micro level analysis for all identified risks, the top ten risks can be selected for the
micro level analysis and the others can be analyzed at the macro level.

36
The outcome of each of the two qualitative risk analysis and evaluation is the risk
value (risk factor) for each identified risk, thus, risk value rates on the scale of 1-5 are
obtained and this allow us to prioritize risk by comparing their value on the very low,
low, medium, high and very high scale base on their likelihoods and impacts on the
project. These results are recorded into the risk register.
Step 4: Respond to risk.
Risk response is planned in order to change either the probability of a given risk
occurring or to change its impact if should occur to accept the risk and create a
contingency resources for it. Inputs to this process include the prioritized list of risks
based on their value, current project plans, budgets and the respond strategy (The set
of risk response strategies are described in section 2.2.4). Perform a cost-benefit
analysis to select the most suitable strategy from the list of available options to
respond to each listed or prioritized risk. The output is a document giving clear road
map and responsibilities so as to protect project objectives from identified risks. The
response process could be started by discovering if the problem is new or not? This
would help to avoid reinventing the wheel. Make detailed risk response plan for risks
with higher risk factors i.e. risks with higher probabilities and higher impacts. Risks
having higher likelihoods but moderate impacts should be handled with improved
management procedures to reduce likelihood. Risk having low likelihood but
potentially higher impacts should be either dealt with making effective contingency
plan or transferring the risk to other party. Risks having less likelihood and small
impacts could be handled by improving routine procedures at ad-hoc basis. Before
implementing selected risk response strategies, peer review by experts is required.
This review would ensure that response to each risk is adequate. Allocate the
necessary contingency resources and assign responsibilities, making sure that every
risk has a risk owner. Allocate all necessary resources assigned in risk response plan.
Step 5: Create a risk register.
The risk register is a detailed set of all the project risks and their characteristics such
as name, ID, likelihood, impact, risk value or factor, risk category, status, dates, cost
of risk, response strategy, and other properties. The risk register is created at the
beginning of the risk management process and updated consistently throughout the
process. The risk register in the model is implement in spread sheet, thus, making it

37
easy to update, view risks and their attributes, sort or rank risks on the basis of their
score (risk value), view issues or lessons learnt, sort risks by their ID, or similar
criteria.
Step 6: Risk database
This aims at saving risk history for future use and to bring together risks for projects
of the same portfolio so as to ease portfolio risk/uncertainty analysis. The risk register
suggested in the model is supposed to contain comprehensive information about all
the risks and how they were managed during the project and therefore has to be
entered into risk database with project name and under appropriate portfolio.
Comments on issues and lessons learnt from a specific project need to also be added
in the risk register.
Step 6: Visualizing risk at Project Level
The risk values (factors) for each risk can be extracted from the risk register and put
together to estimate the risk value of the entire project. This process is automated in
spreadsheet and described below.
To assign risk value to a project as a whole, one may be tempted to compute the
average of all the risk factors for all the identified risks in the project ( in some cases
the lower risks may be omitted) and then assign this average value to the project as a
whole. However, the degree of influence each risk factor has on the project will not
captured by this simple approach. Thus, high risk items have more weight on the on
the overall project risk and therefore should be given more weight in the estimation.
The overall risk formula suggested by Royer (2000) has the ability to account for this
imbalance and was therefore adopted in our model to estimate the risk for the whole
project.
√∑
(5.2)
Where RFi = the ith
risk factor for risk i and n = the number of the risk factors.
Also, another measure of aggregate project risk can be obtained by determining the
number of risk factors for each risk factor level as a percentage of the total number of
risk factors in the project. For instance, consider a 5 point risk factor rating scale
(where 1 = very low, 2 = Low, 3= Medium, 4= High and 5= very High). In a situation
38
where 5 risks are identified in a project and 3 of these risks have risk factors of high, 1
of the risks has a risk factor rating of Medium and the other has a risk factor rating of
very High Then we can say that 60% of the risks in the project high in both their
likelihood and impact, 20% of the risks are medium in both their impact and
likelihood and another 20% are very high in their impact and probability. This
potentially indicates a very risky project.
As the project proceeds, the risk factors (RFs) may change over time and therefore
monitoring the changes in the individual risk factors and recalculating the overall
project risk factor with the above formula, we can see if the project is going into
danger and demand some immediate attention to avoid failure. Thus, increasing
aggregate project risk factor would be an indication that the project is in the yellow
light and could get into red light if measures are not taken. However, a decreasing
aggregate project risk factor is an indication of green light.
Step 7: Visualizing risk at Portfolio Level
With the same aggregate risk formula or percentage measure approach described in
step 6, we can aggregate project risk factors to obtain the aggregate portfolio risk
factor in order to visualize risk at the portfolio level. The procedure and logic is the
same as in step 6.
Step 8: Communicate and Consult
This process is to ensure that all involved parties are informed to avoid horrible
surprises which can have far reaching consequences on future business deals. Thus,
customers and owners can understand and appreciate the risks and trade-offs in
projects. Regular reporting is an important form of communication where the risk
register and the risk response plans form the basis. Risk reports summarize the
projects risks and their response statuses.
Step: 9 Monitor and Review
The interviews indicated that this is one of the most poorly performed processes in
Elekta and therefore deserves some attention. It has components
- The day-to-day management of the risks, that knowing when in the project
calendar a specific risk (s) is likely to occur, carrying out the response plan, as
39
well as knowing and tracking the risk status. The register suggested in the
model made provisions for the day-to-day monitoring and control of the risks.
- The other part is monitoring and reviewing the effectiveness of the entire risk
management process. Check list is suggested in the model for this process.
Phase 3 – Uncertainty or Quantitative analysis
The third and last phase of the model is uncertainty analysis and focuses on schedule
risk and cost risk analysis which are described in the following sections. The detail
principles and justification for this kind of uncertainty analysis are provided in the
literature review in chapter (2). Thus, in the third phase, the model suggested Monte
Carlo simulation for addressing uncertainties in project schedule and cost estimates. It
is four step model which provides a level of certainty that helps decision makers to
visualize impact of certain change on over-all project duration or cost. Palisade @risk
is good software that implements Monte Carlo simulation using Microsoft excel as a
modeling environment. We have chosen some activities from one of Elekta’s project
and gave dummy values. These activities are simulated for cost and schedule
estimates.
Considering Elekta’s requirements, this stochastic simulation can be applied for:
1. Estimations of project cost and schedule during project planning
2. Monitoring and controlling project schedule and budget
3. Performing scenario analysis – I.e. scenario analysis can be done to determine
the different combinations of inputs which results in certain output values. For
instance, how will low and high combinations of the input variables: operating
cost, sales prices, and sales volume affect the output variable: profit. The
combination, low operating cost, high sales prices and high sales volumes will
results in high profit.
4. Performing sensitivity analysis – in @ Risk, the input distributions are ranked
on the basis of their impact on the output variable, this enables us to perform
sensitivity analysis that shows the sensitivity of each output variable to its
input variable.

40
5.2 Piloting the Model
To demonstrate the usefulness of the model, it has been applied in two different cases.
For sake of confidentiality, original name of activities have been replaced by activity
1, activity 2…etc. Case 1 illustrates how the model can be applied for schedule
uncertainty analysis and Case 2 showed how the model can be used to perform cost
uncertainty analysis.
Case 1: Schedule Analysis
For each activity in a phase, @risk Pert function is inserted and maximum,
minimum and most likely values for corresponding activity are assigned.
At the end of each phase, the result is made by using SUM function to add
duration of each activity.
From menu option, add output is selected for result cell.
From menu option, simulation setting is selected and number of iterations was
set to 5000 (increasing this number increase scenarios to be considered).
From menu option, run the simulation.
Result would be a histogram distribution which would help determining
certainty level for a phase to be completed in X number of days and vice
versa.
To estimate whole duration of the project, find out critical path activities and
simulate them in separate section in same way.

41
Figure 5.2: Snapshot of simulation model in @risk for schedule analysis.
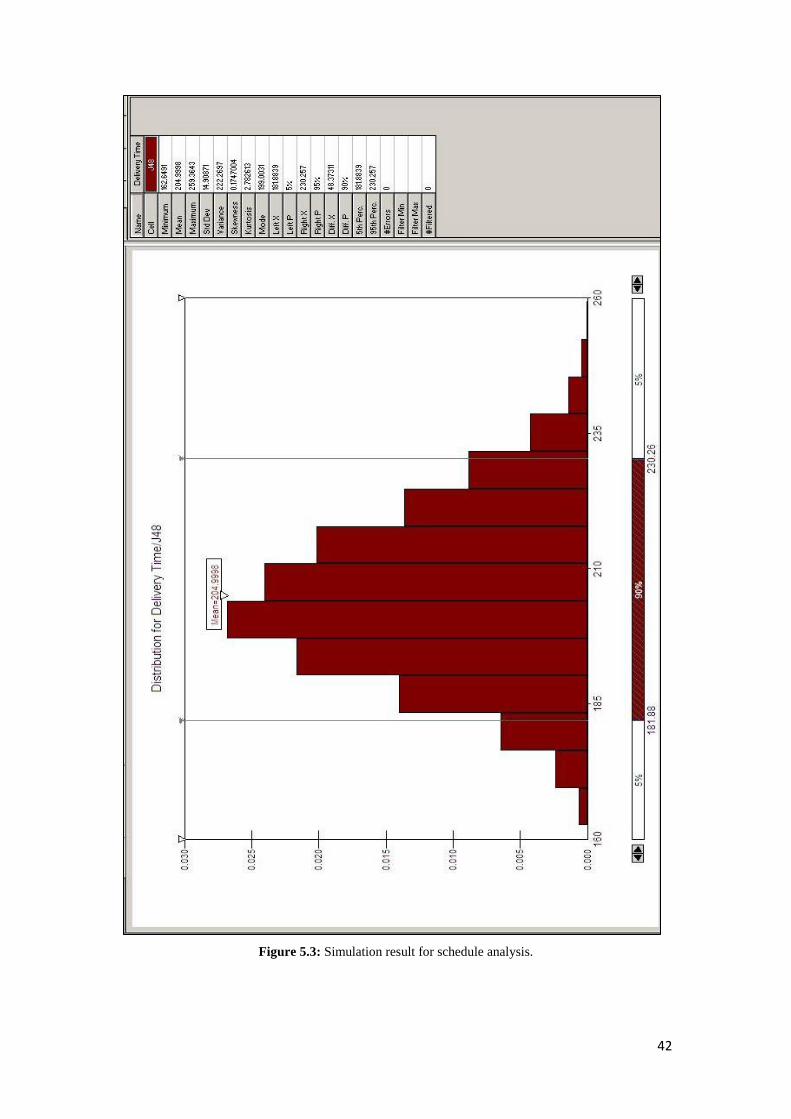
42
Figure 5.3: Simulation result for schedule analysis.

43
Figure 5.4: Simulation result for schedule analysis.

44
Figure 5.3 shows that it is 90% certain that project would be completed between 181
to 231 days. Another way to visualize this graph is getting certainty level for desired
duration. For example Figure 5.4 shows that it is 67.8% certain that project would
complete between 190 to 220 days.
Case 3: Cost Analysis
The cost analysis were performed with same procedure like schedule analysis.
For each activity in a phase, @risk Pert function is inserted and maximum,
minimum and most likely cost values for corresponding activity are assigned.
At the end of each phase, the result is made by using SUM function to add
duration of each activity.
From menu option, add output is selected for result cell.
From menu option, simulation setting is selected and number of iterations was
set to 5000 (increasing this number increase scenarios to be considered).
From menu option, run the simulation.
Result would be a histogram distribution which would help determining
certainty level for a phase to be completed in X million SEK.

45
Figure 5.5: Snapshot of simulation in @risk for cost analysis.

46
Figure 5.6: Simulation result for cost analysis.

47
Figure 5.7: Simulation result for cost analysis.

48
Figure 5.6 shows that, it is 90% certain that project would be completed between
59.36 to 67.74 million SEK. Another way to visualize this graph is getting certainty
level for desired amount. For example Figure 5.7 shows that it is 66.36% certain that
project would be completed between 61.00 to 66.00 million SEK.
49
CHAPTER 6
6 CONCLUSIONS AND
RECOMMENDATIONS
he purpose of this study was to develop a prototype of a project uncertainty
and risk management model to help improve project risk management in
Elekta-Stockholm, yet it can be adopted by similar organizations. To realize
this goal, the ISO 31000 standard was employed to evaluate and understand the
project risk and uncertainty management process in Elekta by conducting interviews
and analyzing these interviews. This initial investigation was then used as input for
specifying the model and for establishing its functional logic. Also, to ensure the
quality of the model, the criterion suggested by Cooper et al (2005) for assessing the
quality of risk management models was considered and this criterion can therefore be
used to measure the goodness of the model. The conclusions and recommendations
from the study are summarized in the following sections.
6.1 Conclusions
The following conclusions are derived from the research:
The review of literature revealed that uncertainty and risk are related but
different concepts, and that probability distributions are much more realistic
way of describing uncertainty. The review also showed that there exist a
variety of risk management frameworks and models globally and their basic
structures are similar. ISO31000 (2009), PMBOK (2008) and AS/NZS 4360
(2004) were considered in the study. Also, risk exists in all aspects of projects
and the key word in project risk management is systematic, the more
disciplined or structured a risk management approach, the more is its ability to
control and manage risks.
T

50
The evaluation of the project risk management process in Elekta confirmed
that project risk management is done to a certain degree but not in a well
structured manner. The evaluation also pointed out that the risk analysis
process in Elekta is skewed towards qualitative/semi-qualitative which is not
always suitable. Thus, making it difficult for project teams to handle
uncertainty. Also, quantitative (uncertainty) analysis techniques such
stochastic simulation and decision trees and so on are not used at all for
project risk/uncertainty management.
Testing the model on an ongoing project suggested that the proposed model
can help improve the project schedule uncertainty analysis and project cost
uncertainty analysis. The results also demonstrate that the model provides a
means for analyzing risks at a good level of detail. That is, on the basis of the
level of impact each risk may have on each specified project objectives, as
well as for performing higher level and less rigorous analysis of minor project
risks. The model has also proved to be suitable for aggregating individual
project risks to visualize risk at project and portfolio levels.
Being systematic is central to effective and efficient risk/uncertainty
management and by following a structure model like this, Elekta can enhance
its project risk management process to a good extend.
6.2 Recommendations
- Excel is recommended for implementing the prototype model since it easy and
efficient to use.
- Since it will be more demanding in term of time and effort to perform the
micro level analysis for all identified risks, we recommend that the top ten or
most important risks should be selected for the micro level analysis and the
rest of the risks should be analyzed at the macro level. Note that the risks
status may change as the project runs therefore the top ten risks may change
and new risks may join the list and existing ones dropped.
- To improve project managers ability of project teams to better handle
uncertainties in project cost and time, we recommend project managers and
other relevant project team member be should be given training on
uncertainty/quantitative risk analysis using stochastic (Monte Carlo)

51
simulation technique with the @risk/@risk for project package. This package
has managed to hide most of the difficult aspects of stochastic simulation and
that makes easy to learn and user-friendly.
- The risk/uncertainty management process suggested in the model focused
more on managing risk as a threat, even though it can also be apply for
opportunity management, it requires some minor adjustments to be more
effective for that purpose and therefore further research can be done to explore
this.
- To ensure reliability, trust, continuity, effectiveness and efficiency, we
recommend that the model should be tried, evaluated and for improvement.

52
`
7 REFERENCES
- Adams, J., Khan, H.T.A., Raeside, R. And White D. (2007). Research
Methods for Graduate Business and Social Science Students. Response.
- ALHawari, S., Thabtah, F., Karadsheh, L., and Hadi, W.M. (2011). A Risk
Management Model for Project Execution. Information Management in
Modern Organizations: Trends & Challenges.
http://www.ltu.edu/cm/attach/A1A5680A-B853-4B21-879A-
2FE643B16BAD/paper%20111.pdf. Accessed on 03-12-2011.
- AS/NZS 4360, 2004. The Australian and New Zealand Standard on Risk
Management.
- Aven, T. (2008): “Assessing Uncertainties beyond Expected Values and
Probabilities” John Wiley & Sons, Ltd
- Biggam, J. (2008). Succeeding with your master’s dissertation – A step-by-
step hand book. 1st Ed. ISBN-10: 0 335 22719 8. McGraw Hill.
- Chapman, C., Ward, S. (2003). Project Risk management- processes,
techniques and insights. 2nd Ed. ISBN 0-470-85355-7. John Wiley & Sons
Ltd.
- Cooper, D. F., Grey S., Raymond G. and Walker P., 2005. Project Risk
Management Guidelines: Managing Risk in Large Projects and Complex
Procurements. John Wiley & Sons Ltd.
- Duncan, William R. A. (1996). “Guide to the Project Management Body of
Knowledge” PMI standards Committee, Pennsylvania, USA. . (1996),
- Elekta Anual Report (2010/2011). Elekta AB (publ).
- ISO 3100 (2009). Risk management — Principles and guidelines. 1st Ed.
ISO, Switzerland.
- Fisher, C. (2007). Researching and Writing a Dissertation: A Guide Book
for Business Students. 2nd Ed. ISBN: 978-0-273-71007-3. Prentice Hall (FT)
53
- Kerzner, H. 2001. Project Management: A Systems Approach to Planning,
Scheduling, and Controlling. Seventh Ed. John Wiley & Sons, Inc.
- Langhe´, R. (2010). Lecture notes on Advance Risk Management, KTH,
Södertälje.
- Martland, C. D. (2004). Notes on Project Evaluation. Department of Civil &
Environmental Engineering, Massachusetts Institute of Technology.
- Maylor, H. (2003). “Project Management”3rd e. Prentice Hall Retrieved
September 29, 2010
- McDermott, E.R., Mikulak, R., and Beauregard, M. (1996). The Basics of
FMEA. Portland, Oregon. Productivity, INC.
- Project Management Institute, 2008. A Guide to the Project Management
Body of Knowledge, third ed. Project Management Institute,
Pennsylvania.
- Royer, P.S. (2000). Risk Management: The Undiscovered Dimension of
Project Management. Vl.31, No. 16-13. Project Management Journal,
PMI.
- Schuyler, John R. (1950). “Risk and Decision analysis in projects” 2nd Ed.
PMI, Pennsylvania, USA.
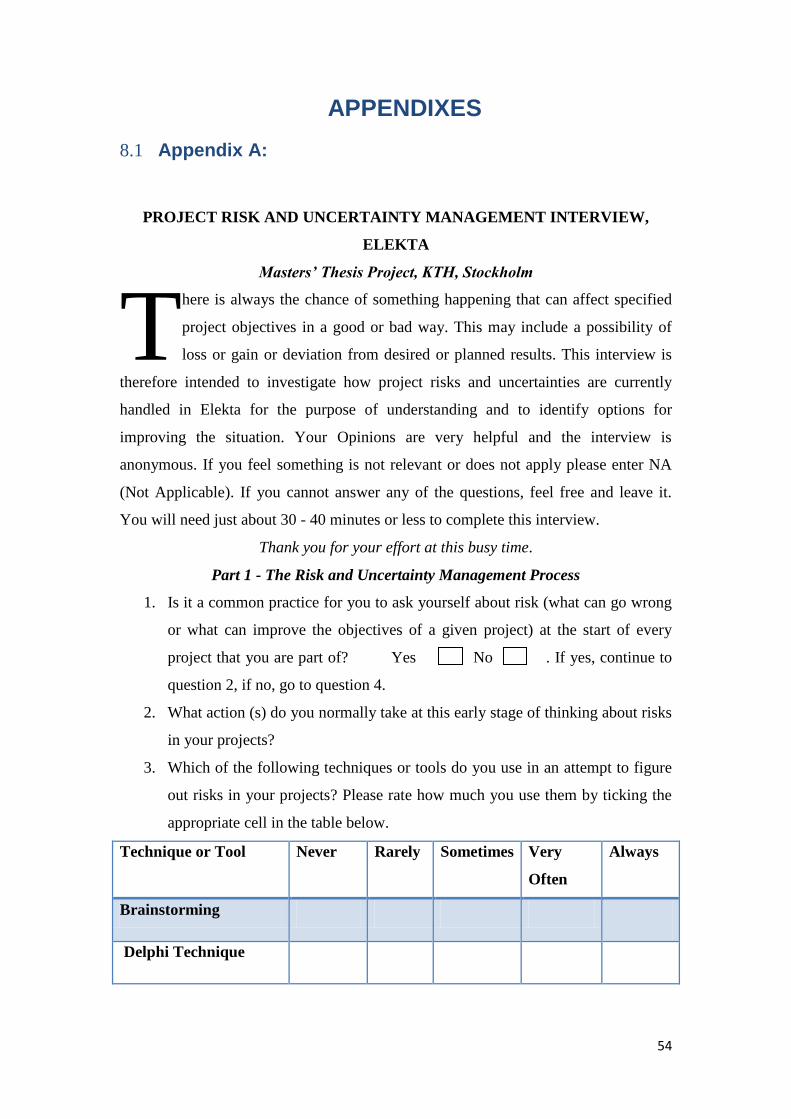
54
8 APPENDIXES
8.1 Appendix A:
PROJECT RISK AND UNCERTAINTY MANAGEMENT INTERVIEW,
ELEKTA
Masters’ Thesis Project, KTH, Stockholm
here is always the chance of something happening that can affect specified
project objectives in a good or bad way. This may include a possibility of
loss or gain or deviation from desired or planned results. This interview is
therefore intended to investigate how project risks and uncertainties are currently
handled in Elekta for the purpose of understanding and to identify options for
improving the situation. Your Opinions are very helpful and the interview is
anonymous. If you feel something is not relevant or does not apply please enter NA
(Not Applicable). If you cannot answer any of the questions, feel free and leave it.
You will need just about 30 - 40 minutes or less to complete this interview.
Thank you for your effort at this busy time.
Part 1 - The Risk and Uncertainty Management Process
1. Is it a common practice for you to ask yourself about risk (what can go wrong
or what can improve the objectives of a given project) at the start of every
project that you are part of? Yes No . If yes, continue to
question 2, if no, go to question 4.
2. What action (s) do you normally take at this early stage of thinking about risks
in your projects?
3. Which of the following techniques or tools do you use in an attempt to figure
out risks in your projects? Please rate how much you use them by ticking the
appropriate cell in the table below.
Technique or Tool Never Rarely Sometimes Very
Often
Always
Brainstorming
Delphi Technique
T
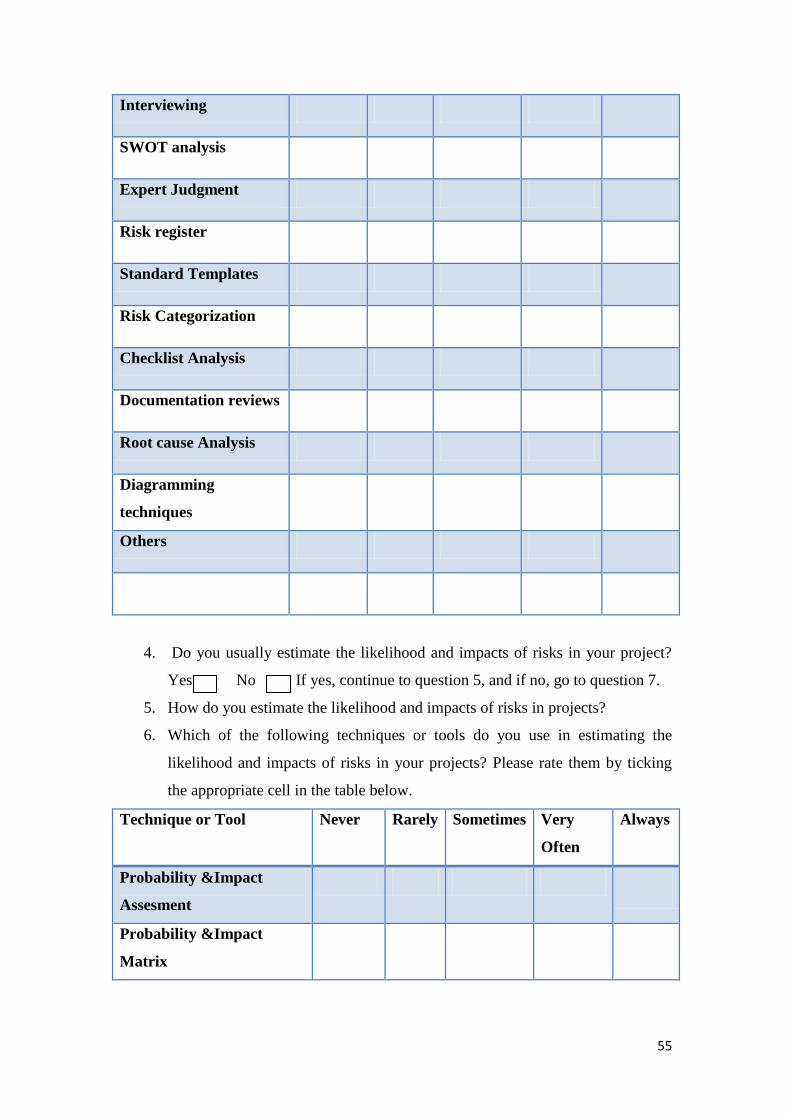
55
Interviewing
SWOT analysis
Expert Judgment
Risk register
Standard Templates
Risk Categorization
Checklist Analysis
Documentation reviews
Root cause Analysis
Diagramming
techniques
Others
4. Do you usually estimate the likelihood and impacts of risks in your project?
Yes No If yes, continue to question 5, and if no, go to question 7.
5. How do you estimate the likelihood and impacts of risks in projects?
6. Which of the following techniques or tools do you use in estimating the
likelihood and impacts of risks in your projects? Please rate them by ticking
the appropriate cell in the table below.
Technique or Tool Never Rarely Sometimes Very
Often
Always
Probability &Impact
Assesment
Probability &Impact
Matrix

56
Risk Categorization
Risk Urgency Assessment
Expert Judgment
Others
7. Is it a common practice for you to prioritize the project risks that you discover
in your projects?
Yes No . If yes, continue to question 8, and if no, go to question
10.
8. How do you usually prioritize the risks?
9. Which of the following techniques or tools do you use in ranking the risks in
projects? Please rate them by ticking the appropriate cell in the table below.
Technique or Tool Never Rarely Sometimes Very
Often
Always
Risk factor
comparision
Interviewing
Probability &Impact
Matrix
Sensitivity Analysis
EMV Analysis
Modeling and
Simulation
Others

57
10. Is it a common practice for you to respond to projects risks?
Yes No . If yes, continue to question 10, and if no, go to
question 11.
11. How do you normally respond to discovered project risks?
12. Is it a common practice for you to monitor the risk management process?
Yes No . If yes, continue to question 15, and if no, go to question
17.
13. How do you monitor that process of dealing with risks?
14. Which of the following techniques or tools do you use in monitoring the
performance of the risk management process? Please rate them by ticking the
appropriate cell in the table below.
Technique or Tool Never Rarely Sometimes Very
Often
Always
Project risk responce audits
Periodic project risk reviews
Earned Value Analysis
Technical performance measurment
Additional risk responce planning
Other (s)
15. Is it a common practice for you to make an effective communication about
project risks among all concern stakeholders?
Yes No . If yes, continue to question 18, and if no, go to
question 20.
16. How do you make communication during the process of dealing with project
risks?

58
17. Which of the following techniques or tools do you use for communication
among concerning stakeholders about status of project risks and system
dealing with these risks? Please rate them by ticking the appropriate cell in the
table below.
Technique or Tool Never Rarely Sometimes Very
Often
Always
One to One meeting
emails
Telephone call
Video conferencing/Skype
Reporting using specific
templates
Other (s)
18. Is it a common practice for you to make a register for identified project risks?
Yes No . If yes, continue to question 19, and if no, go to question
21.
19. What are contents of the risk register?
20. How frequently you update this database?
Technique or Tool Never Rarely Sometimes Very
Often
Always
Update Risk database
21. Do you normally assign risk owners for each identified project risk?
Yes No . If yes, how do you make sure every owner knows the
risks he/she is responsible for?
22. Do you feel that you have enough authority and accountability to manage the
risks that you are assign to? Yes No

59
23. Write down here if you have any specific suggestion (s) for improving risk
/uncertainty management in Elekta.
24. How important are the following factors on the basis of your experience in
Elekta’s projects? Please tick in the table below.
Factor Very
Unimportant
Unimportant Neutral Important Very
Important
Time
Cost
Scope
Quality
Others (list
below and
rate)
Part 2 – Demographics
25. Sex Male Female
26. How long have you worked in Elekta’s projects?
Less than 3 years Between 3 and 5 Years More Than 5 years
27. Job tile ………………………………………..
Thank you Very Much!!


![Gynecologic Cancer InterGroup Cervix Cancer Research Network Springer SPEAKER Elekta Emergin… · [II] Globocan 2012, United nations population data 2015, Internal Elekta data, IMV](https://static.documents.pub/doc/80x56/6012b231d3c44246625e8ada/gynecologic-cancer-intergroup-cervix-cancer-research-network-springer-speaker-elekta.jpg)


