8
Integrated Offshore Wind Farm Design: Optimizing Micrositing and Cable Layout Simultaneously Thomas Marge January 23, 2018 Collaborators: Sara Lumbreras, Andrés Ramos, Ben Hobbs

Integrated Offshore Wind Farm Design: Optimizing Micrositing and Cable Layout Simultaneously
Thomas Marge
January 23, 2018
Collaborators: Sara Lumbreras, Andrés Ramos, Ben Hobbs

Jensen’s Wake Modeling
Determined by
wake expansion
coefficient
𝛿 =1 − 1 − 𝐶𝑡1 + 𝑘𝑤 𝑥 𝑟𝑟
2
𝛿𝑡𝑜𝑡𝑎𝑙 = 𝛿𝑖
𝑛
𝑖=1
12
1. Wind speed deficits calculated for each pair of turbines
2. Deficit aggregated for each turbine across all
turbines that impact it using sum of squares
Peña, A., Réthoré, P. E., & Laan, M. P. (2015). On the application of the Jensen wake model
using a turbulence‐dependent wake decay coefficient: the Sexbierum case. Wind Energy.

Solution Methods Diagram
Select Turbine Layouts
to be compared
-Standard schemes but variable spacing
-Swarm model outputs
Model Wakes for each
scheme to calculate
wake cost
Integrate wake cost into
MIP and allow MIP to
select optimal turbine
spacing while
determining cable
selection
-Jensen’s model
-Can choose which cable connections to consider
-Can integrate other costs into objective function
-Integration of wake cost into objective function is
non-trivial
Determined Pre-model
Low Computational Intensity
(1 hour per run)
High Computational Intensity
(6-10 hours per run)

Objective Function
Included in optimization of Case Study Not included in case study,
but model is equipped to
handle
Not considered
-non-standard turbine
placement
-macrositing
-Cable installation selection
-Cable type selection
-Transmission system selection
(MVAC, HVAC, HVDC)
-Wake cost of varies layouts
-Component failure rates
-Turbine spacing for turbine
placement pattern selected
-Surface concession costs
-Turbine placement scheme comparison
-Losses from electrical flow through
cables
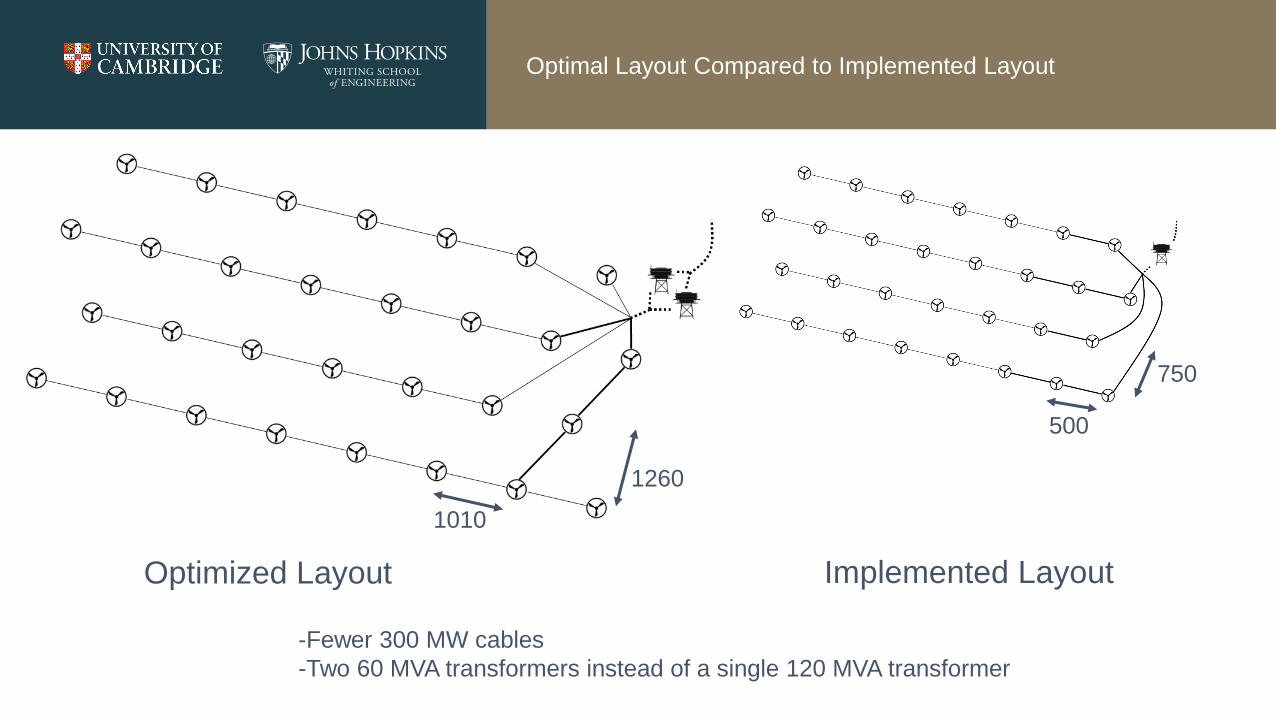
Optimal Layout Compared to Implemented Layout
1260
1010
500
750
Optimized Layout Implemented Layout
-Fewer 300 MW cables
-Two 60 MVA transformers instead of a single 120 MVA transformer

Well Modeled Components of the Objective Function
-Both have R squared values above .99
-Modeling issue is power not served cost
-Explained by interaction of windspeed deficits and
turbine power curve -Explained by linear scaling of most turbine
connections

Case Study Results
Overview
-Investment cost increased by 160,000 euros per year
-power not served remained constant
-Surface concession cost increased by 100,000 euros per year
-550,000 euros per year savings from wake decrease
-net 300,000 euros per year savings, or 6 million euros over the life of the plant

Funding and Support


