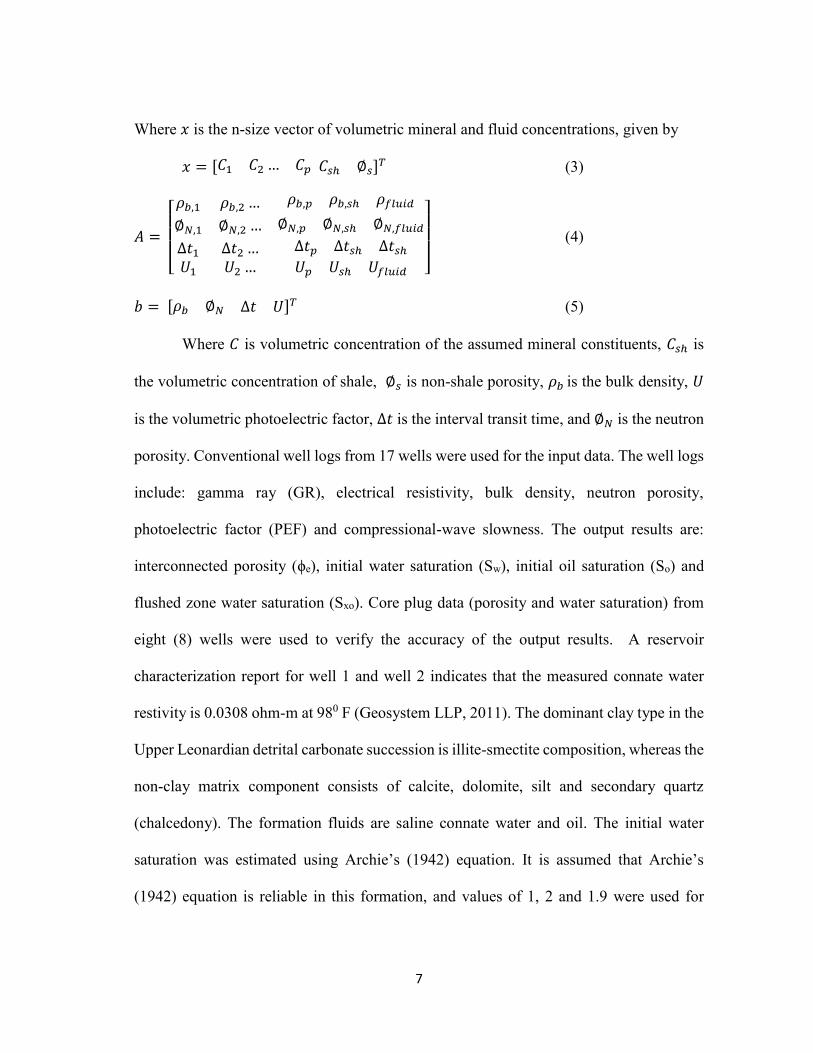
INTEGRATED RESERVOIR CHARACTERIZATION OF UPPER LEONARDIAN DETRITAL CARBONATE ROCKS, GLASSCOCK COUNTY, TEXAS, USA A Thesis by ROY AUGUSTINE CONTE Submitted to the Office of Graduate and Professional Studies of Texas A&M University in partial fulfillment of the requirements for the degree of MASTER OF SCIENCE Chair of Committee, Michael C. Pope Committee Members, Zoya Heidari Juan Carlos Laya Head of Department, Rick E. Giardino December 2014 Major Subject: Geology Copyright 2014 Roy Augustine Conte
Transcript
INTEGRATED RESERVOIR CHARACTERIZATION OF UPPER
LEONARDIAN DETRITAL CARBONATE ROCKS, GLASSCOCK COUNTY,
TEXAS, USA
A Thesis
by
ROY AUGUSTINE CONTE
Submitted to the Office of Graduate and Professional Studies of Texas A&M University
in partial fulfillment of the requirements for the degree of
MASTER OF SCIENCE
Chair of Committee, Michael C. Pope Committee Members, Zoya Heidari Juan Carlos Laya Head of Department, Rick E. Giardino
December 2014
Major Subject: Geology
Copyright 2014 Roy Augustine Conte
ii
ABSTRACT
Wells on the eastern side of the Midland Basin near its Eastern Shelf in Glasscock
County, Texas, penetrate an Upper Leonardian succession of detrital carbonate, deposited
in slope and basinal environments. Hydrocarbon production from this interval in Veterans
and St. Lawrence Fields is highly variable - some wells produced oil at economic rates
following fracture stimulation, whereas the coeval section in other wells failed to produce
oil after fracture stimulation.
The depositional texture and diagenetic attributes of the Upper Leonardian detrital
carbonate succession were described from slabbed cores, plain light and
cathodoluminescence (CL) petrography, scanning electron microscope (SEM) images,
and formation micro-imager (FMI) logs. Depth-by-depth assessment of petrophysical
properties were interpreted from conventional wireline logs and laboratory core plug
measurements using the multimineral analysis method.
Nine main lithofacies were identified on the basis of depositional texture,
constituent composition (skeletal and non-skeletal grains, detrital component, and
mineralogy) and diagenetic features. The upper and middle slope lithofacies are: mud-lean
fusulinid-crinoid packstone and clast-supported polymict conglomerate deposited in
channelized settings. The middle and lower slope deposits are: fusulinid-crinoid
packstone, fusulinid wackestone, skeletal wackestone and partially silicified skeletal
wackestone to mudstone. Occasional intraclasts in these deposits suggest they were
deposited by debris flows. The lower slope facies is matrix-supported conglomerate
iii
deposited by debris flow at the toe-of-slope. Carbonate mudstone was deposited on the
lower slope and on unchannelized parts of the slope. Shale was deposited in the basin.
The Upper Leonardian detrital carbonate succession in Veterans and St. Lawrence
Fields was deposited in carbonate aprons developed along relatively gentle to steep slopes
(1-50) that were fed by small submarine canyons that by-passed fine-grained upper slope
sediments. The rocks were affected most by burial diagenesis. The effects of burial
diagenesis on the formation are mechanical and chemical compaction, resulting in reduced
pore sizes and loss of primary interparticle porosity, reduced pore throat diameter, stylolite
development, grain penetration, grain deformation, and grain fracturing. The pore system
throughout the carbonate units is characterized by intraparticle pores mainly in skeletal
grains and interparticle pores which are interconnected solution-enhanced pores between
grains created by partial dissolution of skeletal grains.
This reservoir characterization indicates that, in Veterans and St. Lawrence Fields,
the failure of some wells to produce oil at economic rates could be attributed to the
heterogeneities associated with the stratigraphic framework and spatial distribution of
depositional facies of the Upper Leonardian detrital carbonate succession. The potential
reservoir rocks developed in the channelized portion of the slope whereas non-reservoir
rocks accumulated in the lower slope and on interchannel highs on the upper and middle
slope.
iv
DEDICATION
This thesis is dedicated to Jesus Christ, the same yesterday, today and forevermore.
v
ACKNOWLEDGEMENTS
I would like to express my profound gratitude to my committee chair, Dr. Mike
Pope, and my committee members Dr. Zoya Heidari and Dr. Juan Carlos Laya, for their
guidance, and support throughout the course of this research.
I wish to thank McClure Oil Company, Midland, TX, for providing all the data for
this research, and Berg Hughes Center for Sedimentary and Petroleum Studies, Texas
A&M University, for providing funding for this research.
I also would like to thank my friends, colleagues and faculty and staff members of
the Department of Geology and Geophysics for making my time at Texas A&M
University a great experience.
Finally, I would like to thank my family for their support and encouragement
Figure 15: Paragenesis in the Upper leonardian detrital carbonate succession as observed from thin-section petrography……………………………...48
Figure 16: Average porosity maps……………………………………………..……49
Figure 17: Permeability and water saturation maps…………………………….…...50
x
Figure 18: Cross-plots to illustrate the porosity - permeability relationships……… 51
Figure 19: Cross-plots to illustrate porosity – water saturation relationship……………………………………………………………... 52
Figure 20a: Cross-section from well 3 to well 16 showing isochore net pay thickness in the Upper Leonardian dertital carbonate succession in Veterans and St. Lawrence Fields, Glasscock County………………… 53
Figure 20b: Cross-section from well 3 to well 2 showing isochore netpay
thickness in the Upper Leonardian detrital carbonate succession in the Veterans and St. Lawrence Fields, Glasscock County……………... 54
Eastern Midland Basin: AAPG Bulletin, v. 80, no. 9, p. 1349-1365.
Mullins, H. T., and Buren, H. M. V., 1979, Modern modified carbonate grain flow
deposits: Journal of Sedimentary Petrology, v. 49, no. 3, p. 747-752.
Mullins, H. T., and Cook, H. E., 1986, Carbonate apron models: Alternations to the
submarine fan model for paleoenvironmental analysis and hydrocarbon
exploration.: Sedimentary geology, v. 48, p. 37-79.
Mullins, H. T., and Neumann, A. C., 1979, Deep carbonate bank margin structure and
sedimentation in northern Bahamas SEPM Special Publication, v. 27, p. 165-192.
Playton, T. E., Janson, X., and Kerans, C., 2010, Carbonate slopes, in N. P. James and R.
W. Dalrymple, eds., Facies models 4: Geological Association of Canada, p. 449-
476.
Rider, M., and Kennedy, M., 2011, The geological interpretation of well logs, 3rd edition,
Scotland, Rider-French Consulting Ltd., 432 p.:
Ross, C. A., and Ross, J. R. P., 1985, Paleozoic tectonics and sedimentation in West Texas,
southern New Mexico and southern Arizona in Dickepson P. W. and Muehlberger
W. R. eds., Structure and tectonics of Trans Pecos Texas: Midland: West Texas
Geological Society, no. 85, p. 221-230.
Ruppel, S. C., and Ward, W. B., 2013, Outcrop-based characterization of the Leonardian
carbonate platform in west Texas: Implications for sequence-stratigraphic styles
30
in the Lower Permian: American Association of Petroleum Geologists Bulletin, v.
97, no. 2, p. . 223–250.
Saller, A. H., Barton, J. W., and Barton, R. E., 1989, Slope sedimentation associated with
a vertically building reef, Bone Spring Formation, Mescalero Escarpe Field,
southeastern New Mexico, in in Crevello, P.D., Wilson, J.L., Sarg, J.F., Read, J.F.,
eds., Controls on carbonate platform and basin development: SEPM Special
Publication, v. 44, p. 275-288.
Saneifer, M., Conte, R., Chen, C., Heidari, Z., and Pope, M., 2014, Integrated rock
classification based on elastic and petrophysical properties estimated from
conventional well logs.: SPWLA 55th Annual Logging Symposium.
Schalger, W., and Chermak, A., 1979, Sediment facies of platform-basin transition,
Tongue of the Ocean, Bahamas: SEPM, v. 27, p. 193-208.
Scholle, P. A., 1977, Deposition, diagenesis and hydrocarbon potential od "deep-water"
limestones: AAPG Short Course Notes, p. 25pp.
Silvers, B. A., and Todd, R. G., 1969, Permian cyclic strata, northern Midland and
Delaware Basins, West Texas and southeastern New Mexico: American
Association of Petroleum Geologists Bulletin, v. 53, no. 11, p. 2223 - 2251.
Yang, K.-M., and Dorobek, S., 1995a, The Permian Basin of West Texas and New
Mexico; Tectonic history of a "composite" foreland basin and its effects on
stratigraphic development, in Dorobek, S.L., and Ross, G.M. eds., Stratigraphic
evolution of foreland basins: Society for Sedimentary Geology Special Publication
no. 52, p. 149-174.
31
Yang, K.-M., and Dorobek, S. T., 1995b, The Permian Basin of West Texas and New
Mexico: Flexural modeling and evidence for lithospheric heterogenity across the
Marathon foreland, in Dorobek, S.L., and Ross, G.M. eds., Stratigraphic evolution
of foreland basins: Society for Sedimentary Geology Special Publication no. 52,
p. 37 - 50.
32
APPENDIX 1
FIGURES
Shale
Skeletal wackestone
Matrix-supported conglomerate
Mudstone
Fusulinid-crinoid packstone
Clast-supported polymict conglomerate
Mud-lean fusulinid-crinoid packstone
Fusulinid wackestone
Partially silicified skeletal wackestone to mudstone
Legends
33
Wells with slabbed cores, thin-sections, well logs and FMI logs
Wells with well logs and FMI logs Wells with well logs only
Fusulinid
Broken brachiopod shell
Bryozoan
Sponge
Clasts with skeletal grains
Reef clast
Crinoid
Rugose
Shale rip-up clast
Soft sediment deformation
Sponge spicule
Stylolite
Pellets
Bioturbation
Gastropod
Compaction nodules
Normal grading
Calcite filled fractures
Base of Upper Leonardian detrital carbonate succession
Shallowing upward facies trend
Deepening upward facies trend
Oil stain in slabbed core
34
Permian basin Sub-basins Approximate field location
(a)
(b) Figure 1: Location map of the study area. (a) Regional map of the Permian Basin showing Glasscock County and the approximate field location. (b) Field map provided by McClure Oil Company showing the relative position of the wells, the Upper Leonardian detrital carbonate pinch-out and the free-water level. (A-B and A-C are stratigraphic cross-sections correlated for wells with slabbed cores)
N
Well 2
Well 1
Well 3
Well 4
Well 7
Well 8
Well 9
Well 10
Well 11
Well 12
Well 13
Well 14
Well 15
Well 16
Well 17
Well 5
Well 6
Well 18
N
AB
C
Midland
Basin
New Mexico
Texas
Delaware
Basin
Central
Basin
platform
Ozona
Arch
Val Verde
Basin
Glasscock
Ea
ste
rn S
helf
0 200 km
Upper Leonardian
detrital carbonate
pinch-out
Free water level
0 2700 Ft (823 m)
Diablo
Platform
35
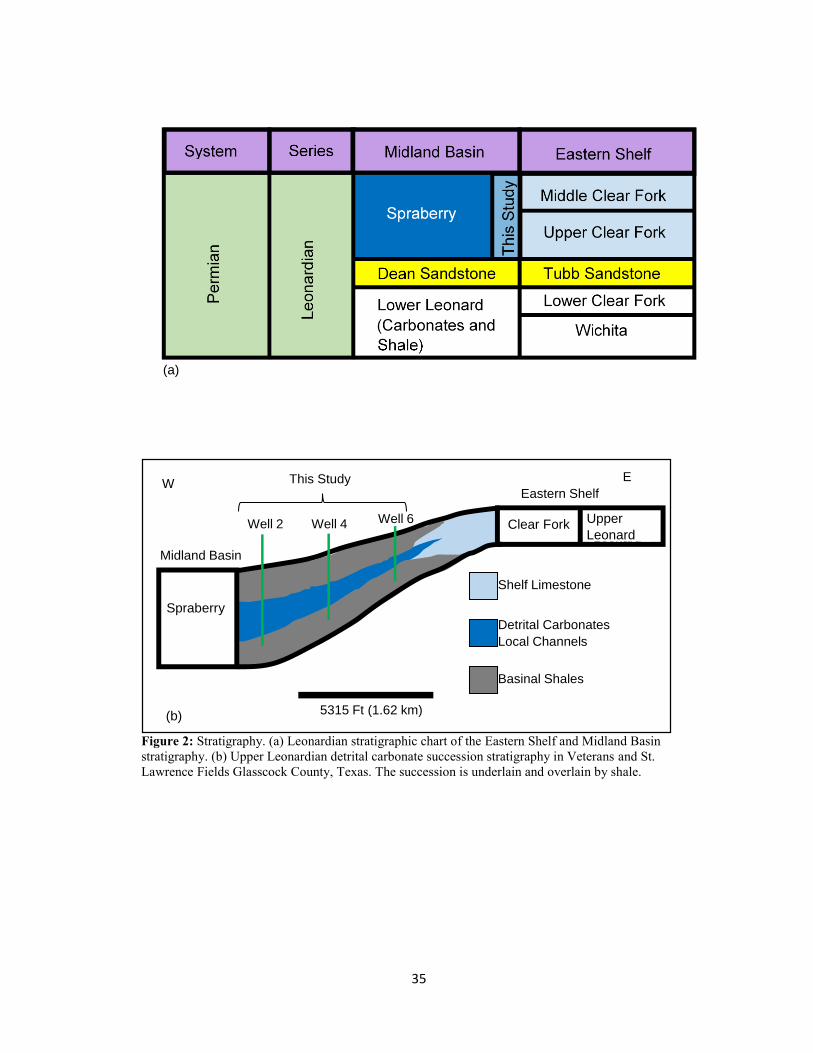
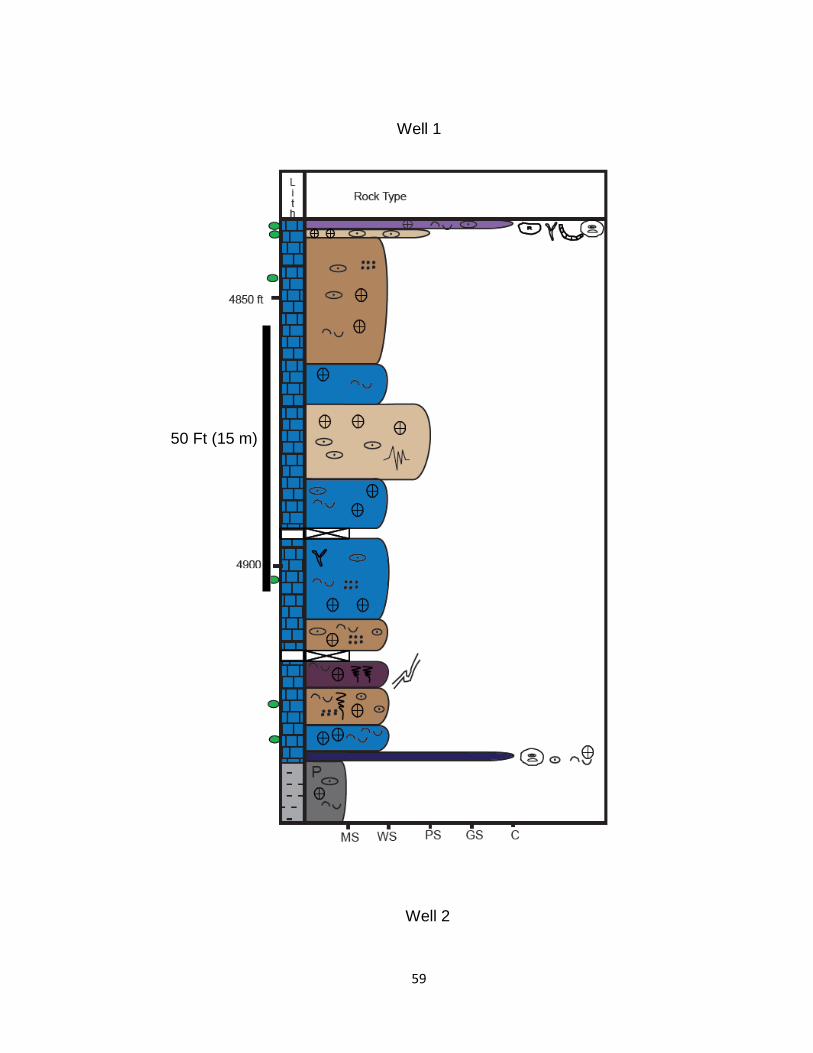
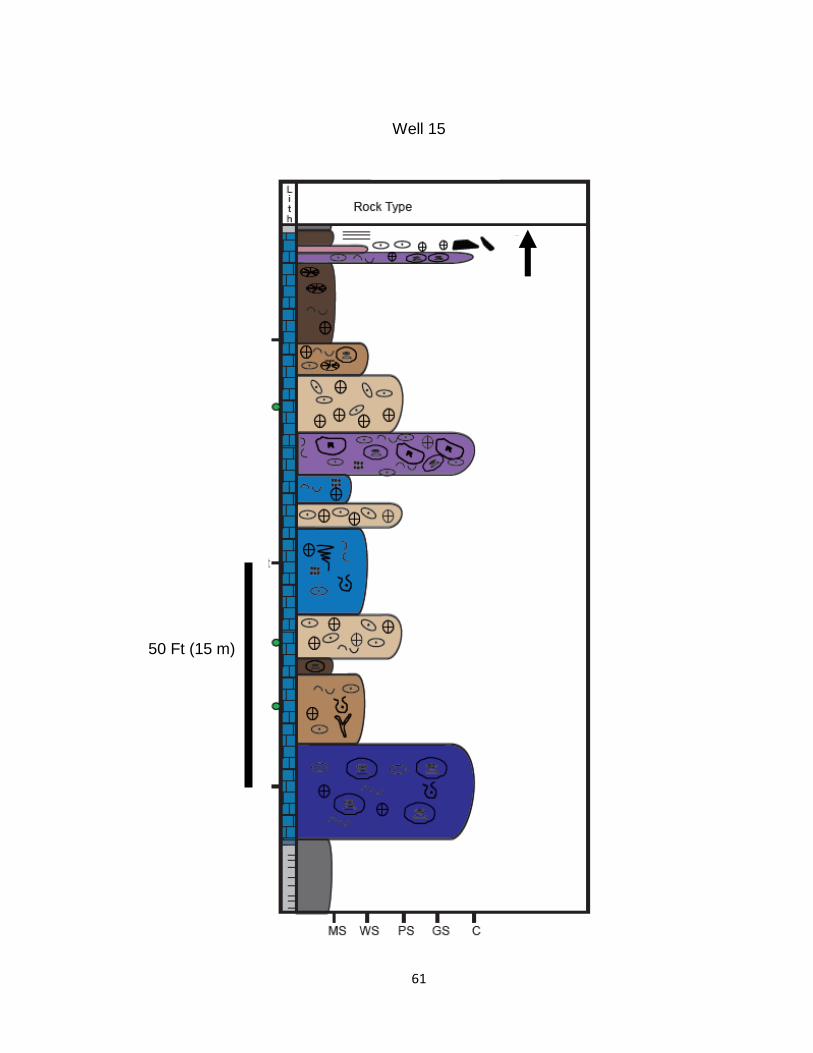
Figure 2: Stratigraphy. (a) Leonardian stratigraphic chart of the Eastern Shelf and Midland Basin stratigraphy. (b) Upper Leonardian detrital carbonate succession stratigraphy in Veterans and St. Lawrence Fields Glasscock County, Texas. The succession is underlain and overlain by shale.
5315 Ft (1.62 km)
Spraberry
Clear Fork Upper
LeonardWell 2 Well 4 Well 6
This Study
Shelf Limestone
Detrital Carbonates
Local Channels
Basinal Shales
Eastern Shelf
Midland Basin
EW
(a)
(b)
Spraberry
Clear Fork Upper
Leonard
36
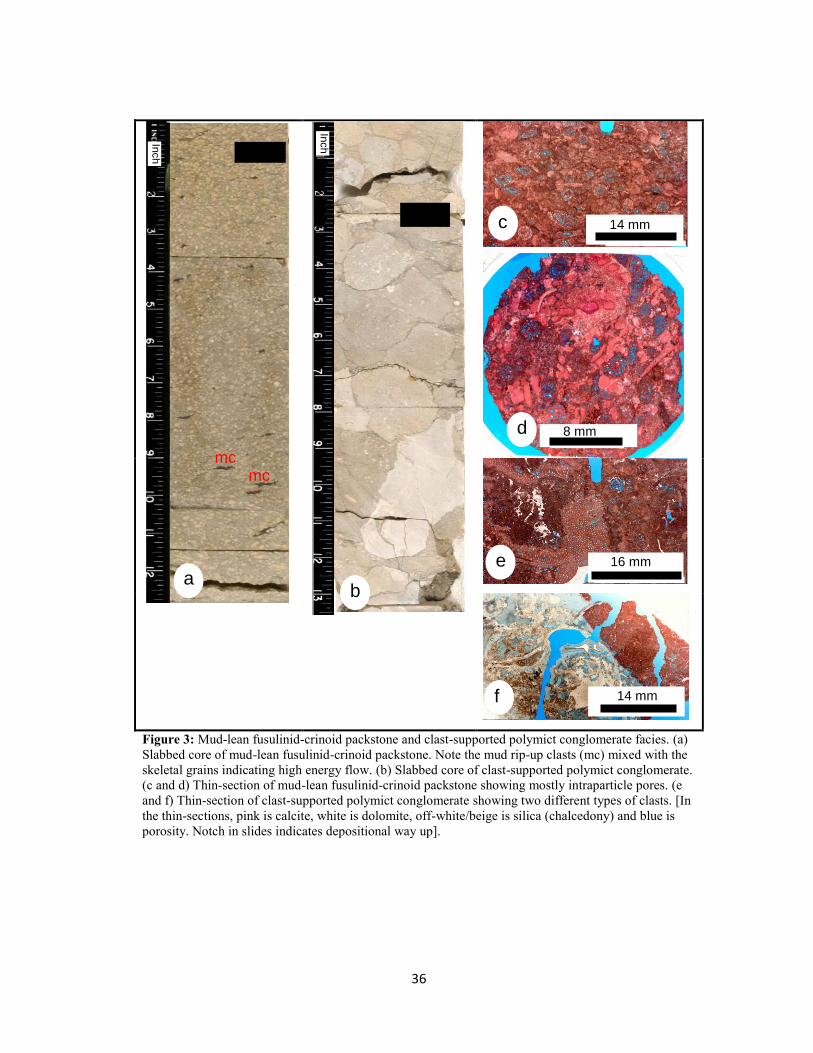
Figure 3: Mud-lean fusulinid-crinoid packstone and clast-supported polymict conglomerate facies. (a) Slabbed core of mud-lean fusulinid-crinoid packstone. Note the mud rip-up clasts (mc) mixed with the skeletal grains indicating high energy flow. (b) Slabbed core of clast-supported polymict conglomerate. (c and d) Thin-section of mud-lean fusulinid-crinoid packstone showing mostly intraparticle pores. (e and f) Thin-section of clast-supported polymict conglomerate showing two different types of clasts. [In the thin-sections, pink is calcite, white is dolomite, off-white/beige is silica (chalcedony) and blue is porosity. Notch in slides indicates depositional way up].
14 mm
8 mm
16 mm
14 mm
Inch
a b
c
d
e
f
14 mm
8 mm
16 mm
14 mm
Inch
mc mc
37
Figure 4: Fusulinid wackestone and skeletal wackestone facies (a) Slabbed core of fusulinid wackestone with chert clast. (b) Slabbed core of skeletal wackestone with chert clast. (c) Thin-section image of fusulinid wackestone. (d) Thin-section image of skeletal wackestone without solution-enhanced pores. (e) Thin-section image of skeletal wackestone. [In the thin-sections, pink is calcite, white is dolomite, off-white/beige is silica (chalcedony) and blue is porosity. Notch in slides indicates depositional way up].
15 mm
18 mm
9 mm
a b
c
d
e
15 mm
18 mm
9 mm
Inch Inch
38
Figure 5: Fusulinid-crinoid packstone and partially silicified skeletal wackestone to mudstone facies. (a) Slabbed core of fusulinid-crinoid packstone. (b) Slabbed core of partially silicified skeletal wackestone to mudstone. (c) Thin-section of fusulinid-crinoid packstone. (d) Thin-section of partially silicified skeletal wackestone to mudstone showing extensive dissolution in silicified portion. [In the thin-sections, pink is calcite, white is dolomite, off-white/beige is silica (chalcedony) and blue is porosity. Notch in slides indicate depositional way up].
18 mm
15 mm
a
d
c
b
18 mm
15 mm
Silicified
portion Unsilicified
portion
Inch
Inch
39
Figure 6: Matrix-supported conglomerate and carbonate mudstone facies. (a) Slabbed core of matrix-supported conglomerate. (b) Slabbed core of carbonate mudstone mudstone. (c) Thin-section of matrix-supported conglomerate (yellow arrows indicate clasts). (d) Thin-section of carbonate mudstone. [In the thin-sections, pink is calcite, white is dolomite, off-white/beige is silica (chalcedony) and blue is porosity. Notch in slides indicate depositional way up].
18 mm
16 mm
a
d
c
b
18 mm
16 mm
Inch
Inch
40
Figure 7: Shale facies. (a) Slabbed core of shale. (b) Slabbed core showing the sharp contact between the matrix-supported conglomerate and the underlying shale. Note the shale is mixed into the base of the matrix-supported conglomerate indicating debris flows into mud rich basinal environments.
a
b
Inch
41
(a)
(b)
(c)
(d)
(e)
(f)
Figure 8: Diagenesis and pore types. (a) Skeletal-wackestone photomicrograph showing solution-enhanced interparticle pores. (b) SEM image of skeletal wackestone showing solution-enhanced interparticle pores. (c) Photomicrograph showing intraparticle pores in fusulinid with small blocky fringing calcite in the pore spaces. (d) SEM image of intraparticle pores in fusulinid with small blocky calcite fringing cement (bc) in the chambers. (e) Photomicrograph showing syntaxial overgrowth (so) of crinoids and stylolite (st) development. The stylolite (st) postdate the syntaxial overgrowth. (f) Photomicrograph of partially silicified skeletal packstone to mudstone showing partial to complete silicification of grains and matrix, and solution enhanced interparticle pores (to right).
50 µm
50 µm
Silicified Unsilicified
st
st
so
so
bc
42
(a)
(b)
(c)
(d)
(e)
(f)
Figure 9: Photomicrographs showing diagenesis of Upper Leonardian detrital succession. (a) Fusulinid wackestone showing dissolution and subsequent development of blocky calcite cement. (b) Fusulinid wackestone showing solution enhanced interparticle pores and late poikilotopic blocky calcite and dolomite cements filling fracture and interparticle pores. (c) Silica replacement in skeletal grain. (d) Clast-supported polymict conglomerate with late blocky calcite and baroque dolomite (bd) filling dissolution vug. (e) Extensive chemical compaction in mud-lean fusulinid-crinoid packstone resulting in sutured grains (sg). (f) Extensive mechanical and chemical compaction in mud-lean fusulinid-crinoid packstone.
bd
sg
43
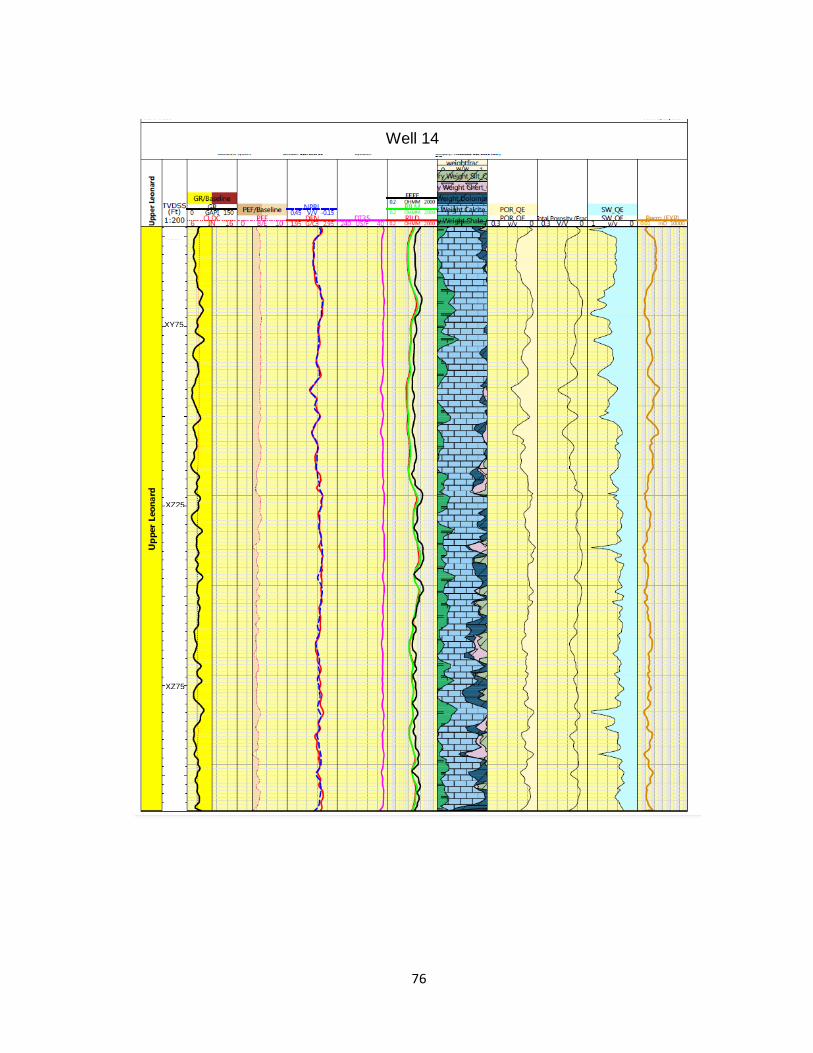
Figure 10: Example of multimineral analysis results from Well 7 showing good match between core measurements and estimated values.
Upper
Leo
nard
ian d
etr
ita
l carb
on
ate
successio
n
XX75
XX25
XY25
44
Figure 11: Upper Leonardian detrital carbonate succession maps. (a) Subsurface map for the base of the succession showing a subtle slope of about 30. (b) Isochore map showing a basin-ward thickening of the interval.
N
Ft
Elevation Depth (Ft)
Ft
NThickness (Ft)
(a)
(b)
-2050
-2250
-2450
45
Figure 12: Subsurface maps. (a) Base of mud-lean fusulinid-crinoid packstone with a subtle slope varying from 2 to 30. The unit is absent in Well 11. (b) Base of clast-supported polymict conglomerate showing relatively steeper slope varying from 1 to 50. Well 11 has thick accumulation of carbonate mudstone and is interpreted to be on the interchannel high.
N
N
Ft (b)
Ft (a)
-2050
-2250
-2450
46
(a)
(b)
Figure 13: Stratigraphic cross-sections. (a) From A to C in Figure 1b. Well 11 has thick vertical accumulation of carbonate mudstone indicating this was probably an unchannelized portion of the slope. (b) From A to B in Figure 1b.
600 ft (183 m)
50 ft
(15 m)
600 ft (183 m)
Base of Upper Leonardian
detrital carbonate succession
50 ft
(15 m)
Base of Upper Leonardian
detrital carbonate succession
600 ft (183 m)
47
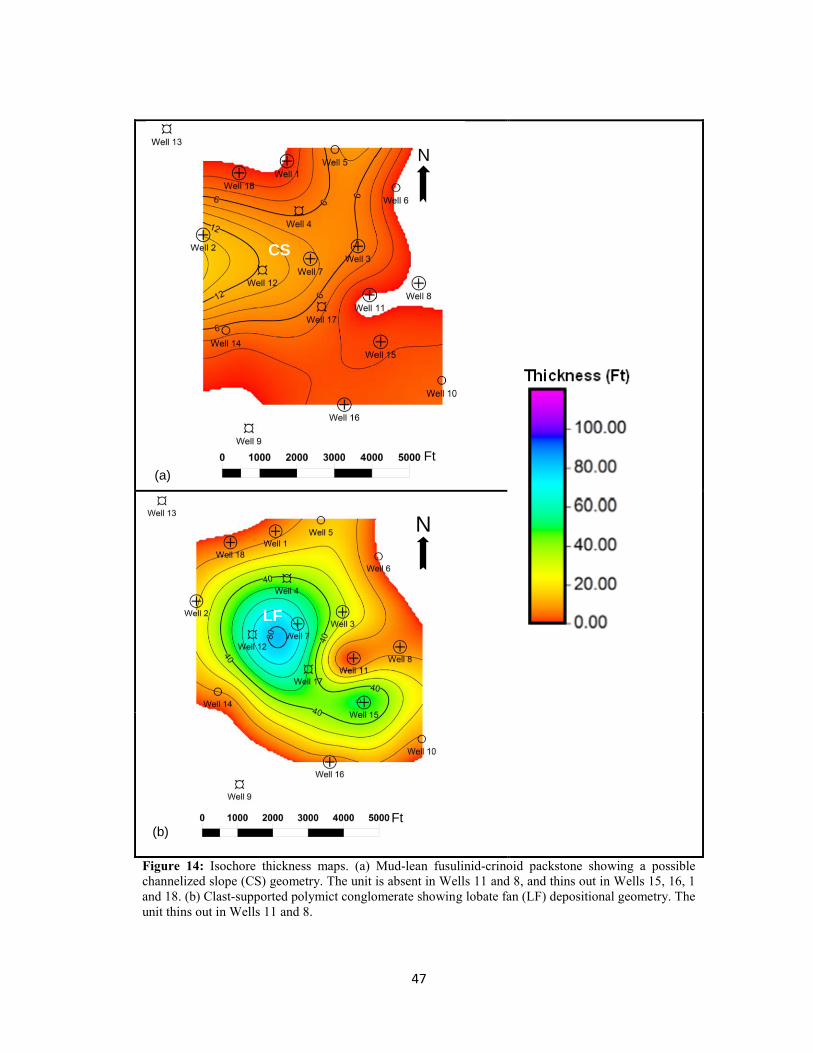
Figure 14: Isochore thickness maps. (a) Mud-lean fusulinid-crinoid packstone showing a possible channelized slope (CS) geometry. The unit is absent in Wells 11 and 8, and thins out in Wells 15, 16, 1 and 18. (b) Clast-supported polymict conglomerate showing lobate fan (LF) depositional geometry. The unit thins out in Wells 11 and 8.
N
N
(a)
Ft
(b) Ft
CS
LF
48
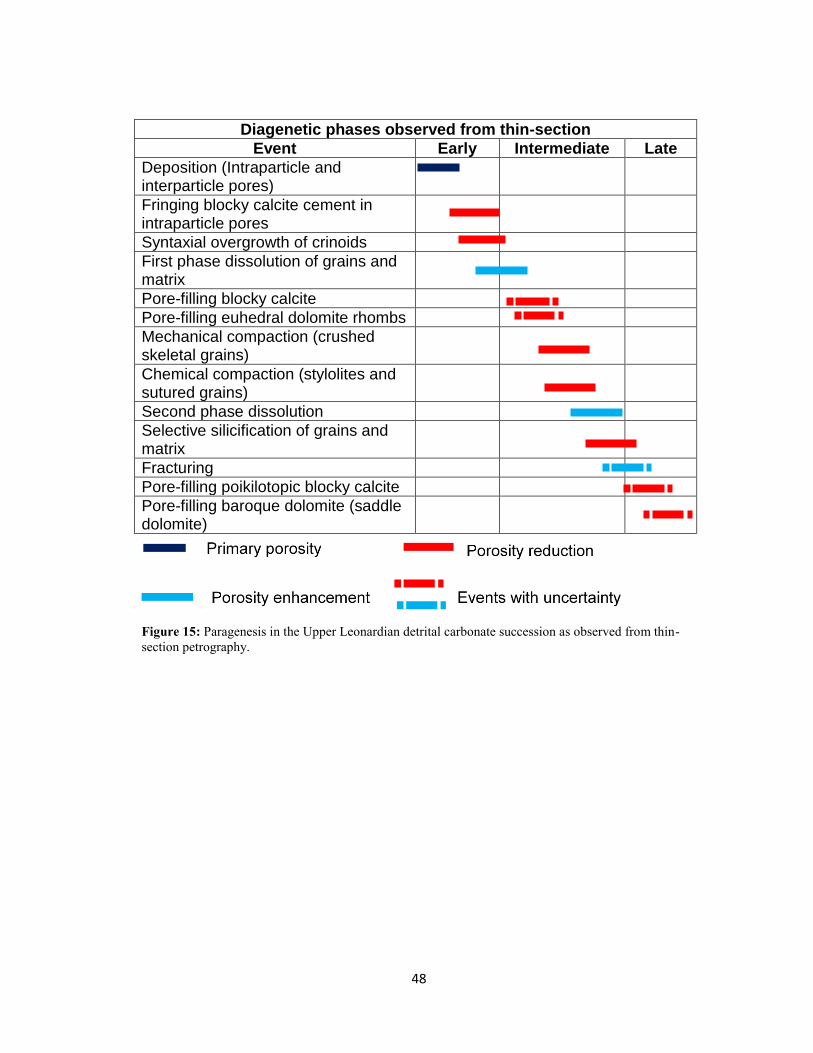
Diagenetic phases observed from thin-section
Event Early Intermediate Late
Deposition (Intraparticle and interparticle pores)
Fringing blocky calcite cement in intraparticle pores
Syntaxial overgrowth of crinoids
First phase dissolution of grains and matrix
Pore-filling blocky calcite
Pore-filling euhedral dolomite rhombs
Mechanical compaction (crushed skeletal grains)
Chemical compaction (stylolites and sutured grains)
Second phase dissolution
Selective silicification of grains and matrix
Fracturing
Pore-filling poikilotopic blocky calcite
Pore-filling baroque dolomite (saddle dolomite)
Figure 15: Paragenesis in the Upper Leonardian detrital carbonate succession as observed from thin-section petrography.
49
(a)
(b)
Figure 16: Average porosity maps. (a) Upper Leonardian detrital carbonate interconnected porosity. (b) Upper Leonardian detrital carbonate total porosity
N
N
Ft
0.14
0.10
0.60
0.20
Ft
50
(a)
(b)
Figure 17: Permeability and water saturation maps. (a) Upper Leonardian detrital carbonate average permeability map. (b) Upper Leonardian detrital carbonate average initial water saturation map.
NPermeability (mD)
N Water saturation (V/V)
Ft
Ft
0
0.4
0.8
51
(a)
(b)
(c)
(d)
(e)
(f)
Figure 18: Cross-plots to illustrate the porosity-permeability relationships. (a) Well 3; (b) Well 7; (c) Well 2; (d) Well 1. (e) Well 15; (f) Well 11. The porosity-permeability plots do not show significant trends.
K = 0.0132e35.243
0.100
1.000
10.000
100.000
1000.000
10000.000
0.01 0.1 1
Pe
rpe
ab
ility
, K
(m
D)
Porosity, ϕ (Fraction)
Well 3
K = 0.0337e38.104ϕ
0.100
1.000
10.000
100.000
1000.000
10000.000
0.01 0.1 1
Pe
rme
ab
ility
, K
(mD
)
Porosity, ϕ (Fraction)
Well 7
K = 0.0347e26.156ϕ
0.100
1.000
10.000
100.000
1000.000
10000.000
0.01 0.1 1
Pe
rme
ab
ility
, K
(m
D)
Porosity, ϕ (Fraction)
Well 2
K = 0.0237e42.335ϕ
0.100
1.000
10.000
100.000
1000.000
10000.000
0.01 0.1 1
Perm
eabili
ty,
K(m
D)
Porosity, ϕ (Fraction)
Well 1
K = 0.0872e16.898ϕ
0.010
0.100
1.000
10.000
100.000
1000.000
10000.000
0.01 0.1 1
Pe
rme
ab
ility
, K
(md
)
Porosity, ϕ(Fraction)
Well 15 K = 0.1196e-3.166ϕ
0.100
1.000
10.000
100.000
1000.000
10000.000
0.01 0.1 1
Pe
rme
ab
ility
, K
(mD
)
Porosity, ϕ(Fraction)
Well 11
Clast-supported polymict conglomerate
Mud-lean fusulinid-crinoid packstone
Fusulinid wackestone
Fusulinid-crinoid packstone
Partially silicified skeletal wackestone to mudstone
Mudstone
Skeletal wackestone
Matrix-supported conglomerate
52
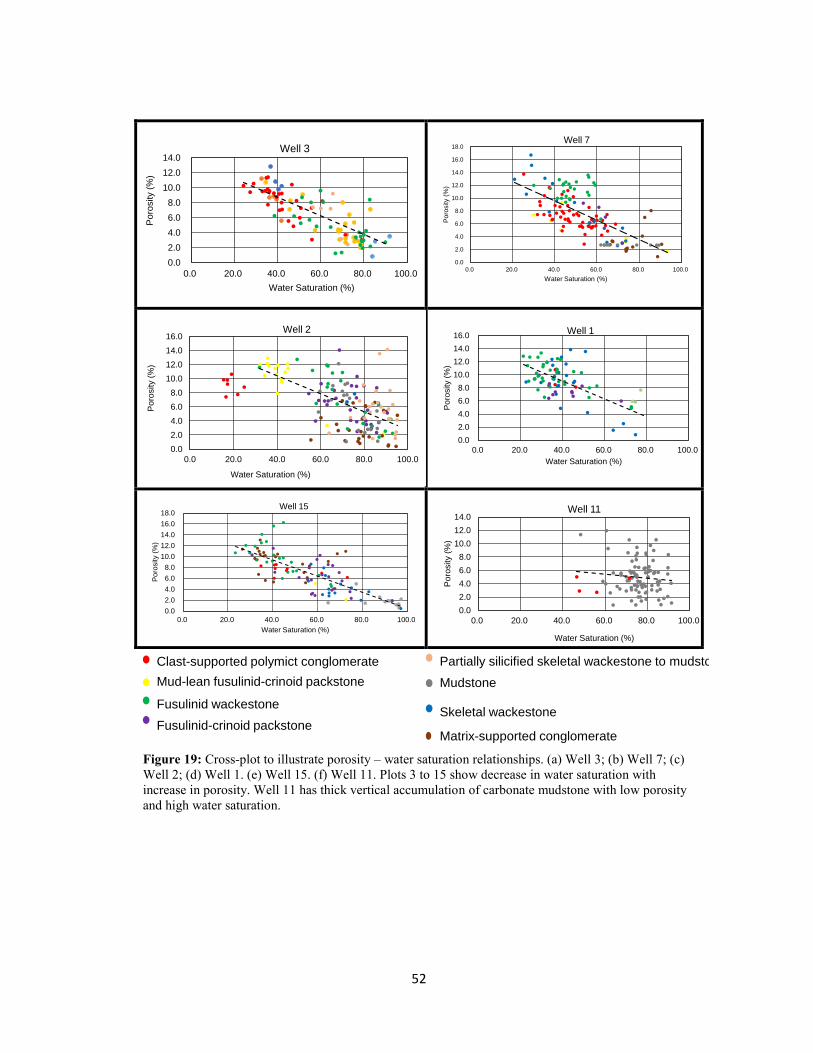
Figure 19: Cross-plot to illustrate porosity – water saturation relationships. (a) Well 3; (b) Well 7; (c) Well 2; (d) Well 1. (e) Well 15. (f) Well 11. Plots 3 to 15 show decrease in water saturation with increase in porosity. Well 11 has thick vertical accumulation of carbonate mudstone with low porosity and high water saturation.
0.0
2.0
4.0
6.0
8.0
10.0
12.0
14.0
0.0 20.0 40.0 60.0 80.0 100.0
Po
rosity (
%)
Water Saturation (%)
Well 3
0.0
2.0
4.0
6.0
8.0
10.0
12.0
14.0
16.0
18.0
0.0 20.0 40.0 60.0 80.0 100.0
Po
rosity
(%)
Water Saturation (%)
Well 7
0.0
2.0
4.0
6.0
8.0
10.0
12.0
14.0
16.0
0.0 20.0 40.0 60.0 80.0 100.0
Po
rosity (
%)
Water Saturation (%)
Well 2
0.0
2.0
4.0
6.0
8.0
10.0
12.0
14.0
16.0
0.0 20.0 40.0 60.0 80.0 100.0P
oro
sity (
%)
Water Saturation (%)
Well 1
0.0
2.0
4.0
6.0
8.0
10.0
12.0
14.0
16.0
18.0
0.0 20.0 40.0 60.0 80.0 100.0
Po
rosity (
%)
Water Saturation (%)
Well 15
0.0
2.0
4.0
6.0
8.0
10.0
12.0
14.0
0.0 20.0 40.0 60.0 80.0 100.0
Po
rosity (
%)
Water Saturation (%)
Well 11
Clast-supported polymict conglomerate
Mud-lean fusulinid-crinoid packstone
Fusulinid wackestone
Fusulinid-crinoid packstone
Partially silicified skeletal wackestone to mudstone
Mudstone
Skeletal wackestone
Matrix-supported conglomerate
53
Figure 20a: Cross-section from well 3 to well 16 (Figure 1b A-C) showing net pay isochore thickness in the Upper Leonardian detrital carbonate succession in Veterans and St. Lawrence Fields, Glasscock County. Track 1 = GR log; Track 2 = Net pay thickness based on interconnected porosity ≥ 7%, CSh < 20%, So ≥ 60%, and permeability ≥ 0.1 mD; Track 3 is based on interconnected porosity ≥ 7%, CSh < 20%, So ≥ 60%, permeability ≥ 0.1 mD, and moveable oil (Sxo – Sw); TUL = Top of Upper Leonardian detrital carbonate succession; TMLFCPS = Top of mud-lean fusulinid-crinoid packstone; TCSPC = Top of clast-supported polymict conglomerate; BCSPC = Base of clast-supported polymict conglomerate; BUL = Base of Upper Leonardian detrital carbonate succession. Well 11 which is interpreted to be on an interchannel high does not have pay.
1 2 3 1 2 3 1 2 3
DatumTULTMLFCPSTCSPC
BCSPC
BUL/BMSC
XY00
XY50
XZ00
XX50
XX00
XX50
XY00
XY50
XW50
XX00
XX50
XY00
1 2 3
XW50
XX00
XX50
54
Figure 20 b: Cross-section from well 3 to well 2 (Figure 1b A-B) showing net pay isochore thickness in the Upper Leonardian detrital carbonate succession in Veterans and St. Lawrence Fields, Glasscock County. Track 1 = GR log; Track 2 = Net pay thickness based on interconnected porosity ≥ 7%, CSh < 20%, So ≥ 60%, and permeability ≥ 0.1 mD; Track 3 is based on interconnected porosity ≥ 7%, CSh < 20%, So ≥ 60%, permeability ≥ 0.1 mD, and moveable oil (Sxo – Sw); TUL = Top of Upper Leonardian detrital carbonate succession; TMLFCPS = Top of mud-lean fusulinid-crinoid packstone; TCSPC = Top of clast-supported polymict conglomerate; BCSPC = Base of clast-supported polymict conglomerate; BUL = Base of Upper Leonardian detrital carbonate succession.
1 2 3 1 2 3 1 2 3
Datum
TUL
TMLFCPS
TCSPC
BCSPC
BUL/BMSC
XY00
XY50
XZ00
XZ50
XX00
XX50
XY00
XY50
XW50
XX00
XX50
XY00
55
(a)
(b) Figure 21: Upper Leonardian detrital carbonate succession net pay isochore thickness maps. (a) based on interconnected porosity ≥ 7%, CSh < 20%, So ≥ 60%, and permeability ≥ 0.1 m. Based on these cut-offs Wells 11, 8, 16, 9 and 10 do not have pay. (b) based on interconnected porosity ≥ 7%, Csh < 20%, So ≥ 60%, permeability ≥ 0.1 mD, and moveable oil (Sxo – Sw). Based on the moveable oil saturation, there is a decrease in net pay thickness of almost 60 ft. (18.29 m) in Well 4.
Ft
N
0
40
80
Thickness (Ft)
Ft
N
56
APPENDIX 2
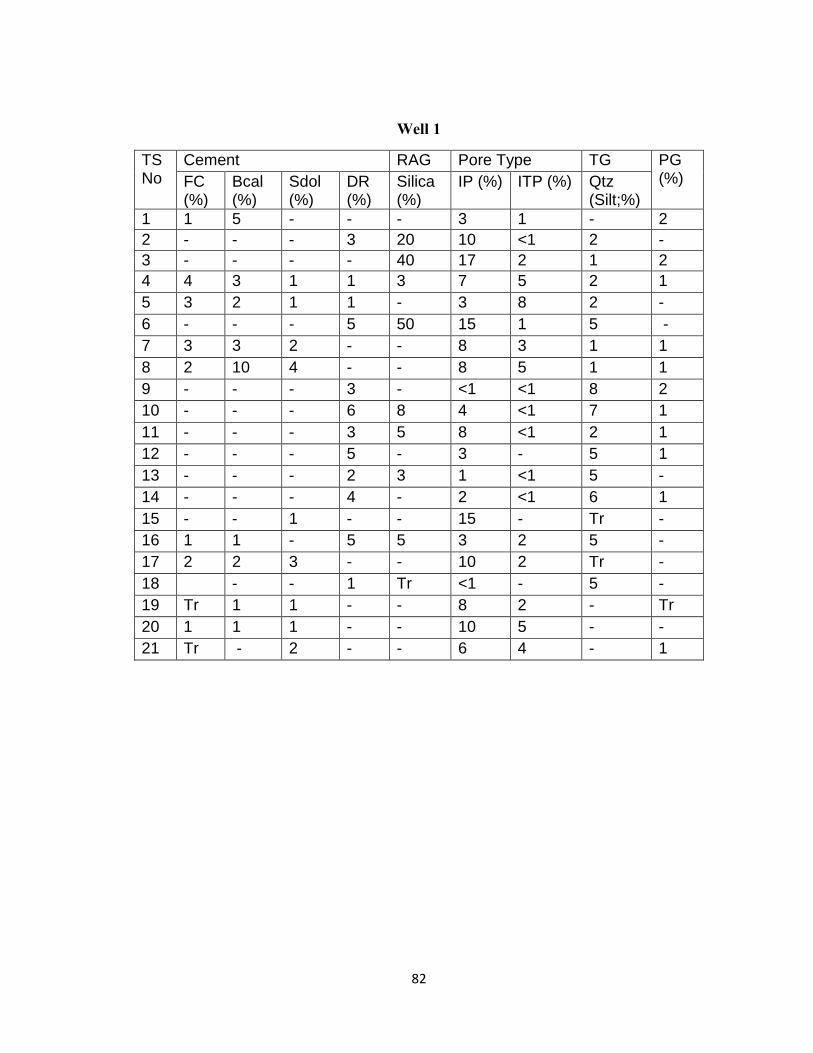
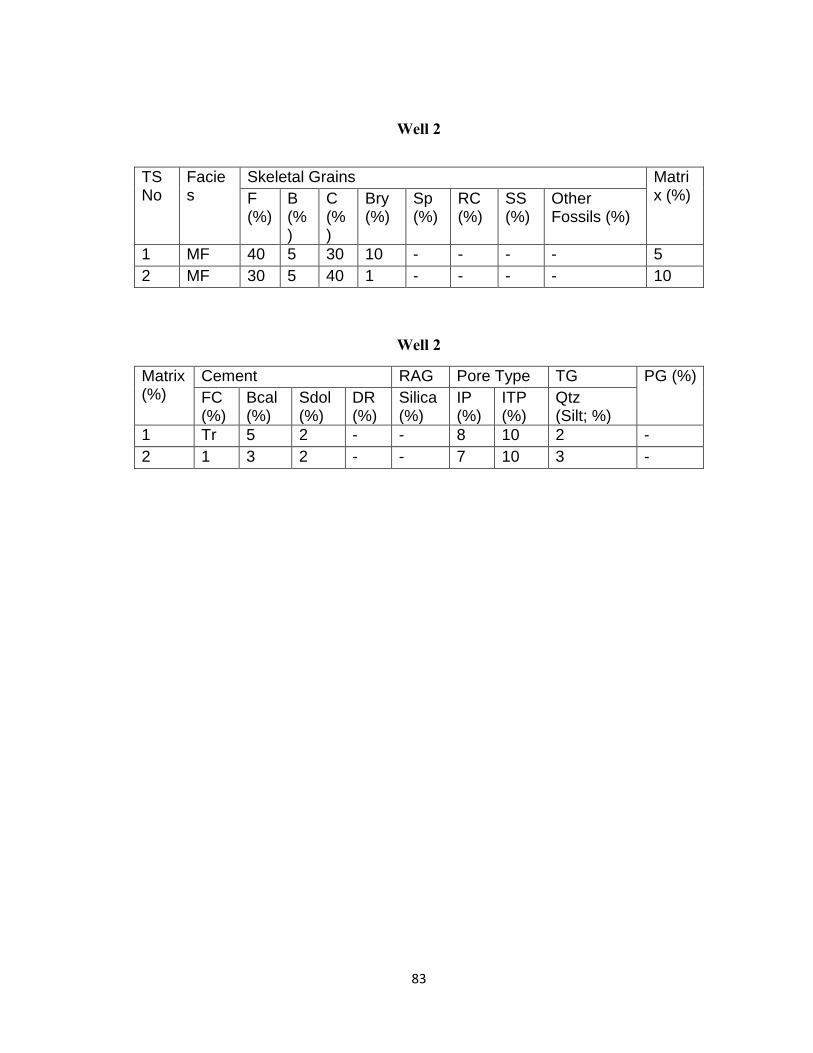
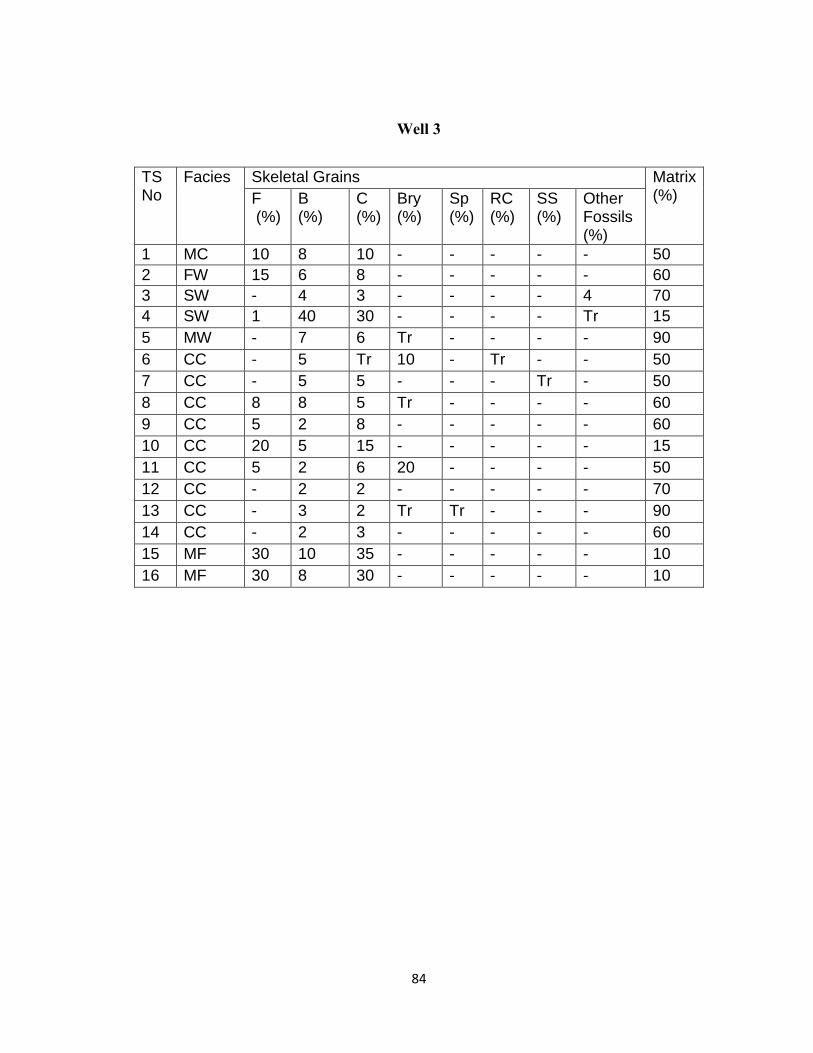
TABLES
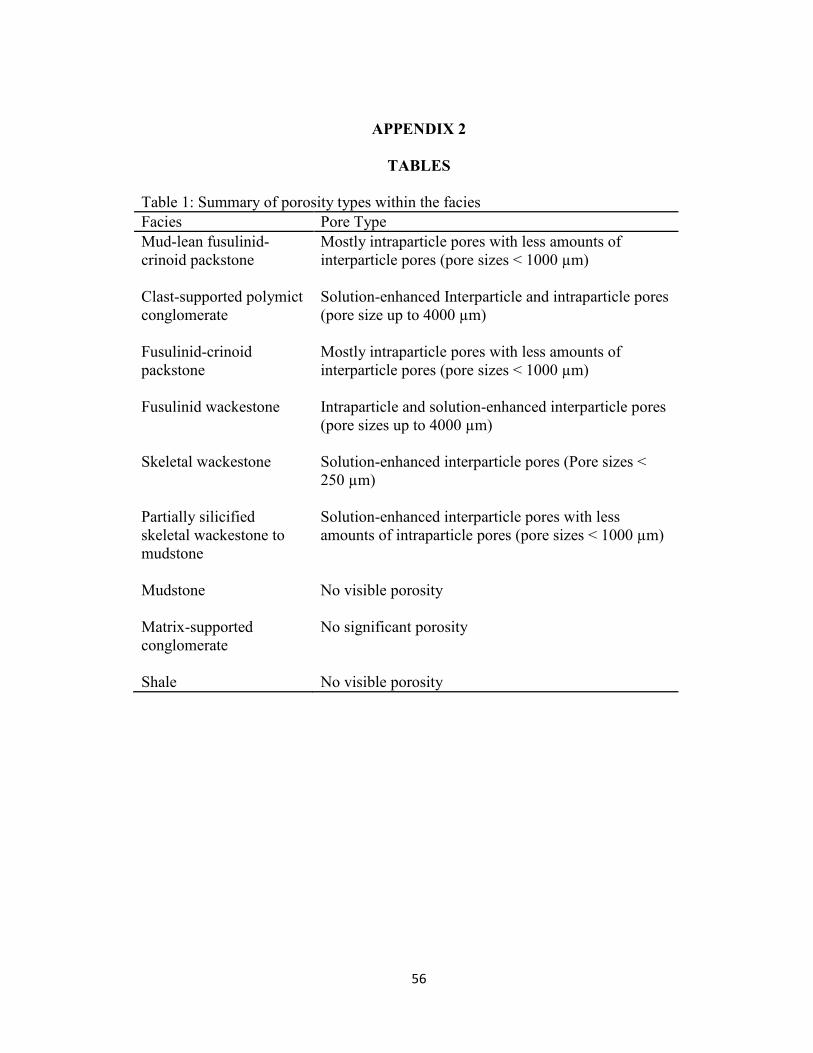
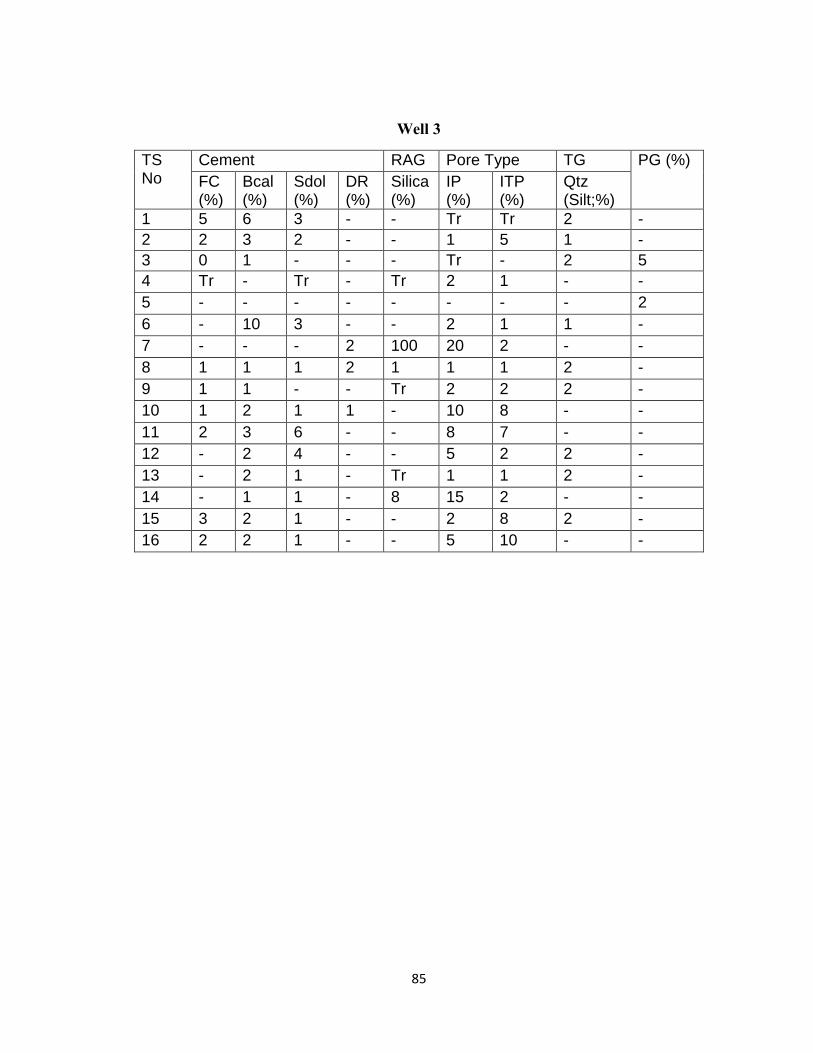
Table 1: Summary of porosity types within the facies Facies Pore Type Mud-lean fusulinid-crinoid packstone
Mostly intraparticle pores with less amounts of interparticle pores (pore sizes < 1000 µm)
Clast-supported polymict conglomerate
Solution-enhanced Interparticle and intraparticle pores (pore size up to 4000 µm)
Fusulinid-crinoid packstone
Mostly intraparticle pores with less amounts of interparticle pores (pore sizes < 1000 µm)
Fusulinid wackestone Intraparticle and solution-enhanced interparticle pores (pore sizes up to 4000 µm)