77
- - - - - - - - - - - Guam Power Authority Integrated Resource Plan FY 2013 February 22, 2013 Guam Power Authority PO Box 2977 Hagåtña, GUAM 96932

-----------
Guam Power Authority Integrated Resource Plan
FY 2013 February 22, 2013
Guam Power Authority PO Box 2977
Hagåtña, GUAM 96932


EXECUTIVE SUMMARY Guam Power Authority 2013 Integrated Resource Plan
I
EXECUTIVE SUMMARY
Guam Power Authority (GPA) develops its Integrated Resource Plan (IRP) to provide the lowest cost solution for:
• Providing reliable, affordable power;
• Diversifying power supply resources and fuels to mitigate risk; and
• Exercising environmentally responsible stewardship of the economic and natural resources of the island of Guam.
Integrated Resource Planning is an exercise in strategic and capital planning. This type of planning is an ongoing cycle of activity. It does not end with the submission of a report. Business situations change and new challenges arise continually. Therefore, the planning process must remain dynamic, ongoing, and mindful of new information and technologies as they become available. Additionally, the IRP must be congruent with other studies conducted by the organization, such as environmental plans, cost-of-service studies, strategic plans, etc.
The major strategic issues driving the development of this IRP include the following:
• GPA must increase its fuel diversity, mitigate fuel supply risk, and encourage cost-effective renewable energy;
• GPA must comply with existing and future United States Environmental Protection Agency requirements including but not limited to: EGU MACT, RICE MACT, new one-hour SO2 NAAQS;
• GPA must understand and consider the financial and operational impacts associated with compliance and non-compliance with existing and future United States Environmental Protection Agency in all of its business and operational planning;
• GPA must support the electric power service requirements for the impending Department of Defense (DOD) build-up and its economic consequences;
• GPA must evaluate the economic feasibility of retiring or extending the life of its existing generation units;

EXECUTIVE SUMMARY Guam Power Authority 2013 Integrated Resource Plan
II
• GPA must work to reduce customer outages due to the instantaneous loss of generation. GPA must examine the operational and economic feasibility of using energy storage devices or requiring certain reliability enhancement characteristics for future generation additions; and
• GPA must understand how the acquisition of new electric energy supply will affect human resource requirements and GPA’s business model;
The primary recommendations of this IRP include:
• Obtain an agreement between the United States (USEPA) and Guam Environmental Protection Agencies to suspend compliance with the RICE MACT for Cabras 3&4 and MEC 8&9 until GPA completes transition to LNG;
• Procure an additional 40 MW of renewable energy resources under the Phase II Renewable Energy Acquisition Program, if cost-competitive with other available technologies, as early as 2017 to reduce present value costs;
• Develop the necessary infrastructure and contracts to engender the transition from residual fuel oil to Liquefied Natural Gas (LNG) by 2018 or sooner;
• Retire Marbo CT and Dededo Diesels 1-4 by FY 2014;
• Firm up the decision by the end of FY 2014 to retire the Cabras 1 & 2 and/or Tanguisson 1&2 units in 2018 concurrent with the availability of LNG;
• Based upon baseload retirement decisions, construct a new 60 to 120 MW gas-fired combined cycle power plant, preferably in northern Guam to reduce technical line losses, online concurrent with the availability of LNG in 2018;
• If GPA makes the decision not to retire Cabras 1&2 or Tanguisson 1&2, complete conversion of these units to burn natural gas concurrent with the availability of LNG in 2018;
• Complete repowering Piti 7 GE Frame 6B combustion turbine generator (CTG) into a combined cycle burning natural gas concurrent with the availability of LNG in 2018;
• Complete conversion of the Cabras 3 & 4 and MEC Piti 8 & 9 units to burn natural gas concurrent with the availability of LNG in 2018;
• If economically and technically feasible, build a 10 MW Geothermal unit to come online in 2019; and
• Work towards compliance with all new environmental standards and regulations.

EXECUTIVE SUMMARY Guam Power Authority 2013 Integrated Resource Plan
III
Other recommendations of this IRP include:
• Ensure that all generation plants meet the performance standards agreed with the Guam Public Utilities Commission (Guam PUC);
• Implement automated economic dispatch and unit commitment to optimize fuel use;
• Work collaboratively with the Guam PUC and stakeholders to improve GPA’s financial position relative to obtaining funding for these projects;
• Continue to investigate geothermal potential for Guam;
• Continue to investigate other resource options including Ocean Thermal Energy Conversion (OTEC), Sea Water Air Conditioning (SWAC) and other technologies;
• Work with the Guam PUC to establish the rules of engagement and rates for net metering;
• Work with the Guam PUC on implementing economically and socially viable Demand-Side Management (DSM) Programs as none of the projects evaluated by R.W. Beck pass the Rate Impact Measure (RIM) Test;
• Examine supplying natural gas for industrial, commercial, and residential use as a utility under the Consolidated Commission on Utilities (CCU) and the Guam PUC;
• Finalize the disposition of assets currently under Independent Power Producers including the possible retirement of Tanguisson power plant and the transition of these power plants to operation under Performance Management Contracts (PMC) or Independent Power Producers (IPP);
• Consider a business model using competitive bidding where GPA generates immediate cash from the sale of assets currently held under expiring Energy Conversion Agreements to Independent Power Producers while simultaneously awarding long-term power purchase agreements to these IPPs; and
• Work with Guam Waterworks Authority (GWA) on an interruptible load arrangement in order to hedge against the risk of higher than baseline load growth.
Table E-1 shows the potential net present value savings of the top three
generation expansion scenario plans. These plans indicate net present value savings greater than one billion dollars for a GPA conversion from residual fuel oil to liquefied

EXECUTIVE SUMMARY Guam Power Authority 2013 Integrated Resource Plan
IV
natural gas. Tables E-2 through E-4 illustrate capex requirements for the three expansion plans.
Table E-1, Potential Savings of Diversifying to LNG
CASE Retirement UnitsPV Utility Costs
($000)
Present Value Variance
(Savings) from Base Case ($000)
1 None 6,451,778 BASE CASE
2 Marbo, Dededo Diesel, Cabras 1&2 5,258,080 (1,193,698)
3 Marbo, Dededo Diesel, Tanguisson 1&2 5,311,525 (1,140,253)
4 Marbo, Dededo Diesel, Cabras 1&2, Tanguisson 1&2 5,241,317 (1,210,462)
5 Marbo, Dededo Diesel, Dededo CT 1&2, Yigo, Macheche 5,348,209 (1,103,570)
6 Marbo, Dededo Diesel, Dededo CT 1&2, Yigo 5,354,665 (1,097,114)
7 Marbo, Dededo Diesel, Dededo CT 1&2 5,360,709 (1,091,069)
8 Marbo, Dededo Diesel 5,388,596 (1,063,182)
CASE Retirement UnitsInitial Screening Assumptions1
Test Assumptions2
1 None BASE CASE BASE CASE
2 Marbo, Dededo Diesel, Cabras 1&2 (1,193,698) (1,204,930)
3 Marbo, Dededo Diesel, Tanguisson 1&2 (1,140,253) (1,146,924)
4 Marbo, Dededo Diesel, Cabras 1&2, Tanguisson 1&2 (1,210,462) (1,201,425)
5 Marbo, Dededo Diesel, Dededo CT 1&2, Yigo, Macheche (1,103,570)
6 Marbo, Dededo Diesel, Dededo CT 1&2, Yigo (1,097,114)
7 Marbo, Dededo Diesel, Dededo CT 1&2 (1,091,069)
8 Marbo, Dededo Diesel (1,063,182)
2 Testing assumptions evaluate results based on removal of initial screening assumptions.
Present Value Variance (Savings) from Base Case ($000)
1 Initial screening assumptions include additional operation costs for intermittent renewable options (solar and wind) and the availability of geothermal potential.

EXECUTIVE SUMMARY Guam Power Authority 2013 Integrated Resource Plan
V
Avoided Compliance Costs due to Retirement or Fuel Conversion by Scenario ($000)
Retirement Fuel Conversion Total
2 Cabras 1&2 Retirement 161,300 300,000 461,300
3 Cabras 1&2 and Tango Retirement 221,300 240,000 461,300
4 Tanguisson Retirement 61,300 400,000 461,300
Avoided Compliance Costs1 ($000)
1 Avoided compliance costs assumes that GPA would be allowed to defer compliance of RICE MACT for Slow Speed Diesel units and BOILER MACT (MATS) for Steam units until LNG is available in 2018.
Case Retirement Units
Table E-2, Recommended Capital Requirements (thru 2020) – Tanguisson Retirement
Complete / Commission
By FY Description Project Period
IWPS Capacity Impact (MW)
Life Extension
($000)
Fuel Conversion / New Construction
($000)EPA Compliance
($000)Total CAPEX
($000)2013 Retire Marbo CT and Dededo CT - 26 MW $ - $ - $ - $ - 2014 Life Extension & Environmental
Compliance for Peaking Units 1 2013 - 2014 - 24,220$ $ - 7,150$ $ 31,370
2015 Environmental Compliance for Baseload Plant 2 2013 - 2015 - $ - 13,002$ $ 13,002
2018 Life Extension of Baseload Plants (Excluding Cabras 1&2 & Tanguisson)
2014 - 2019 - 9,680$ $ - $ - $ 9,680
Solar PV 2014 - 2017+ 20 MW
(2x10MW) $ 90,000 $ 90,000
Wind 2014 - 2017 + 20 MW $ 93,000 $ 93,000 LNG Import Terminal & Gasification Facility3 2013 - 2018 - $ 212,000 $ 212,000
TEMES CT Repower as Combined Cycl e4 & LNG Conversion
2014 - 2018+ 20 MW(capacity increase)
$ 81,000 $ 81,000
New Combined Cycle4 Units (2 Each) 2014 - 2018 + 60 MW $ 128,400 $ 128,400
Cabras 3 LNG Conversion 2014 - 2018 - $ 13,560 $ 13,560 Cabras 4 LNG Conversion 2014 - 2018 - $ 13,560 $ 13,560 MEC 8 LNG Conversion 2014 - 2018 - $ 13,711 $ 13,711 MEC 9 LNG Conversion 2014 - 2018 - $ 13,711 $ 13,711
Retire Tanguisson 1 & 2- 53 MW
(-2x26.5MW) $ -
TOTAL: 33,900$ 658,942$ 20,152$ 712,994$
LNG Related Costs: 475,942$ Renewable Costs: 183,000$
NOTES:1
2
3
4 Combined Cycle reference is a Combustion Turbine (CT) which ties in a Heat Recovery Steam Generator (HRSG) to its exhaust. The HRSG used in this reference is an additional 20 MW which increases plant efficiency since no additional fuel is used for power generated through the HRSG.
2017
2018
Peaking Units are the following diesel fueled combustion turbine and diesel engine units which are primarily used for peak hours or during maintenance of baseload units: Dededo CT 1&2, Macheche CT, Yigo CT, Marbo CT, Dededo Diesel Units 1-4, Tenjo Diesel Units 1-6, Talofofo Diesel Units 1-2, Manenggon Diesel Units 1-2 and Piti 7 (TEMES).Baseload Plants refer to the high sulfur fuel oil fueled plants which primarily dispatched first due to fuel costs. These plants include Cabras 1&2, Cabras 3&4, Piti 8&9 (MEC), and Tanguisson 1&2.This is the total construction cost of the facility, however GPA will evaluate other contracting options to minimize cost impact.

EXECUTIVE SUMMARY Guam Power Authority 2013 Integrated Resource Plan
VI

EXECUTIVE SUMMARY Guam Power Authority 2013 Integrated Resource Plan
VII
Table E-3, Recommended Capital Requirements (thru 2020) – Cabras 1&2 Retirement
Complete / Commission
By FY Description Project Period
IWPS Capacity Impact (MW)
Life Extension
($000)
Fuel Conversion / New Construction
($000)EPA Compliance
($000)Total CAPEX
($000)2013 Retire Marbo CT and Dededo CT - 26 MW $ - $ - $ - $ - 2014 Life Extension & Environmental
Compliance for Peaking Units 1 2013 - 2014 - 24,220$ $ - $ 7,150 $ 31,370
2015 Environmental Compliance for Baseload Plant 2 2013 - 2015 - $ - $ 13,002 $ 13,002
2018 Life Extension of Baseload Plants (Excluding Cabras 1&2)
2014 - 2019 - $ 6,340 $ - $ - $ 6,340
Solar PV 2014 - 2017+ 20 MW
(2x10MW) $ 90,000 $ 90,000
Wind 2014 - 2017 + 20 MW $ 93,000 $ 93,000 LNG Import Terminal & Gasification Facility3 2013 - 2018 - $ 212,000 $ 212,000
TEMES CT Repower as Combined Cycl e4 & LNG Conversion
2014 - 2018+ 20 MW(capacity increase)
$ 81,000 $ 81,000
New Combined Cycle4 Unit 2014 - 2018 + 60 MW $ 128,400 $ 128,400 Cabras 3 LNG Conversion 2014 - 2018 - $ 13,560 $ 13,560 Cabras 4 LNG Conversion 2014 - 2018 - $ 13,560 $ 13,560 MEC 8 LNG Conversion 2014 - 2018 - $ 13,711 $ 13,711 MEC 9 LNG Conversion 2014 - 2018 - $ 13,711 $ 13,711
Retire Cabras 1 & 2- 132 MW
(-2x66MW) $ -
Tanguisson 1 LNG Conversion5 2014-2018 - $ 16,817 $ 16,817
Tanguisson 2 LNG Conversion5 2014-2018 - $ 16,817 $ 16,817 TOTAL: 30,560$ 692,576$ 20,152$ 743,288$
LNG Related Costs: 509,576$ Renewable Costs: 183,000$
NOTES:1
2
3
4
5
2017
2018
2019
Tanguisson Units would either need to convert or retire since it would the only remaining plant on RFO requiring GPA to maintain fuel storage and inventory for three fuels.
Baseload Plants refer to the high sulfur fuel oil fueled plants which primarily dispatched first due to fuel costs. These plants include Cabras 1&2, Cabras 3&4, Piti 8&9 (MEC), and Tanguisson 1&2.This is the total construction cost of the facility, however GPA will evaluate other contracting options to minimize cost impact.
Combined Cycle reference is a Combustion Turbine (CT) which ties in a Heat Recovery Steam Generator (HRSG) to its exhaust. The HRSG used in this reference is an additional 20 MW which increases plant efficiency since no additional fuel is used for power generated through the HRSG.
Peaking Units are the following diesel fueled combustion turbine and diesel engine units which are primarily used for peak hours or during maintenance of baseload units: Dededo CT 1&2, Macheche CT, Yigo CT, Marbo CT, Dededo Diesel Units 1-4, Tenjo Diesel Units 1-6, Talofofo Diesel Units 1-2, Manenggon Diesel Units 1-2 and Piti 7 (TEMES).

EXECUTIVE SUMMARY Guam Power Authority 2013 Integrated Resource Plan
VIII
Table E-4, Recommended Capital Requirements (thru 2020) – Cabras 1&2 and Tanguisson Retirement
Complete / Commission
By FY Description Project Period
IWPS Capacity Impact (MW)
Life Extension
($000)
Fuel Conversion / New Construction
($000)EPA Compliance
($000)Total CAPEX
($000)2013 Retire Marbo CT and Dededo CT - 26 MW $ - $ - $ - $ - 2014 Life Extension & Environmental
Compliance for Peaking Units 1 2013 - 2014 - 24,220$ $ - $ 7,150 $ 31,370
2015 Environmental Compliance for Baseload Plant 2 2013 - 2015 - $ - $ 13,002 $ 13,002
2018 Life Extension of Baseload Plants (Excluding Cabras 1&2 & Tanguisson)
2014 - 2019 - $ 2,680 $ - $ - $ 2,680
Solar PV 2014 - 2017+ 20 MW
(2x10MW) $ 90,000 $ 90,000
Wind 2014 - 2017 + 20 MW $ 93,000 $ 93,000 LNG Import Terminal & Gasification Facility3 2013 - 2018 - $ 212,000 $ 212,000
TEMES CT Repower as Combined Cycl e4 & LNG Conversion
2014 - 2018+ 20 MW(capacity increase)
$ 81,000 $ 81,000
New Combined Cycle4 Units (2 Each) 2014 - 2018 + 120 MW(2x 60MW)
$ 256,800 $ 256,800
Cabras 3 LNG Conversion 2014 - 2018 - $ 13,560 $ 13,560 Cabras 4 LNG Conversion 2014 - 2018 - $ 13,560 $ 13,560 MEC 8 LNG Conversion 2014 - 2018 - $ 13,711 $ 13,711 MEC 9 LNG Conversion 2014 - 2018 - $ 13,711 $ 13,711
Retire Cabras 1 & 2- 132 MW
(-2x66MW) $ -
Retire Tanguisson 1 & 2- 53 MW
(-2x26.5MW) $ -
TOTAL: 26,900$ 787,342$ 20,152$ 834,394$
LNG Related Costs: 604,342$ Renewable Costs: 183,000$
NOTES:1
2
3
4 Combined Cycle reference is a Combustion Turbine (CT) which ties in a Heat Recovery Steam Generator (HRSG) to its exhaust. The HRSG used in this reference is an additional 20 MW which increases plant efficiency since no additional fuel is used for power generated through the HRSG.
2018
2017
Peaking Units are the following diesel fueled combustion turbine and diesel engine units which are primarily used for peak hours or during maintenance of baseload units: Dededo CT 1&2, Macheche CT, Yigo CT, Marbo CT, Dededo Diesel Units 1-4, Tenjo Diesel Units 1-6, Talofofo Diesel Units 1-2, Manenggon Diesel Units 1-2 and Piti 7 (TEMES).Baseload Plants refer to the high sulfur fuel oil fueled plants which primarily dispatched first due to fuel costs. These plants include Cabras 1&2, Cabras 3&4, Piti 8&9 (MEC), and Tanguisson 1&2.This is the total construction cost of the facility, however GPA will evaluate other contracting options to minimize cost impact.

TABLE OF CONTENTS Guam Power Authority 2013 Integrated Resource Plan
i
TABLE OF CONTENTS 1 SITUATION ANALYSIS .................................................................................................................... 1-3
1.1 INTRODUCTION TO GPA ............................................................................................................... 1-3 1.2 HISTORICAL PERIOD SINCE THE LAST INTEGRATED RESOURCE PLAN .......................................... 1-3
1.2.1 Looking Forward ................................................................................................................. 1-4 1.3 STRATEGIC ISSUES ....................................................................................................................... 1-4 1.4 LOAD FORECAST .......................................................................................................................... 1-6 1.5 ENERGY CONVERSION AGREEMENTS ........................................................................................... 1-7 1.6 PERFORMANCE MANAGEMENT CONTRACTS ................................................................................ 1-8 1.7 NEAR-TERM GENERATION ADDITION .......................................................................................... 1-9
1.7.1 Long-Term Generation Reliability....................................................................................... 1-9 1.7.2 Environmental Constraints .................................................................................................. 1-9 1.7.3 Generation Mix and Load Shape ......................................................................................... 1-9
1.8 FUEL ISSUES ............................................................................................................................... 1-11 1.8.1 Comprehensive Fuel Management Planning Requirement................................................ 1-12 1.8.2 Fuel Use by Type and the Associated Cost ........................................................................ 1-12
1.9 GENERATION RETIREMENT ........................................................................................................ 1-14 1.10 RISK ........................................................................................................................................... 1-15
1.10.1 Planning Risk ..................................................................................................................... 1-15 1.10.2 Financial Risk .................................................................................................................... 1-15 1.10.3 Regulatory Risk.................................................................................................................. 1-16
2 SCOPE OF WORK AND APPROACH ................................................................................................. 2-1
2.1 SCOPE OF WORK........................................................................................................................... 2-1 2.2 APPROACH ................................................................................................................................... 2-2
2.2.1 Review Planning Environment ......................................................................................... 2-2 2.2.2 Develop Inputs & Assumptions ............................................................................................ 2-3 2.2.3 Ensure Adequate Load & Resource Balance ....................................................................... 2-3 2.2.4 Define Candidate List .......................................................................................................... 2-3 2.2.5 Determine Effects on Reliability of the Retirement of Existing Generation Units ............... 2-4 2.2.6 Determine Optimal Portfolio ............................................................................................... 2-4 2.2.7 Determine Diversified Resource Mix ................................................................................... 2-4 2.2.8 Select Preferred Portfolio .................................................................................................... 2-4 2.2.9 Stakeholder Process ............................................................................................................ 2-4
3 FUTURE POWER REQUIREMENTS .................................................................................................. 3-1
3.1 THE ECONOMETRIC MODEL ......................................................................................................... 3-1 3.2 SUMMARY OF LOAD FORECAST SCENARIOS ................................................................................. 3-3
3.2.1 Baseline Forecast Assumptions ........................................................................................... 3-4 3.2.2 Alternative Forecast Assumptions ....................................................................................... 3-6
4 FUTURE FUEL COSTS & CHOICES FOR GPA ..................................................................................... 4-1
5 ENVIRONMENTAL CONSIDERATIONS ............................................................................................ 5-1
5.1 NATIONAL AMBIENT AIR QUALITY STANDARD (NAAQS) .......................................................... 5-1 5.1.1 Sulfur Dioxide, SO2 ............................................................................................................. 5-1 5.1.2 Nitrogen Dioxide, NO2 ........................................................................................................ 5-2 5.1.3 Particulate Matter, PM ........................................................................................................ 5-2
5.2 MAXIMUM ACHIEVABLE CONTROL TECHNOLOGY (MACT) ........................................................ 5-2
TABLE OF CONTENTS Guam Power Authority 2013 Integrated Resource Plan
ii
5.2.1 Steam Electric Generation, “Boiler MACT” ....................................................................... 5-3 5.2.2 Reciprocating Internal Combustion Engines, “RICE MACT” ............................................ 5-4
6 RELIABILITY ASSESSMENT .............................................................................................................. 6-2
6.1 OBJECTIVE ................................................................................................................................... 6-2 6.2 GENERATION UNIT RETIREMENT EFFECTS ON GENERATION SYSTEM RELIABILITY ..................... 6-2
6.2.1 PICES Analysis Results ....................................................................................................... 6-3 6.2.2 Increasing Generation Unit Availability versus Generation Capacity Addition ................. 6-4
6.3 RELIABLE DELIVERY OF POWER ................................................................................................... 6-5
7 SUPPLY SIDE OPTIONS ................................................................................................................... 7-1
7.1 INTRODUCTION ............................................................................................................................. 7-1 7.2 EXISTING UNITS ........................................................................................................................... 7-3
7.2.1 Boiler/STG Units ................................................................................................................. 7-3 7.2.2 Slow Speed Reciprocating Units .......................................................................................... 7-7 7.2.3 Medium Speed Reciprocating Units .................................................................................. 7-12 7.2.4 Combustion Turbine Generators ....................................................................................... 7-16
7.3 NEW UNITS ................................................................................................................................ 7-22
8 DEMAND SIDE MANAGEMENT ...................................................................................................... 8-1
8.1 INTRODUCTION ............................................................................................................................. 8-1 8.2 INTRODUCTION AND DESCRIPTION OF STUDY .............................................................................. 8-3 8.3 APPROACH AND METHODOLOGY .................................................................................................. 8-4
8.3.1 Technical Screening Assessment ......................................................................................... 8-4 8.3.2 Economic Screening Analysis .............................................................................................. 8-4 8.3.3 DSM Measure Assumptions ................................................................................................. 8-5 8.3.4 GPA Cost Assumptions ........................................................................................................ 8-6 8.3.5 DSM Benefit-Cost Tests ....................................................................................................... 8-7
8.4 RESULTS ....................................................................................................................................... 8-8
9 KEY RESULTS .................................................................................................................................. 9-1
9.1 KEY RESULTS ............................................................................................................................... 9-1 9.2 NEW GENERATION PLANT SITING ....................................................................................................... 9-6 9.3 LNG/NATURAL GAS REDUNDANT STORAGE FACILITY CONSIDERATIONS ................................................... 9-7 9.4 RENEWABLES ................................................................................................................................... 9-7
10 RECOMMENDATIONS .............................................................................................................. 10-1
11 NEXT STEPS .............................................................................................................................. 11-1
11.1 ROLE OF THE PUBLIC UTILITIES COMMISSION ............................................................................ 11-1 11.2 ACQUISITION PROCESS ............................................................................................................... 11-2
APPENDICES ............................................................................................................................................. A
A LOAD FORECAST .................................................................................................................................. A B ENVIRONMENTAL STRATEGIC PLAN ..................................................................................................... B C CAPACITY RESERVE ANALYSIS ............................................................................................................ C D DEMAND SIDE MANAGEMENT ..............................................................................................................D E IRP STRATEGIST SCENARIO ANALYSIS ................................................................................................ E F BIBLIOGRAPHY ..................................................................................................................................... F G ACKNOWLEDGEMENTS ........................................................................................................................ G

SITUATION ANALYSIS Guam Power Authority 2013 Integrated Resource Plan
1-3
1 Situation Analysis 1.1 Introduction to GPA
Guam Power Authority (GPA) is a public corporation and an enterprise fund of the Government of Guam. The Guam Power Authority Act of 1968 established GPA in May 1968. Guam Code 12 Chapter 8 sets the legal definitions, empowerments and limitations for GPA.
The Consolidated Commission on Utilities (CCU), a five member elected board of directors, administers GPA. The directors are elected for staggered four-year terms. Additionally, GPA is regulated by the Guam Public Utilities Commission (Guam PUC).
GPA had 48,512 customers at the end of FY 2012. GPA’s fiscal year budgets for 2012 and 2013 are $400.6 and $413.5 million, respectively. The fuel budget comprises about 76% of the total budget. GPA’s highest peak system demand is 281.5 MW.
GPA is a full service electric utility. It generates, transmits, and distributes electric energy from its various power generation resources to individual customers. GPA has an installed generation capacity of 552 MW gross including 181 MW from Independent Power Producers (IPPs). GPA has organized 210 MW of its baseload capacity under two Performance Management Contracts (PMCs). These contracts provide private management using public employees to operate and maintain the plants. These contracts contain performance-based incentives for reducing plant operating costs. Furthermore, GPA has installed 663 miles of transmission and distribution lines and operates 29 substations throughout the island.
Although, budgeted for 592 Full-Time Employees (FTE's) and 24 Apprentices in Fiscal Year 2012, GPA had filled only 542 full time employee billets as of October 1, 2012. GPA has an apprenticeship program recognized and licensed by the U.S. Bureau of Labor. Apprentices do not count towards the FTE count.
1.2 Historical Period since the Last Integrated Resource Plan
In its Fiscal Year 2008 Integrated Resource Plan, GPA foresaw high near term-economic growth due to the military buildup. Looking back since then, historical system peak and energy demand have actually decreased, due to the prolonged economic downturn, tourism declines related to the economy and to the March 2011 Japan earthquake and tsunami, and other various factors affecting usage. Recommendations made in the FY 2008 plan have been modified and updated based on the recent planning activities.

SITUATION ANALYSIS Guam Power Authority 2013 Integrated Resource Plan
1-4
1.2.1 Looking Forward
This IRP forms a significant part of GPA’s near- and long-term business planning activities. Most importantly, GPA’s planning activities look at strategic management decisions such as:
• Maintaining GPA as a financially stable, operationally efficient entity that can meet its customers’ needs and expectations to provide high quality energy services at affordable prices.
• From organizational, operational, and financial perspectives, understanding and planning for changes in future customer demand, sales, revenues
• Serving the people of Guam in an environmentally friendly manner that complies with the requirements of the U.S. Environmental Protection Agency (U.S. EPA) and Guam Environmental Protection Agency (GEPA).
1.3 Strategic Issues
GPA faces several issues affecting its ability to meet strategic long-term goals as an organization and provider of quality, affordable and reliable energy services to the people of Guam. The major strategic issues driving the development of this plan include the following:
GPA must increase its fuel diversity, mitigate fuel supply risk, and gain more renewable energy.
GPA must comply with existing and future United States Environmental Protection Agency requirements including but not limited to: EGU MACT, RICE MACT, new one-hour SO2 NAAQS and understand the financial and operational impacts associated with non-compliance.
GPA must support the electric power service requirements for the impending Department of Defense (DOD) build-up and its economic consequences.
GPA must evaluate the economic feasibility of retiring or extending the life of its existing generation units.
GPA must work to reduce customer outages due to the instantaneous loss of generation. GPA must examine the operational and economic feasibility of using energy storage devices or requiring certain reliability enhancement characteristics for future generation additions. GPA must understand how the acquisition of new electric energy supply will affect human resource requirements and GPA’s business model.
Providing a resource mix that results in affordable, reliable, and environmentally responsible and cost-effective power drives this IRP effort. Along those lines, GPA

SITUATION ANALYSIS Guam Power Authority 2013 Integrated Resource Plan
1-5
considers increasing GPA’s generation fuel diversity of paramount importance. The rising and volatile cost of fuel oil impacts the affordability of electric energy and saps working capital from operations and capital investments into fuel inventory. Additionally, having a non-diversified fuel base places GPA’s customers at a higher risk for supply disruption. Furthermore, dollars spent by customers for fuel oil are almost entirely spent outside the local economy. As a result, this money does not result in a multiplicative effect within the Guam community, the way other local purchases on the island typically do. Finally, new environmental compliance requirements on oil-fired generation will require large capital outlays and increase operations and maintenance costs.
Renewable sources of energy may allow for more of these dollars to trickle into the local economy. As an island people, the results of greenhouse gases contributing to climate change are clearly evident in the shrinking coastlines of Guam and our island neighbors. Choosing resources that reduce pollution and are sustainable over the long-term seems to be the right choice for Guam. Beyond the issues of pollution and sustainability is the issue of cost. GPA is facing significant environmental regulation –related costs if it continues to burn oil in the manner it currently does. GPA does not want to pass these costs on to customers when there may be a way to provide cleaner, more affordable power.
In addition to having a resource mix with greater fuel diversity and a better environmental impact, the generation resources must address changes to our local economy, demand patterns, and population growth. Tourism growth triggered the economic boom of the nineties. GPA grew from a 156 MW to a 281.5 MW peaking utility in less than a decade. The engine for next decade of economic growth on Guam will likely continue to be tourism but also there will be an impact related to the DOD build-up and its diverse consequences to the civilian community. GPA must have a plan in place that will work for a variety of military buildup possible outcomes. This plan must address changes in timing and level of infrastructure buildup while maintaining affordable, reliable power to its existing customers.
GPA’s current generation portfolio faces a series of challenges. Many of the units will require significant investment, care, and attention if they are going to continue to operate well into the future. GPA must evaluate the benefits and costs of keeping existing units operational or retiring them vs. adding new resources.
GPA has a long-term goal of improving reliability and reducing outages. Any resource added to or removed from the system must not negatively impact GPA’s ability to provide reliable power. GPA also is evaluating the costs and benefits of system enhancements such as battery storage systems and devices to improve system inertia. In addition to these non-generating technologies, as GPA evaluates new units, it examines how these resources will affect system reliability and the costs associated with maintaining adequate reserves.
Acquisition of new diversified electric energy supply has implication on human resource requirements and operation of the system. GPA staff is not familiar with many

SITUATION ANALYSIS Guam Power Authority 2013 Integrated Resource Plan
1-6
of these new technologies. GPA must consider whether new electric supply assets will depend entirely on external labor sources or whether Guam needs to grow the labor pool necessary to support these operational requirements. Furthermore, GPA’s business model includes its own generation with internal staffing, independent power producers with external staffing, and performance management contracts with mixed staffing. Additionally, there are private sector advantages in execution and tax credit eligibility. Public sector advantages include Federal Emergency Management Agency (FEMA) and government grant eligibility and in general, lower costs of borrowing money. Using the business model to provide the greatest value for customers is a strategic concern.
1.4 Load Forecast
GPA’s baseline forecast indicates that Guam will not be leaving a period of flat economic growth for a number of years. Additionally, forecast scenarios considering the impacts of the military build-up consistent with today’s information show a much smaller impact on electric power demand than in the 2008 IRP. Figure 1-1 provides a graph illustrating the forecast scenarios.
P.L. Mangilao developed low and high tourism and infrastructure development economic scenarios. The resulting scenario forecasts include an “EPA Delay”, low tourism-high infrastructure (L&H), high tourism-low infrastructure (H&L), and high tourism-high infrastructure. These forecasts are discussed in Section 3, and in more detail in P.L. Mangilao’s report1.
1 The GPA Sales and Load Forecasting Process Documentation, 2012, P.L. Mangilao, LLC

SITUATION ANALYSIS Guam Power Authority 2013 Integrated Resource Plan
1-7
260
270
280
290
300
310
320
330
2001 2003 2005 2007 2009 2011 2013 2015 2017 2019 2021 2023 2025
Dem
and
(MW
)
Fiscal Year
Forecast Scenarios: Peak Demand
Actual
Baseline
EPA Delay
H&L
L&H
H&H
Figure 1-1, Load Forecast Scenarios
1.5 Energy Conversion Agreements
In FY 1997, GPA committed to Energy Conversion Agreements (ECA) with Hawaiian Electric Industries, Inc. (HEI), Marianas Electric Company (MEC), and Taiwan Electric and Mechanical Engineering Services (TEMES). HEI took over GPA’s Tanguisson Power Plant. MEC constructed the Piti 8&9 slow speed diesel plant. TEMES constructed Piti 7, a 40 MW combustion turbine. Ownership of the Tanguisson plant ECA has changed from HEI to Mirant and from Mirant to Pruvient. MEC ownership has changed from Tomen Bank and Enron to Osaka Gas and Arclight, and finally solely to Osaka Gas. TEMES ownership remains the same. These contracts are for twenty-year terms. Table 1-1 indicates nominal generation capacities, and the effective and termination dates for the ECA contracts.
GPA is in an era of "contracted competition." GPA must measure its generation system performance against the performance and cost achieved by the ECA contractors.

SITUATION ANALYSIS Guam Power Authority 2013 Integrated Resource Plan
1-8
1.6 Performance Management Contracts
GPA decided to use PMCs to improve baseload plant reliability and efficiency. GPA staff recognized that GPA did not have sufficient plant management, technical, and plant operation acumen resident at GPA to run its baseload facilities well. Keeping many of these skill sets full-time at GPA is economically prohibitive. Additionally, GPA already had difficulty recruiting to fill technical and professional positions. Also, GovGuam procurement does not support an operations environment well. GovGuam procurement issues often result in prolonged unit outages. Furthermore, GPA recognized the need for better, consistent training of its plant staff. Finally, staff foresaw that performance-based compensation would best drive exemplary performance and better protect the ratepayer from poor performance.
Using these salient points, GPA staff engaged management about the opportunity to use a contracted management team to manage, maintain, and operate its baseload plants. GPA worked with two consultants2 to flesh out the details of applying staff concepts and entered into a collaborative development of a PMC for Cabras 1&2 with the Guam Public Utilities Commission. All Authority baseload plants are now under the management of PMCs. These contracts have resulted in increased plant efficiencies and availabilities. A GPA whitepaper filed with the Guam Public Utilities Commission indicated that the PMC business model achieved a benefit-cost ratio of seven.
Table 1-1, ECA Summary
Plant IPP Plant
Capacity (MW)
Contract Effective
Date
Contract Termination
Date
Piti Unit 7 (Combustion Turbine) TEMES 40 December 1997
December 2017
Piti Unit 8&9 (Slow Speed Diesel) MEC3 88 January 1999
January 2019
Tanguisson Unit 1&2* (Steam) Pruvient4 53 August 1997
August 2017
2 Larry R. Noyes of New Energy Associates in Atlanta, Georgia and Dave L. Rogers of Information2Energy. 3 Contract was originally under Enron Development Piti Corporation which changed its name to Marianas Energy Company (MEC). 4 Contract has been reassigned two times. HEI (Hawaii Electric Industries Inc.) was the first IPP then Mirant.

SITUATION ANALYSIS Guam Power Authority 2013 Integrated Resource Plan
1-9
1.7 Near-Term Generation Addition
GPA must make prudent decisions for near-term generation additions in light of its expectation for electric demand. Uncertainties in DOD planning and approval of funding by Congress and the administration provide many elements of risk.
1.7.1 Long-Term Generation Reliability
GPA has conducted this plan with reliability improvements in mind. All resource decisions, whether they include new resources or enhancement s to existing facilities must be made with reliability improvement as a goal. Existing resources have been examined and plans have been developed to improve performance, reduce outages, and extend expected service lives. Routine, comprehensive maintenance must be performed on all existing and new resource facilities to reap the full benefits of the investments to be made and provide the most value to GPA customers.
1.7.2 Environmental Constraints
GPA faces severe new environmental restrictions related to air emissions and other environmental constraints which affect its ability to add baseload capacity.
The U.S. Environmental Protection Agency (EPA) has taken several actions to strengthen the National Ambient Air Quality Standards (NAAQS). These new standards will have significant effects on how GPA will be able to operate its units and the amount of air pollutants coming from its plants. Three primary pollutants: sulfur dioxide (SO2), nitrogen dioxide (NO2), and particulate matter (PM), will be the focus of the NAAQS compliance efforts for Guam.
Three recently promulgated standards for Maximum Achievable Control Technology (MACT) applicable to GPA will have significant effects on how GPA will be able to operate its units and the amount of metals, chloride, and carbon monoxide emissions coming from its plants. Two primary types of generation, steam and reciprocating engine technologies will be the focus of the MACT compliance efforts for Guam. The impact on GPA’s operations and associated costs are discussed in more detail in the Environmental Considerations section of this report. For a comprehensive discussion of environmental compliance issues, please read GPA’s Environmental Strategic Plan.
1.7.3 Generation Mix and Load Shape
All of GPA’s generation resources are oil-fired. This presents several strategic problems for GPA, concerning cost, volatility, and environmental impacts. While oil-fired generation may have been a prudent choice in the past because oil was inexpensive and environmental costs manageable, that is no longer the case.

SITUATION ANALYSIS Guam Power Authority 2013 Integrated Resource Plan
1-10
GPA has a mix of peaking, baseload, and intermediate generation units. Peaking unit technologies are relatively inexpensive and quick to install but expensive to operate. Therefore they are ideally operated only during system peak demand periods or as reserve units in the absence of reliable baseload capacity. Efficient baseload units require much longer permitting and construction lead times. However, they possess much higher capital requirements for installation but are less expensive to operate. Intermediate units have unit characteristics between peaking and baseload. Table 1-2 describes the characteristics of these unit operating modes and technologies.
Table 1-2, Duty Cycles and Capacity Factors5
Generating
Unit Capacity Factor
(%) Generic Characteristics
Duty Cycle Nominal Range Cost Performance Other
Baseload 65 50-85 Higher capital cost;
lower fuel cost; lower maintenance cost
High availability;
high efficiency
Long construction lead times
Intermediate
30
20 – 50
Intermediate-to-higher capital cost;
intermediate fuel cost
Increased output
flexibility
Generally long construction lead times
Peaking
10
1-20
Lower capital cost; higher fuel cost;
higher maintenance cost
Increased output
flexibility; quick starting
Short construction
lead time
GPA's current generation mix has substantial number of diesel-fired peaking plants stemming from the need to add capacity in the early 1990s. In the last few years, GPA has not relied heavily on diesel-fired generation to produce electric energy.
Guam's year-round tropical climate and tourism-based economy results in a relatively flat load shape with high load factor, meaning average load is relatively close to peak load as compared to other utility systems. Such characteristics tend to favor baseload technology additions since operation near the peak is the norm. As an example, Figure 1-2 shows the GPA average demand hourly load shape for March 17, 2012 and May 7, 2012. GPA’s FY 2012 system peak occurred on May 7, 2012. The smallest daily peak occurred on March 17, 2012. Note that GPA requires peaking capacity for only four hours for about 15 to 19 MW incremental peak. The system trough occurs between 3 am and 6 am. Beginning at noon through the late afternoon, the GPA system plateaus until the system peak. These features are fairly consistent throughout the year.
5 1993 EPRI Technology Assessment Guide Volume 1: Electricity Supply. Table 2-1

SITUATION ANALYSIS Guam Power Authority 2013 Integrated Resource Plan
1-11
Figure 1-2, GPA Average Hourly Generation Requirements
1.8 Fuel Issues
Fuel choice and usage by GPA are complicated issues. Fuel costs are revenue neutral. GPA passes fuel costs through to customers in the Levelized Energy Adjustment Clause (LEAC) rate, Fuel costs, now comprises over two-thirds of residential electric power bills. Fuel issues facing GPA include:
Fuel price volatility;
Risk of fuel supply disruption;
Increasing fuel diversity;
Stiffening environmental regulations;
Fuel hedging; and
Prudent fuel use and inventory.
GPA has carefully considered these fuel issues in the development of this IRP. The IRP seeks to help GPA reach its strategic goals related to fuel diversification, environmental impacts of fuel use, and keeping costs down for its customers.

SITUATION ANALYSIS Guam Power Authority 2013 Integrated Resource Plan
1-12
1.8.1 Comprehensive Fuel Management Planning Requirement
The CCU has directed management to plan for fuel purchases. This directive has the following challenges:
The availability of baseload generation impacts fuel use dramatically;
Generator failures are random; they can be analyzed statistically, but cannot necessarily be predicted;
Fuel purchase minimums must reflect expected unit dispatch but contain market and fuel management costs; and
Fuel purchase maximum must reflect agreed upon contingencies.
The fuel purchase planning process must be in alignment with the generation expansion plan. Fuel purchase planning must investigate fuel use under the assumption of expected or targeted operation modes as well as operation modes under various unit failure contingencies. GPA must plan for a bandwidth of operation and provide acceptable minimum and maximum fuel purchase limits.
1.8.2 Fuel Use by Type and the Associated Cost
GPA uses residual fuel oil and ultralow diesel in its power plants. Figure 1-3 illustrates GPA historical fuel prices for high and low sulfur residual fuel oil and for ultra-low sulfur diesel.
High sulfur fuel oil (HSFO) limits sulfur content to 2%. Low sulfur fuel oil (LSFO) limits sulfur content to 1.19%. The United States Environmental Protection Agency has granted GPA a 325 (a) waiver based upon installation and operation of the Cabras-Piti Area Intermittent Control Strategy (CPAICS). GPA switches to the more expensive low sulfur fuel whenever winds blow inland.
In 2010, GPA facilitated a stakeholder process consisting of USEPA, GEPA, representatives from Guam’s transportation and heavy equipment industry, fuel providers, vehicle and equipment suppliers, the United States Navy, the Defense Logistics Agency, and others to support a move towards using low sulfur for Guam. GPA and this stakeholder group testified for a Guam Legislative Committee in support of a bill requiring Guam to move away from 5000 ppm diesel to ultralow sulfur 15 ppm diesel. Upon passage of this bill into law, GPA started using ultralow diesel fuel since January 2011. Figure 1-3 illustrates historical fuel prices per barrel for each fuel type.

SITUATION ANALYSIS Guam Power Authority 2013 Integrated Resource Plan
1-13 1-13
Figure 1-3, Historical Fuel Prices for Diesel and Residual Fuel Oil (Blended HSFO & LSFO weighted average)
SITUATION ANALYSIS Guam Power Authority 2013 Integrated Resource Plan
1-14
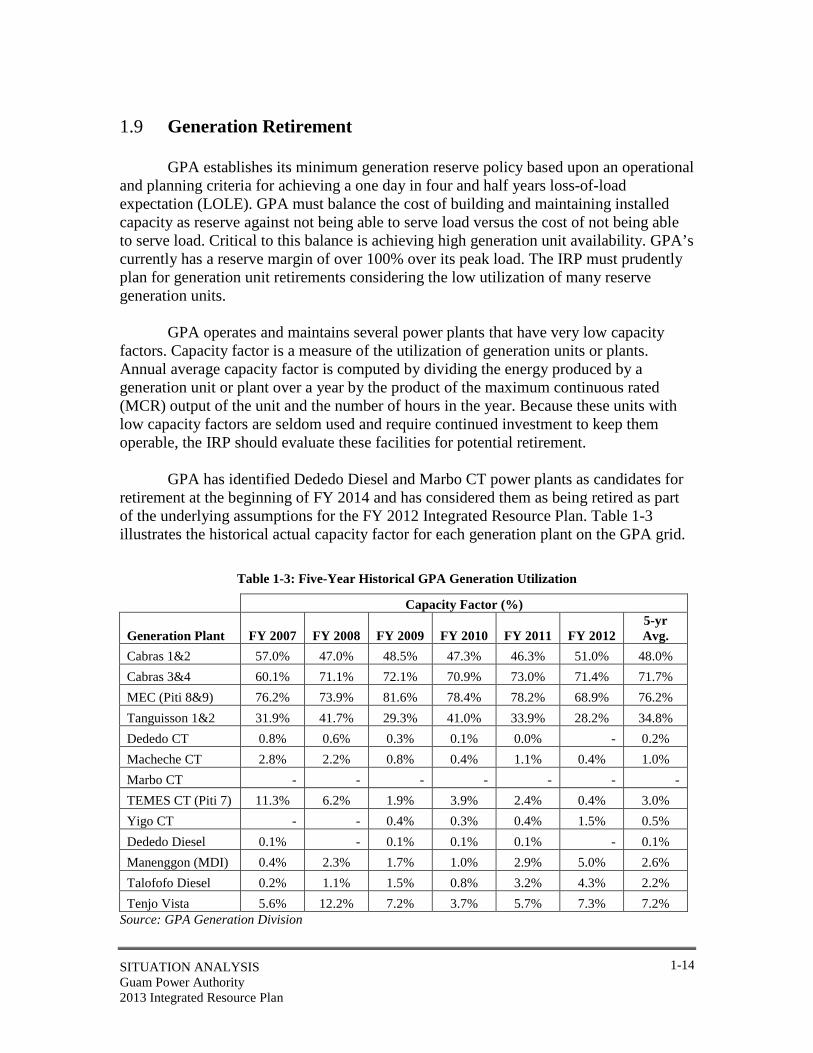
1.9 Generation Retirement GPA establishes its minimum generation reserve policy based upon an operational
and planning criteria for achieving a one day in four and half years loss-of-load expectation (LOLE). GPA must balance the cost of building and maintaining installed capacity as reserve against not being able to serve load versus the cost of not being able to serve load. Critical to this balance is achieving high generation unit availability. GPA’s currently has a reserve margin of over 100% over its peak load. The IRP must prudently plan for generation unit retirements considering the low utilization of many reserve generation units.
GPA operates and maintains several power plants that have very low capacity
factors. Capacity factor is a measure of the utilization of generation units or plants. Annual average capacity factor is computed by dividing the energy produced by a generation unit or plant over a year by the product of the maximum continuous rated (MCR) output of the unit and the number of hours in the year. Because these units with low capacity factors are seldom used and require continued investment to keep them operable, the IRP should evaluate these facilities for potential retirement.
GPA has identified Dededo Diesel and Marbo CT power plants as candidates for
retirement at the beginning of FY 2014 and has considered them as being retired as part of the underlying assumptions for the FY 2012 Integrated Resource Plan. Table 1-3 illustrates the historical actual capacity factor for each generation plant on the GPA grid.
Table 1-3: Five-Year Historical GPA Generation Utilization
Capacity Factor (%)
Generation Plant FY 2007 FY 2008 FY 2009 FY 2010 FY 2011 FY 2012 5-yr Avg.
Cabras 1&2 57.0% 47.0% 48.5% 47.3% 46.3% 51.0% 48.0% Cabras 3&4 60.1% 71.1% 72.1% 70.9% 73.0% 71.4% 71.7% MEC (Piti 8&9) 76.2% 73.9% 81.6% 78.4% 78.2% 68.9% 76.2% Tanguisson 1&2 31.9% 41.7% 29.3% 41.0% 33.9% 28.2% 34.8% Dededo CT 0.8% 0.6% 0.3% 0.1% 0.0% - 0.2% Macheche CT 2.8% 2.2% 0.8% 0.4% 1.1% 0.4% 1.0% Marbo CT - - - - - - - TEMES CT (Piti 7) 11.3% 6.2% 1.9% 3.9% 2.4% 0.4% 3.0% Yigo CT - - 0.4% 0.3% 0.4% 1.5% 0.5% Dededo Diesel 0.1% - 0.1% 0.1% 0.1% - 0.1% Manenggon (MDI) 0.4% 2.3% 1.7% 1.0% 2.9% 5.0% 2.6% Talofofo Diesel 0.2% 1.1% 1.5% 0.8% 3.2% 4.3% 2.2% Tenjo Vista 5.6% 12.2% 7.2% 3.7% 5.7% 7.3% 7.2%
Source: GPA Generation Division

SCOPE OF WORK AND APPROACH Guam Power Authority 2013 Integrated Resource Plan
1-15
1.10 Risk
GPA must consider several risks to creating and executing upon the recommendations of the IRP including: planning risk, financial risk, and regulatory risk. GPA must institutionalize uncertainty and risk management throughout all its planning: operational, financial, medium-range, and long-range.
1.10.1 Planning Risk
Long-term electric power supply planning must consider risk. As part of the planning process, the utility needs to forecast loads, sales, economic variables, and revenues. Additionally, it must forecast the capital, fixed, and variable costs for various power supply candidates. The longer the forecast, the greater the risk for divergence from what may actually transpire.
In order to plan well, GPA needs to consider scenario planning. “Scenario planning, which considers adaptive behavior under alternative futures, is uniquely suited for identifying and categorizing unknown utility risks.”6
In addition to forecast risk, the volatility of fuel prices and tightening of supply for crude oil is of great concern and threatens the affordability of electricity on Guam. It is also having an enormous financial impact as free cash flows are being diverted to fuel inventory. This run-up on fuel price is pushing the drive to fuel diversity and the introduction of renewable energy.
1.10.2 Financial Risk
There are several chronic financial concerns that may affect GPA’s ability to meet its resource planning goals:
• Low cash on hand, low debt service coverage ratios and high debt to equity ratios;
• GPA's growing long-term Bond debt and associated financial obligations; and
• GPA’s credit rating.
GPA’s available cash on hand is much lower than the comparable utilities and generally does not follow standard industry practice. At the end of FY 12, GPA reported approximately 46 days of cash on hand. GPA would like to reach a long-term goal of 60 days cash on hand.
6 Karyl B. Leggio, David L. Bodde, and Marilyn L. Taylor. “Managing Enterprise Risk: What the Electric Industry Experience Implies for Contemporary Business.” Oxford, U.K.: Elsevier Ltd. 2006. page 14.
SCOPE OF WORK AND APPROACH Guam Power Authority 2013 Integrated Resource Plan
1-16
According to a report commissioned in 2009, GPA had an equity ratio at that time, based on equity to total capitalization calculation basis, of approximately 22% (a debt to total capitalization of 78%). “If GPA wishes to obtain consistent long-term investment-grade ratings and reduce its financial risk profile, it is incumbent on the utility to increase its system equity level as part of its capital funding needs. A higher level of system equity will benefit GPA and its customers by reducing debt and associated debt service costs needed to fund capital expansion and system improvements over the long-run.”7
As GPA’s long-term fixed debt obligations continue to grow, GPA will have less financial flexibility to deal with unexpected occurrences, such as equipment failures, weather events, etc., while at the same time continuing to execute on its capital improvement plans, including resource planning activities. As more money is tied up with fixed debt service obligations, less money is available for unexpected occurrences and programs and projects get delayed or abandoned. Executing on its capital improvement planning in a timely, consistent manner has been a challenge for GPA over the years, due to a lack of financial and personnel resources.
Meeting GPA’s stated goals of improving debt service coverage ratios, increasing cash on hand, and lowering its debt to equity ratios will move GPA towards its strategic goal of obtaining secure investment-grade credit ratings, which will enable GPA both to better access financial markets and to lower its future debt costs. If GPA is unable to fulfill its debt service coverage obligations, its credit rating will fall further, and it may be in default of its bond covenants.
1.10.3 Regulatory Risk
Federal and local legislation regarding environmental and utility policy may have a large impact upon the choice of competing planning portfolios. The concerns are well founded and fundamentally affect the economics of the addition of certain types of generation. Also, the ability of GPA to recover its operational and future investment costs through rates set by the Guam PUC is of concern. Without sufficient rate-based revenues, GPA cannot make necessary investments to improve reliability and customer service, mitigate environmental impacts, and lower fuel costs, among other strategic goals.
7 Working Capital and Cash Reserve Financial Analysis, R. W. Beck, Inc., December 2009, page 1-2.

DEMAND FORECAST Guam Power Authority 2013 Integrated Resource Plan
2-1
2 Scope of Work and Approach 2.1 Scope of Work
This IRP study is part of a regular cycle of overall utility and strategic planning. As part of the IRP, GPA has investigated the following issues related to critical near-term and potential long-term strategic decisions:
• The need for future generation capacity or the need to change to a different mix of generation resource options;
• Effects of generation retirements singly and in combination;
• Effects of compliance with new requirements of the United States Environmental Protection Agency;
• Benefits and costs of potential demand side management (DSM) options including sea water air conditioning/cooling;
• Effects of meeting the required renewable portfolio standards
• Analysis of the efficacy of energy storage devices to ameliorate the impact of intermittent renewable energy additions and known existing system stability issues; and
• Identify an optimized short- and long-term generation expansion plan which considers reliability, cost, and diversification goals.
In preparing this report, GPA and its consultants have made certain assumptions
with respect to the conditions which may exist or events which may occur in the future. While we believe these assumptions to be reasonable for the purpose of this study, they are dependent upon future events, and actual conditions may differ from those assumed. In addition, we have relied upon certain information provided to us by others. While we believe the use of such information and assumptions to be reasonable for the purposes of this study, we offer no other assurances with respect thereto, and some assumptions may vary significantly due to unanticipated events and circumstances. To the extent that actual future conditions differ from those assumed herein or provided to us by others, the actual results will vary from those projected herein.

DEMAND FORECAST Guam Power Authority 2013 Integrated Resource Plan
2-2
GPA has combined a comprehensive analytical approach and stakeholder input and direction in its development of this IRP.
2.2 Approach
As part of the analytical approach, GPA completed the following tasks:
• Reviewed planning environment and established parameters to guide analysis;
• Developed planning, scenario, and modeling inputs and assumptions;
• Ensured adequate load and resource balance by comparing demand forecast and current and future resource assumptions;
• Defined candidate resource options, including supply-side and demand-side management options;
• Explored and characterized the effects to reliability of generation retirement singly and in combination using the Probabilistic Investigation of Capacity and Energy Shortages (PICES) tool;
• Used the capacity expansion optimization tool STRATEGIST to determine the optimal portfolio of least cost options that eliminates annual capacity deficits according to capacity reserve margin requirements;
• Used scenario analyses to help determine a diversified resource mix that is robust across the range of alternative demand and fuel price outcomes;
• Selected a preferred portfolio using evaluation criteria: Cost, risk, system reliability, and environmental impact.
2.2.1 Review Planning Environment
GPA considers several of its long-term stated strategic goals, including fuel diversification and meeting renewable portfolio standards, in this IRP by including both conventional thermal and renewable generation options as candidate resources, as well as considering alternative fuel types. In addition to the option of adding various types of renewables in the future, such as biomass, solar, wind, and ocean thermal energy conversion, GPA is in the process of acquiring approximately 40 MW of long-term renewable power, both solar and wind resources, and those resources are included as part of the study beginning in year 2013. GPA also focused on evaluating options that might help it meet its strategic goal of fuel diversification. Liquefied Natural Gas (LNG) was considered as an alternative fuel type for both GPA’s existing oil-fired resources (which would be converted to burn natural gas) as well as new combined cycle options. These

DEMAND FORECAST Guam Power Authority 2013 Integrated Resource Plan
2-3
strategic goals of diversification and renewable standards helped define and shape the options evaluated and the options chosen to represent the optimal portfolio.
2.2.2 Develop Inputs & Assumptions
GPA uses a software tool STRATEGIST to determine an optimal expansion plan based on lowest system costs and meeting reliability parameters. With that, critical information is input such as operational costs (fixed and variable costs, production efficiencies, etc.), anticipated load requirements, seasonal use, and availability/maintenance scheduling, to name a few. For new resources, construction timelines and capital/construction cost assumptions are also applied.
In addition to these inputs, GPA must consider impacts of changes in capital costs, current and anticipated environmental legislation, and uncertainties in Guam’s economic growth and fuel availability and pricing. Assumptions regarding these topics are typically made and various scenarios are developed in order to evaluate their impact on portfolio choices.
2.2.3 Ensure Adequate Load & Resource Balance
As the sole power utility on Guam, GPA must ensure reliable power is available to its customers. System availability and reliability are factors in determining when to bring in the next resource. System reserve margins ensure that the system is capable to serve its customers when a unit or several units are not operational due to planned maintenance or unplanned forced outages. R.W. Beck consultants recommended that a 50-60% reserve margin is appropriate for Guam based on the idea that the system should be able to withstand two large generators being out of commission at the same time. GPA validated this recommendation using PICES.
2.2.4 Define Candidate List
The selection of potential generation resources options, known as “supply side options,” can have a serious effect on the results of an IRP and eventually on the island-wide power system itself. Inappropriate unit selection may affect system reliability and may put the system at risk for system blackouts. Additional considerations must include land requirements, local and federal regulation restrictions, environmental impacts, availability of fuel resources, and fuel diversification. GPA carefully considered these influences and impacts when selecting which supply side options to include as potential resources.
GPA must also consider “demand side options”—or options for the customer side. These are typically referred to Demand-Side Management (DSM) programs. They may be in the form of rebate program that promotes energy efficient appliances or displacing electricity use by an alternate source such as ocean water cooling for large hotel air conditioning systems. GPA evaluated potential DSM options as part of the IRP.

DEMAND FORECAST Guam Power Authority 2013 Integrated Resource Plan
2-4
2.2.5 Determine Effects on Reliability of the Retirement of Existing Generation Units
GPA explored and characterized the effects of generation retirement singly and in combination using the Probabilistic Investigation of Capacity and Energy Shortages (PICES) tool. The key metrics relevant to this investigation include generation system loss of load expectation (LOLE), system peak load carrying capability (PLCC), and reserve margin (RM).
2.2.6 Determine Optimal Portfolio
In order to determine the optimal portfolio, the modeling software program STRATEGIST for resource expansion optimization was used. This software analyzes demand requirements, candidate unit operational costs, and financing/bond requirements to determine the most economical resource plan for a study period. GPA licensed STRATEGIST to perform this task.
2.2.7 Determine Diversified Resource Mix
The STRATEGIST software was used to determine the most economical plans across a variety of demand and fuel price scenarios. GPA believes that the most economic plans will have substantial benefits in addition to being the least cost option and will help meets GPA’s long-term strategic goal of fuel diversification.
2.2.8 Select Preferred Portfolio
After all the modeled scenarios were run, a preferred portfolio was selected that incorporates a least cost optimal plan and provides for reliability, renewable portfolio requirements, and fuel diversification.
2.2.9 Stakeholder Process
GPA uses a stakeholder process in an effort to involve the community affected by the choices and outcomes of the IRP in its development. This process allowed GPA to provide the community progress reports on the plan and also initiated dialogue on assumptions and risk considerations being used for new resource candidates, fuel forecasts and availability, and local and federal regulations.
GPA selected representatives from different areas in the community and held three public meetings that presented progress information on the current state of GPA, anticipations of the IRP, information used in the IRP, and the modeling results. GPA held stakeholder meetings in April 2012 and October 2012.
GPA initiated the stakeholder process by selecting and inviting people from the community which represent the following areas:
• Department of Defense (DOD);

DEMAND FORECAST Guam Power Authority 2013 Integrated Resource Plan
2-5
• Hotel Industry (Guam Hotel & Restaurant Association);
• Construction Industry (Guam Contractors Association);
• Financial Institution (Bank of Guam);
• Governor of Guam;
• Guam Legislature;
• Government Agencies (Guam Energy Office, Guam Chamber of Commerce, Port Authority of Guam, Civilian Military Task Force/DPW, Guam Environmental Protection Agency);
• Environmental;
• Public Utilities Commission of Guam (Guam PUC); and
• Consolidated Commission on Utilities (CCU).
GPA completed three public meetings during the development of the IRP. The initial meeting on April 25, 2012 provided an overview of GPA and its objectives relative to the IRP as well as preliminary data acquired. The meeting also discussed the key assumptions being used. The second meeting on April 27 allowed stakeholders to consider information from the first meeting and provide feedback. The third meeting provided results and afforded the stakeholders an opportunity to discuss the outcomes of the IRP.
DEMAND FORECAST Guam Power Authority 2013 Integrated Resource Plan
3-1
3 Future Power Requirements GPA and PL Mangilao Energy, LLC worked to prepare baseline energy sales and
load forecast8 founded upon a conservative view of Guam’s economic prospects. Guam – and the US – is enduring a protracted period of slow growth as the Great Recession draws to a close. Mangilao has relied upon the Moodys Analytics (formerly Economy.com) outlook for Guam, supplemented with GPA’s knowledge and experience of the local economy. GPA used this baseline forecast for its Financial Management Plan, FY 2012 base rate case. Therefore, there is a consistent set of forecasts used throughout GPA’s regulatory and financial activities.
Additionally, Mangilao developed forecast scenarios considering assumptions on a proposed military build-up on Guam as well as known, budgeted Department of Defense projects. These scenarios are based on local research on construction, labor, tourism, and anticipated DOD growth. The levels of growth due to DOD buildup present significant construction and employment opportunities. Ultimately, this affects Guam’s economic outlook. Potential infrastructure spending due to primarily DOD contracts and subsequent infrastructure growth will impact the GPA electrical system due to energy requirements necessary to support new load and the capability of the system to meet energy demand.
3.1 The Econometric Model
There are several variables that go into an econometric model. Economic forecasts for Guam and Japan by Moody’s are used to provide the basis for tourism and construction assumptions for Guam. Additional information that will affect construction activities, such as DOD buildup, is provided through the Department of Defense Quadrennial Report and meetings with DOD representatives. Historical weather and peak load data is also used to develop patterns for energy use (sales).
GPA uses the latest E-view program version to run its forecasting model. This is a Windows-based forecasting package developed by QMS (Quantitative Micro Software). Figure 3-1 illustrates the GPA Forecast Model.
8 The GPA Sales and Load Forecasting Process Documentation, 2012, P.L. Mangilao, LLC.

DEMAND FORECAST Guam Power Authority 2013 Integrated Resource Plan
3-2
Figure 3-1, Econometric Model9 9 The GPA Sales and Load Forecasting Process Documentation, 2012, P.L. Mangilao, LLC., p. 29

ENVIRONMENTAL CONSIDERATIONS Guam Power Authority 2013 Integrated Resource Plan
3-3
3.2 Summary of Load Forecast Scenarios
The current consensus on the military build-up differs greatly the plans made by the Department of Defense represented in the FY 2008 Integrated Resource Plan. The current ideas for military buildup will not have as dramatic an effect on GPA’s peak demand and energy production requirements. Figure 3-2 and 3-3 shows the peak demand and energy sales forecasts P.L. Mangilao developed for GPA. GPA used the “EPA Delay” and Baseline forecasts in its IRP analysis.
P.L. Mangilao developed low and high tourism and infrastructure development economic scenarios. The resulting scenario forecasts include a “EPA Delay”, low tourism-high infrastructure (L&H), high tourism-low infrastructure (H&L), and high tourism-high infrastructure.
260
270
280
290
300
310
320
330
2001 2003 2005 2007 2009 2011 2013 2015 2017 2019 2021 2023 2025
Dem
and
(MW
)
Fiscal Year
Forecast Scenarios: Peak Demand
Actual
Baseline
EPA Delay
H&L
L&H
H&H
Figure 3-2, Integrated Resource Plan Peak Demand Forecast Scenarios

ENVIRONMENTAL CONSIDERATIONS Guam Power Authority 2013 Integrated Resource Plan
3-4
1,300,000
1,400,000
1,500,000
1,600,000
1,700,000
1,800,000
1,900,000
2,000,000
2,100,000
2,200,000
2,300,000
2001 2003 2005 2007 2009 2011 2013 2015 2017 2019 2021 2023 2025 2027 2029
Sale
s (M
WH
)
Fiscal Year
Forecast Scenarios: Sales
Actual
Baseline
EPA Delay
H&L
L&H
H&H
Figure 3-3, Integrated Resource Plan Energy Sales Scenarios
3.2.1 Baseline Forecast Assumptions
The primary determinant of this modest growth is an increase in employment and real household income over the next few years as currently budgeted capital expenditures for the development of civilian and military infrastructure projects are completed over the next few years. The GPA forecast is both a budget forecast and a planning forecast that represents a consensus view developed in a consultative process involving both SPORD and GPA senior management. As such, it is not simply raw model output – instead, it reflects the collective understanding and best ideas of all of the participants in the budgeting and planning process, and the unique business risks that GPA’s most senior management deem to be most important to the future of GPA
First, GPA and its consulting partners made several important assumptions in preparing the forecast. First, GPA assumed the actual weather recorded at the international airport, as reported by the National Weather Service, as representative for Guam. In the forecast period, normal weather was assumed to be the average weather observed over the past 30 years.

ENVIRONMENTAL CONSIDERATIONS Guam Power Authority 2013 Integrated Resource Plan
3-5
Second, GPA and its consulting partners assumed GPA’s retail price of electricity, taken as average revenue per kWh inclusive of all fuel costs, utility taxes and surcharges, would increase with the general rate of inflation as measured by the Guam Consumer Price Index (CPI) published by the Guam Bureau of Labor Statistics. This assumption of constant real prices is commonly used in utility budget forecasting. This is equivalent to assuming that on average all of the items purchased by GPA – labor, materials, and supplies and fuel – have cost escalation at approximately the same rate as general inflation. In a long-term forecast, this is usually a reasonable assumption.
The forecasting process is designed to utilize the Moody’s Analytics (formerly Economy.com) economic forecast for Guam. The Moody’s forecast used in this work was prepared in August 2011, the most current forecast available at that time. This forecast calls for Guam Civilian, Non-Agricultural Total Employment to grow at 3.24% annually over the period 2010-2015. However, based upon fieldwork on Guam, P.L. Mangilao observes that Mainland analysts underestimate Guam’s opportunities for long-run economic growth because Mainland analyst forecasts do not take into account two important factors. They do not recognize that Guam’s tourism industry may grow, and they do not take into account that there are significant infrastructure and military construction projects that are either under way or have been given clear schedules as budgeted capital expenditures. We have not taken these expectations for more rapid growth into account in this forecast. Those expectations are more appropriately taken into consideration in alternative planning scenarios.
The earthquake, tsunami and the ensuing nuclear disaster were a tragedy for the Japanese people. Over the spring and early summer of 2011 Japanese tourism suffered a decline that has severely hurt Guam’s hospitality related businesses. Japanese tourist visitation is recovering, however, and in recent months visitation has been improving at double-digit rates. The base forecast allows for this temporary decline in tourism during the upcoming budget period in an appropriate manner. By the end of the forecast period, there will be no lingering ill-effects on Guam’s hospitality industry.
Expectations regarding sales to the U.S. Navy (Navy) are made econometrically, after discussion with the Navy and GPA management and staff. Sales to the Navy were 361.5 gWh in 2010/11. Navy sales grew at an average rate of +2.02% over the period 2005 through 2010, and are expected to grow at an average annual rate of 0.81% over the period 2010 through 2015.
Based upon dozens of interviews with subject experts that Mangilao has conducted since 2005, the timing and magnitude for the military build out on Guam is completely uncertain. It seems that increasing the military presence on Guam is most probable, but it also seems that almost none of the important decisions have been taken as of yet by the U.S. government. Because of this uncertainty, the military build out must be addressed in scenarios. The baseline forecast includes only those military and infrastructure projects for which funds are currently obligated.

ENVIRONMENTAL CONSIDERATIONS Guam Power Authority 2013 Integrated Resource Plan
3-6
3.2.2 Alternative Forecast Assumptions
The Moody’s Analytics (formerly Economy.com) economic forecast for Guam tends to be statistical, and extrapolates existing trends. It does not contain information for the proposed Military build-up. Therefore, GPA and Mangilao created an alternative forecast considering the impacts of the proposed military buildup. GPA made the assumption that the military would begin no earlier than two years from the start of the forecasting period. This assumes that the Department of Defense requires between two to five additional years to complete a new Environmental Impact Study (EIS). Furthermore, based on news articles and other local and national sources of information, Mangilao developed a civilian and military project list and timetable for use in the forecast.10 GPA’s “EPA Delay Scenario” forecast or the Alternative forecast used in the Integrated Resource Plan refers to P.L. Mangilao’s Low Tourism/Low Infrastructure case with appropriate time delay for the development of a new EIS.11
The “EPA Delay Scenario” forecast assumes a 1% growth as an arbitrary middle ground to characterize the historical experience of Guam tourism industry since 1993. Several reviewers of the GPA forecast have pointed out that in real life the industry would go through capital spending cycles in which it periodically overbuilt (boom/bust cycles or business cycles), but those cycles are really problematic to model. Although, GPA’s does believe that boom/bust cycles are more typical of the tourism/hospitality industry, the Alternative forecast simply assumes that the industry continues to build at a steady, prudent level just sufficient to serve growth in tourism. The “EPA Delay Scenario” forecast assumes a $12.1 billion of civilian and military construction projects ending 2025. These projects include projects identified in civilian and military budgets as well as speculative buildup projects.
10 The GPA Sales and Load Forecasting Process Documentation, 2012, P.L. Mangilao, LLC., Table 3, p. 16 11 The GPA Sales and Load Forecasting Process Documentation, 2012, P.L. Mangilao, LLC., p. 10

ENVIRONMENTAL CONSIDERATIONS Guam Power Authority 2013 Integrated Resource Plan
4-1
4 Future Fuel Costs & Choices for GPA GPA contracted SAIC to develop the fuel price forecasts for Residual Fuel Oil (RFO),
Diesel Oil (Diesel), and Liquefied Natural Gas (LNG). Following is a summary of the forecast methodology and prices:
• In the current forecast (August 2012), the global oil price is expected to increase from
$79/barrel in 2010 to $92/barrel (2011$) in 2015, and thereafter prices are expected to grow at an annual average rate of 1.1%. Continued decline in conventional sources of production (for example, Iran) and threat of supply disruptions due to global disturbances continue to pose substantial threat to future oil supply; however potential new sources of oil recovery due to technological advancement (for e.g., light tight oil/ shale oil) and reduced demand due to slower than expected economic recovery, political disturbances in the European Union (EU) and reduced growth rates in India and China prevent near-term oil prices from rising substantially.
• In the medium to longer-term, it is expected global oil prices will continue to rise, however at a slower rate of 1.1% average annually beyond 2015 mostly due to expectation of demand growth being lower than anticipated before, and new supply sources and increasing fuel competition over time.
• The views on oil prices reflect recent trends in other published forecasts which were reviewed. In addition, there has been an observed substantial drop (about 10%) in Brent futures for 2015 between May-2011 and June-2012.
• Guam delivered prices are calculated assuming similar contract terms as in current contracts. After adjusting for the fixed formula adders in the contracts, Guam delivered HSFO price for 2015 is $13.03/MMBtu (in 2011$).

ENVIRONMENTAL CONSIDERATIONS Guam Power Authority 2013 Integrated Resource Plan
4-2
60
70
80
90
100
110
120
2012
2013
2014
2015
2016
2017
2018
2019
2020
2021
2022
2023
2024
2025
2026
2027
2028
2029
2030
2031
2032
2033
2034
2035
2011 Forecast HSFO Delivered Price(2011$/Barrel)
2012 Forecast Delivered Guam HSFO Price (2011$/MMBtu)
Source: R. W. Beck (an SAIC Company)
Figure 4-1, HSFO Delivered Price to Guam Forecast Comparison (2012 with 2011)
Delivered LNG Price Forecast:
• It is expected that Asian LNG prices will generally continue to experience linkage to oil prices. Recently some sporadic examples introduced Henry Hub-based LNG pricing for Asian shipments. However, the final outcome of these contracts and actual delivered future prices under these terms are highly uncertain. In addition, these contracts often represent large potential buyers with strong negotiating power to acquire ownership in upstream liquefaction projects.
• In the Base Case forecast for LNG delivered to Guam, the continued assumption is the LNG price is linked by indexation of approximately 11% to Japanese crude oil prices (“JCC” and JCC is assumed to continue to trade at a small discount to Brent as it has historically). We also continue to assume that Guam, due to its geographical location compared to Japan, will be able to realize a fixed $0.30/MMBtu discount compared to the JCC-indexed price that primarily reflects a LNG price delivered to Japan.
• For Low and High Cases, it is assumed an annual average 11% and 15% indexation to JCC prices respectively. Figure 4-2 shows LNG price sensitivities.

ENVIRONMENTAL CONSIDERATIONS Guam Power Authority 2013 Integrated Resource Plan
4-3
0.00
2.00
4.00
6.00
8.00
10.00
12.00
14.00
16.00
18.00
2012
2013
2014
2015
2016
2017
2018
2019
2020
2021
2022
2023
2024
2025
2026
2027
2028
2029
2030
2031
2032
2033
2034
2035
Base Case Guam LNG Landed Price (2011$ per MMBtu)
High Case Guam LNG Landed Price (2011$ per MMBtu)
Low Case Guam LNG Landed Price (2011$ per MMBtu)
Source: R. W. Beck (an SAIC Company)
Figure 4-2, LNG Prices– Base, Low and High Cases (2011$/MMBtu) (Land Infrastructure
Premiums Excluded) Table 4-1 presents SAIC’s updated fuel price forecasts for Guam. Table 4-2 presents
LNG price sensitivities.

ENVIRONMENTAL CONSIDERATIONS Guam Power Authority 2013 Integrated Resource Plan
4-4
Table 4-1, Fuel Price Forecasts for Guam
Delivered Price for
LNG (2011$/ MMBtu)
HSFO LSFO HO LNG HSFO LSFO HO
2012 96 99 139 12.72 15.27 15.84 24.152013 91 94 131 12.06 14.48 15.05 22.832014 86 90 124 11.57 13.74 14.31 21.582015 82 85 117 10.84 13.03 13.60 20.402016 83 87 119 10.92 13.23 13.80 20.732017 84 88 121 11.00 13.43 14.00 21.072018 86 89 123 11.09 13.64 14.20 21.412019 87 90 125 11.17 13.84 14.41 21.752020 88 92 127 11.34 14.05 14.62 22.112021 89 92 128 11.43 14.17 14.74 22.312022 90 93 129 11.53 14.30 14.86 22.512023 91 94 131 11.62 14.42 14.99 22.722024 91 95 132 11.72 14.54 15.11 22.922025 92 96 133 11.81 14.67 15.23 23.132026 93 96 134 11.91 14.79 15.36 23.332027 94 97 135 12.00 14.91 15.48 23.542028 94 98 136 12.10 15.03 15.60 23.752029 95 99 138 12.19 15.16 15.73 23.962030 96 99 139 12.29 15.28 15.85 24.172031 97 100 140 12.39 15.42 15.99 24.392032 98 101 141 12.49 15.55 16.12 24.612033 98 102 143 12.60 15.69 16.26 24.842034 99 103 144 12.70 15.82 16.39 25.072035 100 104 145 12.81 15.96 16.53 25.30
Fuel Oil Delivered Price(2011$/Barrel)
Fuel Oil Delivered Price(2011$/MMBtu)
Guam Delivered Fuel Price Forecast (Base Case)
NOTE: Delivered LNG price excludes infrastructure premium

ENVIRONMENTAL CONSIDERATIONS Guam Power Authority 2013 Integrated Resource Plan
4-5
Table 4-2, LNG Price Sensitivities Guam Delivered LNG Price: Sensitivity
Base Case Guam LNG Landed Price (2011$ per MMBtu)
High Case Guam LNG Landed Price (2011$ per MMBtu)
Low Case Guam LNG Landed Price (2011$ per MMBtu)
2012 12.72 13.58 11.962013 12.06 13.51 11.172014 11.57 13.06 10.592015 10.84 13.37 9.732016 10.92 13.59 9.892017 11.00 13.82 10.052018 11.09 14.05 10.222019 11.17 14.28 10.392020 11.34 14.52 10.562021 11.43 14.65 10.662022 11.53 14.79 10.762023 11.62 14.92 10.862024 11.72 15.06 10.972025 11.81 15.20 11.072026 11.91 15.34 11.172027 12.00 15.48 11.272028 12.10 15.62 11.372029 12.19 15.76 11.472030 12.29 15.90 11.582031 12.39 16.05 11.692032 12.49 16.20 11.802033 12.60 16.35 11.912034 12.70 16.50 12.022035 12.81 16.66 12.13
NOTE: Delivered LNG price excludes infrastructure premium

ENVIRONMENTAL CONSIDERATIONS Guam Power Authority 2013 Integrated Resource Plan
5-1
5 Environmental Considerations
This section discusses the environmental regulations facing GPA, associated compliance challenges, and the impacts to operations and costs. It is not an exhaustive discussion of all environmental efforts underway, but focuses instead on those regulations directly affection the resource options considered and proposed in the IRP. The IRP relies on information GPA’s Environmental Strategic Plan (ESP) developed with TRC Companies, Inc.
5.1 National Ambient Air Quality Standard (NAAQS)
The U.S. Environmental Protection Agency (EPA) has taken several actions to strengthen the NAAQS. These new standards will have significant effects on how GPA will be able to operate its units and the amount of air pollutants coming from its plants. Three primary pollutants: sulfur dioxide (SO2), nitrogen dioxide (NO2), and particulate matter (PM), will be the focus of the NAAQS compliance efforts for Guam.
5.1.1 Sulfur Dioxide, SO2
For SO2, the new ambient air standards consist of 196 micrograms per cubic meter (µ/m3) averaged over a one hour period, 1,300 (µ/m3) over a 3 hour period, 365 (µ/m3) over a 24 hour period, and 80 (µ/m3) annually. These new regulations will be 6 to 7 times more restrictive than current regulations on the amount of SO2 GPA is allowed to release.
Cabras and Tanguisson power plants provide a majority of GPA’s power. Recent
monitoring shows that GPA’s Cabras and Tanguisson plants do not comply with the new NAAQS SO2 standards, however further monitoring will be required to confirm this. Piti and Tanguisson areas already are designated as non-attainment areas under the old standard. Monitoring activities and revisions to the State Implementation Plans will cost approximately $4.2 million over the next four years.
The one hour SO2 standard must be met by June 2017. Options to achieve compliance
include construction and operation of SO2 scrubbers at affected plants, reducing the sulfur content of fuel oil being burned at affected plants, or switching from oil to natural gas through the importation of liquefied natural gas (LNG). All of these options will cost several hundred million dollars and they are being economically and operationally evaluated as part of the IRP process. For SO2, the new ambient air standards consist of 196 micrograms per cubic meter (µ/m3) averaged over a one hour period, 1,300 (µ/m3) over a 3 hour period, 365 (µ/m3) over a 24 hour period, and 80 (µ/m3) annually. These new regulations will be 6 to 7 times more restrictive than current regulations on the amount of SO2 GPA is allowed to release.
Cabras and Tanguisson power plants provide a majority of GPA’s power. Recent
monitoring shows that GPA’s Cabras and Tanguisson plants do not comply with the new
ENVIRONMENTAL CONSIDERATIONS Guam Power Authority 2013 Integrated Resource Plan
5-2
NAAQS SO2 standards, however further monitoring will be required to confirm this. Piti and Tanguisson areas already are designated as non-attainment areas under the old standard. Monitoring activities and revisions to the State Implementation Plans will cost approximately $4.2 million over the next four years.
The one hour SO2 standard must be met by June 2017. Options to achieve compliance
include construction and operation of SO2 scrubbers at affected plants, reducing the sulfur content of fuel oil being burned at affected plants, or switching from oil to natural gas through the importation of liquefied natural gas (LNG). All of these options will cost several hundred million dollars and they are being economically and operationally evaluated as part of the IRP process.
5.1.2 Nitrogen Dioxide, NO2
For NO2, the new ambient air standard requires no more than 100 parts per billion concentration averaged over a one hour period for any area. It is likely that many major sources of NO2 emissions, including all of GPA’s power plants, will find it difficult to demonstrate compliance.
GPA does not currently know if it meets this new standard at locations near its generating
facilities. GPA proposes to employ continuous air monitoring to determine NO2 at representative sites in the vicinity of the GPA facilities.
5.1.3 Particulate Matter, PM
For particulate matter designated as “fine particles” (2.5 micrometers or smaller), PM2.5, the new ambient air standard requires no more than 35 (µ/m3) averaged over a 24 hour period and 15 (µ/m3) on average annually.
GPA does not currently know if it meets these new standards at locations near its
generating facilities. GPA proposes to employ continuous monitoring to determine PM2.5 at representative sites in the vicinity of the GPA facilities.
5.2 Maximum Achievable Control Technology (MACT)
Three recently promulgated standards for MACT that apply to GPA. These new standards will have significant effects on how GPA will be able to operate its units and the amount of metals, chloride, and carbon monoxide emissions coming from its plants. Two primary types of generation, steam and reciprocating engine technologies will be the focus of the MACT compliance efforts for Guam.

ENVIRONMENTAL CONSIDERATIONS Guam Power Authority 2013 Integrated Resource Plan
5-3
5.2.1 Steam Electric Generation, “Boiler MACT”
The Boiler MACT standards promulgated by the U.S. EPA in December 2011 apply to four of GPA’s larger units: Cabras 1 and 2 and Tanguisson 1 and 2. The standards call for a significant reduction in metal and chloride emissions.
Recent testing shows that GPA will have to modify the operation of Cabras 1 to control
for metal emissions. All four units may have to be modified to control for acid gases. Fuel and stack testing will need to be done to verify their compliance status. During the last quarter of calendar year 2012, discussions with US EPA uncovered issues regarding the temperature at which the emission tests were conducted. GPA scheduled another test for Cabras 1 for the first quarter of calendar year 2013 at the temperature US EPA indicated to be correct. Results from this test will confirm if limits have been exceeded.
The Boiler MACT standard must be met by May 2015, however there is a possibility to
receive an extension of the initial compliance date. Electrostatic Precipitators (ESPs) installed on each unit would enable achievement of the
Boiler MACT compliance requirements, however, these are costly and scrubbers would still need to be installed in order to meet the NAAQS requirements. Because scrubbers alone could address compliance for NAAQS and Boiler MACT, GPA has assumed that it would install scrubbers, without the need for ESPs, and have the scrubbers operational one month prior to the NAAQS compliance date of May 2017. This scenario would require agreement by the EPA for a full two-year extension beyond the original Boiler MACT initial compliance date.
The cost to install scrubbers is estimated to be between $220 to $362 million and testing
costs of $200,000 per year for all four steam units. The Boiler MACT standards promulgated by the U.S. EPA in December 2011 apply to four of GPA’s larger units: Cabras 1 and 2 and Tanguisson 1 and 2. The standards call for a significant reduction in metal and chloride emissions.
Recent testing shows that GPA will have to modify the operation of Cabras 1 to control
for metal emissions. All four units may have to be modified to control for acid gases. Fuel and stack testing will need to be done to verify their compliance status. During the last quarter of calendar year 2012, discussions with US EPA uncovered issues regarding the temperature at which the emission tests were conducted. GPA scheduled another test for Cabras 1 for the first quarter of calendar year 2013 at the temperature US EPA indicated to be correct. Results from this test will confirm if limits have been exceeded.
The Boiler MACT standard must be met by May 2015, however there is a possibility to
receive an extension of the initial compliance date. Electrostatic Precipitators (ESPs) installed on each unit would enable achievement of the
Boiler MACT compliance requirements, however, these are costly and scrubbers would still need to be installed in order to meet the NAAQS requirements. Because scrubbers alone could

ENVIRONMENTAL CONSIDERATIONS Guam Power Authority 2013 Integrated Resource Plan
5-4
address compliance for NAAQS and Boiler MACT, GPA has assumed that it would install scrubbers, without the need for ESPs, and have the scrubbers operational one month prior to the NAAQS compliance date of May 2017. This scenario would require agreement by the EPA for a full two-year extension beyond the original Boiler MACT initial compliance date.
The cost to install scrubbers is estimated to be between $220 to $362 million and testing
costs of $200,000 per year for all four steam units.
5.2.2 Reciprocating Internal Combustion Engines, “RICE MACT”
GPA is subject to RICE MACT standards for all 14 medium speed diesel units located at the Dededo Diesel Plant (4), Talofofo Diesel Plant (2), Manenggon Diesel Plant (2) and the Tenjo Vista Power Plant (6). The RICE MACT also applies to the Cabras 3 and 4 and MEC’s Piti 8 and 9 slow speed diesel units. The RICE MACT standards call for a significant reduction of carbon monoxide (CO) emissions.
Recent emissions testing shows that GPA will have to modify the medium speed diesel
units to control for CO emissions. Testing will need to be done to verify compliance status of these units.
The RICE MACT compliance deadline is May 2013. GPA has filed a request for a one
year extension for all 14 medium speed diesel units burning ultra-low sulfur diesel because there is not enough time to comply; extension approval is still pending. The RICE MACT compliance is expected to cost $2.2 M in capital costs and $300,000 per year.
In the same filing, GPA requested exemption for the slow speed diesel units burning residual
fuel oil (Cabras 3 and 4 and Piti 8 and 9) because compliance would require either changing fuel or the installation of compliance equipment. Either option would cost several hundred million dollars to implement ($100 to $400 million in capital costs or $70 million per year in increased fuel and unit maintenance costs). It is not known if EPA will allow for this exemption.

RELIABILITY ASSESSMENT Guam Power Authority 2013 Integrated Resource Plan
6-2
6 Reliability Assessment 6.1 Objective
This section analyzes generation system reliability, reserve margin, and the impacts of unit retirements on generation system reliability.
The Guam Power Authority (GPA), the Consolidated Commission on Utilities, and the Guam Public Utilities Commission established operational and planning criteria for GPA generation system reliability. This criteria establishes a minimum of a one-day in four and a half (4.5) years loss-of-load-expectation for the GPA generation system. This does not include transmission and distribution system reliability or unreliability. This adopted standard means that GPA must use a combination of maintaining prudent generation unit availabilities and prudent installed reserve capacity so that the expectation of not being able to serve loads because of an insufficiency of generation is less than once in four and a half years. Using this methodology, GPA requires a minimum reserve margin policy of 54% to meet the criteria. GPA sets up a minimum reserve margin requirement of 54% for Strategist Proview runs. If GPA reserve margin falls below this criterion, new generation is brought in.
Even with many units on long-term shutdown such as Marbo CT and the Dededo CT units, GPA’s computed LOLE performance has been steady at one day in ten years. On paper, GPA has an installed reserve margin of over 100% given current system peaks. This reserve margin is almost twice the minimum required. Since keeping a large reserve margin is expensive, GPA needs to prudently consider unit retirements and improvements in generation unit reliability to prudently navigate the trade-offs between costs and generation system reliability.
GPA uses the Probability Investigation of Capacity and Energy Shortages (PICES) application to determine system LOLE and reserve margins. However, the Guam Power Authority (GPA) engaged R. W. Beck to assist in evaluating which of the GPA generating units are candidates for ongoing operations and which units are candidates for retirement considering other analytical methods to strengthen our understanding of this complex issue.
6.2 Generation Unit Retirement Effects on Generation System Reliability
The generation system daily loss-of-load-expectation (LOLE) and installed reserve margin requirements are evaluated using the state-of the-art Probabilistic Investigation of Capacity and Energy Shortages (PICES) software tool. PICES is a public domain computer program developed (circa 1981) as a mainframe program by Oak Ridge National Laboratory for the Department of Energy. Since then, it has been ported to the Personal Computer (PC). GPA uses the PC version. The methodology for using PICES to calculate Daily LOLE and installed reserve margin is described in the Guam Power Authority Reliability Procedures Manual. GPA will use the two-state unit representation for all its analyses.

RELIABILITY ASSESSMENT Guam Power Authority 2013 Integrated Resource Plan
6-3
Using the procedures found in the reliability manual, GPA computed the generation
system daily loss-of-load-expectation reliability. Additionally, it computed the installed reserve margin for a generation LOLE of one day in four and a half years. Finally, GPA computed the N-2 reserve margin requirement. GPA computed these statistics for the following cases:
• GPA units retired at the end of their expected life • GPA units retired singly and in combination in each year of the study.
The inputs to PICES include:
• Generator Unit Name; • Unit Output Capacity; • Weeks Required For Planned Maintenance; • Forced Outage Rate.
6.2.1 PICES Analysis Results
This section summarizes PICES calculations relating to the effects of unit retirement on Generation system reliability. GPA has analyzed the impact of retirement on generation system reliability for the following groups of units:
• Cabras 1 and 2; • Cabras 3 and 4; • Combustion Turbines (CT’s); • Small Diesels.
Tables 6-1 through 6-2 provide the summary of the reliability impact of different
generator retirement choices. Table 6-1 gives the impact of retirement of single or closely related units; Table 6-2 gives the impact of various combinations of combustion-turbine unit retirement and Table 6-3 gives the impact of various combinations of small diesel unit retirement. The strongest indicator of unit contribution to generation system reliability is the last line in the entry for each generator unit. This gives the incremental load carrying capacity (ILCC). Incremental Load Carrying Capacity provides a measure of reliability impact per megawatt retired. The impact depends on the size of the units, weeks allotted for planned maintenance and forced outage rate.
System Peak Load Carrying Capability is an indication of the maximum peak that the generation system can support at a specified loss of load expectation (LOLE). In Tables 6-1 through 6-3, peak load carrying capability is expressed as a peak (MW). The system load carrying capability is the percent ratio between the maximum peak and the installed capacity. This percent ratio is a metric of the reliability efficiency of the installed generation system. With the same LOLE criteria, the system with the higher load carrying capability represents a more
RELIABILITY ASSESSMENT Guam Power Authority 2013 Integrated Resource Plan
6-4
efficient use of installed generation: greater portion of total installed generation supports the peak rather than supporting reserve commitments.
The system reserve margin requirement is computed for the system at its peak load carrying capability (PLCC). This is simply the ratio of the difference between installed capacity and the peak load carry capability.
Increasing a unit's size, scheduled maintenance time or forced outage rate all contribute to lowering the incremental load carrying capability of a unit. Therefore, these increases will lower the reliability impact of a unit's retirement. However, over the range of GPA's unit characteristics, regression analysis indicates that increases in unit size have significantly greater impact than increases in either forced outage rate or scheduled maintenance size. Thus, the granularity of the unit size plays a very significant part in GPA's overall generation system reliability.
This effect can be seen when comparing the load carrying capabilities of Cabras 3&4 versus Cabras 1&2 (Table 6-1). The Per MW reliability impact of retiring Cabras 3&4 is substantially greater than that of Cabras 1&2.
Consideration of reliability in the above manner comes with this caveat: the analysis considers reliability performance in the average and does not consider the variability (variance) inherent in its stochastic nature. Short-term system reliability performance may be better or worse than the average. Additionally, it does not consider operational costs. GPA must make prudent trade-offs in considering generation retirements and additions.
Although Strategist results indicate that fuel burn limits do not come into play under current levels of output, the load carrying capacity estimates may over-estimate the actual reliability under greater output or under lower system capacity. GPA evaluated the maximum impact of the fuel burn limits on reliability in its 1999 Integrated Resource Plan. This work indicates that fuel burn limits increase reserve margin requirements by about five percent. However, using a two-state versus three-state generation model provides a conservative five to six percent increase in reserve margin requirement estimates.
6.2.2 Increasing Generation Unit Availability versus Generation Capacity Addition
Figure 6-1 illustrates analysis performed by GPA for the US Navy on GPA’s generation system ability to serve expanding load requirements for the military buildup on Guam.12 Figure 6-1 shows the peak load carrying capability of the GPA generation system if GPA maintained equivalent availability factor (EAF) for each generation units at the minimum Guam Public Utility Commission EAF class standard.
12 Analysis of Current and Future GPA Generation Reliability. Power Point Presentation to the U.S. Navy on January 27, 2009.

RELIABILITY ASSESSMENT Guam Power Authority 2013 Integrated Resource Plan
6-5
This graph illustrates that obtaining a specific generation system reliability target involves a trade-off between system capacity additions and improvements to individual generation unit reliability. Improving generation unit reliabilities may most likely prove the least-cost option to system capacity additions.
6.3 Reliable Delivery of Power
R. W. Beck has conducted a capacity reserve analysis, in coordination with GPA, to assist GPA in deciding which units are needed to provide reliable power to meet system demand, either actively or in a reserve role, versus those units that could be retired. The capacity reserve is the difference between the dependable capacity available and the anticipated peak demand. The analysis included a review of the size and reliability of GPA’s primary energy producing units and an assessment of the combination of units that provide for the most efficient reserve capacity.
R. W. Beck in coordination with GPA developed a list of the GPA units based on operating costs, a dispatch stack to identify the existing units that should be dispatched to meet system demand in the most cost effective manner. This analysis included a review with GPA to identify any unit or system drivers or constraints that would result in adjustment to the stack, such as operating limits in the permits, or units that supply voltage support to the grid. Of the units that did not actively dispatch to meet system demand, we evaluated which were operable, which could be the most efficient resources for reserve capacity, and which units could be useful for other reasons, such as voltage support.
Of the units shown to be the best candidates for reserve and reliability purposes, the team assessed the need for any significant maintenance, repairs, renewals, upgrades, or enhancements to help ensure the units meet industry standards of operability and be expected to provide for adequate, long-term reliability.
R. W. Beck and GPA performed a second iteration of the analysis after conducting the modeling of the long-term resource planning to determine if any proposed generating options resulted in adjustment to the analysis described above for the existing units.
The results of this non-stochastic analysis indicate that the GPA should consider the following units for retirement: • Marbo CT • Dededo Diesels • Dededo CT 1 • Dededo CT 2.

RELIABILITY ASSESSMENT Guam Power Authority 2013 Integrated Resource Plan
6-6
However, if the military buildup becomes a reality, GPA will have to keep both Dededo CT units to meet reserve LOLE requirements. GPA could then reconsider these retirements after the military buildup construction phase post-2019.
Furthermore, a review of the availability and forced outage data shows that the availability of the baseload units were trending upward, which should work to mitigate service disruptions.13 However, the two largest baseload units have the highest forced outage rates when averaged over several years. Therefore, units that provide the reserve capacity need to have high availability and low forced outage rates. Should the Cabras 1 and 2 units be out of service, then the Tanguisson units, the reciprocating engine units, and a CT unit would be needed to meet the system demand.
Note, officially “retiring” units typically has more relevance in large competitive markets with multiple participants, including independent system operators and independent power producers, with capacity and energy markets. GPA operates in an island system and is the only power provider on the system. Therefore, the retirement decision and associated actions do not have a mandated deadline and may need to be deferred until the generating resources identified by the long-term resource planning study are in service.
13 Cabras 3 is on extended force outage due to catastrophic rotor damage.

RELIABILITY ASSESSMENT Guam Power Authority 2013 Integrated Resource Plan
6-1
Table 6-1, System Reliability Impact of Single Units and Plant Retirement
Sets of Unit RetiredMaximum Net
Generaton Capacity Retired
System Capacity After Retirements
System Peak Load Carrying Capacity
(Net) at One Day in 4.5 Years LOLE
Reserve Margin For One Day in 4.5 Years
LOLE
MW MW (MW) % System IncrementalNone 0.0 524.0 339 54.26 64.69 N/ACabras Steam Turbine 1 62.0 462.0 292 58.11 63.20 75.81Cabras Steam Turbine 2 59.0 465.0 293 58.93 63.01 77.97Cabras 1&2 Steam Plant 121.0 403.0 257 56.8 63.77 67.77
Cabras Slow Speed Diesel 3 35.0 489.0 298 64.02 60.94 117.14Cabras Slow Speed Diesel 4 36.0 488.0 297 64.32 60.86 116.67Cabras 3&4 Diesel Plant 71.0 453.0 263 72.01 58.06 107.04
Tanguisson 1 25.0 499.0 310 61.21 62.12 116.00Tanguisson 2 25.0 499.0 310 61.21 62.12 116.00Tanguisson 1 & 2 50.0 474.0 287 65.45 60.55 104.00Tenjo Diesel (2 Units) 8.0 516.0 324 59.39 62.79 187.50Tenjo Diesel (4 Units) 16.0 508.0 316 60.59 62.20 143.75Tenjo Diesel (6 Units) 24.0 500.0 308 62.1 61.6 129.17Talofofo Diesel Units 8.0 516.0 324 59.39 62.79 187.50MDI Units 10.0 514.0 324 59.39 63.04 150.00Macheche CT 22.0 502.0 311 61.16 61.95 127.27Yigo CT 22.0 502.0 311 61.16 61.95 127.27Dededo CT 1 23.0 501.0 311 61.24 62.08 121.74Dededo CT 2 22.0 502.0 311 61.16 61.95 127.27Dededo CT 1&2 45.0 479.0 292 64.22 60.96 104.44Dededo Diesel Units 8.0 516.0 324 59.39 62.79 187.50Marbo CT 16.0 508.0 317 60.47 62.40 137.50
Load Carrying Capability, Net (%)

RELIABILITY ASSESSMENT Guam Power Authority 2013 Integrated Resource Plan
6-2
Table 6-2, System Reliability Impact of Multiple Combustion Turbine Plant Retirement
Sets of Unit RetiredMaximum Net
Generaton Capacity Retired
System Capacity After Retirements
System Peak Load Carrying Capacity
(Net) at One Day in 4.5 Years LOLE
Reserve Margin For One Day in 4.5 Years
LOLE
MW MW MW % System IncrementalNone 0 524 339 54.26 64.69 N/ADededo and Marbo CT Plants 61 463 278 66.60 60.04 100.00Dededo and Macheche CT Plants 67 457 273 67.30 59.74 98.51Dededo and Yigo CT Plants 67 457 273 67.30 59.74 98.51Dededo, Marbo and Macheche CT Plants 83 441 258 70.59 58.50 97.59Dededo, Marbo and Yigo CT Plants 83 441 258 70.59 58.50 97.59Marbo and Macheche CT Plants 38 486 297 63.48 61.11 110.53Marbo and Yigo CT Plants 38 486 297 63.48 61.11 110.53Macheche and Yigo CT Plants 44 480 293 63.95 61.04 104.55All GPA CT Plants 105 419 240 74.84 57.28 94.29
Load Carrying Capability, Net (%)
Table 6-3, System Reliability Impact of Multiple Small Diesel Plant Retirement
Sets of Unit RetiredMaximum Net
Generaton Capacity Retired
System Capacity After Retirements
System Peak Load Carrying Capacity
(Net) at One Day in 4.5 Years LOLE
Reserve Margin For One Day in 4.5 Years
LOLE
MW MW MW % System IncrementalNone 0 524 339 54.26 64.69 N/ADededo and Talofofo Diesel Plants 16 508 316 60.52 62.20 143.75Dededo and Pulantat Diesel Plants 18 506 315 60.89 62.25 133.33Dededo and Tenjo Diesel Plants 32 492 302 63.13 61.38 115.63Dededo, Talofofo and Tenjo Diesel Plants 40 484 294 64.53 60.74 112.50All GPA Diesel Plants 50 474 285 66.23 60.13 108.00
Load Carrying Capability, Net (%)

RELIABILITY ASSESSMENT Guam Power Authority 2013 Integrated Resource Plan
6-3
Figure 6-1, Peak Load Carrying Capability (Gross) of GPA Generation System at PUC EAF Standards
0
1
2
3
4
5
6
7
8
9
10
11
268 300 325 350 375 400 425 450 475 500
Peak MW
1/LOL
E Ye
ars P
er D
ay
4.5 years per day
10 years per day
@268MW, 945 years per day@300MW, 100 years per day@325MW, 17 years per day
4 years per day
1.1 years per day
0.34 year per day
348MW
0
1
2
3
4
5
6
7
8
9
10
11
268 300 325 350 375 400 425 450 475 500
Peak MW
1/LOL
E Ye
ars P
er D
ay
4.5 years per day
10 years per day
@268MW, 945 years per day@300MW, 100 years per day@325MW, 17 years per day
4 years per day
1.1 years per day
0.34 year per day
348MW

SUPPLY SIDE OPTIONS Guam Power Authority 2013 Integrated Resource Plan
7-1
7 Supply Side Options 7.1 Introduction
The Guam Power Authority (GPA) engaged R. W. Beck to assist in the preparation of an integrated resource plan (IRP). In coordination with GPA, R. W. Beck developed unit characteristics, including performance, capital cost, and operation and maintenance (O&M) cost projections for both the existing power generating units as well as potential new generating resources. All costs are in 2012$. O&M costs are non-fuel production related costs and do not include owner costs, such as taxes and insurance. For the development of the unit characteristics, R. W. Beck visited the existing assets to assess the current state of operational readiness and estimate the needs of the units in the future to maintain operational reliability, efficiency, and environmental compliance. The existing assets, which include boiler and steam turbine generators (STGs), slow speed reciprocating (SSR) engines, combustion turbine generators (CTGs), and medium speed reciprocating (MSRs) engines, are listed in the table below.
The unit characteristics developed for the existing units included the following scenarios.
• Existing units as-is
• Existing units with capital expenditures in the future to improve efficiency and/or extend operating life, excluding the addition of air quality control systems (AQCS)
• Existing units with capital expenditures in the future to improve efficiency and/or extend operating life, including the addition of AQCS
• Certain existing units converted to fire natural gas, excluding capital expenditures, to coincide with potential natural gas availability by the end of 2017
• Certain existing units converted to fire natural gas with capital expenditures in the future to improve efficiency and/or extend operating life, excluding the addition of AQCS
• The addition of new power generating units.
The unit characteristics developed for the installation of new generating resources included the following.
• Repower Piti 7 to a combined-cycle plant firing on natural gas
• New combined-cycle plant utilizing a GE LM6000 combustion turbine firing natural gas
• Small modular nuclear reactor (SMR)
• Bio-mass plant firing on wood pellets
• Stationary photovoltaic solar plant
• On-shore wind farm

SUPPLY SIDE OPTIONS Guam Power Authority 2013 Integrated Resource Plan
7-2
• Ocean thermal energy conversion plant
• Sea water air conditioning plant
• Geothermal plant
• Municipal solid waste plant.
Table 7-1
Summary of GPA Generation Resources Unit Technology Fuel Net Capacity, MW (1) COD
Cabras 1 (2) Boiler/STG HS/LS RFO (3) 62.5 1974 Cabras 2 (2) Boiler/STG HS/LS RFO 59.2 1975 Cabras 3 (4) SSR HS/LS RFO 37.7 1996 Cabras 4 (4) SSR HS/LS RFO 37.7 1996 Dededo CT 1 CTG ULSD (5) 22.0 1992 Dededo CT 2 CTG ULSD 22.0 1994 Dededo Recip 1-4 MSR ULSD 2.45 each/9.8 total 1972 Macheche CT CTG ULSD 19.0 1993 Marbo CT CTG ULSD 16.0 1993 Manenggon Recip 1 & 2 MSR ULSD 5.2 each/10.4 total 1993 Piti 7 (6) CTG ULSD 39.3 1997 Piti 8 (7) SSR HS/LS RFO 43.2 1999 Piti 9 (7) SSR HS/LS RFO 43.2 1999 Talofofo Recip 1 & 2 MSR ULSD 4.3 each/8.6 total 1994 Tanguisson 1 (8) Boiler/STG HS RFO 24.8 1976 Tanguisson 2 (8) Boiler/STG HS RFO 24.8 1976 Tenjo Recip 1-6 MSR ULSD 4.3 each/25.9 total 1994 Yigo CT CTG ULSD 19.0 1993 _______________________ (1) Based on current expectation of maximum net capacity. (2) Operated by GPA and TEMES pursuant to a performance management contract (PMC) expiring in September 2015. (3) High sulfur (HS) or low sulfur (LS) No. 6 residual fuel oil (RFO), less than 2 percent or 1.2 percent sulfur, respectively. (4) Operated by GPA and KEW pursuant to a PMC expiring in June 2015. (5) Ultra low sulfur No. 2 diesel (ULSD) fuel oil, less than 0.0015 percent sulfur. (6) Operated by TEMES pursuant to a build-own-operate-transfer (BOOT) Agreement expiring in December 2017. (7) Operated by MEC pursuant to a BOOT Agreement expiring in January 2019. (8) Operated by Pruvient pursuant to a BOOT Agreement expiring in August 2017.
The section below summarizes the unit characteristic assumptions utilized as inputs for the computer modeling of the IRP.

SUPPLY SIDE OPTIONS Guam Power Authority 2013 Integrated Resource Plan
7-3
7.2 Existing Units
7.2.1 Boiler/STG Units
Our projections of the performance of the boiler/STG units are based on performance test data and historical operating data, with adjustment for the various scenarios, as applicable. Similarly our capital expenditure and O&M cost projections are based on historical O&M data, including cost data, in addition to our experience with other units of similar vintage utilizing similar technology. We note TRC, GPA’s environmental consultant, reported that the boiler/STG units must comply with Boiler MACT and National Ambient Air Quality Standards (NAAQS) by no later than 2015 and 2017, respectively. Without obtaining an exemption or the addition of air quality control systems (AQCS) the units could be subject to shut down by the Environmental Protection Agency (EPA). Performance and cost information related to the AQCS was provided by TRC. An electrostatic precipitator (ESP) would need to be installed to meet Boiler MACT and a scrubber would need to be installed to meet NAAQS for each of the boiler/STG units. While TRC reported that a wet scrubber or a dry scrubber with an ESP/ baghouse could be installed to meet NAAQS, for the purposes of the IRP we have assumed that the potential AQCS addition would consist of a limestone forced oxidation wet flue gas desulfurization (wet FGD) unit, due to its lower capital costs and smaller footprint requirements. To that end, TRC projected that the water consumption, lime consumption, and waste disposal, and subsequently the O&M costs, would be slightly higher for the wet FGD versus the dry scrubber. We have also estimated the cost to convert the units to fire on natural gas, which TRC reported would eliminate the need to add AQCS equipment. The cost estimate for the natural gas conversion includes only the labor and materials associated with new equipment and modifications to existing equipment on-site to support firing on natural gas.
7.2.1.1 Cabras 1 and 2
The Cabras 1 and 2 units, each with a nominal net capacity rating of 60 MW are located near Apra Harbor and fire on either high sulfur (HS) or low sulfur (LS) residual fuel oil (RFO) depending on the wind direction. LS RFO is utilized during periods of time when the wind direction is toward the island to minimize the impact of emissions on Guam. Additionally waste oil from the island is blended into the HS RFO fuel supply to avoid treatment or off-island disposal. The units entered commercial operation over 35 years ago.
At the time of our site visit, both units were operational. Based on data provided for the
units and our observations the performance of both units is suffering due to the cleanliness of the condensers and the performance of the air heaters. Capital expenditures going forward are needed to repair or replace the control systems, motor control centers (MCCs), fans and fan motors, air heaters, feedwater heaters, major motors and pumps, condensers, tanks, water treatment equipment, and the structure containing the units itself. GPA reported that some controls upgrades were in progress, including new burner management systems. While the suggested renewals and replacements are expected to result in only a minor improvement in performance of the units, the renewals and replacements are expected to improve the reliability and extend the life of the units. The “As-is” and “As-is with Capital Expenditures” scenarios have limited life expectancy (2017) due to the pending NAAAQS regulations, if AQCS are not

SUPPLY SIDE OPTIONS Guam Power Authority 2013 Integrated Resource Plan
7-4
installed. Similarly, the “LNG” scenario also has a limited life expectancy without capital expenditures due to the need for renewals and replacements described above. The tables below present the unit characteristics for Cabras 1 and 2 for the scenarios previously described.
Table 7-2
Cabras 1 Unit Characteristics Scenario As-is +Capex +Capex+AQCS LNG LNG+Capex Fuel Type HS/LS RFO HS/LS RFO HS/LS RFO LNG LNG Net Capacity-Max, MW 62.5 64.0 63.0 61.5 63.0 Net Capacity-Min, MW 15.6 16.0 15.8 15.4 15.8 Heat Rate-100%, Btu/kWh 11,700 11,466 11,641 12,000 11,810 Heat Rate-75%, Btu/kWh 11,612 11,380 11,554 11,910 11,721 Heat Rate- 50%, Btu/kWh 11,911 11,672 11,851 12,216 12,023 Heat Rate-Min, Btu/kWh 14,226 14,138 14,353 14,796 14,562 Forced Outage, % 6.0 6.0 6.0 6.0 6.0 Scheduled Outage, % 6.0 6.0 6.0 6.0 6.0 Availability, % 88.0 88.0 88.0 88.0 88.0 VOM, $/MWh 5.00 5.00 7.19 4.75 4.75 FOM, $/kW-yr 56.00 56.00 56.00 53.20 53.20 MM, $/MWh (1) 2.12 2.12 2.12 2.12 2.12 Capex, million$/yr (2) N/A 3.5 3.5 N/A 3.5 AQCS, million$ (3) N/A N/A 80.0 N/A N/A LNG Conversion, million$ (4) N/A N/A N/A 12.0 12.0 Retirement Date, yr 2017 2017 >25 yrs 2020 >25 yrs _______________________ (1) The projected major maintenance cycle (MM) includes boiler outages every other year and STG outages every five years. (2) Levelized annual expenditures through 2019 with $2.0 million annually thereafter. (3) One time expenditure with timing to comply with NAAQS by 2017. (4) One time expenditure with timing consistent with the availability of LNG. Excludes pipeline installation cost.

SUPPLY SIDE OPTIONS Guam Power Authority 2013 Integrated Resource Plan
7-5
Table 7-3
Cabras 2 Unit Characteristics Scenario As-is +Capex +Capex+AQCS LNG LNG+Capex Fuel Type HS/LS RFO HS/LS RFO HS/LS RFO LNG LNG Net Capacity-Max, MW 59.2 60.7 59.8 58.2 59.7 Net Capacity-Min, MW 14.8 15.2 14.9 14.6 14.9 Heat Rate-100%, Btu/kWh 11,400 11,172 11,342 11,639 11,507 Heat Rate-75%, Btu/kWh 10,754 10,539 10,699 10,979 10,855 Heat Rate- 50%, Btu/kWh 11,223 10,999 11,166 11,459 11,329 Heat Rate-Min, Btu/kWh 14,421 14,133 14348 14,723 14,557 Forced Outage, % 6.0 6.0 6.0 6.0 6.0 Scheduled Outage, % 6.0 6.0 6.0 6.0 6.0 Availability, % 88.0 88.0 88.0 88.0 88.0 VOM, $/MWh 5.00 5.00 7.58 4.75 4.75 FOM, $/kW-yr 56.00 56.00 56.00 53.20 53.20 MM, $/MWh (1) 2.12 2.12 2.12 2.12 2.12 Capex, million$/yr (2) N/A 3.5 3.5 N/A 3.5 AQCS, million$ (3) N/A N/A 80.0 N/A N/A LNG Conversion, million$ (4) N/A N/A N/A 12.0 12.0 Retirement Date, yr 2017 2017 >25 yrs 2020 >25 yrs _______________________ (1) The projected major maintenance cycle includes boiler outages every other year and STG outages every five years. (2) Levelized annual expenditures through 2019 with $2.0 million annually thereafter. (3) One time expenditure with timing to comply with NAAQS by 2017. (4) One time expenditure with timing consistent with the availability of LNG. Excludes pipeline installation cost.
7.2.1.2 Tanguisson 1 and 2
The Tanguisson 1 and 2 units, each with a nominal net capacity rating of 26.5 MW are located north of Apra Harbor on the western coast and fire on HS RFO. The units entered commercial operation over 35 years ago.
At the time of our site visit, both units were operational. Based on data provided for the
units and our observations, the performance of both units has degraded slightly relative to the nameplate rating due to normal wear and tear. Capital expenditures going forward are needed to repair or replace the control systems, motor control centers (MCCs), fans and fan motors, ductwork, air heaters, feedwater heaters, major motors and pumps, sea water heat exchangers, and insulation. The control system is dated and procurement of replacement parts and service are likely to become more challenging in the future. While the suggested renewals and replacements are expected to result in only a minor improvement in performance of the units, the renewals and replacements are expected to improve the reliability and extend the life of the units.
The “As-is” and “As-is with Capital Expenditures” scenarios have limited life expectancy
(2017) due to the pending NAAAQS regulations, if AQCS are not installed. Similarly, the “LNG” scenario also has a limited life expectancy without capital expenditures due to the need

SUPPLY SIDE OPTIONS Guam Power Authority 2013 Integrated Resource Plan
7-6
for renewals and replacements described above. The tables below present the unit characteristics for Tanguisson 1 and 2 for the scenarios previously described.
Table 7-4
Tanguisson 1 Unit Characteristics Scenario As-is +Capex +Capex+AQCS LNG LNG+Capex Fuel Type HS RFO HS RFO HS RFO LNG LNG Net Capacity-Max, MW 24.8 24.9 24.6 24.0 24.1 Net Capacity-Min, MW 6.2 6.2 6.1 6.0 6.0 Heat Rate-100%, Btu/kWh 13,400 13,350 13,550 13,802 13,751 Heat Rate-75%, Btu/kWh 13,200 13,151 13,348 13,698 13,648 Heat Rate- 50%, Btu/kWh 13,925 13,873 14,081 14,184 14,132 Heat Rate-Min, Btu/kWh 16,550 16,488 16,735 16,858 16,796 Forced Outage, % 4.0 4.0 4.0 4.0 4.0 Scheduled Outage, % 8.0 8.0 8.0 8.0 8.0 Availability, % 88.0 88.0 88.0 88.0 88.0 VOM, $/MWh 5.00 5.00 6.75 5.00 5.00 FOM, $/kW-yr 52.00 52.00 52.00 52.00 52.00 MM, $/MWh (1) 1.67 1.67 1.67 1.67 1.67 Capex, million$/yr (2) N/A 1.83 1.83 N/A 1.83 AQCS, million$ (3) N/A N/A 30.0 N/A N/A LNG Conversion, million$ (4) N/A N/A N/A 6.6 6.6 Retirement Date, yr 2017 2017 >25 yrs 2020 >25 yrs _______________________ (1) The projected major maintenance cycle includes boiler and STG outages every six years. (2) Levelized annual expenditures through 2019 with $1.0 million annually thereafter. (3) One time expenditure with timing to comply with NAAQS by 2017. (4) One time expenditure with timing consistent with the availability of LNG. Excludes pipeline installation cost.

SUPPLY SIDE OPTIONS Guam Power Authority 2013 Integrated Resource Plan
7-7
Table 7-5
Tanguisson 2 Unit Characteristics Scenario As-is +Capex +Capex+AQCS LNG LNG+Capex Fuel Type HS RFO HS RFO HS RFO LNG LNG Net Capacity-Max, MW 24.8 24.9 24.6 24.0 24.1 Net Capacity-Min, MW 6.2 6.2 6.1 6.0 6.0 Heat Rate-100%, Btu/kWh 13,400 13,350 13,550 13,802 13,751 Heat Rate-75%, Btu/kWh 13,200 13,151 13,348 13,698 13,648 Heat Rate- 50%, Btu/kWh 13,925 13,873 14,081 14,184 14,132 Heat Rate-Min, Btu/kWh 16,550 16,488 16,735 16,858 16,796 Forced Outage, % 4.0 4.0 4.0 4.0 4.0 Scheduled Outage, % 8.0 8.0 8.0 8.0 8.0 Availability, % 88.0 88.0 88.0 88.0 88.0 VOM, $/MWh 5.00 5.00 6.75 5.00 5.00 FOM, $/kW-yr 52.00 52.00 52.00 52.00 52.00 MM, $/MWh (1) 1.67 1.67 1.67 1.67 1.67 Capex, million$/yr (2) N/A 1.83 1.83 N/A 1.83 AQCS, million$ (3) N/A N/A 30.0 N/A N/A LNG Conversion, million$ (4) N/A N/A N/A 6.6 6.6 Retirement Date, yr 2017 2017 >25 yrs 2020 >25 yrs _______________________ (1) The projected major maintenance cycle includes boiler and STG outages every six years. (2) Levelized annual expenditures through 2019 with $1.0 million annually thereafter. (3) One time expenditure with timing to comply with NAAQS by 2017. (4) One time expenditure with timing consistent with the availability of LNG. Excludes pipeline installation cost.
7.2.2 Slow Speed Reciprocating Units
Our projections of the performance of the SSR units are based on performance test data and historical operating data, with adjustment for the various scenarios, as applicable. Similarly our capital expenditure and O&M cost projections are based on historical O&M data, including cost data, in addition to our experience with other units of similar vintage utilizing similar technology. TRC reported that AQCS need to be added to the SSR units to maintain environmental compliance with Reciprocating Internal Combustion Engines (RICE) Maximum Achievable Control Technology (MACT) by no later than 2014, if an exemption cannot be obtained. Without obtaining an exemption or the addition of AQCS the units could be subject to shut down by the EPA. Performance and cost information related to the AQCS was provided by TRC. If an exemption is not obtained the units will require either i) the installation of an oxidation catalyst and a switch to burning a residual fuel oil with a much lower sulfur content of 500-600ppm or to entirely ULSD, which would have minimal capital cost, but would add significant incremental fuel cost relative to the “As-is” scenario, or ii) the installation of a dry scrubber, baghouse and oxidation catalyst. GPA reported difficulty in sourcing a supply of ULS RFO and TRC reported that it is not aware of a reciprocating engine currently installed including a dry scrubber and baghouse. Either case would result in an incremental fuels cost increase relative to the “As-is” scenario and, in the case of adding a dry scrubber and baghouse, the O&M costs would be higher as well. For the purposes of the IRP, the SSRs are modeled with dry scrubber installations to process stack exhaust for the use of oxidation catalysts to control carbon
SUPPLY SIDE OPTIONS Guam Power Authority 2013 Integrated Resource Plan
7-8
monoxide. The installation would have to be completed by 2014 to support compliance with both RICE MACT by 2014 and NAAQS due by 2017. We have also estimated the cost to convert the units to fire on natural gas. The cost estimate for the natural gas conversion includes only the labor and materials associated with new equipment and modifications to existing equipment on-site to support firing on natural gas.
7.2.2.1 Cabras 3 and 4
The Cabras 3 and 4 units, each with a nominal net capacity rating of 37.7 MW are located near Apra Harbor and fire on either HS or LS RFO depending on the wind direction. LS RFO is utilized during periods of time when the wind direction is toward the island to minimize the impact of emissions on Guam. The units entered commercial operation over 15 years ago.
At the time of our site visit, Cabras 3 was in outage and Cabras 4 was operational. Based
on data provided for the units and our observations the performance of both units has degraded slightly relative to the nameplate rating due to normal wear and tear. Capital expenditures going forward are needed to repair or replace the control system, cooling systems, sea water coolers, building and stack structural components, investigate and remedy potential foundation issues, and to add a turbocharger cleaning system. While the suggested renewals and replacements are expected to result in only a minor improvement in performance of the units, the renewals and replacements are expected to improve the reliability and extend the life of the units. The “As-is” and “As-is with Capital Expenditures” scenarios have limited life expectancy (2014) due to the pending RICE MACT regulations, if AQCS are not installed. Similarly, the “LNG” scenario also has a limited life expectancy without capital expenditures due to the need for renewals and replacements described above. The tables below present the unit characteristics for Cabras 3 and 4 for the scenarios previously described.

SUPPLY SIDE OPTIONS Guam Power Authority 2013 Integrated Resource Plan
7-9
Table 7-6
Cabras 3 Unit Characteristics Scenario As-is +Capex +Capex+AQCS LNG LNG+Capex Fuel Type HS/LS RFO HS/LS RFO RFO LNG LNG Net Capacity-Max, MW 37.7 37.7 37.2 36.7 36.7 Net Capacity-Min, MW 19.0 19.0 19.0 19.0 19.0 Heat Rate-100%, Btu/kWh 9,130 9,130 9,250 9,380 9,380 Heat Rate-75%, Btu/kWh 9,221 9,221 9,343 9,474 9,474 Heat Rate- 50%, Btu/kWh 9,221 9,221 9,343 9,474 9,474 Heat Rate-Min, Btu/kWh 9,221 9,221 9,343 9,474 9,474 Forced Outage, % 2.5 2.5 2.5 2.5 2.5 Scheduled Outage, % 8.0 8.0 8.0 8.0 8.0 Availability, % 89.5 89.5 89.5 89.5 89.5 VOM, $/MWh 5.00 5.00 10.38 5.00 5.00 FOM, $/kW-yr 40.00 40.00 40.00 40.00 40.00 MM, $/MWh (1) 3.44 3.44 3.44 3.44 3.44 Capex, million$/yr (2) N/A 1.14 1.14 N/A 1.14 AQCS, million$ (3) N/A N/A 3.1/60 N/A 3.1 LNG Conversion, million$ (4) N/A N/A N/A 13.5 13.5 Retirement Date, yr 2014 2014 >25 yrs 2020 >25 yrs _______________________ (1) The projected major maintenance cycle includes a major overhaul every other year. (2) Levelized annual expenditures through 2019 with $1.0 million annually thereafter. (3) One time expenditure with timing to comply with RICE MACT by 2014. (4) One time expenditure with timing consistent with the availability of LNG. Excludes pipeline installation cost.

SUPPLY SIDE OPTIONS Guam Power Authority 2013 Integrated Resource Plan
7-10
Table 7-7
Cabras 4 Unit Characteristics Scenario As-is +Capex +Capex+AQCS LNG LNG+Capex Fuel Type HS/LS RFO HS/LS RFO RFO LNG LNG Net Capacity-Max, MW 37.7 37.7 37.2 36.7 36.7 Net Capacity-Min, MW 19.0 19.0 19.0 19.0 19.0 Heat Rate-100%, Btu/kWh 9,130 9,130 9,250 9,380 9,380 Heat Rate-75%, Btu/kWh 9,221 9,221 9,343 9,474 9,474 Heat Rate- 50%, Btu/kWh 9,221 9,221 9,343 9,474 9,474 Heat Rate-Min, Btu/kWh 9,221 9,221 9,343 9,474 9,474 Forced Outage, % 2.5 2.5 2.5 2.5 2.5 Scheduled Outage, % 8.0 8.0 8.0 8.0 8.0 Availability, % 89.5 89.5 89.5 89.5 89.5 VOM, $/MWh 5.00 5.00 10.38 5.00 5.00 FOM, $/kW-yr 40.00 40.00 40.00 40.00 40.00 MM, $/MWh (1) 3.44 3.44 3.44 3.44 3.44 Capex, million$/yr (2) N/A 1.14 1.14 N/A 1.14 AQCS, million$ (3) N/A N/A 3.1/60 N/A 3.1 LNG Conversion, million$ (4) N/A N/A N/A 13.5 13.5 Retirement Date, yr 2014 2014 >25 yrs 2020 >25 yrs _______________________ (1) The projected major maintenance cycle includes a major overhaul every other year. (2) Levelized annual expenditures through 2019 with $1.0 million annually thereafter. (3) One time expenditure with timing to comply with RICE MACT by 2014. (4) One time expenditure with timing consistent with the availability of LNG. Excludes pipeline installation cost.
7.2.2.2 Piti 8 and 9
The Piti 8 and 9 units, each with a nominal net capacity rating of 43.2 MW are located near Apra Harbor and fire on either HS or LS No. 6 RFO depending on the wind direction. LS RFO is utilized during periods of time when the wind direction is toward the island to minimize the impact of emissions on Guam. The units entered commercial operation over 10 years ago.
At the time of our site visit, both units were operational. However, Piti 8 was utilizing
the Piti 7 generator step-up (GSU) transformer due to damage to the Piti 8 GSU. Based on data provided for the units and our observations, the performance of both units has degraded slightly relative to the nameplate rating due to normal wear and tear. Capital expenditures going forward are needed to repair or replace the GSU. While the suggested renewals and replacements are expected to result in only a minor improvement in performance of the units, the renewals and replacements are expected to improve the reliability and extend the life of the units. The “As-is” and “As-is with Capital Expenditures” scenarios have limited life expectancy (2014) due to the pending RICE MACT regulations, if AQCS are not installed. Similarly, the “LNG” scenario for Piti 8 and 9 also has a limited life expectancy due to the need for renewals and replacements described above. The tables below present the unit characteristics for Piti 8 and 9 for the scenarios previously described.

SUPPLY SIDE OPTIONS Guam Power Authority 2013 Integrated Resource Plan
7-11
Table 7-8
Piti 8 Unit Characteristics Scenario As-is +Capex +Capex+AQCS LNG LNG+Capex Fuel Type HS/LS RFO HS/LS RFO RFO LNG LNG Net Capacity-Max, MW 43.2 43.2 42.6 42.2 42.2 Net Capacity-Min, MW 21.0 21.0 21.0 21.0 21.0 Heat Rate-100%, Btu/kWh 8,690 8,690 8,804 8,896 8,896 Heat Rate-75%, Btu/kWh 8,777 8,777 8,892 8,985 8,896 Heat Rate- 50%, Btu/kWh 8,777 8,777 8,892 8,985 8,985 Heat Rate-Min, Btu/kWh 8,777 8,777 8,892 8,985 8,985 Forced Outage, % 2.0 2.0 2.0 2.0 2.0 Scheduled Outage, % 5.0 5.0 5.0 5.0 5.0 Availability, % 93.0 93.0 93.0 93.0 93.0 VOM, $/MWh 5.00 5.00 9.78 5.00 5.00 FOM, $/kW-yr 100.00 100.00 100.00 100.00 100.00 MM, $/MWh (1) 2.64 2.64 2.64 2.64 2.64 Capex, million$/yr (2) N/A 0.2 0.2 0.2 0.2 AQCS, million$ (3) N/A N/A 3.4/60 N/A 3.4 LNG Conversion, million$ (4) N/A N/A N/A 13.5 13.5 Retirement Date, yr 2014 2014 >25 yrs 2020 >25 yrs _______________________ (1) The projected major maintenance cycle includes a major overhaul every other year. (2) Levelized annual expenditures. (3) One time expenditure with timing to comply with RICE MACT by 2014. (4) One time expenditure with timing consistent with the availability of LNG. Excludes pipeline installation cost.

SUPPLY SIDE OPTIONS Guam Power Authority 2013 Integrated Resource Plan
7-12
Table 7-9
Piti 9 Unit Characteristics Scenario As-is +Capex +Capex+AQCS LNG LNG+Capex Fuel Type HS/LS RFO HS/LS RFO RFO LNG LNG Net Capacity-Max, MW 43.2 43.2 42.6 42.2 42.2 Net Capacity-Min, MW 21.0 21.0 21.0 21.0 21.0 Heat Rate-100%, Btu/kWh 8,690 8,690 8,804 8,896 8,896 Heat Rate-75%, Btu/kWh 8,777 8,777 8,892 8,985 8,896 Heat Rate- 50%, Btu/kWh 8,777 8,777 8,892 8,985 8,985 Heat Rate-Min, Btu/kWh 8,777 8,777 8,892 8,985 8,985 Forced Outage, % 2.0 2.0 2.0 2.0 2.0 Scheduled Outage, % 5.0 5.0 5.0 5.0 5.0 Availability, % 93.0 93.0 93.0 93.0 93.0 VOM, $/MWh 5.00 5.00 9.78 5.00 5.00 FOM, $/kW-yr 100.00 100.00 100.00 100.00 100.00 MM, $/MWh (1) 2.64 2.64 2.64 2.64 2.64 Capex, million$/yr (2) N/A 0.2 0.2 0.2 0.2 AQCS, million$ (3) N/A N/A 3.4/60 N/A 3.4 LNG Conversion, million$ (4) N/A N/A N/A 13.5 13.5 Retirement Date, yr 2014 2014 >25 yrs 2020 >25 yrs _______________________ (1) The projected major maintenance cycle includes a major overhaul every other year. (2) Levelized annual expenditures. (3) One time expenditure with timing to comply with RICE MACT by 2014. (4) One time expenditure with timing consistent with the availability of LNG. Excludes pipeline installation cost.
7.2.3 Medium Speed Reciprocating Units
Our projections of the performance of the MSR units are based on performance test data and historical operating data, with adjustment for the various scenarios, as applicable. Similarly our capital expenditure and O&M cost projections are based on historical O&M data, including cost data, in addition to our experience with other units of similar vintage utilizing similar technology. TRC reported that AQCS may need to be added to the MSR units to maintain environmental compliance with RICE MACT by no later than 2014, if an exemption cannot be obtained. Without obtaining an exemption or the addition of AQCS the units could be subject to shut down by the EPA. Performance and cost information related to the AQCS was provided by TRC. If an exemption is not obtained, then the units will require the installation of an oxidation catalyst. We have also estimated the cost to convert the Tenjo units to fire on natural gas. The cost estimate for the natural gas conversion includes only the labor and materials associated with new equipment and modifications to existing equipment on-site to support firing on natural gas.
7.2.3.1 Dededo 1 -4
The four Dededo MSR units, with a total nominal net capacity rating of 9.8 MW are located near Dededo and fire ULSD. The units entered commercial operation over 35 years ago.

SUPPLY SIDE OPTIONS Guam Power Authority 2013 Integrated Resource Plan
7-13
At the time of our site visit, Dededo 1 was in outage for turbocharger repairs and the remaining units were operational. Based on data provided for the units and our observations the performance of units has degraded slightly due to normal wear and tear. No significant capital expenditures are foreseen at this time, with the exception of the installation of the AQCS. However, certain levels of capital expenditures have been forecasted to maintain the performance and reliability, as well as to extend the life of the units. The “As-is” and “As-is with Capital Expenditures” scenarios have limited life expectancy (2014) due to the pending RICE MACT regulations, if AQCS are not installed. The tables below present the unit characteristics for the Dededo MSR units for the scenarios previously described.
Table 7-10
Dededo 1-4 Unit Characteristics Scenario As-is +Capex +Capex+AQCS Fuel Type ULSD ULSD ULSD Net Capacity-Max, MW (1) 9.8 9.8 9.8 Net Capacity-Min, MW 1.2 1.2 1.2 Heat Rate-100%, Btu/kWh 10,900 10,900 10,900 Heat Rate-75%, Btu/kWh 11,067 11,067 11,067 Heat Rate- 50%, Btu/kWh 11,718 11,718 11,718 Heat Rate-Min, Btu/kWh 11,718 11,718 11,718 Forced Outage, % 4.0 4.0 4.0 Scheduled Outage, % 4.0 4.0 4.0 Availability, % 92.0 92.0 92.0 VOM, $/MWh 8.00 8.00 8.00 FOM, $/kW-yr 55.00 55.00 55.00 MM, $/MWh (2) 7.50 7.50 7.50 Capex, million$/yr (3) N/A 0.4 0.4 AQCS, million$ (4) N/A N/A 0.4 Retirement Date, yr 2014 2014 >25 yrs _______________________ (1) Total capacity of all four units. (2) The projected major maintenance cycle includes a major overhaul every 20,000 operating hours. (3) Levelized annual expenditures. (4) One time expenditure with timing to comply with RICE MACT by 2014.
7.2.3.2 Manenggon 1 and 2
The Manenggon 1 and 2 units, with a nominal net capacity rating of 10.4 MW are located on the southeast side of the island and are leased by GPA from a resort. The units fire on ULSD. The units entered commercial operation over 15 years ago.
At the time of our site visit, both units were operational, but derated due to the need for
radiator repairs. Based on data provided for the units and our observations, the performance of both units has degraded slightly due to normal wear and tear. No significant capital expenditures are foreseen at this time, with the exception of the installation of the AQCS. However, certain levels of capital expenditures have been forecasted to maintain the performance and reliability, as well as to extend the life of the units. The “As-is” and “As-is with Capital Expenditures”

SUPPLY SIDE OPTIONS Guam Power Authority 2013 Integrated Resource Plan
7-14
scenarios have limited life expectancy (2014) due to the pending RICE MACT regulations, if AQCS are not installed. The tables below present the unit characteristics for the Manenggon MSR units for the scenarios previously described.
Table 7-11 Manenggon 1 and 2 Unit Characteristics
Scenario As-is +Capex +Capex+AQCS Fuel Type ULSD ULSD ULSD Net Capacity-Max, MW (1) 10.4 10.4 10.4 Net Capacity-Min, MW 2.6 2.6 2.6 Heat Rate-100%, Btu/kWh 9,290 9,290 9,290 Heat Rate-75%, Btu/kWh 9,430 9,430 9,430 Heat Rate- 50%, Btu/kWh 9,990 9,990 9,990 Heat Rate-Min, Btu/kWh 9,990 9,990 9,990 Forced Outage, % 4.0 4.0 4.0 Scheduled Outage, % 4.0 4.0 4.0 Availability, % 92.0 92.0 92.0 VOM, $/MWh 8.00 8.00 8.00 FOM, $/kW-yr 55.00 55.00 55.00 MM, $/MWh (2) 3.61 3.61 3.61 Capex, million$/yr (3) N/A 0.4 0.4 AQCS, million$ (4) N/A N/A 0.35 Retirement Date, yr 2014 2014 >25 yrs _______________________ (1) Total capacity of both units. (2) The projected major maintenance cycle includes a major overhaul every 20,000 operating hours. (3) Levelized annual expenditures. (4) One time expenditure with timing to comply with RICE MACT by 2014.
7.2.3.3 Talafofo 1 and 2
The Talafofo 1 and 2 units, with a nominal net capacity rating of 8.6 MW are located on the southeast side of the island and are leased by GPA from a resort. The units fire on ULSD. The units entered commercial operation over 15 years ago.
At the time of our site visit, both units were operational. Based on data provided for the
units and our observations the performance of both units has degraded slightly due to normal wear and tear. No significant capital expenditures are foreseen at this time, with the exception of the installation of the AQCS. However, certain levels of capital expenditures have been forecasted to maintain the performance and reliability, as well as to extend the life of the units. The “As-is” and “As-is with Capital Expenditures” scenarios have limited life expectancy (2014) due to the pending RICE MACT regulations, if AQCS are not installed. The tables below present the unit characteristics for the Talafofo MSR units for the scenarios previously described.

SUPPLY SIDE OPTIONS Guam Power Authority 2013 Integrated Resource Plan
7-15
Table 7-12
Talafofo 1 and 2 Unit Characteristics Scenario As-is +Capex +Capex+AQCS Fuel Type ULSD ULSD ULSD Net Capacity-Max, MW (1) 8.6 8.6 8.6 Net Capacity-Min, MW 2.1 2.1 2.1 Heat Rate-100%, Btu/kWh 9,770 9,770 9,770 Heat Rate-75%, Btu/kWh 9,920 9,920 9,920 Heat Rate- 50%, Btu/kWh 10,500 10,500 10,500 Heat Rate-Min, Btu/kWh 10,500 10,500 10,500 Forced Outage, % 4.0 4.0 4.0 Scheduled Outage, % 4.0 4.0 4.0 Availability, % 92.0 92.0 92.0 VOM, $/MWh 8.00 8.00 8.00 FOM, $/kW-yr 55.00 55.00 55.00 MM, $/MWh (2) 7.10 7.10 7.10 Capex, million$/yr (3) N/A 0.4 0.4 AQCS, million$ (4) N/A N/A 0.35 Retirement Date, yr 2014 2014 >25 yrs _______________________ (1) Total capacity of both units. (2) The projected major maintenance cycle includes a major overhaul every 20,000 operating hours. (3) Levelized annual expenditures. (4) One time expenditure with timing to comply with RICE MACT by 2014.
7.2.3.4 Tenjo 1-6
The Tenjo MSR units, with a total nominal net capacity rating of 25.9 MW are located on the southwest side of the island and fire on ULSD. The units entered commercial operation over 15 years ago.
At the time of our site visit, all six units were operational, but derated due to generator
and cooler limitations. Based on data provided for the units and our observations, the performance of the units have degraded slightly due to normal wear and tear and been further impacted by the generator and cooler limitations. Capital expenditures going forward are needed to repair or replace the stacks and address the generator and cooler limitations. While the suggested renewals and replacements are expected to result in only a minor improvement in performance of the units, the renewals and replacements are expected to improve the reliability and extend the life of the units. The “As-is” and “As-is with Capital Expenditures” scenarios have limited life expectancy (2014) due to the pending RICE MACT regulations, if AQCS are not installed. The tables below present the unit characteristics for the Tenjo MSR units for the scenarios previously described.

SUPPLY SIDE OPTIONS Guam Power Authority 2013 Integrated Resource Plan
7-16
Table 7-13
Tenjo 1-6 Unit Characteristics Scenario As-is +Capex +Capex+AQCS LNG LNG+Capex Fuel Type ULSD ULSD ULSD LNG LNG Net Capacity-Max, MW (1) 25.9 26.4 26.4 18.6 18.6 Net Capacity-Min, MW 2.2 2.2 2.2 1.6 1.6 Heat Rate-100%, Btu/kWh 9,600 9,600 9,600 10,080 10,080 Heat Rate-75%, Btu/kWh 9,740 9,740 9,740 10,227 10,227 Heat Rate- 50%, Btu/kWh 10,320 10,320 10,320 10,836 10,836 Heat Rate-Min, Btu/kWh 10,320 10,320 10,320 10,836 10,836 Forced Outage, % 2.5 2.5 2.5 2.5 2.5 Scheduled Outage, % 4.0 4.0 4.0 4.0 4.0 Availability, % 93.5 93.5 93.5 93.5 93.5 VOM, $/MWh 8.00 8.00 8.00 7.60 7.60 FOM, $/kW-yr 55.00 55.00 55.00 52.25 52.25 MM, $/MWh (2) 7.10 7.10 7.10 7.10 7.10 Capex, million$/yr (3) N/A 0.6 0.6 N/A 0.6 AQCS, million$ (4) N/A N/A 1.05 N/A N/A LNG Conversion, million$ (5) N/A N/A N/A 6.0 6.0 Retirement Date, yr 2014 2014 >25 yrs 2020 >25 yrs _______________________ (1) Total capacity of all six units. (2) The projected major maintenance cycle includes a major overhaul every 20,000 operating hours. (3) Levelized annual expenditures. (4) One time expenditure with timing to comply with RICE MACT by 2014. (5) One time expenditure with timing consistent with the availability of LNG. Excludes pipeline installation cost.
7.2.4 Combustion Turbine Generators
Our projections of the performance of the CTG units are based on performance test data and historical operating data, with adjustment for the various scenarios, as applicable. Similarly our capital expenditure and O&M cost projections are based on historical O&M data, including cost data, in addition to our experience with other units of similar vintage utilizing similar technology. TRC reported that AQCS may need to be added to the CTG units in the event that capital expenditures trigger CTG MACT. This would require the addition of an oxidation catalyst and potentially a selective catalytic reduction (SCR) system. Without obtaining an exemption or the addition of AQCS the units could be subject to shut down by the EPA. Performance and cost information related to the AQCS was provided by TRC. We have also estimated the cost to convert the CTG units to fire on natural gas, which would eliminate the need to add AQCS equipment if the total emissions are reduced. The cost estimate for the natural gas conversion includes only the labor and materials associated with new equipment and modifications existing equipment on-site to support firing on natural gas.

SUPPLY SIDE OPTIONS Guam Power Authority 2013 Integrated Resource Plan
7-17
7.2.4.1 Dededo 1and 2
The two Dededo CTG units, each with nominal net capacity rating of 22.0 MW are located in the north central part of the island near Dededo and fire on ULSD. The units entered commercial operation over 15 years ago.
At the time of our site visit, neither unit was operational due to generator failures. Based
on data provided for the units and our observations the performance of units can only be estimated as the units have not operated for several years. With regard to capital improvements, in addition to the need to repair the generators, other equipment was in need of repair or replacement including the control system, stacks, the fin fan coolers, the black start diesel generator, and the water injection skids. The control system is dated and procurement of replacement parts and service are likely to become more challenging in the future. While the suggested renewals and replacements are expected to result in only a minor improvement in performance of the units, the renewals and replacements are expected to improve the reliability and extend the life of the units. The “As-is” and “LNG” scenarios have limited life expectancy (2012) due to the need to replace the generators and make other repairs. The tables below present the unit characteristics for the Dededo MSR units for the scenarios previously described.
Table 7-14
Dededo 1 and 2 Unit Characteristics Scenario As-is +Capex +Capex+AQCS LNG LNG+Capex Fuel Type ULSD ULSD ULSD LNG LNG Net Capacity-Max, MW (1) 22.0 22.0 22.0 22.0 22.0 Net Capacity-Min, MW 11.0 11.0 11.0 11.0 11.0 Heat Rate-100%, Btu/kWh 13,280 13,280 13,280 13,280 13,280 Heat Rate-75%, Btu/kWh 14,340 14,340 14,340 14,340 14,340 Heat Rate- 50%, Btu/kWh 15,670 15,670 15,670 15,670 15,670 Heat Rate-Min, Btu/kWh 15,670 15,670 15,670 15,670 15,670 Forced Outage, % 3.0 3.0 3.0 3.0 3.0 Scheduled Outage, % 6.0 6.0 6.0 6.0 6.0 Availability, % 91.0 91.0 91.0 91.0 91.0 VOM, $/MWh 6.00 6.00 6.00 6.00 6.00 FOM, $/kW-yr 12.50 12.50 12.50 12.50 12.50 MM, $/MWh (2) 7.05 7.05 7.05 7.05 7.05 Capex, million$/yr (3) N/A 10.0 10.0 N/A 10.0 AQCS, million$ (4) N/A N/A 1.8 N/A N/A LNG Conversion, million$ (5) N/A N/A N/A 2.0 2.0 Retirement Date, yr 2012 >25 yrs >25 yrs 2012 >25 yrs _______________________ (1) Capacity of each unit. (2) The projected major maintenance cycle is based on a 50% capacity factor or 200 starts per year. (3) Needed to ready units for operation followed by $0.4 million annually thereafter. (4) One time expenditure with timing to comply with CTG MACT. (5) One time expenditure with timing consistent with the availability of LNG. Excludes pipeline installation cost.

SUPPLY SIDE OPTIONS Guam Power Authority 2013 Integrated Resource Plan
7-18
7.2.4.2 Macheche
The Macheche CTG unit, with nominal net capacity rating of 19.0 MW is located in the north central part of the island near Macheche and fires on ULSD. The unit entered commercial operation over 15 years ago.
At the time of our site visit, the unit was operational. Based on data provided for the
units and our observations, the performance of the unit is limited on blade path spread due to a faulty variable stator vane (VSV) adjustment mechanism. With regard to capital improvements, in addition to the need to repair the VSV adjustment mechanism, other equipment was in need of repair or replacement including the control system, water treatment skid, water injection skid, and the black start diesel generator. The control system is dated and procurement of replacement parts and service are likely to become more challenging in the future. While the suggested renewals and replacements are expected to result in only a minor improvement in performance of the units, the renewals and replacements are expected to improve the reliability and extend the life of the units. The “As-is” and “LNG” scenarios have limited life expectancy due to the need to the needed renewals and replacements discussed above. Table 7-14 presents the unit characteristics for the Macheche CTG for the scenarios previously described.
7.2.4.3 Piti 7
The Piti 7 CTG unit, with nominal net capacity rating of 39.3 MW is located near Apra Harbor and fires on ULSD. The unit has been operational for over 15 years.
At the time of our site visit, the unit was operational, but unavailable to interconnect with the grid because the GSU was being utilized by Piti 8. The performance of the unit has degraded slightly relative to the nameplate rating due to normal wear and tear. This conclusion is bsed on data provided for the units and our observations. It excludes the fact that the GSU was being utilized by Piti 8. Regarding capital improvements, the control system needs to be upgraded as it is dated and procurement of replacement parts and service are likely to become more challenging in the future. While the suggested renewals and replacements are expected to result in only a minor improvement in performance of the units, the renewals and replacements are expected to improve the reliability and extend the life of the units. Table 7-16 presents the unit characteristics for the Piti 7 CTG for the scenarios previously described.

SUPPLY SIDE OPTIONS Guam Power Authority 2013 Integrated Resource Plan
7-19
Table 7-15
Macheche Unit Characteristics Scenario As-is +Capex +Capex+AQCS LNG LNG+Capex Fuel Type ULSD ULSD ULSD LNG LNG Net Capacity-Max, MW 19.0 19.0 19.0 19.0 19.0 Net Capacity-Min, MW 10.0 10.0 10.0 10.0 10.0 Heat Rate-100%, Btu/kWh 10,500 10,500 10,500 10,500 10,500 Heat Rate-75%, Btu/kWh 11,340 11,340 11,340 11,340 11,340 Heat Rate- 50%, Btu/kWh 12,390 12,390 12,390 12,390 12,390 Heat Rate-Min, Btu/kWh 12,390 12,390 12,390 12,390 12,390 Forced Outage, % 3.0 3.0 3.0 3.0 3.0 Scheduled Outage, % 5.0 5.0 5.0 5.0 5.0 Availability, % 92.0 92.0 92.0 92.0 92.0 VOM, $/MWh 6.00 6.00 6.00 6.00 6.00 FOM, $/kW-yr 13.00 13.00 13.00 13.00 13.00 MM, $/MWh (1) 7.75 7.75 7.75 7.75 7.75 Capex, million$/yr (2) N/A 0.82 0.82 N/A 0.82 AQCS, million$ (3) N/A N/A 0.9 N/A N/A LNG Conversion, million$ (4) N/A N/A N/A 1.8 1.8 Retirement Date, yr 2020 >25 yrs >25 yrs 2020 >25 yrs _______________________ (1) The projected major maintenance cycle is based on a 50% capacity factor or 200 starts per year. (2) Levelized annual expenditures through 2019 with $0.2 million annually thereafter. (3) One time expenditure with timing to comply with CTG MACT. (4) One time expenditure with timing consistent with the availability of LNG. Excludes pipeline installation cost.

SUPPLY SIDE OPTIONS Guam Power Authority 2013 Integrated Resource Plan
7-20
Table 7-16 Piti 7 Unit Characteristics
Scenario As-is +Capex +Capex+AQCS LNG LNG+Capex Fuel Type ULSD ULSD ULSD LNG LNG Net Capacity-Max, MW 39.3 39.3 39.3 39.3 39.3 Net Capacity-Min, MW 20.0 20.0 20.0 20.0 20.0 Heat Rate-100%, Btu/kWh 11,800 11,800 11,800 11,800 11,800 Heat Rate-75%, Btu/kWh 12,750 12,750 12,750 12,750 12,750 Heat Rate- 50%, Btu/kWh 13,900 13,900 13,900 13,900 13,900 Heat Rate-Min, Btu/kWh 13,900 13,900 13,900 13,900 13,900 Forced Outage, % 3.0 3.0 3.0 3.0 3.0 Scheduled Outage, % 6.0 6.0 6.0 6.0 6.0 Availability, % 91.0 91.0 91.0 91.0 91.0 VOM, $/MWh 6.00 6.00 6.00 6.00 6.00 FOM, $/kW-yr 98.00 98.00 98.00 98.00 98.00 MM, $/MWh (1) 3.88 3.88 3.88 3.88 3.88 Capex, million$/yr (2) N/A 0.4 0.4 N/A 0.4 AQCS, million$ (3) N/A N/A 1.8 N/A N/A LNG Conversion, million$ (4) N/A N/A N/A 2.0 2.0 Retirement Date, yr >25 yrs >25 yrs >25 yrs >25 yrs >25 yrs _______________________ (1) The projected major maintenance cycle is based on a 50% capacity factor or 200 starts per year. (2) Levelized annual expenditures through 2019 with $0.2 million annually thereafter. (3) One time expenditure with timing to comply with CTG MACT. (4) One time expenditure with timing consistent with the availability of LNG. Excludes pipeline installation cost.
7.2.4.4 Yigo The Yigo CTG unit, with nominal net capacity rating of 19.0 MW is located in the northeastern part of the island near Yigo and fires on ULSD. The units entered commercial operation over 15 years ago.
At the time of our site visit, the unit was operational. Based on data provided for the
units and our observations, the performance of the unit is limited on blade path spread due to a faulty variable stator vane (VSV) adjustment mechanism similar to Macheche. With regard to capital improvements, in addition to the need to repair the VSV adjustment mechanism other equipment was in need of repair or replacement including the control system, water treatment skid, water injection skid, and the black start diesel generator. The control system is dated and procurement of replacement parts and service are likely to become more challenging in the future. Further, the CTG package itself and the building housing the water treatment equipment need replacement due to severe corrosion. While the suggested renewals and replacements are expected to result in only a minor improvement in performance of the units, the renewals and replacements are expected to improve the reliability and extend the life of the units. The “As-is” and “LNG” scenarios have limited life expectancy due to the need to the needed renewals and

SUPPLY SIDE OPTIONS Guam Power Authority 2013 Integrated Resource Plan
7-21
replacements discussed above. The tables below presenst the unit characteristics for the Yigo CTG for the scenarios previously described.
Table 7-17
Yigo Unit Characteristics Scenario As-is +Capex +Capex+AQCS LNG LNG+Capex Fuel Type ULSD ULSD ULSD LNG LNG Net Capacity-Max, MW 19.0 19.0 19.0 19.0 19.0 Net Capacity-Min, MW 10.0 10.0 10.0 10.0 10.0 Heat Rate-100%, Btu/kWh 10,500 10,500 10,500 10,500 10,500 Heat Rate-75%, Btu/kWh 11,340 11,340 11,340 11,340 11,340 Heat Rate- 50%, Btu/kWh 12,390 12,390 12,390 12,390 12,390 Heat Rate-Min, Btu/kWh 12,390 12,390 12,390 12,390 12,390 Forced Outage, % 3.0 3.0 3.0 3.0 3.0 Scheduled Outage, % 5.0 5.0 5.0 5.0 5.0 Availability, % 92.0 92.0 92.0 92.0 92.0 VOM, $/MWh 6.00 6.00 6.00 6.00 6.00 FOM, $/kW-yr 13.00 13.00 13.00 13.00 13.00 MM, $/MWh (1) 7.75 7.75 7.75 7.75 7.75 Capex, million$/yr (2) N/A 12.0 12.0 N/A 12.0 AQCS, million$ (3) N/A N/A 0.9 N/A N/A LNG Conversion, million$ (4) N/A N/A N/A 1.8 1.8 Retirement Date, yr 2014 >25 yrs >25 yrs 2014 >25 yrs _______________________ (1) The projected major maintenance cycle is based on a 50% capacity factor or 200 starts per year. (2) Needed as soon as possible followed by $0.2 million annually thereafter. (3) One time expenditure with timing to comply with CTG MACT. (4) One time expenditure with timing consistent with the availability of LNG. Excludes pipeline installation cost.

SUPPLY SIDE OPTIONS Guam Power Authority 2013 Integrated Resource Plan
7-22
7.3 New Units
The table below presents the unit characteristics developed for the potential new generating resources to support modeling against the various scenarios of the existing units in the IRP.
Table 7-18
New Resource Unit Characteristics Scenario Repower New CC SMR Biomass Solar Wind OTEC SWAC Geothermal MSW
Fuel Type Natural Gas
Natural Gas Uranium Wood Sunlight Wind Seawater Seawater N/A MSW
Capital Cost, $000 81,000 128,400 858,000 78,600 45,000 93,000 150,000 144,600 52,200 84,600 Capital Cost, $/kW NA 2,140 9,533 7,860 4,500 4,650 15,000 12,050 5,220 8,460 Permitting Duration, Months 16 16 60 24 12 12 36 36 36 24 Start of Eng to COD, Months 24 28 48 30 24 24 24 18 24 30 Total Duration, Months 34 38 96 48 30 30 48 42 48 48 COD (1) Apr-17 Aug-17 Jun-22 Jun-18 Dec-16 Dec-16 Jun-18 Dec-17 Jun-18 Jun-18 Net Capacity-Max, MW 60 60 90 10 10 20 10 12 10 10 Net Capacity-Min, MW 40 40 30 5 N/A N/A N/A N/A N/A 5 Heat Rate-100%, Btu/kWh 8,400 8,350 N/A 17,500 N/A N/A N/A N/A N/A N/A Heat Rate-75%, Btu/kWh 8,650 8,600 N/A 18,000 N/A N/A N/A N/A N/A N/A Heat Rate- 50%, Btu/kWh 8,950 8,900 N/A 19,000 N/A N/A N/A N/A N/A N/A Heat Rate-Min, Btu/kWh 8,950 8,900 N/A 20,000 N/A N/A N/A N/A N/A N/A Forced Outage, % 2.0 2.0 2.0 6.0 1.0 2.0 6.0 1.0 4.0 6.0 Scheduled Outage, % 6.0 6.0 8.0 8.0 2.0 2.0 2.0 2.0 6.0 8.0 Availability, % 92.0 92.0 90.0 86.0 25.0 25.0 92.0 97.0 90.0 86.0 VOM, $/MWh 5.00 5.00 1.50 12.00 N/A N/A 11.00 2.00 8.00 12.00 FOM, $/kW-yr 42.00 42.00 200 400.00 40.00 50.00 290.00 80.00 100.00 400.00 _______________________ (1) Assumes Project is initiated in June 1, 2014

SUPPLY SIDE OPTIONS Guam Power Authority 2013 Integrated Resource Plan
7-1
7.3.1.1 Repower Piti 7
Unit characteristics were developed for the potential repowering of the Piti 7 GE Frame 6B CTG into a combined-cycle unit by converting the CTG to fire on natural gas, adding a heat recovery steam generator (HRSG), a STG, a condenser, heat rejection systems and associated pumps, piping, electrical and control equipment and interconnection to the grid. It would likely require the relocation of the existing control room and use of property to the north and east of the existing Piti 7 plant site. Additionally, it would likely require the use of the existing sea water intake structure for the abandoned Piti 4 and 5 units, or municipal water supply to provide make-up to a cooling tower.
7.3.1.2 New Combined-Cycle Unit characteristics were developed for the potential installation of a new combined-cycle
unit based on the use of a GE LM6000 CTG firing on natural gas. The plant would include an HRSG, a STG, a condenser, heat rejection systems and associated pumps, piping, electrical and control equipment, an interconnection to the grid. It would likely require the relocation of the existing control room. The unit could likely be installed in the location around the abandoned Piti 4 and 5 units. However, demolition and asbestos remediation costs to remove the existing structures, if necessary, have not been included in the cost estimate. Additionally, it would likely require the use of the existing sea water intake structure for the abandoned Piti 4 and 5 units, or municipal water supply to provide make-up to a cooling tower. Another alternative siting strategy GPA should consider is siting of a new combined-cycle combustion turbine in northern Guam to reduce system technical losses.
7.3.1.3 Small Modular Reactor
Unit characteristics were developed for the potential installation of a small modular nuclear reactor (SMR) based on information provided by others. SMR technology is in the development stages and assumptions relating to project development timelines and costs are likely to change in the future. The cost assumptions were for the infrastructure to support 6 x 45 MW of reactors with only two 45 MW reactors being installed. This would allow for on-site storage of spent fuel within the containment structure through at least three refueling cycles for each unit. Refueling was assumed to occur every four years with the average annual fuel cost of $30 million, including disposal after 10 years.
7.3.1.4 Biomass
Unit characteristics were developed for the potential installation of a biomass project. This project was assumed to utilize wood pellets sourced off-island as the fuel source for a bubbling fluidized bed or stoker type boiler in combination with a STG. Coordination of fuel supply and the disposal of ash would need to be investigated further prior to moving forward with this project.


