ASIST Asia Pacific NRDP IRAP/GIS Project ….Reaching the Millennium Development Goals…. RATP No. 10 Integrated Rural Accessibility Planning (IRAP) Fourth Expert Group Meeting Hosted by Ministry of Rural Development Kingdom of Cambodia International Labour Organization Regional Office for Asia and the Pacific March 29-31, 2004, Siem Reap
Transcript
ASIST Asia Pacific NRDP IRAP/GIS Project
….Reaching the Millennium Development Goals….
RATP No. 10
Integrated Rural Accessibility Planning (IRAP)
Fourth Expert Group Meeting
Hosted by Ministry of Rural Development Kingdom of Cambodia
International Labour Organization Regional Office for Asia and the Pacific
March 29-31, 2004, Siem Reap
ANNEXES
Annex 1 Foreword
Annex 2 Opening Address
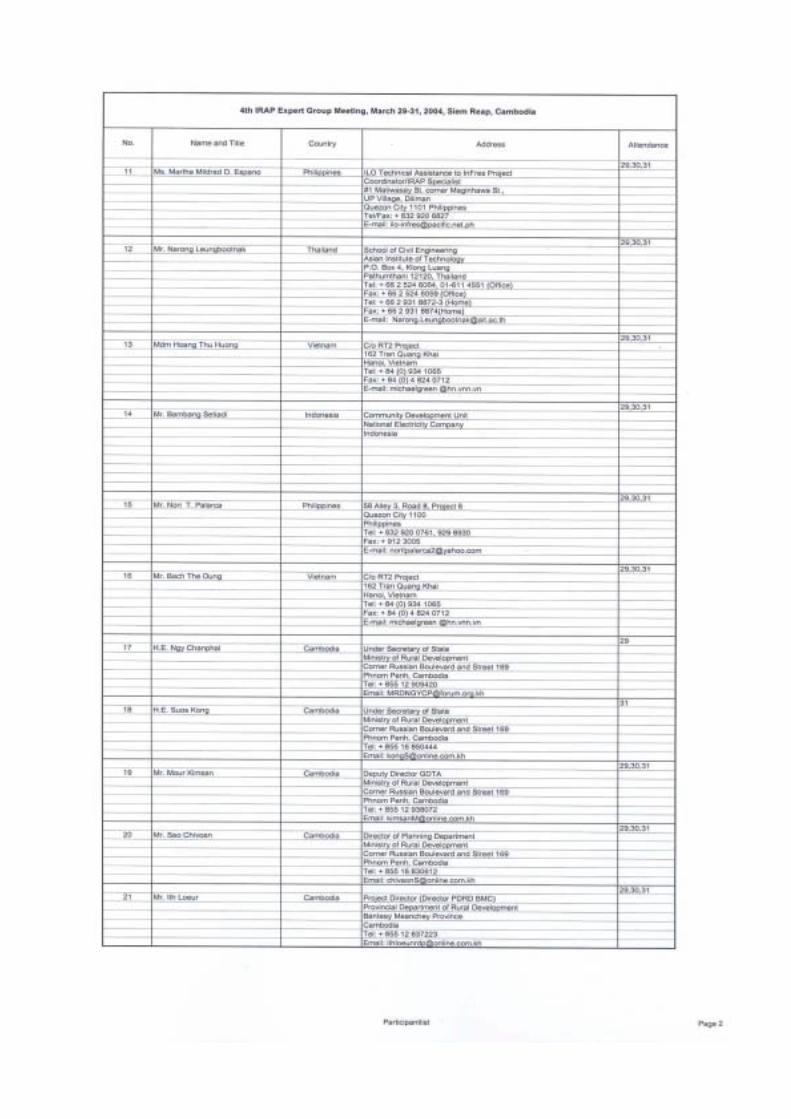
Annex 3 List of Participants
Annex 4 IRAP Report
Annex 5 Cambodia
Annex 6 Indonesia
Annex 7 Philippines
Annex 8 LAO PDR
Annex 9 India
Annex 10 Nepal
Annex 11 Thailand
Annex 12 Afghanistan
ANNEX
Foreword 11
ForewordBackground The fourth regional IRAP meeting was held by ILO and the Ministry of Rural Development (MRD) in Siem Reap, Cambodia, from 29-31st March 2004. The ILO ASIST-AP Programme, jointly with the IRAP/GIS project under the Northwest Rural Development Programme (NRDP), organized and financed
the meeting while MRD hosted the meeting. The main theme of the meeting was “Institutionalizing and Mainstreaming the IRAP approach” and about 25 participants representing 9 countries (Afghanistan, Cambodia, India, Indonesia, Laos, Nepal, Philippines, Thailand and Vietnam) attended the meeting. The Agenda and List of Participants are given in the
Annexes. This Meeting Report includes all papers and presentations prepared for the meeting.
The first regional IRAP meeting was funded by ILO, organized by the International Forum for Rural Transport and Development (IFRTD) and hosted by the Local Government Engineering Department (LGED) in Dhaka, Bangladesh, in 1997. The main objective was to introduce and discuss the IRAP approach which was at that time being developed in the Philippines and Laos.
The second and third meeting were organized, funded and hosted by ILO ASIST-AP in 2001 and 2003 respectively. The main objective of these meetings was to share best practices and discuss technical issues.
IRAP and the Millennium Development Goals (MDGs) IRAP consists of a set of tools for use at the local government level to, in a participatory manner, identify and prioritize investments in rural areas that will improve the access of the rural population to basic needs and social and economic goods, services and facilities. IRAP is complemented by a capacity building process to enable local planners to use the tools. Using the IRAP tools enables local planners to identify “access-poor” communities in different sectors (agriculture, education, health, water supply, transport etc.).
A lack of access is one of the fundamental reasons for poverty. Improving rural access contributes to the achievement of the Millennium Development Goals (MDGs). Investing in rural access is essential for employment creation and income generation (reducing by half the proportion of people living on less than a dollar a day and/or suffering from hunger), improving access to
primary education and health care (achieving universal primary education, reduce child mortality and improve maternal health) and improved living conditions (ensuring environmental sustainability by, amongst others, reducing by half the proportion of people without sustainable access to safe drinking water)1.
Although the number of poor is falling in Asia, still two in three of the world’s poorest live in Asia. The international development community will have to do much more in the Asia region if it wants to achieve the MDGs by 2015.
IRAP contributes to the achievement of the MDGs. Strengthening capacity of local planners and institutions to identify access poor communities and develop appropriate interventions in a participatory manner increases the impact of local investments in terms of poverty reduction. Responsibilities and resources for improving
access in rural areas in the Asia region have been mostly decentralized to local authorities. It is at this level that the bulk of investments will be decided upon. Consequently, it is at this level where the main progress towards reaching the MDGs can be achieved.
Institutionalizing and Mainstreaming IRAP Different developments are taking place in different countries. The papers and presentations in this report testify to this. What seems common in most countries is an effort to institutionalize IRAP, to make it part of an established institution. A string of pilot and demonstration projects has been successfully completed in the region over the years. It is much more difficult however to scale-up activities and ensure that the procedures will be used on a sustainable basis. To achieve this, the IRAP procedures need to become part and parcel of an established organization with the appropriate mandate. The process of institutionalization is complex as it requires adoption, endorsement and approval of the procedures, mandates, counterparts, expertise, training capabilities and financial resources.
Mainstreaming IRAP seems easier as local governments are interested in using the relatively easy and inexpensive approach to identify and justify their rural investments. IRAP often strengthens the planning procedures and practices that are already in place and adds value to data collection and
1 The MDGs are described in more detail on the following website: www.un.org/millenniumgoals/
analysis, mapping, priority setting and project development activities. Mainstreaming IRAP, to make it part of the common tasks of local planners, however requires training capacity and resources as there are many local governments and local staff often changes. To achieve a continuous application of the tools therefore requires both institutionalizing IRAP at the central level and mainstreaming it at the local level.
Country Activities Although the IRAP tools have developed in different ways to respond to different needs in different countries, there are common elements. Improving access to basic needs and social and economic goods, services and facilities remains the main objective. Participation at both village level and
local government level is a must. Most countries apply a multi-criteria analysis to identify “access poor” communities. Local planners first identify villages where access is poor before identifying and prioritizing access interventions. Mapping is an important element. All these common elements and the general direction of developing IRAP in the different countries provided for an interesting three day discussion which was complemented with different field visits.
The section below summarizes the status of IRAP development in different countries as of March 2004:
Afghanistan The application of IRAP tools has been pilot tested in Kapisa province under the NEEP project. The main purpose is to develop a planning tool for rural roads. This has been a difficult exercise for different reasons. The Afghan representative however sees the potential for IRAP work in Afghanistan.
Cambodia IRAP activities in Cambodia are progressing well. The Ministry of Rural Development is trying to institutionalize the procedures and capacity building process and different donors (ADB, WB and KfW) are willing to integrate the tools in capital investment programmes. The project will implement a Training Needs Assessment in April/May to identify training needs of MRD planners and develop a training programme to lessen the capacity gap.
India A second round of application has started in Orissa State to fine-tune the procedures, integrate a local economic develop component and build capacity
within the Gram Panchayat Department in Orissa. A project outline has been submitted to DFID for support to scale-up activities.
Indonesia The IRAP manual and guidelines have been finalized. IRAP training has been included in a standard course for local government officials provided by a local University network. Demand for capacity building at local government level is increasing. Local governments are increasingly willing to co-finance activities however there is a need to find additional donor support to scale up activities.
Laos The Lao variant is now called Participatory Rural Transport Planning which analyzes the broader access needs of the communities but only identifies interventions in the transport sector. MCTPC has adopted the approach and receives support from Sida and the World Bank.
Nepal A second round of capacity building has started to fine-tune the procedures. The Department of Local Infrastructure and Agricultural Roads (DoLIDAR) seems keen to further develop guidelines and manuals to mainstream the procedures. IRAP procedures will also be included in a new World Bank funded project.
Philippines IRAP procedures are integrated in a large-scale agricultural development project funded by ADB and will be used to identify sub-projects. IRAP activities have been successful at the local level in terms of capacity building and project identification but earlier work to institutionalize IRAP in the Department of Interior and Local Government (DILG) seems to have failed.
ThailandA team of local consultants is working on a new planning manual for local governments (TAO). Elements of IRAP tools have been included in this manual to better address the access needs of rural communities and improve infrastructure identification practices at the local (tambon) level. This manual will be proposed to the Department of Interior to replace the existing, outdated, manual.
Vietnam Earlier collaboration with the Ministry of Construction to develop guidelines for use in Vietnam has been unsuccessful for different reasons. This time, participants from the Ministry of Transport participated in the meeting. IRAP was again perceived as a tool that could help local level planning in Vietnam and ASIST AP was asked to contact senior officials in the ministry to discuss possibilities of developing Vietnamese specific guidelines.
It was agreed in principle that the next IRAP meeting would be organized in the Philippines in late 2005.
Chris Donnges ILO ASIST-AP Bangkok
ANNEX
Opening Address 22
Opening Address HE. Mr. Ngy Chanphal, Under Secretary of State
Ministry of Rural Development At the Opening Sessien of the 4th Regional Integrated Rural
Accessibility Planning (IRAP) Workshop In Siemreap-Angkor, Cambodia -29-31 March 2004
Your Excellencies Distinguished Guests Ladies and Gentlemen Colleagues
On behalf of the Ministry of Rural Development of the Royal Government of Cambodia, I have a honor and pleasure to welcome you to this 4th Regional Integrated Rural Accessibility Planning, which is organized by the ASIST -AP of International Labour Organization. May I take this opportunity also to extend fur warmest welcome to this Great City of cultural richness of Angkor, in Siemreap: One place with two Civilizations. We also wish to reinsure that your stay in this City will be enjoyable and you always respected as our Special Guests to Cambodia.
Your Excellencies, Distinguished Guests Ladies and Gentlemen
Cambodia is at an important crossroads in its development. Three decades of constant and, at its worst, genocidal conflict only ended in 1998, devastating much of the country's physical and social infrastructure, economic capacity, and human and social capital. This has left Cambodia as one of the world's poorest 90 countries, with the GDP per capita of around US$300 in 2002. Despite five years strong growth, poverty remains high and human development indicators are low relative to other countries in the region.
In a country like Cambodia and I presumed in most of the Asian countries, the eradication of misery and the alleviation of poverty necessarily go through social and economic development of rural areas. In Cambodia, 90% of the poor live in rural areas. For the vast majority, they rely on subsistence agriculture and access to such natural resources as forestry and fisheries. In a few words, the lack of opportunities, the extreme vulnerability of the poor, low capabilities, and social exclusion could characterize poverty in my country.
IRAP-REGIONAL4-Openning 29 March 2004 –Siemreap 1 x 6
Here are some Main Findings from the Participatory Poverty Assessment in Cambodia, the exercise that was done to prepare the Second Socio-Economic Development Plan (2nd Five Years Plan 2001-2005):
¶ Significant numbers of poor people, particularly women and children, have to spend an inordinate amount of time each year for food. Consequently, they have no time to participate in village level activities.
¶ Land issues are very important to the poor. These include limited land availability per household, low productivity of the land, the presence of land mines and landlessness.
¶ Education opportunities are limited for the poor. Nearly 20 percent of their children could not attend school because of a lack of physical accessibility, especially n the Northeastern Mountain region where minorities live. Another constraint is imposed by the cost transport, clothing, learning materials.
¶Water resources, whether it is drinking or agricultural purpose, are widely inadequate.
¶ Lack of micro-finance is other key issue concerning the poor. Credit is needed for purchase of raft animals, farming implements and other agricultural inputs.
¶ Inadequate physical infrastructure is also a major cause of poverty.
¶ Poor or nonexistent roads and bridges not only limit access to social infrastructure facilities such as health centers and schools but also inflate the cost of goods and services transported into and out of villages.
Development Goals and Strategy
The Government's strategy for economic growth and poverty reduction is reflected in the Second Socio-Economic Development Plan 2001-2005 (SEDP II) and the National Poverty Reduction Strategy 2003- 2005 (NPRS). SEDP II is a comprehensive development program, focusing on promoting growth, regional integration, and reducing poverty. It serves as the Government's principal planning document. NPRS is closely based on SEDP II and elaborates the poverty reduction agenda, providing a framework for support by international development partners and a comprehensive set of monitoring indicators.
After the national elections of July 2003, the Government introduced a comprehensive reform agenda, known as the Rectangular Strategy 2004- 2008. The Rectangular Strategy is the implementation framework for SEDPII and NPRS for the third mandate of the Government. The strategy has four pillars: (i) high economic growth and enhanced competitiveness; IRAP-REGIONAL4-Openning 29 March 2004 –Siemreap 2 x 6
(ii) job creation; (iii) improved social equity; and (iv) increased public sector effectiveness. The enabling environment for successful implementation includes: (i) peace, political stability and social order; (ii) partnership with development agencies; (iii) macroeconomic and financial stability; and (iv) integration into the regional and world economy. The Rectangular Strategy identifies the following as the priority sectors: (i) agriculture; (ii) private sector development and employment; (iii) physical infrastructure; and (iv) human resource development.
Poverty and Rural Development
Poverty can be defined not only as a low income or lack of opportunities and choices but also includes low education, poor health, low productivity, lack of safe water supply, vulnerability, gender & ethnic minority discrimination and so on. The main causes of poverty are the lack of access to basic needs, namely education, health, foodstuffs, water supply, rural credit, shelter and other social services. Rural Development is a strategy designed to improve the economic and social life of a specific group of people resident in the country's rural areas -the rural poor (the World Bank).
What are the main issues in Rural Development pertinent to poverty:
¶ The rural people have poor access to rural roads, routes and transport infrastructure: Rural roads are a key priority for progress in rural areas. Access to education, health care and water is often a question of opening up rural areas by constructing rural roads with connections to urban centers.
However, the transport network, particularly rural roads, is inadequate. So far, of the total length of rural roads in Cambodia (estimated to be 28,000 km), around 11,000 km have been rehabilitated or constructed with earthfill or laterite (gravel) surfacing. This network provides only about 0.60 km of rural road for every 10 square km (1,000 hectares). Most of the remaining rural roads are impassable during the wet season.
¶ The rural people have poor access to rural water supply: Rural water supply plays a key role in the implementation of the government policies aimed at poverty reduction through the provision of small-scale irrigation for household rice production and the supply of safe drinking water to the population in rural areas.
IRAP-REGIONAL4-Openning 29 March 2004 –Siemreap 3 x 6
According to the 1998 Census, only 23.7% of rural households have access to safe drinking water, compared with 60% of urban households. For the poorest 20% of the rural population, the percentage with access to safe water falls to 4%. Infant mortality rate (IMR) surveys indicate an increase in IMR from 88/1000 to 95/1000 over the 1990 to 1997 period, a situation that is likely to be due, at least in part, to the low level of access to safe drinking water in rural area.
¶ The rural people have poor access to health care and sanitation: Poor health, poor education and low productivity is a major factor leading rural people into poverty. Primary health care is very crucial for rural people. The MRD will Promote more health education in rural areas in close cooperation with the Ministry of Health, which will be complementary to Health Center's out-reach activities.
According to the 1997 Human Development Report (MOP), the majority of Cambodian people do not I have access to sanitation and the rate of health service utilization is among the lowest in the world. At present, some 47% of the population does not have adequate access to health care service. The 1998 Census stated that only 8.6% of the rural population have access to improved toilet facilities, compared with 49% of urban population.
¶ The rural community, particularly the Village Development Committees (VDCs) are not strong enough to playa role as local institution to ensure sustainable rural development: The Village Development Committee (VDC) is an independent local Rural Development institution and has its self-determination in the direction, administration and management of village development activities.
VDC is the main agent of the Commune Council for village-based development. VDC will promote Sustainable Rural Development through the participation of the population in needs assessment, planning, design, implementation, monitoring & evaluation and community development management in the village. The participation of VDC in maintenance of village roads, wells, small-scale irrigation structures, schools, etc., will ensure the sustainable development of Rural Development programs and projects.
¶ The rural people have poor access to rural credit: Credit is needed to replace exploitative loans covering household rice deficit and to facilitate and improve rice production and yield by providing money for fertilizer and seed. These loans will help provide food security among poorer groups, allowing more productive, sustainable farming. Loans are also needed for income diversification through small-scale enterprise/business activities.
IRAP-REGIONAL4-Openning 29 March 2004 –Siemreap 4 x 6
¶ The ethnic minority people need more help to develop: Ethnic minority development is being highly considered by the Royal Government of Cambodia in the implementation of Poverty Reduction Policy. Further research and study need to be done to identify the ethnic minority groups, to understand their living conditions, culture, and their needs and to finalize ethnic minority policy.
How can basic services tie delivered effectively and efficiently in rural areas?
Improving Accessibility and Promoting Opportunities are the most important mandate of our Ministry of Rural Development. Rural access can be defined as the ability, the level of difficulty, of rural people to use, reach or obtain the necessary facilities, goods and services. Access is inversely related to time, effort and cost necessary to reach locations where one could avail over these goods and services.
¶Rural Development Planning needs to put more emphasis on appropriate local level planning tools to identify the real needs of rural people
Basic Minimum Needs (BMN) are defined as the needs essentials for the existence of each family or individual female and male in society at any given time. In rural development planning, they are used to identify needs that must be met. With the BMN indicator data for each locality, priority development plans can be geared towards the poorest areas by providing a development program to fit the area including the provision of roads, wells, reservoirs, small-scale irrigation systems, schools, health centers, etc. Determining the BMW indicators is an effective basis for measuring the standard of living or quality of life of rural people.
Why IRAP in Cambodia?
BMN and indicators will be researched through Integrated Rural Accessibility Planning (IRAP), which is a local level planning tool that approaches infrastructure provision and management through the concept of accessibility. IRAP function~ through an efficient participatory planning process that results in the preparation of local area plans. The MRD will implement IRAP in close cooperation with the Ministry of Planning and other concerned ministries and institutions.
IRAP-REGIONAL4-Openning 29 March 2004 –Siemreap 5 x 6
IRAP Planning tool is new to Cambodia. It was introduced to Cambodia by ILO's Upstream project in 1999. The tool was piloted in Siemreap Province where the procedure has been applied in nine of the twelve districts in this province and in two districts in Beanteay Meanchey. Our Ministry, MRD has adopted IRAP as a standard planning tool, because I RAP can provide:
¶A sector focus for MRD activities ¶A local participatory planning tool ¶A decentralized planning system in which the needs of the local communities are
effectively incorporated into district and provincial investment plans.
Now we intend to mainstream IRAP as a local level planning tool throughout the country.
In Cambodia, IRAP is at the early stage of development, this regional workshop will provide ample opportunities to exchange and expand on our mutual aspirations, experiences and indeed to successfully mainstreaming this planning tool. We therefore welcome every opportunity to exchange views and experiences with rural development and poverty eradication. Together, we have a better chance at confronting the one problem common to all of our societies: the plight of the poor and disadvantaged.
Within the spirit of Amity and Cooperation, I wish for the success of this Regional Workshop and May Peace, Prosperity will prevail in our region.
HAPPY KHMER NEW YEAR!
Thank you very much.
IRAP-REGIONAL4-Openning 29 March 2004 –Siemreap 6 x 6
ANNEX
List of Participants 33
ANNEX
IRAP Report 44
Workshop Report
4th Integrated Rural Accessibility Planning (IRAP) Experts’ Meeting International Labour Organization ASIST-AP
Siem Reap, Cambodia March 29-31, 2004
Theme: Integrated Rural Accessibility Planning: The Essence and the Ultimate Objective
1.0 Introduction
The International Labour Organization Advisory Support Information Services and Training for Asia and the Pacific (ILO ASIST-AP) oversees the regional application of the Integrated Rural Accessibility Planning (IRAP) procedure. IRAP is a simple, relatively inexpensive and user-friendly planning tool designed to help local government units identify access improvement rural infrastructure investments. The application has covered several developing countries in a span of over 12 years and has generated a number of practitioners and experts scattered in the region. A series of meetings were held to establish a network among IRAP-covered countries, provide a forum for sharing information and lessons learnt, and guide ILO ASIST AP in conducting follow-through actions. The first three meetings confirmed the usefulness of the ILO-developed local level planning tool as applied in different forms of government and in various levels of decision-making.
This 4th experts’ meeting aimed to better understand how the procedure can be mainstreamed and institutionalized while at the same time encourage participation and consensus building in improving the rural households’ access to basic goods, services and facilities. It has also been established that access to basic services can describe levels of poverty, and so IRAP is likewise seen as an alternative tool in identifying and implementing development programs to address rural poverty.
The 4th meeting in Siem Reap provided insights on how IRAP is accepted, applied, supported and mainstreamed into rural infrastructure planning. The meeting looked at the different situations and settings that support IRAP’s continued application. The essential elements of the procedure and the practical objectives that the applications wish to attain were discussed, as well as the ideal conditions for a successful introduction and the right environment that can sustain its use.
Field visits to the ILO Project sites around Siem Reap attested to the capacity built among the project’s technical staff, how the procedure has been applied and the tangible results of said application. The visits also provided inputs from the perspective of those who are now benefiting from the rural infrastructures that were identified and constructed through IRAP. District chiefs, who exhibited proficiency regarding the application and how it helped guide investments in rural infrastructures, authoritatively presented and discussed improved conditions in their respective areas and how the IRAP-generated plan is currently utilized by other interested organizations.
2.0 Schedule
Day 1, March 29, 2004
Time Activity Responsible Person
08:30 – 09:00 Registration
Introduction Message Dr. Geoff Edmonds ILO ASIST-AP 9:00 – 9:30
Official Opening Speech of the 4th Regional Workshop H.E. Ngy Chanphal Undersecretary of State, MRD
9:30 – 9:45 Coffee Break
IRAP in the Region: Setting Aims and Objectives Mr. Chris Donnges ILO ASIST-AP
9:45 – 10:15
Overview and Mechanics of the Workshop Mr. Nori T. Palarca Workshop Facilitator
10:15 – 11:15 Presentation 1 “Institutionalization and Mainstreaming
Effects in Cambodia” Mr. Doekle Wielinga Cambodia
11:15 – 11:30 Coffee Break
11:30 – 12:30 Presentation 2 “IRAP Approach and Pro-Poor Rural Infrastructure Planning: The Case of Indonesia
Mr. Roberto Akyuwen Indonesia
12:30 – 13:45 Lunch
14:00 – 16.:00 Field Trip: Visit to the Provincial Department of Rural Development (PDRD) with a presentation of the Directior and the IRAP team
Mr. Ros Sar Mr. Thong Thiro Mr. Cheab Bun Ang
16:00 – 16:15 Coffee Break
16:15 – 17:00 First day summary Mr. Nori T. Palarca Workshop Facilitator
Day 2, March 30, 2004
Time Activity Responsible Person 30 Mar 2004 09:00 – 10:00 Presentation 3 “IRAP Philippine Experience: Lessons on
10:00 – 11:00 Presentation 4 “Implementation of Participatory Rural Transport Planning”
Mr. Souksakhone Soutannouvong, Lao PDR
11:00 – 11:30 Coffee break
11:30 – 12:30 Presentation 5 “Infrastructure for Local Economic Development”
Mr. PK Pattanaik Orissa, India
12:30 – 13:45 Lunch
14:00 – 14:30 Travel to Angkor Thom District for field visit
14:30 – 15:00 Briefing by District Chief, Banteay Srey and Angkor Thom, Cambodia
Mr. Buth Kiry Mr. Thab Saroen
15:00 – 16:30 Field visit to the ILO Upstream Project in Angkor Thom District, Spean Ches and Peuk Snang
Mr. Ros Sor, PRDD Director
16:30 – 17:00 Closing of the Field Visit, travel back to Hotel for day’s summary
Day 3, March 31, 2004
Time Activity Responsible Person
08:30 – 09:30 Presentation 6 “Mainstreaming National Policies and Directives into IRAP”
Mr. Jagannath Ojha Nepal
09:30 – 10:30 Presentation 7 “Local Level Planning Process Improvement in Infrastructure Development: Case Studies in Thai Sub-District Local Government”
Mr. Narong Leungbootnak Thailand
10:30 – 10:45 Coffee break
10:45 – 11:45 Presentation 8 “Afghanistan: The Country, MRRD and IRAP”
Mr. Wahidullah Azizi Afghanistan
11:45 – 12:00 Remarks from Vietnamese Representative Mr. Bach Tu Dung, Vietnam
12:00 – 12:30 Concluding remarks and Closing Ceremonies H.E. Suos Kong Undersecretary of State, MRD Cambodia
12:30 – 13:30 Lunch
13:30 – 14:00 Departure from Apsara Hotel for Angkor Wat
3.0 Activity
Eight country presentations, divided into mainstreaming and institutionalization and application and implementation, described the current status of the application in the region. Brainstorming sessions that followed each presentation allowed the participants to have a closer look at other country experiences and expressed their impressions from their individual perspectives. These impressions were written on color-coded pieces of paper and later consolidated to provide a description that cuts across geographic boundaries and various forms of government. Said descriptions are categorized as follows:
¶ Major elements of the application, focused on the procedure itself ¶ Support structure during the application, i.e., delivery mechanism, local government
participation, policy environment, availability of resources, etc ¶ Level of participation of users and beneficiaries, i.e., actual involvement of those
tasked to apply the process and those who should benefit from the application ¶ Statement of demand for further application, or how is this expressed after intended
users and beneficiaries went through the experience ¶ How the tool fits into existing planning practices, or how the procedure is able to adapt
itself into what is already in use
A small group, composed of representatives from Nepal, Lao PDR, Indonesia, Philippines and India, was formed and tasked to process the results of the deliberations. The outcome formed the basis for describing the following:
¶ The essence of the procedure ¶ What is needed to ensure a successful application ¶ What can sustain the application ¶ What are the indicators of institutionalization
Section 4.0 indicates how the participants perceived the presentations.
4.0 Workshop Output
Major Elements Support Structure
User/BeneficiaryParticipation
Expression of Demand
How IRAP Fits into Existing
Planning Process
Cambodia:¶ Used as 3-5 yr
investment planning tool ¶ Area planning
using 5-sector approach¶ Multi-sectoral
analytical procedure used ¶ donor support ¶ Identifies
needs¶ Maps produced
using GIS
¶ Application in ADB-funded NRDP¶ Districts use
plan to guide investments ¶ Government
use IRAP plan to prioritize investments and convince donors¶ LPP and IRAP
outputs harmonized in prov’l plan by PRDC
¶ Provincial and district rural development committees ¶ District level ¶ LPP used for
planning small-scale village investments ¶ IRAP not
applied at village level but starts at district to province
¶ Preferred tool by MRD ¶ Donor’s use
of IRAP plan to guide their investments ¶ Government
prerogative to choose IRAP to prioritize investments
¶ Complements local planning process
¶ Strengthensand optimizes existing bottom-up rural development planning mechanism
¶ Complements Local Planning Program (LPP)
¶ Fits gov’t prog of infra dev’t to address poverty
Indonesia: ¶ Bottom-up rural
infra planning tool¶ Can optimize
existing prcess in 3 aspects: mechanism, participation and instrument ¶ 5-sector
analytical procedure ¶ univrsity-based ¶ empowers
community ¶ identifies needs
¶ Academic and training institutions ¶ New base:
Ministry of Economic Affairs ¶ Implementation
supported by national and local budget and community development funds
¶ Coord. Min. of Econ. Affairs, & Coordinating Ministry of People’s Welfare at national level ¶ At local level,
planners at district, sub-district and village levels ¶ Community
development fund (multi-national companies)
¶ Government agency (MEA) to take on the method
¶ Perceived to be morecomprehensive than PRA
Major Elements Support Structure
User/BeneficiaryParticipation
Expression of Demand
How IRAP Fits into Existing
Planning Process
Philippines¶ Multi-sectoral ¶ Simple¶ Inexpensive ¶ Easy to apply¶ Participatory ¶ Ranking by AI ¶ Channeled thru
agriculture sector ¶ Dependent on
donor funds ¶ Government
counterpart provided ¶ Nationwide
application ¶ Applied in a
decentralized gov’t situation ¶ Mainstreaming
difficult to attain ¶ Institutionali-
zation focus
¶ Started at the Dept of Interior and Local Government
¶ Currently with Dept of Agriculture
¶ Technical and financial support from external sources
¶ Not clear institutional address and deliverymechanism
¶ Moved around a lot
¶ Very political environment
¶ Involves many stakeholders for policy advocacy at various levels¶ Useful and
relevant to the target end-users, the local government units¶ Local planners
recipients of training program¶ Application at
village level
¶ At local level, depends upon the LGUs
¶ Little interest expressed at national level
¶ Demandfrom real users (LGUs) lacking
¶ Academic and training institutions can adequately address futuretraining requirements on IRAP
¶ Fits into local planning practices ¶ System
dynamics lacking ¶ Planning
technology among several others¶ Application
depends on local situation ¶ Access info
generatedproven to be of value to the LGUs as well as to the national agencies involved in rural development
Major Elements Support Structure
User/BeneficiaryParticipation
Expression of Demand
How IRAP Fits into Existing
Planning Process
Lao PDR: ¶ Road sector
focused, uses multi-sector analysis ¶ Transport only ¶ Village roads
identification process¶ Prioritization
process for road sector ¶ Uses labor-
based tech ¶ Helps identify
needs¶ Ownership and
responsibility also objectives ¶ Incorporates
cost sharing for infra
¶ Based and supported by the Ministry of Transport
¶ Centralgovernment budget with local contribution in kind
¶ Local and state support
¶ Supported by external financial and technical support especially for village planning activities
¶ Village level consultations ¶ Cost-sharing in
cash and in kind¶ Village
maintenance committees ¶ Based at
MCTPC (transport) but gives benefits to villagers ¶ Participation at
central, district and village levels ¶ Implementation
by villagers along the road
¶ Expressed by villagers without all-year round access road close to an all-weather road
¶ State adopted strategy on rural roads planning
¶ Villages requestthroughdistrict and province
¶ Can do routinemaintenance as a result of planning
¶ Standard tool for rural roads planning ¶ Provides
planning, labor-based construction, maintenance, and small contract mgt ¶ Access info
done through participatorymeeting with villagers for roadprioritization and ranking
India ¶ Used for local
economicdevelopment strategies¶ Covers 19
economicsectors ¶ Multi-sectoral ¶ Helps identify a
large range of social and economicinfrastructures
¶ District level ¶ Block level ¶ Village level ¶ National level
¶ IRAP method became one for local economic development
¶ Enjoys local government support
Major Elements Support Structure
User/BeneficiaryParticipation
Expression of Demand
How IRAP Fits into Existing
Planning Process
Nepal¶ Piloted as a
local level participatory planning tool ¶ Identifies
needs/solutions ¶ Multi-sectoral ¶ Incorporates
difficulty factor and quality in AI formula ¶ Propose use of
sector-specific indicators
¶ Centralgovernment support throughsectoral agencies
¶ Local government participation
¶ Districttransportmaster plan development
¶ Local level use to develop district Transport Master Plan of Rasuwa
Thailand ¶ IRAP
considered in study on the formulation of TAO (village) level planning procedure¶ Proposed TAO
procedure has SWOT as tool for analysis
¶ Procedureconsidersmapping and participatory elements of IRAP¶ IRAP planning
process fits into TAO strategic plan formulation
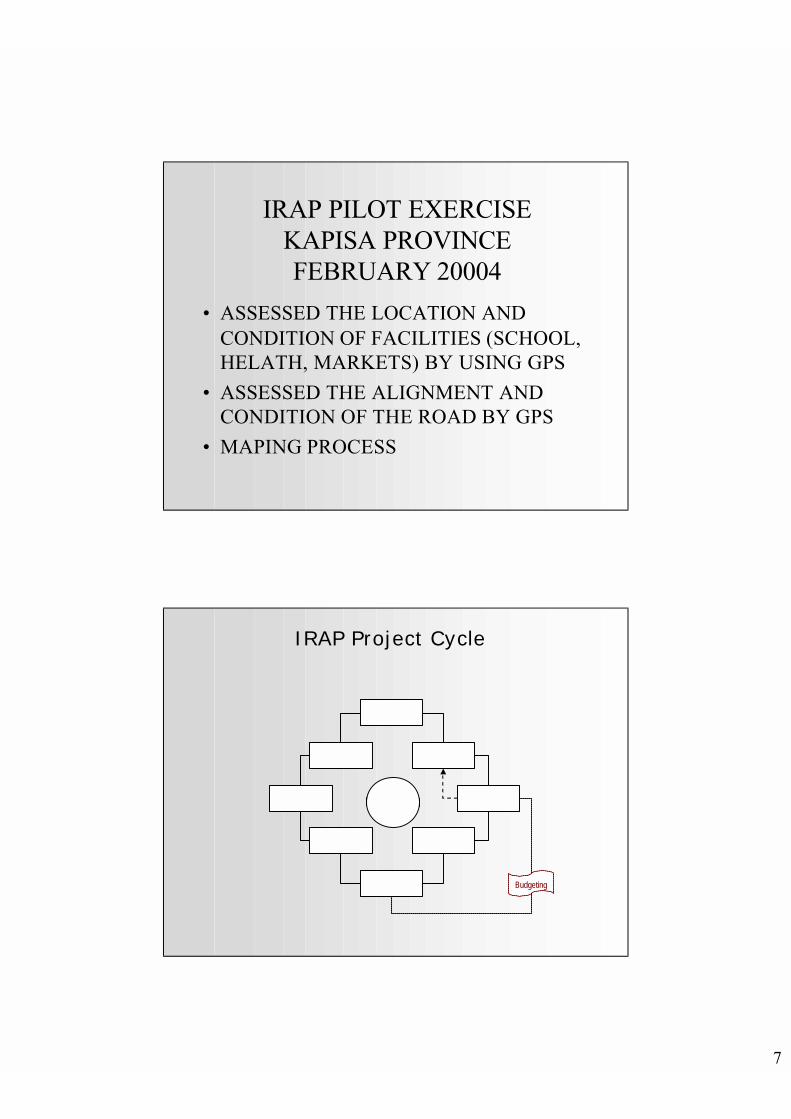
Afghanistan ¶ Still a pilot
activity¶ Generating info
on location and condition of basic facilities ¶ Updates info
on road alignment ¶ Working on
map production ¶ Needs external
assistance
¶Under the Nat’l Emergency Employment Program Rural Accessibility (NEEP-RA) of the Ministry of Rural Rehab and Dev’t (MRRD)
¶ Beneficiaries express need for more tangible assistance rather than a research study
5.0 Consolidated Worshop Output
The information tabulated in 4.0 were consolidated providing a universal description of IRAP as perceived by those who are directly involved in its promotion and application.
Major Elements Support Infrastructure
User/Beneficiary Participation
Expressionof Demand
How IRAP fits into Existing Planning
ProcessesPreference for multi-criteria analysis becoming a trend
State/central support (policy, resources)
National/state level (focal agency)
Centralgovernment provide clear directions
Partially fits with local level planning process
Multi-sectoral coverage in most countries
Donor support, both financial and technical provided
Local/village level Local government units express keen interest for IRAP
Fits well with central level planning process
Sector-focused (roads) in one country
Local support (resources) provided
Implementation of IRAP outputs (contributions in cash or kind)
Donor interest influence direction
Fits well with local level planning process (reinforces, strengthens, complements)
Participatory approachpracticed in all countries
Donor support present in all countries
Advocacy LGUs provide counterpart resources to confirminterest
Complements what is already in place, integration in a higher level plan
Procedureremains simple
Government counterpartstaff involved
Access to basic services still used as basis for needs identification
State support provided through policy pronouncement
6.0 Interpretation of Outcome
6.1 Essence
The use of IRAP in several countries affected the procedure but its basic characteristics of being a bottom-up participatory process, its simplicity, user-friendliness and ease of application remain common to all. In addition, the applications still adhere to the original concept that the rural households’ access to basic goods, services and facilities can be used as basis to determine development needs. Variations, however, were noted on the number of sectors covered. Some countries promoted and used IRAP as a multi-sectoral planning tool while it became a sector-focused planning instrument in some. The Philippines, India, Cambodia, Nepal, Indonesia and Afghanistan apply IRAP as a multi-sectoral tool, although the number of sectors covered varies between these countries. Lao PDR, on the other hand, is focused only on the road infrastructure sector but nevertheless declares that road prioritization also requires examination of the other basic services sector such as education, health, market, transport and/or potable water supply.
A variation on the analytical procedure to establish ranking among the target communities is also noted. Most countries apply the multi-criteria analysis using a scoring system they themselves apparently developed. On the other hand, the Philippines remains the only country that uses the original ranking procedure that takes into account only two variables – number of households affected, and travel time consumed to access the basic service facility. The multi-criteria analysis allows more variables into the ranking while the one used in the Philippines limits the assessment. Nepal, on the other hand, added the difficulty factor and quality of service to the evaluation but is not definite on the indicators stating that each service facility has its own set of indicators.
During the initial stages of IRAP in the Philippines, a question was raised on the mathematical operation used to determine ranking. The answer to the said question was simple: any mathematical operation can be used, for as long as this is applied consistently. The reason is that IRAP aims only to compare communities on the ease or difficulty of accessing a specific service facility. The comparison, done with the mathematical operation, results in the ranking of communities and identifies the one in the most difficult situation. Theoretically, said community should be given the needed intervention. This approach is presented to the local planners as a first level assessment, adding that it may change once the other items like resources, development trends, migration patterns, preferences of the local leadership, etc., are factored in.
6.2 Influence of the host government institution
From the presentations and the deliberations, it is very evident that the host government institution lends a hand in setting directions of the application, resulting in changes on the implementation of the technology. For instance, IRAP in Lao PDR is housed in a government ministry responsible for the development of the country’s rural roads, thus explaining its road sector focus. In India, an NGO implements the process in coordination with a government agency that oversees the provision of about 19 rural infrastructures, leading the application to cover more sectors than the other countries. In Indonesia, the project is based in an academic institution making education and awareness raising on IRAP an underlying objective. Their efforts enabled them to acquire the support of a government ministry thereby ensuring a sustained and broader application. The Philippines is housed in the national government
agency that deals with decentralization and governance thus making a central databank, like what IRAP has produced, a highly acceptable tool for monitoring. This is on the assumption that there will be periodic updating of the accessibility information in the bank.
The country experiences indicate that for IRAP to be introduced and successfully applied, it has to be flexible to suit not only the needs of target beneficiaries but also the mandate and programs of its host agency. The flexibility can be: either limiting the number of sectors examined; or, broadening the procedure’s coverage to include additional economic sectors like agriculture or irrigation.
6.3 Requirements for a successful introduction and application
From the country presentations, it can be inferred that the selection of the appropriate hostagency is a major task to accomplish. Said agency should be in a position to respond to expressed needs of target beneficiaries while effectively promoting the use of the IRAP technology. Accomplishment of such feat will help ensure not only support and acceptance at the national level but also provide the needed endorsement that will open doors for the procedure to link and collaborate with other agencies and organizations. This experience is very much demonstrated in the Philippine presentation where IRAP was successfully promoted and endorsed from the center by the Department of the Interior and Local Government (DILG) and from where it successfully covered the whole country. However, decentralization gave the responsibility of overseeing, monitoring and providing technical assistance on local level planning to another agency, the Housing and Land Use Regulatory Board (HLURB). It now becomes imperative for the IRAP project to make representations with the HLURB to include in their planning guidelines the IRAP technology for local government units to consider.
The selection of the right agency carries with it the provision of the counterpart staff that can work with the project team and help generate the critical mass of IRAP-proficient technical personnel. It is therefore imperative that a strong technical assistance team be formed at the center and be established as the source of information, expertise and resources. Building capacity over a broad geographic area will lay the foundation that will help sustain the use of the technology.
6.4 The need for pilot work and donor support
The initial work should always be a pilot activity and will require technical and financial support from a donor agency. This is very much emphasized in most of the country presentations. The pilot activity provides the opportunity to make the necessary adjustments and fine-tune the procedure to effectively adapt to the country conditions, such as changes in the number of sectors covered, or even adding some more sectors to make the application more significant and relevant. The pilot activity also provides opportunities to explore potentials for networking and test possibilities for collaborative work. This interim activity lends well to the optimal use of resources and helps clear up uncertainties that characterize pioneering efforts at development. The activity also provides confidence-building exposure and experience for those tasked to implement the IRAP planning tool. Most countries went through the pilot phase before going into the program stage.
6.5 What can sustain the application?
It is worthwhile to take note of the Indonesian presentation on how sustainability can be achieved. The advice is to first establish a track record to create a good impression on the host national government agency. Once this is done, immediately start work on the formulation of the appropriate set of local planning guidelines where the use of the IRAP tool can be incorporated. The endorsement of the host agency would also be needed for establishing the link with the country’s budgetary system to ensure a continuous flow of resources to prescribed activities.
The acceptance and approval of the guidelines will facilitate the mainstreaming of the IRAP procedure in local level planning.
6.6 Mainstreaming
Geoff Edmonds describes mainstreaming as “using the tool in the actual planning functions of LGUs and considered by national agencies such as health, education, public works, agriculture, etc., in their “inter and intra-sectoral priority investments”. In the Philippines presentation, it was stated that IRAP is considered mainstreamed at local level if the LGUs use the procedure as the preferred planning tool. The discussions on the floor however indicate two different approaches on mainstreaming.
In Lao PDR and Cambodia, concerned national government agencies made official pronouncements prescribing the use and application of the technology to perform specific tasks, like prioritization for rural roads or identification of rural infrastructure investments. Such pronouncements conveniently provide the rationale for the use of the technology at the prescribed local government unit level.
In the Philippines and Indonesia, the guidelines approach would be the plausible route to take as decentralization is already in place and mainstreaming IRAP would take more than just promotional activities in each local government unit. For instance, in the Philippines, the Housing and Land Use Regulatory Board (HLURB) is mandated to develop and monitor the implementation of the Comprehensive Land Use Planning (CLUP) Guidelines. The agency also extends technical assistance to municipalities and provinces in formulating or updating their development plans. The CLUP guidelines prescribe the use of the SWOT (strengths, weaknesses, opportunities, threats) technique in analyzing development conditions. Expectedly, municipalities and provinces apply said analytical tool in preparing or updating their plans. SWOT therefore, is mainstreamed in local level planning. Government has assumed responsibility for the application of the SWOT technique providing the agency, manpower and resources to do the task. IRAP should take a similar course of action for it to be mainstreamed.
Looking at the global perspective, efforts at mainstreaming the IRAP technology must take into consideration the form of government where it is being applied. In a highly centralized government, the support of a national government agency, expressed either through an executive order or a policy pronouncement, would be a prerequisite. The pronouncement is observed and respected by the concerned parties down to the local level. The promise of government taking over responsibility of sustaining the application is present, although most applications, as presented in the meeting in such government setup, still enjoys donor support.
In a decentralized government, the support of a national agency would come as an official endorsement prescribing a set of guidelines on how and where the technology is to be applied. In addition, a designated agency represented at local level and responsible to oversee the entire application must be available.
In both cases, the establishment of a credible track record is a must to get the full support of the host government agency. It will also help if the project design would incorporate a gradual phase-out of donor technical and financial support to ensure that government will take on the responsibility of continuing and sustaining the application.
For IRAP to be mainstreamed in a decentralized setting like the Philippines, it has to be part of a prescribed set of guidelines for a specific task. Considering that IRAP is designed only to react to current conditions and not like the broad forward-looking instrument such as the SWOT, its best application would be on the preparation of a local government unit’s Annual Investment Plan (AIP). SWOT, or even the alternative Participatory Rural Appraisal (PRA) and Problem Tree Analysis, are used on the preparation of short- or long-term plans. IRAP fits into this as it can take off from the provisions of the plan and then translate these into annual investment packages.
It can be said that it is more difficult to mainstream a local planning tool in a decentralized environment, as it would go against the spirit of decentralization for a central government agency to prescribe such processes to local governments. In a centralized setting, things would be different as it would be easy for a central agency to compel local governments to accept directives from above.
6.7 Indicators of institutionalization
Philippines presented that “institutionalization can be described best if the following conditions are present: there is an office in a national government agency responsible for IRAP; there is a focal organization or persons in charge of overseeing the promotion of the procedure; and, there is an allocation in the General Appropriations Act.”
Nepal added that institutionalization is not merely putting a small group of people in a ministry, structure or organization. It is concerned with promoting social values, policies or guidelines into a system. It is something that is governed by law and where actions are restricted to the provisions of said law. This is reinforced by Indonesia’s stand that the IRAP project, once established in a central government agency, should work for the formulation of guidelines on how it to be used, and its application fully supported by a proficient technical staff down to the field level with the required budget to cover costs.
A focal organization housed in a national government agency will provide the institutional address of the IRAP application. The formation of said organization, or unit in a government office, will facilitate the promotion and implementation of prescribed activities through an officially endorsed set of local planning guidelines. These guidelines should include how the output of the application will be consolidated and find its way up to the national level for consideration in national policy formulation and decision making processes.
In an ideal situation, institutionalization also entails mobilization of the relevant government bureaucracy for a concerted effort to create the vertical link and establish the flow of information to operationalize a bottom-up planning process.
Institutionalization for IRAP, therefore, should be characterized by the following: a focal organization at central level ably supported in the field by proficient technical personnel; a set of guidelines acknowledged and promoted to local government units; a regular allocation in the annual budget; and a policy pronouncement declaring its relevance to the country’s development planning processes.
7.0 Conclusion
The first three IRAP experts’ meetings established that this simple planning tool indeed works and has helped put in place a simple, relatively inexpensive and user-friendly system for identifying rural investment priorities in the countries where it is applied. The meetings also helped establish a network of practitioners and a modest pool of local experts in the region who can be relied upon to continue what has been started. Country experiences and lessons learnt were shared providing a global perspective of the application.
The 4th IRAP Experts’ Meeting went a little further by looking at these experiences and lessons acquired, in different forms of government and in various levels of decision making, in relation to the ultimate objectives of the application – institutionalization, mainstreaming and sustained use.
The outcome of this exercise is a clearer understanding of how IRAP application should be managed and directed in pursuit of the above-mentioned ultimate objectives. It is hoped that this can provide the “road map” for the current country applications, as well as for the new ones that will be initiated in the future.
Prepared by:
Nori T. Palarca Workshop Facilitator April 16, 2004
Integrated Rural Accessibility Planning (IRAP)
Institutionalizing and Mainstreaming Issues
Doekle WielingaChief Technical Advisor
ILO
IRAP/GIS Project
4th Regional IRAP WorkshopSiem Reap
29-31 March 2004
Content
• Definitions
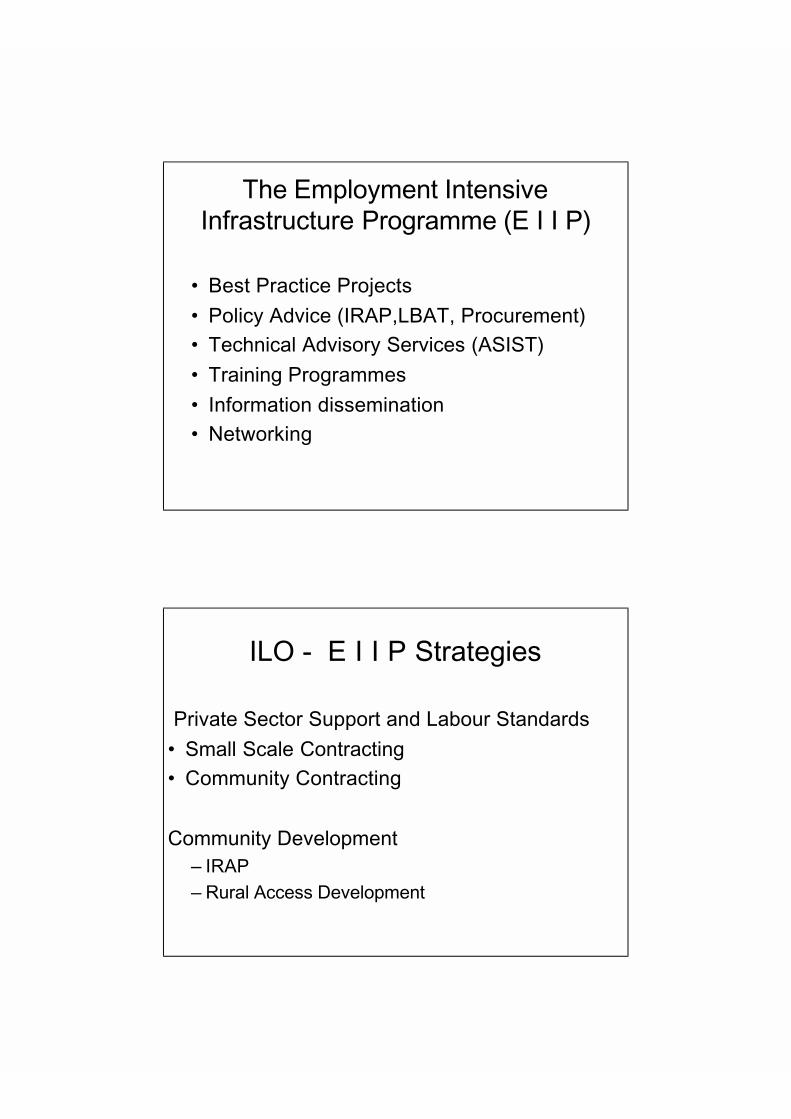
• Employment Intensive Infrastructure Programme
• ILO Involvement
• Institutionalization and Mainstreaming Issues
The Employment Intensive Infrastructure Programme (E I I P)
– Institute of Technology Support– Institutional Capacity Building MRD
• IRAP• Policies and Strategies• Socio-Economic Research• Low Cost Surface Options Research
– Partnership building: EIC, NFRTD, NFG, NIM
NRDP
North-westernRuralDevelopmentProject:
Siem ReapBattambangBanteay MeancheyOtdar Meanchey
IRAP/GIS Project Objectives
• IRAP application in the NRDP– 14 target districts– 21 non-target districts
• Institutionalization and Mainstreaming of IRAP in MRD– IRAP– Transport Infrastructure Inventory (TII)– Geographical Information Systems (GIS)– Maintenance Works Programme
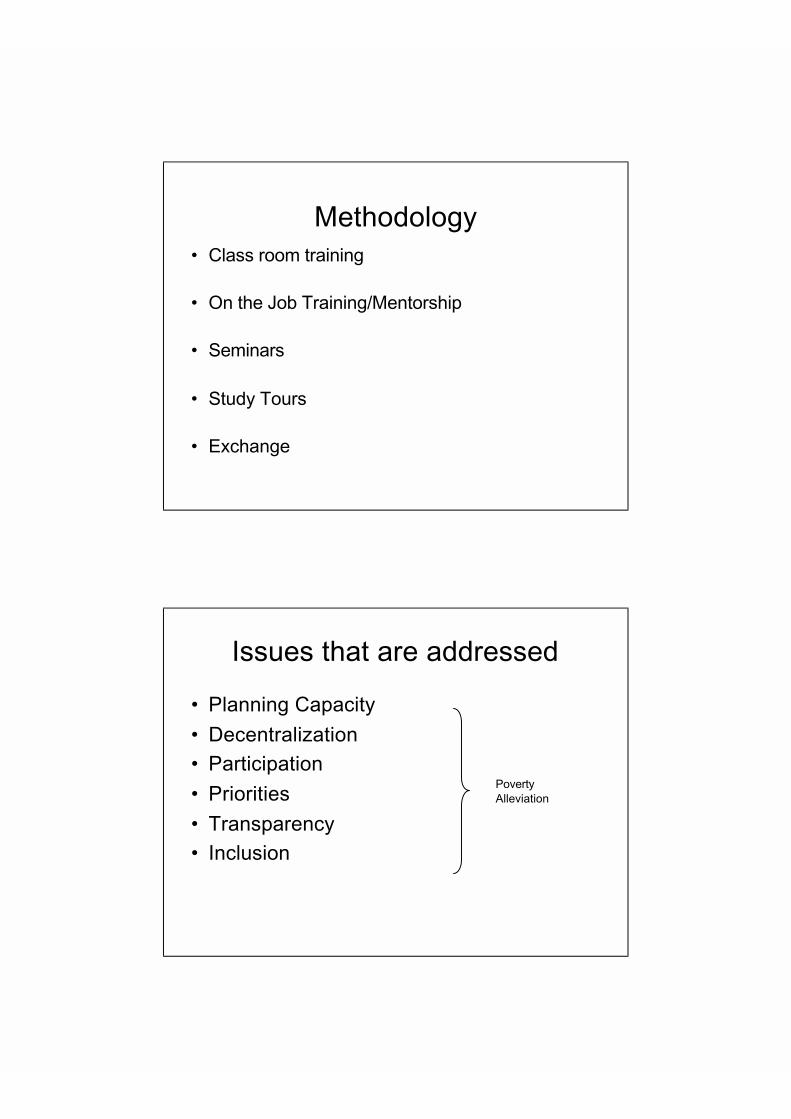
Methodology• Class room training
• On the Job Training/Mentorship
• Seminars
• Study Tours
• Exchange
Issues that are addressed
• Planning Capacity
• Decentralization• Participation
• Priorities
• Transparency• Inclusion
PovertyAlleviation
Institutionalize : to make part of a structured and usually well established system
Mainstream: to integrate into regular activities
…..two different issues…...
Definitions
To make part IRAP part of MRD
To have local planners use the IRAP tools (as part of their day-to-day planning activities)
When is IRAP “successfully” mainstreamed/institutionalized?
• IRAP is endorsed/approved/commonly accepted as a planning tool.
• National capacity for training exists (and available training materials, guidelines, technical follow-upcapacity)
• Demand, interest and willingness from local level to use the tools
• National budget allocation for staff, training etc..
What did we learn from other countries?
• Necessary to be in the right ministry from the start of IRAP activities (or have a pilot phase first with a University (NGO)).
• Need to integrate into the ministry as soon as possible and not first run a string of ad hoc projects (some pilots however will remain necessary).
• Select the appropriate sectors (difficult as there is often a different focus of host (ministry) and client provinces/districts))
What did we learn from other countries? (cont.)
• IRAP should be seen as a set of tools to strengthen existing planning processes rather than as a new parallel process.
• Strong demand from LGUs and willingness to continue using the tools is necessary.
• Involvement of local level politicians and decision makers is an absolute must.
• Institutionalization– Idea introduced during Seminars and Events– Statements reinforced this
• Samdech Hun Sen• SEDP II
• IRAP is preferred tool– Multi sector focus for MRD– Local participatory planning tool– Decentralized planning system
I & M in Cambodia
Considered Issues
• Institutional address
• Sectors• Level of operation
• Planning integration
• Application strategy• Sustainability
Institutional address
IRAP:Area Planning
Accessibility to Basicneeds and services
Poverty Alleviation
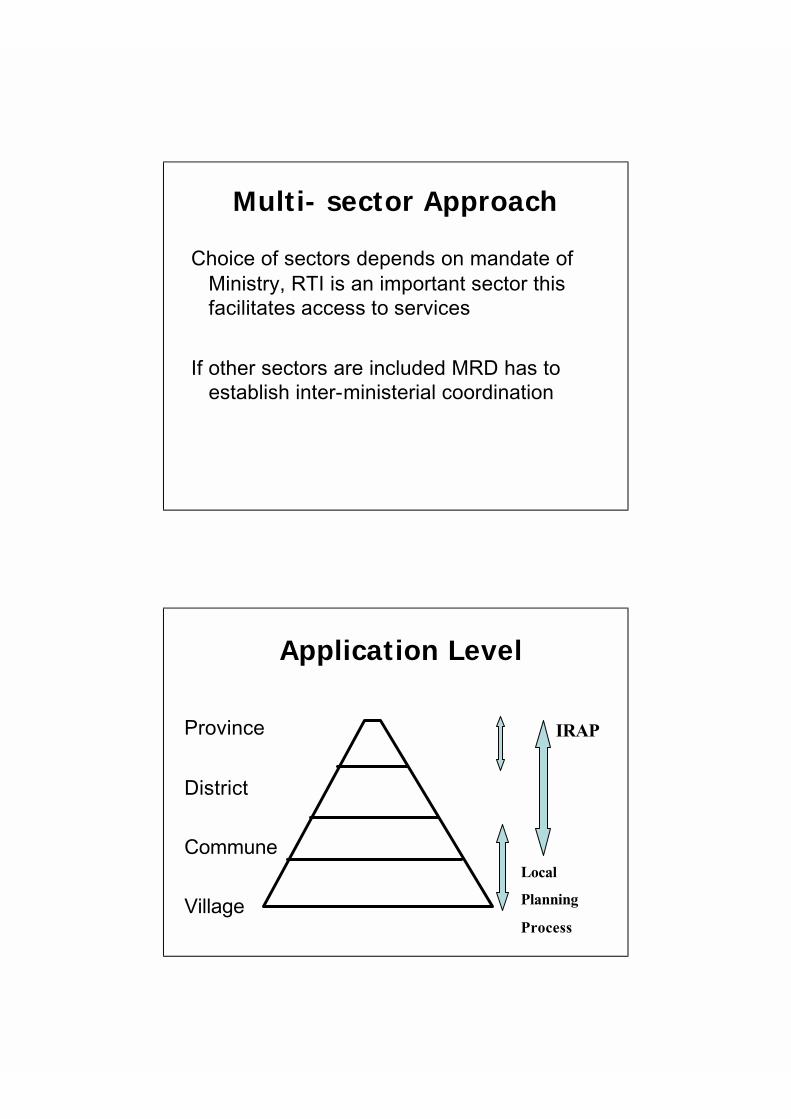
Multi- sector Approach
WATERWATER
Rural Transport Rural Transport InfrastructureInfrastructure
HEALTHHEALTHCARECARE
MARKETMARKETAgriculturalAgriculturalProduce and Produce and
inputsinputs
EDUCATIONEDUCATION
RURALRURALVILLAGEVILLAGE
EMPLOYMENTEMPLOYMENT
Choice of sectors depends on mandate of Ministry, RTI is an important sector this facilitates access to services
If other sectors are included MRD has to establish inter-ministerial coordination
Provincial Rural Development CommitteeApproval of AAPIntegration into Provincial Development Plan
Steps to Institutionalize IRAP– Position in the Ministry– Who is involved– What is the strategy– When will it take place– What are the resources needed
I & M in Cambodia
Where
– Why the Planning Department• Central role
• Department relates to all departments
• IRAP is also multi-sector approach
• IRAP unit can support and train planning officers other departments
• Steps to Institutionalize IRAP– How
• Senior Meeting• Approval Minister• Prakas• Adapt Mandate Department• Integrate IRAP• Establish Office• Assign Staff• Memorandum to all involved
• Steps to Institutionalize IRAP
– Resources:• SEDP II : $ 2,337,000.00
• Sources:– PIP– Infrastructure Programmes– One core donor to support and strengthen the process
• Strategy to Mainstream IRAP
– To apply into existing Rural Infrastructure Projects (NRDP, PRIP, TRIP)
– To include into new Rural Infrastructure Projects (Tonle Sap, Ecosorn, TRIP IV)
– One core donor needs to be identified to support and strengthen the entire process
9/20/2004 CAM IRAP 1
MINISTRY OF RURAL DEVELOPMENT
DEPARTMENT OF RURALDEVELOPMENT
OF
SIEM REAP PROVINCE
Mr. Ros Sar
9/20/2004 CAM IRAP 2
Siem Reap Province
9/20/2004 CAM IRAP 3
Population:733,882Area: 12,015 Sq.Kilometers12 Districts100 Communes907 Villages (875 approved by Mol)The average commune pop = 7,300 inhabitantsMany Communes are too small to be viable service delivery (see graph)Consolidation and inter-jurisdiction cooperation arrangements being considered by the RGC
Siem Reap: Administrative Division and communes’ Size
9/20/2004 CAM IRAP 4
Provincial Planning tool
! Provincial Planning Process
! Local Planning Process (LPP)
! Integrated Rural Accessibility Planning (IRAP)
9/20/2004 CAM IRAP 5
Approving CDP and CIP
Formulationof Integration
Programs
ProjectFormulationand Costing
Identificationof Strategies and Projects
Commune Planning ProcessPHASE 5:APPROVAL
PHASE 4:PROGRAMFORMULATION
PHASE 3:PROJECT FORMULATION
PHASE 2:STRATEGYIDENTIFIED
PHASE 1:ANALYSIS
1
3
2
115
8
7
4
9
10
4
Communelevel-NeedAssessment
Prioritizationof issues
Village Level Need
Assessment
Mid-termRevenueforecast
ProjectSelection
DistrictIntegrationWorkshop
Drafting
CDP and CIP
9/20/2004 CAM IRAP 6
Provincial Planning Process
Data collection Data checking, verifying and entry
JAN-MARStep 1: Socio Economic Data Collection
Data analysis and generationCommune profile formulation
Provincial profile formulation
APR-MAYStep 2: Provincial and Commune Socio Economic Profile Preparation and distribution
Sectoral Development and Investment Formulation
Provincial profile Provincial development frameworkProvincial investment program
Provincial M&E indicators
JUN-SEPStep 3: PDIP/PDP Formulation
-Provincial Development Plan 5 years (development framework)-Provincial Development Investment Plan (three years rolling plan)
Orientation on PIF guidelineSectoral investment activities submission
Individual sectoral investment fund appraisal and announcement
SEPStep 4: Provincial Investment Fund Allacation
9/20/2004 CAM IRAP 7
Provincial Planning Process
Commune Profile Needs and Analysis
District Profile/ Needs MartrixSectoral Priority/ Needs AnalysisDIW Process
Documentation of DIW
OCTStep 5: Integration of Planning
(District Integration Work Shop)
Sector Work Plan and Budget Preparation Provincial Seila Work Plan Consolidation , Validation
Approval and Submission to STF
NOVStep 6: Seila Work Plan and Budget Formulation
Draft of sectoral sub-contract with PRDC
Program Support Preparation with PRDC ExCom.Provincial Contract (GOV) with STF
NOVStep 7: Sub-contract/Project Formulation and Finalize
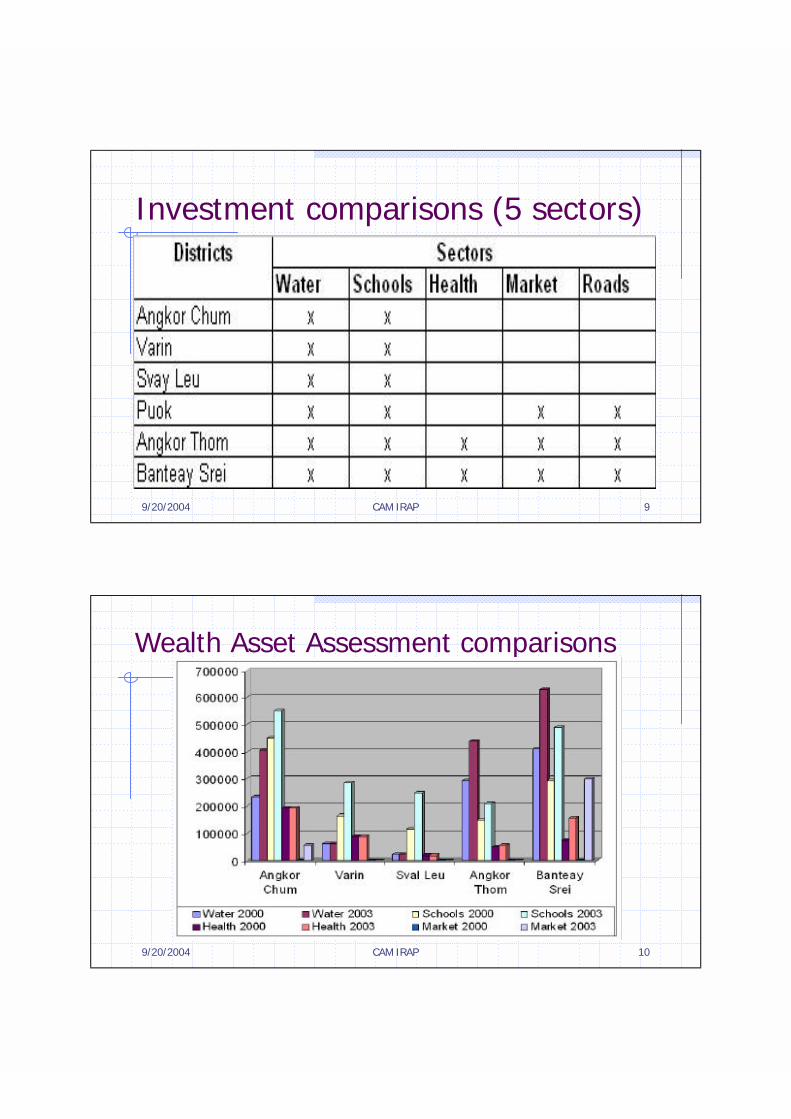
Result of verification for the North-western Rural Development Project (NRDP) implementation
Angkor Chum District, 2003
9/20/2004 CAM IRAP 12
Investment 2000 Investment 2003
Banteay Srei District
9/20/2004 CAM IRAP 13
RemarksThe updated AAP gives feed back concerning district or commune investmentMost of districts managed to have investments with the help of IRAP plans, like Angkor Thom and Banteay Srey District. Some other districts got investment in water and schools.A fixed updating period is still not established (3 or 4 years?), it depends on the investments
IRAP Approach and Pro-Poor Rural Infrastructure Planning:The Case of Indonesia
1. The Poverty C hallenge
It is well known that poverty is a global phenomenon. Different countries may face different intensity of poverty problems, and may have different policies and experiences in reducing poverty incidence. According to statistical data of Central Agency of Statistic, the population of Indonesia in 2003 is about 215.3 million people with the growth rate about 1.5 percent per year. The number of people living under the poverty line in 2003 has reached 37.3 million people or equal to 17.4 percent of total population. This implies that the number of poorpeople in Indonesia has decreased 1.1 million or 2.9 percent as compared to poverty incidence in 2002.
20,6
71,1
14,8
61,6
7,8
50,5
12
65,1
7,2
53,5
7,4
53,4
10,3
35,6
01020304050607080
Percent
1990 1993 1996 1999 2002 2003 2015
Year
Figure 1. Percentage of poor people in Indonesia under criterion of $ 1 and $ 2 per day
$ 1 per day$ 2 per day
Poverty has many dimensions. In addition to low income (living on less than $ 1 a day), illiteracy, ill health, gen der inequality, and environmental degradation are all aspects of being poor. This is reflected in the Millennium Development Goals (MDGs), the international community’s unprecedented agreement on the goals for reducing poverty (World Development Report 2004). Compared to the World Bank criterion of $ 1 a day as poverty line, the proportion of the poor in Indonesia is 7.4 percent of total population. But, it will reach 53.4 percent of total population if $ 2 per day is used as the poverty line. This mean that there are still many Indonesian families who are not currently categorized as poor but are vulnerable to falling into poor groups. This condition is due to a large number of families that live just above the poverty line. For example, the Human Development Report 2003 has revealed that the population without
2
sustainable access to an improved water sources in Indonesia was 22 percent, while those who live without access to improved sanitation was 45 percent, and births without being helped by skilled health personnel was 56 percent.
Most of Indonesia’s poor (78 percent) live in rural areas and depend on the agricultural sector for their main livelihood. Agricultural sector dominates the national employment scene with 41 million workers, of whom 80 percent areattached to the informal economy. Even though poverty is very much a rural phenomena, unfortunately, the rural poor are often confronted with disadvantages stemming from remoteness, lack of education and health care, insecure and unproductive jobs, high fertility and discrimination for women or ethnic minorities. Thus, poverty reduction policies and programmes must give strategic focus on rural development, and must create more opportunities for women and men to find work in the rural areas. Such policies not only promote economic growth, but also help alleviate urban poverty by restraining rural-urban migration (ILO Jakarta, 2003).
Table 1. Number of poor people in Indonesia divide by urban and rural areas
Given this close connection between the rural economy and poverty, the Indonesia government has made a formal commitment to rural development by seeking to implement measures that will stimulate off -farm employment opportunities. In particular, the government’s recent White Paper has focused on the development of small-scale agribusiness activities. Examples of judicious interventions that the government could consider include improvements in land tenure security, enabling farmers to diversify into agribusiness through provision of greater information and capacity-building, and nourishing linkages between small and large business.
Another plank of rural development is investment in rural infrastructure. A recent study suggests that there are significant weaknesses in the provision of infrastructure facilities in Indonesia (World Bank Jakarta, 2003). Around 50 percent of Indonesian households do not have access to electricity, while there
3
are only 9.1 telephones per 100 people. Approximately 50 percent of Indonesians in the poorest quintile do not have access to an asphalt road as the main road in the place in which they reside. Between 6 to 11 millions Indonesians do not have any reliable connection to any decent road or motorised transport network. These people are likely to reside in some of theleast accessible and disadvantaged areas of the country. Future public spending allocations would need to focus on the provision of rural infrastructure facilities. Connecting the rural poor to markets and services through a rural road network of a reasonable standard will form an important plank of the government’s poverty reduction strategy.
2. Poverty Reduction Strategy
Many governments are failing short on their obligation, especially to poor people (World Development Report 2004). To meet this responsibility, gov ernmentsand citizens need to make the services that contribute to health and education –water, sanitation, energy, transport, health, and education – works for poor people. Too often, these services are failing. Sometimes, they are failing everybody – except the rich, who can opt out of the public system. But at other times, they are clearly failing poor people. How do we know that these services are failing poor people?
First, while governments devote about a third of their budgets to health and education, they spend very little of it on poor people – that is, on the services poor people need to improve their health and education. Public spending on health and education is typically enjoyed by the non-poor. Second, even when public spending can be reallocated toward poor people – say, by shifting to primary schools and clinics – the money does not always reach the frontline service provider. Third, even if this share is increased, teachers must be present and effective at their jobs, just as doctors and nurses must provide the care that patients need. But they are often mired in a system where the incentives for effective service delivery are weak, wages may not be paid, corruption is rife, and political patronage is a way of life. Highly trained doctors seldom wish to serve in remote rural areas. The fourth way services fail poor people is the lack of demand. Poor people often don’t send their children to school or take them to a clinic. Weak demand can also be due to cultural factors, notably gender. Someparents refuse to send their daughters to school. Husbands have been known to prevent their wives from going to clinics – even for deliveries.
Many Indonesian women and men still live in poverty. The government ofIndonesia has made a serious commitment to put in place the right pro -poorgrowth policies that will allow people to break out of poverty. The commitment is shown by put the poverty reduction as the priority in Act No. 25 year 2000 on National Development Program. It was stated that the incidence of poverty has to be reduced by 4 percent within five years (2000 – 2004).
4
The recent achievement in macroeconomic stability in Indonesia has shown good indicators to stimulate business and economic growth. The challenge is how to bring the macroeconomic stability to develop micro, small, and medium enterprises to grow that will provide equitable development. Past experiences showed that emphasis on economic growth itself is not sufficient to solve the problem of poverty. The policy on economic development should guarantee the provision of basic public goods and services, such as health and education facilities, job opportunities, potable water, affordable foods and a good quality of the environment, fair justice and court system, and better social culturalatmosphere.
The government of Indonesia has reaffirmed its comitment to produce a comprehensive equitable growth and Poverty Reduction Strategy Paper (PRSP) by May 2004. The formulation of such strategy is based on participatory approach, which means that all stakeholders, including the poor, should have an opportunity to contribute. Beside participatory, the other basic principles of PRSP formulation are transparency, accountability, and mutual benefit. According to the World Bank (2003), the PRSP formulation in Indonesia is more participatory than other countries. Nevertheless, there still a big challenge on how the new strategy on poverty can encourage sectors to be more focused to meet the needs of the poor.
As a road map for full PRSP, Indonesia h as had the Interim PRSP in early 2003. The I-PRSP lays out four pillars of poverty reduction strategy, namely promoting/broadening opportunity, community empowerment, capacity buiding and human resource development, and social protection. These four pillars are basically derived from two main approaches, i.e. (1) increasing income of poor people through productivity improvement; and (2) lessening the expenditure of poor people to have access to basic, social, and economic services. On promoting the opportunities, the government along with private sectors and communities should make efforts to promote as much business and employment opportunities for poor people. The government, private sectors, and communities should also empower poor people to be able to attain their economical, social, and political rights. To strengthen the capacity of the poor, the government, private sectors, and communties have to assist poor people to enhance their capacity and capability. Finally, the government with the support of private sector and communities should provide social and security schemes to protect poorest groups due to natural disasters, negative impacts of economic crises, and social conflicts.
One of the key aspect is to maintain the link between the PRSP and planningand budgeting processes. Ideally, the PRSP should serve as a framework for the development of the relevant planning and budgeting instruments. Total budget allocation for poverty reduction programs in Indonesia was Rp 16.5 trillion in 2002, while the allocation for 2003 was Rp 11.9 trillion. This means that the
5
budget allocation for poverty reduction programs has decreased by 28 percent in 2003. Recently, there are 16 actual poverty reduction programs that have been implemented in 10 government institutions. These programs are including of family empowerment, agribusiness development, urban poverty, micro, small, and medium enterprises partnerships, revolving fund, small islands and coastal zone community empowerment, kecamatan development program, ruralinfrastructure development, women empowerment through local economic development, and land management.
It was realized that Indonesia needs to have a new poverty reduction strategy under a new political environment of freedom, democratization, and decentralization. Combating poverty should be based on the regional approach and decentralization policy, which provides a greater role of local government at the district level in reducing poverty. The decentralization effort and related fiscal framework is an important element to combat poverty and to better address the problem in every part of Indonesia.
In order to achieve poverty reduction target based on the National Development Program, strategic issues to be overcome in promoting opportunities are mainlyrelated to the lack of access to employment and factors of production. Lack of access to employment is influenced by level of education and health, while lack of access to factors of production includes of access to working capital, market, and asset ownership. Access to market and services to the poor can be improved through improving road infrastructure. The important consideration on this issue is how to ensure that the provision of road and other infrastructure will be actually benefits to the poor b y reducing the cost of accessibility to basic, social, and economic needs. On the other side, effort to increase the income of poor people will mostly relate to the improving of farmer incomes through micro and small-scale agribusiness.
3. Overview of the Infrastructure Condition
Economic infrastructure refers to infrastructure consisting of physical infrastructure which produces services to enhance economic productivity and living quality, such as transportation, telecommunication, electricity, and irrigation. The role of infrastructure in development can be seen from their contributions to economic growth and to the improvement of living quality. As far as macro economy is concerned, the availability of service from infrastructure influences marginal production of private capital while from micro economy point of view, the availability also affects the reduction of production cost.
The contribution of infrastructure to the improvement of living quality are shown by (1) the availability of amenities in physical environment; (2) the enhancement of prosperity including the increase in consumption value,
6
improvement of productivity from labour as well as access to job opportunities, and improvement in real prosperity; and (3) the realization of stability in microeconomy which is indicated by fiscal sustainability, developing credit markets and their influences on labour market.
In Indonesia, development planning of infrastructure puts emphasis more on physical planning, while service is not paid much attention. The impacts of long-lasting economic crisis demand total reformation in every living element of the country by giving significant influence on the level of availability, quality of services, and effectiveness in managing infrastructure. The economic crisesdecreases the capability in providing service on means and infrastructure, mainly because of the lack both financial capability in fulfilling the needs for operations and maintenance for existing networks of means and infrastructure.
Ratio of electrification was still low, that is around 58 percent in 2001. Besides, the absence of new investment in this field in the form of new generators brought about electricity crises in 28 regions outside Java and Bali islands. Ratio of electrification between v illages located in eastern and western part of Indonesia is 91 by 66 percent. The installing capacity of generators for western part was 92 percent while for eastern part was 8 percent. It was not possible to build an inter-connection networks for eastern part being as efficient as those for western part due to the uneven distribution of population.
In the year of 2000, as long as 140,000 km road (or 48 percent of 291.5 thousand km) was slightly and heavily damaged, including the main economic route, such as northern coastal areas in Java and eastern Sumatera. As long as 8,798 km of national and provincial roads were in a poor condition in 2000. For roads in district, the damage affected 134,443 km roads. Social and economic user costs was estimated to reach Rp 200 billion far exceeding the investment capability of government in roads. Since 1993/1994, roads in district were never in good conditions. On average, they were in both slight and heavy damage. Therefore, maintenance cost for roads was far from being adequate. As a result, backlog maintenance took place so that in 2001, the length of damaged national and provincial roads was doubled compared to that in 2000 which was 16,740 km while the damaged district roads reached around 150,000 km. Apart from the insufficient national budget, other factors causing the damages included excessive overloading, poor quality of road construction, natural disasters, as well as the absence of awareness of maintaining public asset.
Up to now, there are only around 8.8 million telephone connection or around 3 connections per 100 people all over Indonesia. Moreover, it is around 86 percent was located in western part of Indonesia. Law of telecommunication gives mandate for perfect competition for the procurement of teleco mmunicationalthough the implementation is very slow. No new networks for fixed lines were built since the crisis. Duopoly by PT Telkom and PT Indosat controlled the full
7
service network providers market. Therefore, the development of domestic telecommunication infrastructure at present depends on the capabilities of both companies. There has been no policy of Universal Service Obligation (USO) to conduct telecommunication development in unprofitable areas so that the even distribution of development of telecommunication infrastructure can not be guaranteed.
To support agriculture development, around 1.5 million ha out of 6.7 million ha irrigation networks in slightly and heavily damaged conditions. The government could only provide between 40 and 50 percent of operational and maintenance costs. Besides, between 15 and 20 thousand ha per year of irrigated agricultural fields were converted for non agricultural purposes. The continuous degradation of 62 out of 470 catchment areas was caused, among others, by uncontrolleddeforestation in the upper end the river. The damages in irrigation networks will lower the performance in the provision of irrigation water so that it will decrease the area’s length for rice plantation. If it is not remedied seriously, it will hamper the fulfillment of national rice product. The damaged networks reached 22.4 percent of the total networks, of which 73.4 percent were located in Sumatera and Java islands which are the national rice barns.
4. Rural Infrastructure Development and Poverty Reduction
The exact relationship between the use of services and prices or family income varies, but for poor people, lower incomes and higher prices are associated with less use. Poor people spend a lot of their money on services: 75 percent of all health spending in low-income countries is private, 50 percent in middle-incomecountries. Based on government sources, these broad aggregates are probably underestimates, hiding the heavier burden on poor people.
In many of the poorest countries, access to schools, health clinics, clean water, sanitation facilities, rural transport, and other services is limited. Indonesia expanded access to primary education in the mid -1970s by using its oil windfall to build new schools and hire more teachers. Pri mary enrollment doubled between 1973 and 1986, reaching 90 percent – though the story on quality is less positive.
There is a broad concensus that growth is essential to sustained poverty reduction, although it may not be a sufficient condition. At the same time, recognizing that recent discussion on pro-poor growth tend to be narrowly focused on direct poverty-targeting measures. There has been increased awareness of the need to analyze how to generate a dynamic growth process, while ensuring social equity (inclusive growth) in the country -specific context. To achieve a sustainable growth and poverty reduction, interaction among following three channels are critically important: (1) direct channel, which impacts the poor directly (such as programs for basic health, sanitation,
8
education, and rural roads); (2) market channel (or trickle down), where growth helps the poor via economic linkages (such as inter-sectoral and inter-regionallabor migration, increasing demand, reinvestment through formal, informal, and internal finance) ; and (3) policy channel, which supplements market channel (such as subsidies, fiscal transfer, public investment, and proper design of trade, investment, and financial policies).
Infrastructure can play a vital role through each of these channels. For instance, basic rural infrastructure can address poverty problems through channel (1). Large-scale infrastructure can contribute to growth and poverty reduction through channel (3), but also serve as a pre-condition for realizing channel (2) and affect the patterns and quality of growth.
It is widely acknowledged that investment in infrastructure services can contribute to sustainable growth by: (1) reducing transaction costs and facilitating trade flows within and across borders; (2) enabling economic actors –individuals, firms, and governments – to respond to new types of demand; (3) lowering the costs of inputs used in the production of almost all goods and services; (4) opening up new opportunities for entrepreneurs, or making existingbusiness more profitable; (5) creating employment, including works (both as social protection and as a counter-cyclical policy in times of recession); (6) enhancing human capital, for example, by improving access to schools and health centers; and (7) improving environmental conditions, which link to improved livelihoods, better health and reduced vulnerability of the poor.
Poor people – as patients in clinics, students in schools, travelers on buses, consumers of water – are the clients of services. They have a relationship with the frontline providers, with schoolteachers, doctors, bus drivers, water companies. Poor people have a similar relationship when they buy something in market. In a competitive-market transaction, they get the service becau se they can hold the provider accountable. That is, the consumer pays the provider directly; he can observe whether or not he has received the goods and services; and if he is dissatisfied, he has power over the provider with repeat business with legal or social sanctions.
For the services considered here – such as health, education, water, electricity, and sanitation – there is no direct accountability of the provider to the consumer. Why not? For various good reasons, society has decided that the service will be provided not through a market transaction but through the government taking responsibility. That is, through the “long route” of accountability – by clients as citizens influencing policymakers, and policymakers influencing providers. When the relationships along this long route break down, service delivery fails (absentee teachers, leaking water pipes) and humandevelopment outcomes are poor.
9
5. Policy on Infrastructure
Poor people are citizens. In principle, they contributes to defining society’scollective objectives, and they try to control public action to achieve those objectives. In practice, this does not always work. Either they are excluded from the formulation of collective objectives or they cannot influence public public action because of weaknesses in the electoral system. Free public services and “no-show” jobs are handed out as political patronage, with poor people rarely the beneficiaries.
Even if poor people can reach the policymaker, services will not improve unless the policymaker can ensure that the service provider will deliver services to them. Given the weaknesses in the long route of accountability, service outcomes can be improved by strengthening the short route – by increasing the client’s power over providers.
Budgets should be pro -poor and pro -growth. Government spending should be oriented toward poverty-reducing activities and outlays that foster the development of human and physical capital. In order to monitor this shift in the composition of public spending, it will be necessary to improve publicexpenditure management systems. Efforts should be made to improve the efficiency and targeting of spending, and tax reforms should aim at improving both efficiency and equity.
Fiscal targets should be flexible and allow in creases in public expenditure to accommodate the government’s poverty reduction strategy within a stable macroeconomic framework. Programs could also be presented in ways that could signal financing needs. Thus, normative macro-projections in PRSP could be presented as possible alternatives.
Projected increases in education and health care spending vary across countries. In the transition economies, for example, smaller-than -average increases are envisaged. This reflects the slightly higher levels of initial spending and the substantial scope for further rationalizing education and health care systems inherited from the pra -transition era.
Substantial increases in spending identified as poverty-reducing in PRSP is also envisaged. PRSP has defined a range of programs as poverty -reducing, including spending on primary education, primary or basic health, roads, rural development, agriculture, judicial systems, and anticorruption measures.
Over time, as PRSP is updated and revised in light of the impact of policies on social outcomes, the definition of poverty-reducing activities is expected to be refined. For most countries, existing budget classification systems do not allow for a precise matching of expenditure allocation and the programs identified as
10
poverty-reducing in the PRSP. The ultimate objective of reorienting public spending in favor of poverty-reducing programs is to achieve better social outcomes. Data on indicators that gauge social progress, however, are available only with a substantial lag, and they may not be available for every year – making it difficult to isolate the effect of recent changes in policies.
Higher government spending on education and health, and the shift in the composition of public spending from current to capital outlays, will help facilitate poverty reduction and higher economic growth. In developing countries, public expenditure is a powerful tool for shaping equity or reducing poverty. In particular, well-targeted and efficient public programs in education and health are essential to ensure that the poor have the skills needed to contribute to – and benefit from – economic development.
Higher spending on poverty-reducing activities must be accompanied by improvements in efficiency and targeting to significantly improve socialoutcomes. Programs are seeking sizeable increases in poverty-reducing spending. But this is not sufficient for reducing poverty, because the efficiency and targeting of these outlays must also be improved. The agenda of reform in this area is large, given that the poor reap a disproportionately small share of the benefits from education and health outlays in low income countries, and a majority of studies show a weak relationship between government social spending and social outcomes. The limited sco pe for reallocating a large portion of public spending to poverty-reducing activities in the short run further underscores the need to realize improvements in this area.
Enhancing the efficiency and equity of spending in key sectors, such as education and health care, is a critical component of country’s poverty -reductionstrategies. Two complementary but distinct aspects of efficiency has been addressed in poverty-reducing programs. Firstly, the productive efficiency of spending can be improved by using a more productive mix of spending inputs –for example, shifting spending to critically needed nonwage inputs in health and education, such as medicines and textbooks; or making efficiency improvements that allow the government to provide the same level of public services with lower spending – for example, by reducing waste. Secondly, The allocative efficiency of spending can be strengthened by reallocating public spending within sectors to programs that are most useful for meeting the government’s policy goals. For example, a reallocation of spending from tertiary to primary education and to rural areas can potentially enhance the efficiency of spending if the principal goal of education policy is to increase primary enrollment and completion rates.
Policy measures are also envisaged to better target spending toward the poor. In transition economies, a common aim is to make social assistance a more effective instrument of poverty alleviation by targeting this spending to the poor.
11
In a similar vein, some countries plan to replace subsidies that are enjoyed by all consumers – poor and nonpoor alike – with those that benefit only low-incomegroups. In other countries, the objective is to increase equity by improving the access of the poor to health care and education, facilitated by the elimination of primary school fees.
Figure 2. A simplified framework of pro-poor government intervention
Step 1Determine for rationale for public Analytical tools include:intervention: - Poverty diagnostics1. Market failures, including public - Distribution of access and
goods, externalities, non-competitive spending by: level of access,markets region/rural-urban, and
2. Address inequalities in access to population groupservices and distribution of income - Evaluation of selected programs
Step 2 Potential instruments include:Decide among alternative instruments to - Regulatory measuresoffset market failures and/or improve - Revenue measuresdistributive outcomes - Distinguish between public finance and provision
Step 3 Methods to rank acro ssDecide on the type of program if programs include:state-run is chosen, and set priorities - Cost-effectiveness analysisconsistent with aggregate budget - Multi-criteria analysisconstraints - Social cost-benefit
Infrastructure serves as catalyst to development, improves access to resources, and enhances the impact intervention. The infrastructure development can hasten the poverty reduction process. Specifically, the question about the role of infrastructure can be broadened to include, firstly, the reduction of exclusion. The provisionof infrastructure helps the poor to have better location, enable the poor to afford better facilities, and increase their participation in socio-politicalissues. Secondly, infrastructure can increase of social capital. Poverty may be due
12
to the attitude and mentalities. Infrastructure creates link between isolated communities and the rest of the world that can increase the productivity of the poor. Thirdly, infrastructure can reduce vulnerability in the sense that it helps to cope with natural disasters, economic shocks, and inequality of access to infrastructure. Finally, the provision of infrastructure by the government may serve as a substitute to the private and complement. It can be argue thatcompetition in providing infrastructure can increase efficiency. Therefore, the market should be ease to entry by regulation and transaction process. In sum, the question for infrastructure provision is whether it can increase the ability of the poor to access the infrastructure it self to enable them reducing cost of their living. However, the provision of infrastructure is depended upon the available budget. Under the limited government funds, priority allocation is usually away from the infrastructure. This is because the impact of infrastructure on the economic growth is not direct. Even though it may argue on the role of infrastructure on the economy, it may put aside to more direct activities when budget is under presure. Therefore, priority is a must.
Infrastructure has been defined in terms of the physical facilities and services flowing from those facilities. Therefore the impact of the infrastructure investment on the poverty reduction can be traced from how the availability of infrastructure can help the poor to get the opportunity in directly or indirectly raising their income. Figure 3 exhibits the link between infrastructure investment (areas of influence) and poverty reduction (areas concern). Differences in the dimension of the urban and rural poverty require different infrastructure provision. Urban poverty characterized by modern sector while rural poverty characterized by agricultural sector areas of influence. How infrastructures provision can encourage job opportunity, empower community, enhance capacity building (human resources) and create social protection in urban and rural areas is the key to poverty reduction.
The below figure is useful in helping to identify the possible path of the impact of investment in infrastructure and poverty reduction. However, it still have to explore the type of infrastructure needed in certain region. The need assessment analysis thus is required. In relation to the development planning process, the bottom up planning approach fulfills such analysis. As opposed to the top down approach that places the central government as the center by assuming that they know everything the local governments need and want. The bottom up process requires collecting the public interest in infrastructure. If the governmentinvestment on infrastructure is based on public needed, then the outcome and impact of infrastructure development could increase.
The priority and needs of every region is different. Some regions may consider building road is important, while the other may choose irrigation facility. In the remote (and poor) regions, building road will provides incentive for teacher and doctors, while fresh air may be more important in the city sanitary and park. The
13
social planner should inquire the need of each region to increase the effectiveness of the infrastructure development.
Figure 3. Link between infrastructure and poverty reduction
Areas of intervention:Increase access to electricity, roads,
Areas of influence:Promoting job opportunity, empowering
Urban areas: Rural areas: community, capacity building (humanModern sector Traditional sector resources), social protection, increase market
efficiency, healthiness
Direct impact: Indirect impact: Impact (transmission):Employment and Economic growth Economics of scale, learning curve,wages of the poor externalities
Poverty reduction: Real income greater than poverty line
The policy on infrastructure development which has been implemented so far in Indonesia is focused more on physical sides and the policy is sometimes toogeneral and less focused. This shows that there are poor relations between the procurement of infrastructure devoted to disadvantaged people in the attempts of reducing poverty. Some of policies that have been outlined by government concerning the strategy for poverty reduction in connection with the procurement of infrastructure are, among others, stated in the macro operational policies in economy, namely policies of infrastructure development which support social and economic activities of disadvantaged people. In the National Development Program, the improvement for basic capabilities of disadvantaged families and communities is made through widening of access to various services in education, health, job opportunities, capitalization, infrastructure, and other services. The bottom up planning that targeted to reduce poverty is in line with figure 4. Here, the types (dimensions) of poverty play a central role in determining infrastructure needed. The target (poverty reduction) can be achieved through direct and indirect routes. It is expected that the infrastructure
14
can help reducing the poverty by reducing the cost of living, increasing income, and stabilizing the income (expenditure) of the poor.
Figure 4. Simple analytical framework to determine the types of infrastructure neededto support poverty reduction programs
Dimension Transmission Function Policies Types ofof poverty infrastructure
- Low income- Limited productive resources- Hunger and Urban areas: malnutrition - School- Low level of - Health center healthiness - Garbage disposal- Limited access Reduce living cost - Parkto education and of the poor - Sanitation
other basic - Piped water needs Increase income - High rate of Direct (expenditure) of Investment Rural areas: mortal ity due Indirect the poor in - Road to diseases infrastructure - Irrigation- Homeless and Stabilize income - Rural market poor quality of (expenditure) of - School living the poor - Health center- High criminal - Electricity level - Potable water- Discrimination and socially exclusion- Low participation
6. The Role of IRAP Approach
Under decentralization (since 2000), almost all important decisions are made at local (district) level. Recently, there are 33 provinces and 418 districts in Indonesia. District governments are more responsible for public facilities and services. The logic way of thinking behind the implementation of decentralization is that local governments are close to the community. The big challenge is how to make this delegated responsibility will effectively overcome development problems at local level.
Although the regular bottom up development planning has been implemented since the mid of 1980s, nevertheless, the fact shows that infrastructure development have not sifnificantly contributes to overcome access problems of rural community, especially in eastern part of Indonesia. The main importantfactor is not about the amount of investment provided, but more about the
15
process to identify the priority activities to overcome actual access problems. Many of infrastructure development proposed in bottom up planning documents were not the real a ctual needs of the community, especially those who lives below poverty line in remote areas. Actually, the planning mechanism it self is quite ideal. It starts from village (Desa) level, up to sub-district(Kecamatan), district (Kabupaten and Kota), province, and national level. The primary problem is about instrument that used to formulate the priority activities, mainly at village, sub-district, and distric level where financial decision is made. The rational background was not sufficiently considered in the priorityidentification process. Activities proposed was tend to be more subjective and the representativeness of stakeholders is the only main item to be considered. In short, there are three main issues of rural infrastructure development planning inIndonesia, i.e. mechanism, participation, and instrument. IRAP approach is naturally related to these three issues.
In relation to poverty reduction efforts, the implementation of IRAP approach in given region can contributes in the following aspects:
(1) IRAP approach can helps local governments in better allocation of financial resources. Better targeting of infrastructure development will have a greater possibility to solve the main problem of development, i.e. poverty, through access improvement to basic, social, and economic services, and productivity and income improvement of the poor.
(2) The implementation of IRAP approach will encourage community empowerment by providing opportunity for poor groups or it representatives to contributes actively in decision making process at local level, including the identification of priorities of rural infrastructure development.
(3) IRAP activities are basically supports the capacity building at local level. This means that the capability of stakeholders that involves in bottom up rural infrastructure development planning will be strengthened, and pro poor planning and budgeting will be sustained.
(4) Finally, suitable planning and budgeting in rural infrastructure development will have greater possibility to protect vulnerable poor groups. Improvement of access will provide better accessibility for poor people to have basic, social, and economic goods and services. Poor people will have better opportunity to increase their capability, involve in labour market, more productive, and increase their income and welfare. As mentioned by Todaro and Smith (2003), the main target of development is the capability of people.
1
IRAP Approach and Pro-Poor Rural Infrastructure Planning: The Case of Indonesia
oProgress of IRAP Implementation in IndonesiaoDevelopment of Methodology and Instruments
oMainstreaming Efforts (Rural Infrastructure Development Policies and Poverty Reduction Strategy)
2
IRAP Implementation Areas in Indonesia
West Java Province1998 - 1999
East Nusa Tenggara Province2003 - 2004
East Kalimantan Province2001 – 2002, 2003 – 2004
West Nusa Tenggara Province1997 - 1998
Yogyakarta Province2001 – 2002, 2003 – 2004
Mollucas Province2003 - 2004
Population of Kutai Kartanegara District, East Kalimantan Province
2.443.3341.164.5321.278.802211.440,0Total
99.61745.97653.641406,7Bontang12.
116.99554.73962.256507,1Tarakan11.
521.619255.424266.195783,0Samarinda10.
409.023197.301211.722749,0Balikpapan9.
City
79.62037.06442.55614.585,7Nunukan8.
83.03739.21443.82318.010,5Bulongan7.
36.62317.45019.18242.620,7Malinau6.
117.76953.40064.36924.201,0Berau5.
146.51067.72378.78735.747,5Kutai Timur4.
427.791204.208223.58327.263,1Kutai Kartanegara3.
135.96063.97271.98831.627,7Kutai Barat2.
268.761128.061140.70014.937,0Pasir1.
TotalFemaleMale
PopulationArea(sq2)
DistrictNo.
3
Population of Bantul District,Daerah Istimewa Yogyakarta Province
3.120.4781.573.6171.546.8613.185,8Total
396.711202.605194.10632,5Yogyakarta5.
City
370.944188.272182.672586,3Kulon Progo4.
670.433343.559326.8741.485,4Gunung Kidul3.
901.377446.694454.683574,8Sleman2.
781.013392.487388.526506,9Bantul1.
TotalFemaleMale
PopulationArea(sq2)
DistrictNo.
East Nusa Tenggara Province (9 Districts)
3.805.4771.915.2541.893.22347.343,90Total
237.271112.595124.676160,34Kupang14.
City
603.206301.9403012667.136,40Manggarai13.
223.503115.250108.2233.037,88Ngada12.
232.270122.732109.5382.046,62Ende11.
263.284139.442123.8421.731,92Sikka10.
197.241104.38192.8601.806,85Flores Timur9.
89.69749.63140.0661.266,38Lembata8.
164.04283.85980.1832.864,60Alor7.
277.484137.507139.9772.445,57Belu6.
193.71396.90296.8112.669,66Timor Tengah Utara5.
389.078194.440194.6383.947,00Timor Tengah Selatan4.
399.438194.749204.6897.178,26Kupang3.
184.47589.14095.3357.000,50Sumba Timur2.
353.775172.656181.1194.051,92Sumba Barat1.
TotalFemaleMale
PopulationArea(sq2)
DistrictNo.
4
Overview IRAP Methodology in Indonesia
o Training 1: Accessibility Data Collection and Mapping1. Questionaire2. Mapping
o Training 2: Accessibility Score Calculation and Prioritization1. Form 1: Indicator Value2. Form 2: Indicator Weight3. Form 3: Accessibility Value
o Training 3: Formulation of Project Proposalo Examples of Prioritization Outputs
1. Sectors2. Sub-Villages (Dusun)
Development of Instruments
o Questionnaire: data and information on infrastructure condition, especiallyfor non-transportation facilities, such as school, health care, and market (these information are needed to formulate the maintenance activities)
o Maps: different size of accessibility maps has been produced at local levelo Indicator Weight: different perspective of local planner on indicator weight
determinationo Formulation of Proposal: (1) simplification of proposal arrangement steps; (2)
there are two types of proposals arrangement (for government and non-government budgets)
5
Mainstreaming Efforts
Office of Coordinating Ministry of Economic Affairso Local Level Planning (IRAP Approach)o Maintenanceo Small-Scale Contractingo Local Economic Development
Office of Coordinating Ministry of People’s Welfareo Formulation of Poverty Reduction Strategy Paper (PRSP)
The Poverty Challenge
20,6
71,1
14,8
61,6
7,8
50,5
12
65,1
7,2
53,5
7,4
53,4
10,3
35,6
01020304050607080
Percent
1990 1993 1996 1999 2002 2003 2015
Year
Figure 1. Percentage of poor people in Indonesia under criterion of $ 1 and $ 2 per day
$ 1 per day$ 2 per day
6
Table 1. Number of poor people in Indonesia divide by urban and rural areas
Two main approaches of poverty reduction strategy:1. Increasing income of poor people through productivity
improvement2. Lessening the expenditure of poor people to have access to
basic, social, and economic services
Four pillars of poverty reduction strategy:1. Promoting/broadening opportunity2. Community empowerment3. Capacity building and human resource development4. Social protection
7
Overview of the Infrastructure Condition
o ElectricityRatio of electrification was still low, that is around 58 percent in 2001
o Road condition for transportationIn the year of 2000, as long as 140,000 km road (or 48 percent of 291.5 thousand km) was slighty and heavily damaged and as long as 8,798 km of national and provincial roads were in poor condition
o CommunicationUp to now, there are only around 8.8 million telephone connection or around 3 connections per 100 people all over Indonesia, around 86 percent was located in western part of Indonesia
o IrrigationTo support agriculture development, around 1.5 million ha out of 6.7 million ha irrigation networks in slighty and heavily damaged conditions, the government could only provide between 40 and 50 percent of operational and maintenance costs, besides, between 15 and 20 thousand ha per year of irrigated agricultural field were converted for non agricultural purposes
Rural Infrastructure Development and Poverty Reduction
Three channels to achieve a sustainable growth and poverty reduction:1. Direct channel, which impacts the poor directly (such as programs
for basic health, sanitation, education, and rural roads)2. Market channel (or trickle down), where growth helps the poor via
economic linkages (such as inter-sectoral and inter-regional labour migration, increasing demand, reinvestment through formal, informal, and internal finance)
3. Policy channel, which supplements market channel (such as subsidies, fiscal transfer, public investment, and proper design oftrade, investment, and financial policies).
8
The Role of IRAP Approach
In relation to poverty reduction efforts, the implementation of IRAPapproach in given area can contributes in the following aspects:1. IRAP approach can helps local governments in better allocationof
financial resources 2. The implementation of IRAP approach will encourage community
empowerment by providing opportunity for poor groups or itrepresentativeness to contributes actively in decision making processat local level, including the identification of priorities of ruralinfrastructure development
3. IRAP activities are basically supports the capacity building at locallevel
4. Suitable planning and budgeting in rural infrastructure developmentwill have greater possibility to protect vulnerable poor groups.
Pro-Poor Government Intervention
Step 1Determine for rationale for public Analytical tools include:intervention: - Poverty diagnostics1. Market failures, including public - Distribution of access and
goods, externalities, non-competitive spending by: level of access,markets region/rural-urban, and
2. Address inequalities in access to population groupservices and distribution of income - Evaluation of selected programs
Step 2 Potential instruments include:Decide among alternative instruments to - Regulatory measuresoffset market failures and/or improve - Revenue measuresdistributive outcomes - Distinguish between public
finance and provision
Step 3 Methods to rank acrossDecide on the type of program if programs include:state-run is chosen, and set priorities - Cost-effectiveness analysisconsistent with aggregate budget - Multi-criteria analysisconstraints - Social cost -benefit
9
Infrastructure Investment and Poverty Reduction
Areasof intervention:Increase access to electricity, roads,
Areas of influence:Promoting job opportunity, empowering
Urban areas: Rural areas: community, capacity building (humanModern sector Traditional sector resources), social protection, increase market
efficiency, healthiness
Direct impact: Indirect impact: Impact (transmission):Employment and Economic growth Economics of scale, learning curve,wages of the poor externalities
Poverty reduction:Real income greater than poverty line
Types of Infrastructure Needed to Support Poverty Reduction
Dimension Transmission Function Policies Types ofof poverty infrastructure
- Low income- Limitedproductiveresources
- Hungerand Urban areas:malnutrition - School
- Low levelof - Health centerhealthiness - Garbage disposal
- Limited access Reduce living cost - Parkto educationand of the poor - Sanitationother basic - Piped waterneeds Increase income
- High rateof Direct (expenditure) of Investment Rural areas:mortality due Indirect the poor in - Roadto diseases infrastructure - Irrigation
- Homeless and Stabilize income - Rural marketpoor qualityof (expenditure) of - Schoolliving the poor - Health center
- High criminal - Electricitylevel - Potable water
- Discriminationand sociallyexclusion
- Lowparticipation
ANNEX
Philippines
Martha D. Espano, March 2004, Page 1 of 10
IRAP Philippine Experience: Lessons on Institutionalization- a paper presented at the 4th IRAP Regional Workshop
29-31 March 2004, Siem Reap, Cambodia
1.0 Introduction
This paper presents a discussion of issues and lessons learnt in institutionalizing IRAP in the Philippines.
IRAP is a planning tool designed for use at local level. It covers several sectors and helps identify interventions to improve the rural households’ access situation through the provision of rural infrastructures, better distribution/siting of services or enhancing the people’s mobility for them to reach and utilize the basic goods and service facilities.
The IRAP procedure is a simple and relatively inexpensive tool which allows “LGUs to effectively utilize the limited resources that are available to them for the maximum benefit of the local population”1. This statement is best illustrated by the results of the post-evaluation of the technical assistance conducted in 1997 in about 50% of the provinces that applied the procedure. The following werevalidated by the said evaluation:
1. IRAP process is a simple, inexpensive and easy to apply local levelplanning tool;
2. IRAP is useful and relevant to the target end-users, the local government units (LGUs);
3. Local planners are the appropriate recipients of the training program;4. The accessibility information generated by the application has proven to
be of value to the LGUs as well as to national agencies involved in rural development;
5. Academic and training institutions can adequately address future training requirements on IRAP; and
6. Both financial and technical support are crucial
The results articulate the need to develop a sustainable framework that willaddress expressed demands for the use of the IRAP process and ensure that the policy environment provides not only the resources but also ensure that theneeded institutional mechanisms are in place.
Martha D. Espano, March 2004, Page 2 of 10
2.0 Application in the Philippines
The application in the country started in 1989 through “a set of action research studies on rural household travel patterns”1. The initial activity was under theDepartment of Agriculture, with funding from the European Union. The teamcovered three provinces and worked with the planning offices of the saidprovinces.
The positive results of the initial application led to the pilot activity, implemented in 1990-92 in selected provinces, with the Department of the Interior and Local Government (DILG) and support from the USAID. A Rural Transport Unit (RTU) was created at the Bureau of Local Government Development (BLGD) to work with the ILO Technical Team.
The initial pilot project was extended to cover an additional four provinces in1992-94 with financial support from the Dutch. The ILO Technical Team andcounterpart staff from government remained at the BLGD. Phase 1 aimed “to ensure that IRAP is adopted as a planning tool, establish training capacity on the procedure and initiate a plan to develop sustainable competence to apply IRAP as a standard planning instrument.”2
The Dutch approved a second extension (1995-99) to continue the gains of the previous activities, expand the project’s coverage area, ensure that localgovernment unitd (LGUs) implement access projects identified through the IRAP method, install training capacity in academic and training institutions, and develop an accessibility database. At this stage, the IRAP unit moved to the LocalGovernment Academy (LGA), the training arm of the DILG. This was upon the recommendation of the tripartite evaluation team, citing that the technicalassistance delivery of the project was mainly through capacity-building and that “the LGA has a broad mandate to carry out or arrange all training and technical assistance for LGUs which it frequently performs as a hands -on, in-fieldapproach”3. The transfer included the staff and budget for operations.
The final phase (2000-2002), still under Dutch funding, aimed “to institutionalize the use of IRAP in all local government units (LGUs), improve the procedure, and establish an operational accessibility database”2. This project phase wasexpected to solidify the gains of the previous phases and formulate a sustainable framework for continuous use of the methodology, with adequate information generated to guide community and private investments. The host unit in the LGA was relocated to the Office of Project Development Service (OPDS) of the DILG.The transfer however, did not include the trained staff at LGA as well as thenational counterpart budget. The host unit in OPDS did not last long enough torecruit the counterpart staff that was to be paid by the ILO and work with the technical assistance team. Sometime in 2001, the host unit was transferred to BLGD again, going back to where it started in Phase 1. From there, the recruitment of the government counterpart staff was completed. When theproject ended in December 2002, a new set of recruits from the permanent staff of the BLGD comprised the IRAP unit under the original project managementofficer.
Martha D. Espano, March 2004, Page 3 of 10
Throughout the three project phases, the counterpart agency was theDepartment of the Interior and Local Government, the government agencymandated to work with LGUs. The application of IRAP in the country took almost twelve years, long enough to have built technical and institutional capacities atvarious levels.
In 2000, the Department of Agriculture (DA), another national agency executing a foreign-assisted loan project from the Asian Development Bank (ADB),expressed interest on the use of the IRAP procedure and accessibilityinformation. Today, the ILO is working directly with the DA providing a technical team composed of one (1) full time staff and three (3) technical experts from Bangkok. The team provides technical backstopping, conducts periodic missions and stays at the DA project off ice.
3.0 Current status
After IRAP Phase III ended in December 2002, DILG assumed responsibility for the continuous application of the procedure. The tasks, as provided for in the Memorandum of Agreement between the ILO and DILG in 2000, includeadvocacy, promotions and operations and maintenance of the developedaccessibility database.
The Department of Agriculture, another national government agency that earlier showed interest on the results of the IRAP application, identified the procedure as a technology of choice during the preparation stage of the Infrastructure for Rural Productivity Enhancement Sector (InfRES) Project. The role of IRAP is to assist LGUs identify sub-projects, such as potable water supply, irrigation and rural roads, to be submitted for funding in the ADB-DA initiative.
At the Department of Interior and Local Government (DILG)
An IRAP Unit, housed at the Bureau of Local Government Development (BLGD) and assigned with four permanent staff, was formed last November 2002. Theunit operates under the supervision of the BLGD Director and tasked to oversee the implementation of the follow-through plan of action and commitments of the LGUs. Technical and logistical support, like office equipment, vehicle, hardware and software for the IRAP databank, training manuals, reference materials,guidebooks, etc., were turned over by ILO to the agency in December 2002. The national accessibility databank, containing the information collected at the LGU level during phase 3, is to be updated every three years. The said databank is managed and maintained by the unit with technical support provided by the Electronic Data Processing Service (EDPS), another unit in the DILG. The EDPS operates and maintains the IRAP website, hosted by the DILG site atwww.dilg.gov.ph
Martha D. Espano, March 2004, Page 4 of 10
At the Department of Agriculture (DA)
ILO and ADB signed a memorandum of agreement in 2001 for technicalcooperation on the implementation of the Infrastructure for Rural Productivity Enhancement Sector (InfRES) Project, financed by a loan from the ADB and implemented by DA. The ILO and DA signed a three-year contract in 2003tasking the ILO to provide technical assistance on local resource-based rural infrastructure development and implementation. The collaboration aims toenhance capacity of LGUs to plan, implement, operate and maintain ruralinfrastructures projects. InfRES aims to improve productivity of farm smallholders and fisherfolk through infrastructure investments in areas with high povertyincidence and high agricultural potential. This is expected to increase ruralincome, improve food security, lead to economic growth and reduce poverty. IRAP will be used to guide the LGUs in planning and prioritizing community access interventions through participatory needs assessment, identification ofinvestment priorities and infrastructure construction. IRAP is the preferredmethodology in identifying sub-projects of InfRES as the project dictates that to qualify for the assistance, the applicant LGU must have undergone training on IRAP. Otherwise, the LGU must first undergo the training program of the ILO.
During the implementation of the agreement, it was established that adjustments have to be done on the IRAP procedure, particularly on the roads prioritization process where alignment with the objectives of the InfRES project is called for.
In addition to the IRAP tool, the ILO is promoting its Labor-Based Equipment-Supported (LBES) method in construction and rehabilitation of roads identified in this DA-ADB project. Of the nine priority LGUs included in the first batch of sub-projects to be implemented, five expressed interest to use LBES.
4.0 Issues
After almost thirteen years of continuous application, IRAP managed to withstand four government administrations. It started during the Aquino administration, at a time when the Local Government Code of 1991 was enacted into law giving local government units greater autonomy to decide and manage their own affairs and resources. IRAP, being a local level planning tool, fits well into this new setup,being a simple and inexpensive tool well suited in the new developmentframework where “LGUs are obliged to effectively utilize the limited resources available for the maximum benefit of the local population”1.
In spite of the newfound flexibility provided under a new policy environment, the expected demand for the continuous application of the tool was not realized as institutionalization both at the local and national levels was not fully attained,missing opportunities for mainstreaming, institutionalization and sustainedapplication.
Martha D. Espano, March 2004, Page 5 of 10
4.1 Mainstreaming
Mainstreaming is concerned with using the tool in the actual planning functions of LGUs and considered by national agencies such as health, education, public works, agriculture, etc., in their “inter and intra-sectoral priority investments”1. The LGUs are the primary users of the tool, with the aggregated accessibility data proving valuable for national agencies in validating sectoral proposals fromprovincial and regional development initiatives.
“Mainstreaming the procedure only started one year (2001) ago and it is too early to see concrete results already4”. This is one of the findings of the tripartite evaluation team that conducted an assessment of IRAP’s final phase. However, two years after the nationwide application in the country, mainstreaming is yet to be seen. To date, no monitoring has been done nor any study conducted toascertain whether LGUs and/or national agencies are indeed using the tool in implementing their respective mandates. Except for the DA InfRES project, no other development initiative can be attributed with the use of the IRAP procedure.
To better understand the situation, it is best to be familiar with the following:
• Nature of local level planning in the country
Planning at municipal, provincial and regional levels is done by a technicalworking group (TWG) composed of representatives from the local planning office, concerned agencies, organizations and institutions. Experience proves that these representatives bring with them their respective agency priorities and interests and most often with pre-conceived ideas as to how development should proceed. Against this backdrop, IRAP was applied by municipalitiesresulting in clearly identified investment opportunities not only for the LGU for also for national development agencies in the area. Unfortunately, the nature of the composition of the TWG lends token appreciation of said results and the LGU is le ft on its own to address the prioritized sectoral needs. In this context, mainstreaming of the procedure in planning activities of agencies and development organizations and institutions becomes difficult to attain.
• Lack of clear and expressed demand
Mainstreaming IRAP can be facilitated if there is a clear and expresseddemand from the target users. This demand can be either: inclusion in the planning guidelines as an additional planning tool option for LGUs; or, donor organizations expressing preference for IRAP application (like what happened with the DA-ADB project). For instance, SWOT and Problem Tree Analyses are widely used at local level because the planning guidelines prescribe them and a significant number of organizations providing technical assistance to LGUs use them. On the other hand, a donor such as the ADB, favored IRAP as a planning tool option and was subsequently included in the DA InfRES Project. It must be made clear that a few LGUs using the procedure do not constitute a clear demand.
Martha D. Espano, March 2004, Page 6 of 10
• Local government system
In the Philippines, local governments are elected into office for a 3-year term, with possibility of re-elections for a continuous 9 years. In most cases, a newly elected local chief executive immediately puts into action programs that are his original and in no way can be attributed to the previous administration. With such practice, continuity becomes irrelevant and promising activities initiated by the previous administration becomes history. Similarly, if a losing administrator utilized IRAP, it is expected that the incoming executive will prefer a totally different procedure. In such situation, mainstreaming never stands a chance.
• Low level of support from academic and training institutions
New methods and techniques are attractive to academic and traininginstitutions. In fact, they even encourage their graduate students to tryinnovative approaches and procedures. However, such support is alwaysshort-lived and co-terminus with the acceptance of the research output or a graduate thesis. We must understand that academic institutions in the country have limited resources and will venture only into new grounds if there is ample financial and technical support from someplace. State universities with which the IRAP project tried to develop a collaborative relationship somehowfaltered in the delivery after they were left on their own in Phase 2. Initial reactions were enthusiastic and very promising but waned after it was realized that resources from the project are likewise limited. An ideal situation would be when the teaching and training institutions take on IRAP to be part of their curriculum or offered as part of their technical assistance package to LGUs.
4.2 Institutionalization
Change of administration, change of priorities
Institutionalization can be described best if the following conditions arepresent: there is an office in a national government agency responsible for IRAP; there is a focal organization or persons in charge of overseeing the promotion of the procedure; and, there is an annual allocation reflected in the General Appropriations Act. Such conditions can only happen if policy and decision-makers at the highest level support such actions. The President,Vice President and Senators are elected for a 6-year term and they areresponsible for laying the development direction of the country. However,similar to actuations at local level, a newly elected national leadership will embark on programs that do not necessarily jibe with that of the previous leadership. Such practice results in “flavor of the month” programs putting to waste the gains of nationally supported endeavors of the past administration. IRAP went through 4 presidents but the good thing that happened was that it was never identified with any of them thus remained in place even under a new national leadership. The downside of this is that IRAP remained at the periphery of the executive circle and was not projected as strongly as theother programs of an incumbent president.
Martha D. Espano, March 2004, Page 7 of 10
4.3 Sustained Application
The widespread and continuous use of the IRAP procedure at local level, with the results of its application considered by the higher level local government unit, is the desired situation to describe sustainability. To realize this, it is imperative that the IRAP procedure be presented as a planning tool option in the prescribed set of planning guidelines used by local government units. This also requires that a critical mass of technical personnel familiar with the procedure be in place and distributed th roughout the country. To attain this, IRAP should “ride” on the government bureaucracy and be entrenched in the agency mandated to provide technical assistance to LGUs. Another way is for IRAP to be part of the curriculum or skills development programs of teachingand training institutions so that it can be made conveniently available as a training package for the target users.
• Focal agency
Is the IRAP procedure housed in the correct agency? This question comes to mind when we compare the stages of IRAP promotion and application. The project started with the DILG and was effectively promoted andapplied throughout the country. The ILO technical assistance team was present all throughout the application and a counterpart team from the government became the conduit of the technical assistance to LGUs.However, while the DILG was busy directing the application, the Housing and Land Use Regulatory Board (HLURB) is also busy directly involved on the preparation and updating of the municipal Comprehensive Land UsePlan (CLUP). HLURB is mandated to formulate, manage and implementlocal planning guidelines and standards and is tasked to oversee thatplanning activities of local government units adhere to the prescribedprocesses. Clearly, promoting IRAP was correct with the DILG, sustaining its application should be with the HLURB.
• Budget
Applying IRAP in a sustained fashion would require a regular budget. As it stands now, only government has the capacity to do this especially if it is going to be a new allocation in the General Appropriations Act. This route has been proven to be circuitous and uncertain. But, the application can be done using the existing structure if there is clear endorsement for its use. For instance, SWOT is prescribed in the HLURB planning guidelines and their regional technical assistance teams provide this to the LGUs. Within each HLURB regional office is the Land Use Planning and Zoning Assistance Unit that visits local government units to oversee the activity. IRAP therefore, must also be prescribed in the guidelines and be used continuously even without additional budget from government.
Martha D. Espano, March 2004, Page 8 of 10
• Continuing expressed demand for the method
The whole country experienced IRAP for more than a decade. Regional training teams were organized to provide the needed technical assistance to LGUs and the outputs were collected to constitute a national databank, designed to provide a convenient information source on accessibilityconditions. After Phase 3, when the ILO Technical Assistance team office clos ed shop, silence ensued both at central and LGU levels. Clearly, the LGUs are not expressing demand for a repeat of the application, nor is the DILG initiating moves to update the databank under its responsibility.Contrasted with the SWOT analysis in the HLURB guidelines, no demand for its use is needed anymore because it is already a prescribed method and the LGUs cannot do anything but comply.
5.0 Recommendations
The issues discussed in this paper point to elements that are needed toensure a successful and sustained IRAP application. The Philippineexperience indicates that some of the elements were already in place butmust have been overlooked or were not fully utilized by the project, thus leading to missed opportunities that could have resulted in institutionalization, mainstreaming and sustained application. A review of past implementation activities can reveal these observations. Based on this awareness, thefollowing could have helped if the environment within which IRAP wasimplemented was clearly read and understood.
• Set realistic targets
Some targets are based on assumptions that may later prove to be wrong. For instance, IRAP formed regional technical assistance teams andassumed that these can always be around for the LGUs. However, the members of the team come from various LGUs and offices and naturally place their mother units always on top of their order of priorities.Expectedly, after the funding stopped, the members returned to theirrespective offices practically disbanding the IRAP regional teams. It will take another round of official representations, with corresponding budgetallocations, before a regional team can be formed again.
In some instances, targets set are beyond the capacity of the project team that results fall short of expectations, effectively eroding credibility tocontinue relying upon the offered technical assistance. It also helps if the policy and bureaucratic environment are carefully studied in setting the project targets, coupled with a good understanding of the dynamics in local governance.
Martha D. Espano, March 2004, Page 9 of 10
• Maximize Collaborative work
Study other on-going development planning initiatives and explore/develop possibilities for collaboration. Such actions will lead to substantial savings in manpower and resources and help in spreading the technology to a wider range of potential users. There are cases when the promise ofcollaborative work is listed as a pre -condition for LGUs to avail of any technical or financial assistance from development projects. Formalagreements to forge mutually reinforcing partnerships will not only help in attaining the desired outputs but also enhance credibility and spread the risks of failure.
• Map out strategies to create demand
As stated earlier, the demand for the use of IRAP may not only beexpressed by the users themselves but also can be prescribed by policy as expressed in planning guidelines and standards. One strategy to create demand is to touch base with the national agency tasked with formulating and managing planning guidelines and standards and work for theinclusion of IRAP procedure as a planning tool option for LGUs. This may take a while and will require representations at national policy anddecision-making circles, but the results will significantly facilitate inaddressing the need for an expressed demand for IRAP.
• Establish or be part of a strong and relevant network
Being part of an effective and relevant network can open a lot of doors for the implementation of the procedure to prosper in the right direction. The network can be an ideal avenue for constructive feedback and criticisms as well as point to different opportunity directions. This is effectivelyillustrated in the proliferation networks among non-government andpeople’s organizations where access to information, technology andopportunities are always present.
Martha D. Espano, March 2004, Page 10 of 10
References
1 The IRAP Project: An Assessment of Sustainability and Institutionalization, Geoff Edmonds, April 1996.2 Second Experts Group’s Meeting, IRAP, 5-6 September 2000, Bangkok3 Aide Memoire, Evaluation of IRAP Phase 1, 17 June 19944 Final Report, Tripartite Evaluation, IRAP Phase III Project, June 2002
THE IRAP PHILIPPINE THE IRAP PHILIPPINE EXPERIENCE:EXPERIENCE:
Lessons on Institutionalization
IRAP APPLICATION IRAP APPLICATION IN THE PHILIPPINESIN THE PHILIPPINES
– Villagers– District authorities (CTPC Office, district authorities)– Provincial level
2. Distribution of requesting form to villages without road access
2.1.Screening of the requests
Screening criteria• The road link must run through an area inhabited
by people.• The road link should connect with an all weather
road.• The road link must not be closely parallel to or in
the area of influence of another all-weather road. • The road link could be maintained using labor
and materials (gravel and sand) from the villages served
• The road link should serve the people at large and not only a special interest group.
2.2. Weighting at district level
54.355555544.6Namteun - Tadnamheng
554.654.655545Na nguen – Phialeng
4.354555554.34Nampaongai-NaXiengdy
10987654321
Average weigh of each indicator
Project
2.3.Prioritization2.3.Prioritization and ranking
4The detail data were not examine, however, bases on the above list it fall into the fourth priority
3Mokkhouane-somphone
30.6156614176,05013Namteuane-Katanya(tadnamhen
g)
20.072442184.535,1006Naxiengdy-Nampaognai
10.061304165.814,6252.147Nanguen -Phialeng
RankingCost/Pop*Benefit
Popserved
EstimateBenefit
Cost estimate improvement for planning Purpose
(USD)
KmSub project
2.4.Participatory Meeting with villagers
2.5. Participatory Meeting with villagers
2.1 First consultation with Villagersa) Clarification of needs and Maintenance
b) Information on methodologies– State and villager cooperation (cost-sharing)– Labor Base methodology
– Survey of alignment and bill of quantity
2.6.Participatory Meeting with villagers
2.1.1Bill of Quantity
7%4,890,000Tools4
34%24,111,111Structure3
32%22,600,000Laterite2
27%
13,266,66757,139,44470,406,111
18,805,000Earth work(bush
clearing)1
Namteun-Bandou-Banguio 4,5km
4%3,465,766Tools4
26%23,055,426Structure3
7%5,961,807Laterite2
63%
19,574,82568,966,39588,541,220
56,058,221Earth work(bush
clearing)1
Phialeng-Naguen 2,147km
% sharing of each
activity
Cost-sharing/km
Total cost excludedvillagers
contribution/km
Total cost/kmCost per activityper km including
cost-sharingActivitiesNumber
2.7.Participatory Meeting with villagers
2.1 Second consultation with Villagersa) Willingness and ability to contribute
b) Environmental assessment
2.8.Participatory Meeting with villagersEnvironment assessment
Assessment criteria:1 The project involves construction of new road, or rehabilitation or maintenance which will significantly affect road verges within or outside the right of way
2. The project involves resumption of property.
3. The project involves a major change in the volume or traffic or type of use of the road.
4. The project involves opening of new quarries or significant areas of borrow pits
5. The project involves resettlement.
2.9.Participatory Rural Transport PlanningSigning agreement with both sides support
3. Construction
1.Labour Base• Beneficiaries implementing physical work
– Proportion of contribution– Proportion of payment
• State responsibility– Provision of paving material, structures,
hand tools,– Technical supervisor
• State responsibility(…)– Payment for the length that state responsibility.
3.Construction
3. Construction
Routine Maintenance• Forming of Village Maintenance Committee• Beneficiaries are responsible for routine
maintenance, in case over burden request for support with concerned authorities.
4.Routine Maintenance
Villagers real needs need to be found out, necessary supports need to be prepared to assist villagers meets their needs at certain time. “ never force villagers accept what they do not need as their real needs” this will lead to un-success development.
5.Conclusion
ANNEX
India
IRAPIRAPLocal Economic Development Local Economic Development –– OrissaOrissa
P.K. Pattanaik & S. PandaP.K. Pattanaik & S. Panda
No. of Gram Panchayats: 6234No. of Gram Panchayats: 6234
No. of villages: 46,980No. of villages: 46,980
Population: 36.7 millions (2001)Population: 36.7 millions (2001)
Pilot Area Pilot Area –– Khallikote Block (Ganjam District)Khallikote Block (Ganjam District)
No. of GPs: 26No. of GPs: 26
No. of Villages: 158No. of Villages: 158
No. of Households: 29678No. of Households: 29678
Population: 155294Population: 155294
IntroductionIntroduction
•• Needs of Rural PopulationNeeds of Rural Population•• Traditional IRAPTraditional IRAP•• IRAP in India ContextIRAP in India Context•• PRIs, Decentralized Planning & Rural PRIs, Decentralized Planning & Rural
InfrastructureInfrastructure•• Gram Panchayats Gram Panchayats •• Major Govt. of India Programmes for Rural Major Govt. of India Programmes for Rural
Infrastructure DevelopmentInfrastructure Development
Needs of Rural PopulationNeeds of Rural Population
Social welfare aspects of rural life Social welfare aspects of rural life
•• Primary Health Primary Health •• Primary EducationPrimary Education
Economic welfare aspects of rural life Economic welfare aspects of rural life
•• AgricultureAgriculture•• LivestockLivestock•• Other income generation activitiesOther income generation activities
Traditional IRAPTraditional IRAP(mainly access to basic needs)(mainly access to basic needs)
IRAP in India ContextIRAP in India Context
Indian Constitution on PRIsIndian Constitution on PRIs* Article 40 (* Article 40 (Directive Principle)Directive Principle)
“The State shall takes step to organize Village Panchayats & “The State shall takes step to organize Village Panchayats & endow with such powers and authority as may be necessary to endow with such powers and authority as may be necessary to
enable them to function as units of selfenable them to function as units of self--government”government”
* 73* 73rdrd Constitutional Amendment Constitutional Amendment Act, 1992 on Panchayati RajAct, 1992 on Panchayati Raj
has enabled State Governments to provide necessary powers has enabled State Governments to provide necessary powers and functions to the PRIs to: and functions to the PRIs to:
1. Function as institutions of local self1. Function as institutions of local self--governmentgovernment2. Plan and implement schemes for economic development 2. Plan and implement schemes for economic development and social justice including the 29 subjects listed in the 11and social justice including the 29 subjects listed in the 11thth
Schedule of the Constitution. Schedule of the Constitution.
List of 29 Subjects under the 11List of 29 Subjects under the 11thth ScheduleSchedule
•• Agriculture, including agricultural Agriculture, including agricultural extensionextension
•• Land improvement, implementation Land improvement, implementation of land reforms, land consolidation of land reforms, land consolidation and soil conservationand soil conservation
•• Minor irrigation, water management Minor irrigation, water management and watershed developmentand watershed development
•• Animal husbandry, dairying and Animal husbandry, dairying and poultrypoultry
•• FisheriesFisheries•• Social forestry and farm forestrySocial forestry and farm forestry
•• Minor forest produceMinor forest produce•• Small scale industries, including food Small scale industries, including food
processing industriesprocessing industries•• Khadi, village and cottage industriesKhadi, village and cottage industries•• Rural housingRural housing•• Drinking waterDrinking water•• Fuel and fodderFuel and fodder•• Roads, culverts, bridges, ferries,Roads, culverts, bridges, ferries,
waterways and other means ofwaterways and other means ofcommunicationcommunication
•• Rural electrification, includingRural electrification, includingdistribution of electricitydistribution of electricity
•• NonNon--conventional energy sourcesconventional energy sources
•• Education, including primary and Education, including primary and secondary schools secondary schools
•• Technical training and vocational Technical training and vocational educationeducation
•• Adult and nonAdult and non-- formal education formal education
•• LibrariesLibraries
•• Cultural activities Cultural activities
•• Markets and fairs Markets and fairs
•• Public distribution systemPublic distribution system
•• Health and sanitation, includingHealth and sanitation, includinghospitals, primary health centreshospitals, primary health centresand dispensariesand dispensaries
•• Family welfareFamily welfare
•• Women and child developmentWomen and child development
•• Social welfare, including welfare of Social welfare, including welfare of the handicapped and mentallythe handicapped and mentallyretardedretarded
•• Welfare of the weaker sections,Welfare of the weaker sections,and in particular, of the Scheduled and in particular, of the Scheduled Castes and the Scheduled TribesCastes and the Scheduled Tribes
•• Maintenance of community assetsMaintenance of community assets
New PRI SystemNew PRI System
!! District Level (Zilla Parishad)District Level (Zilla Parishad)
!! Village Level (Gram Panchayat)Village Level (Gram Panchayat)
Today Below State Level (India)Today Below State Level (India)
•• 532 District Panchayats532 District PanchayatsMore than 175 Districts haveMore than 175 Districts havewomen presidentswomen presidents
•• 5912Block/Mandal Panchayats 5912Block/Mandal Panchayats More than 1970 Blocks haveMore than 1970 Blocks havewomen headswomen heads
•• 2,31,630 Gram Panchayats 2,31,630 Gram Panchayats More than 77,210 GPs haveMore than 77,210 GPs havewomen headswomen heads
The third stratum elects 30,00,000 The third stratum elects 30,00,000 membersmembers
Of these Of these
10,00,000 are women10,00,000 are women
6,60,000 are SCs/STs6,60,000 are SCs/STs(unprivileged community(unprivileged community ))
The 73rd Constitutional Amendment Act, 1992, onThe 73rd Constitutional Amendment Act, 1992, onPanchayati Raj is a historic event in the evolution of India’s Panchayati Raj is a historic event in the evolution of India’s democracy. It will strengthen the roots of Indian federalism democracy. It will strengthen the roots of Indian federalism and also contribute to better planning and implementation of and also contribute to better planning and implementation of the programmes for economic development and socialthe programmes for economic development and socialjustice. The amendment has enabled State Governments to justice. The amendment has enabled State Governments to provide necessary powers and functions to the PRIs to: provide necessary powers and functions to the PRIs to:
•• Function as institutions of local self governmentFunction as institutions of local self government•• Plan and implement schemes for economicPlan and implement schemes for economicdevelopment and social justicedevelopment and social justice
The enactment of the new legislations on Panchayati Raj The enactment of the new legislations on Panchayati Raj in almost all States and Union Territories by April 24,in almost all States and Union Territories by April 24,1994 is a significant landmark in the history of local self 1994 is a significant landmark in the history of local self government. The PRIs have administrative as well asgovernment. The PRIs have administrative as well asfinancial powers. financial powers.
The Gram Panchayat is the lowest democratic unitThe Gram Panchayat is the lowest democratic unitmandated to plan and implement programmes at themandated to plan and implement programmes at thegrassgrass--root level. The planning machinery at this level is root level. The planning machinery at this level is weak in terms of technical expertise and other resources. weak in terms of technical expertise and other resources. It is therefore necessary to buildIt is therefore necessary to build--up and strengthen the up and strengthen the planning capabilities at the Gram Panchayat level. planning capabilities at the Gram Panchayat level.
IRAP seeks to strengthen the existing planningIRAP seeks to strengthen the existing planningpractices at Gram Panchayat level by introducing practices at Gram Panchayat level by introducing new techniques and procedures to improvenew techniques and procedures to improvespecific planning activities related to ruralspecific planning activities related to ruralaccessibility such as data collection techniques,accessibility such as data collection techniques,mapping procedures, techniques for prioritymapping procedures, techniques for prioritysetting etc. IRAP is designed for use at the Gram setting etc. IRAP is designed for use at the Gram Panchayat and Block level. Resources at this level Panchayat and Block level. Resources at this level are limited and consequently the planningare limited and consequently the planningtechniques to be introduced do not maketechniques to be introduced do not makeintensive demands on the financial resources.intensive demands on the financial resources.They are also inexpensive in use. They are also inexpensive in use.
Purpose of IRAP in IndiaPurpose of IRAP in India
To support theTo support thedecentralized planningdecentralized planningprocess in India in generalprocess in India in generaland capacity building ofand capacity building ofPRIs at local level (BlockPRIs at local level (Blockand Gram Panchayat) withand Gram Panchayat) withrespect to Ruralrespect to RuralInfrastructure DevelopmentInfrastructure Developmentand Improving Ruraland Improving RuralAccessibility through theAccessibility through thedevelopment and transfer of development and transfer of IRAP methodologyIRAP methodology
To demonstrate theTo demonstrate theprocedures, adopt genericprocedures, adopt genericIRAP processes to IndianIRAP processes to Indianconditions and promoteconditions and promotethe adapt state IRAPthe adapt state IRAPprocess in other Districtsprocess in other Districtsand Blocks in the Statesand Blocks in the States
PRI SystemPRI System
PRI Fund FlowPRI Fund Flow
Gram Panchayat Gram Panchayat –– Lowest level Lowest level Local Self Government UnitLocal Self Government Unit
""PopulationPopulation -- 2000 to 100002000 to 10000
""No. of villages No. of villages –– 1 or more 1 or more
""No. of Wards No. of Wards –– 12 to 2512 to 25
Gram Panchayat Planning ProcessGram Panchayat Planning Process
Major Government of India programmes and Major Government of India programmes and
schemes for rural infrastructure departmentschemes for rural infrastructure department
1.1. Elementary EducationElementary Education
•• Indian Parliament passed the Constitution 86thIndian Parliament passed the Constitution 86thAmendment Act 2002 to make elementaryAmendment Act 2002 to make elementaryeducation a fundamental right for children in the education a fundamental right for children in the age group 6age group 6--14 years. 14 years. The programme seeks to open new schemes inThe programme seeks to open new schemes inhabitation which do not have the schoolinghabitation which do not have the schoolingfacilities and strengthen existing schoolfacilities and strengthen existing schoolinfrastructure through provision of additional class infrastructure through provision of additional class room, toilets, drinking water, maintenance androom, toilets, drinking water, maintenance andschool improvement grant and additional teachers. school improvement grant and additional teachers.
2.2. Rural Health InfrastructureRural Health Infrastructure
•• One subOne sub--centre manned by one female and onecentre manned by one female and onemale multimale multi--purpose worker, covering a population purpose worker, covering a population of 5,000 in plain area and 3,000 in hilly tribal areas.of 5,000 in plain area and 3,000 in hilly tribal areas.
•• One primary health centre covering a population One primary health centre covering a population of 30,000 in plain areas and 20,000 in tribal hilly of 30,000 in plain areas and 20,000 in tribal hilly areasareas
•• One community health centre covering 80,000 to One community health centre covering 80,000 to 1, 20,000 population with 30 indoor beds, well1, 20,000 population with 30 indoor beds, wellequipped laboratory and Xequipped laboratory and X--Ray facilities. Ray facilities.
3. Safe drinking water for all3. Safe drinking water for all
Accelerated Rural Water Supply Programme (ARWSP)Accelerated Rural Water Supply Programme (ARWSP)
One hand pump or stand post is estimated for every 250 persons. One hand pump or stand post is estimated for every 250 persons. In case of an independent habitation/ hamlet/In case of an independent habitation/ hamlet/Wadi/Tola/Majra/Mohra etc, if their population is less than 250 Wadi/Tola/Majra/Mohra etc, if their population is less than 250 persons and there is no potable water source within its locationpersons and there is no potable water source within its location, one , one source may be provided. A rural habitation not having any safe source may be provided. A rural habitation not having any safe water source with a permanently settled population of 20water source with a permanently settled population of 20households or 100 persons, whichever is more, may be taken as thhouseholds or 100 persons, whichever is more, may be taken as theeunit for coverage with funds under the ARWSP. However, the unit for coverage with funds under the ARWSP. However, the State Government could cover any habitation regardless of itsState Government could cover any habitation regardless of itssize/population/number of households with funds under thesize/population/number of households with funds under theMNP. DDP areas and SC/ST habitations with less than 100MNP. DDP areas and SC/ST habitations with less than 100persons can, however, be covered under the ARWSP. persons can, however, be covered under the ARWSP.
The prime objective of PMGSY is to provideThe prime objective of PMGSY is to provideconnectivity by way of an allconnectivity by way of an all--weather road to theweather road to theunconnected habitation in the rural areas. unconnected habitation in the rural areas.
## Covering habitations with a population of 1,000 and Covering habitations with a population of 1,000 and above by 2003above by 2003
## Habitation with population of 500 and above by 2007Habitation with population of 500 and above by 2007
## Connecting habitation with a population of 250 and Connecting habitation with a population of 250 and above in hilly, mountainous, deserts areasabove in hilly, mountainous, deserts areas
Schemes being implemented through PRIsSchemes being implemented through PRIs
Establishing large number of microEstablishing large number of micro--enterprise in rural areas. enterprise in rural areas. Skill development, credit, technology transfer, marketing and Skill development, credit, technology transfer, marketing and infrastructure promotion. infrastructure promotion.
Providing additional wage employment in rural areas asProviding additional wage employment in rural areas as alsoalsofood security for creation of durable community, social and food security for creation of durable community, social and economic assets and infrastructure. economic assets and infrastructure.
•• 11th Finance Commission Grant11th Finance Commission Grant
Primary school, primary health care, safe drinkingPrimary school, primary health care, safe drinkingwater, street lighting, village sanitation, maintenance of water, street lighting, village sanitation, maintenance of assets and common property resource. assets and common property resource.
•• MPLAD (Member of Parliament Local AreaMPLAD (Member of Parliament Local AreaDevelopment scheme)Development scheme)
Creation of durable assets based locally felt needsCreation of durable assets based locally felt needs
IRAPIRAP
Local Economic DevelopmentLocal Economic Development
PartPart -- II
I.I. Economic Sectors in Rural OrissaEconomic Sectors in Rural Orissa
-- Input (credit, raw Input (credit, raw material)material)
-- Technology (training)Technology (training)
-- MarketingMarketing
-- marketingmarketing
•• Common Support NeedsCommon Support Needs
-- Access Road Access Road -- Transport Facility Transport Facility -- BankBank-- Cooperative Society Cooperative Society -- MarketMarket-- Post OfficePost Office-- TelephoneTelephone-- ElectricityElectricity-- Fire StationFire Station
III.III. Provision of Economic Infrastructure by GovernmentProvision of Economic Infrastructure by Government
!! InfrastructureInfrastructure
"" Agricultural Input Centre Agricultural Input Centre "" Agro Service Centre Agro Service Centre "" Paddy Collection Centre Paddy Collection Centre
"" IrrigationIrrigation
"" Agricultural Produce Market Agricultural Produce Market Centre (Centre (KrishakKrishak Bazaar)Bazaar)
!! Coverage AreaCoverage Area
-- Block / PanchayatBlock / Panchayat-- Cluster of PanchayatsCluster of Panchayats-- Cluster of PanchayatsCluster of Panchayats
""Livestock Aid Centre Livestock Aid Centre ""Milk Collection Centre Milk Collection Centre ""Cold StorageCold Storage""Micro Harbour (Jetty)Micro Harbour (Jetty)
"" Ice Factory Ice Factory
""Handloom & Handicraft Handloom & Handicraft Common Facility CentreCommon Facility Centre
""Minor Forest Produce Minor Forest Produce Collection Centre Collection Centre
-- Gram PanchayatGram Panchayat-- Cluster of ProducersCluster of Producers-- Cluster of Producers Cluster of Producers -- Fisherman villages in Fisherman villages in
Coastal area Coastal area -- Cluster of fisherman Cluster of fisherman
villagesvillages
-- Cluster of Artisans Cluster of Artisans
-- Village/Cluster of Village/Cluster of villagesvillagesin forest areas in forest areas
""Commercial Bank Commercial Bank ""Cooperative Society Cooperative Society ""Post OfficePost Office""TelephoneTelephone""ElectricityElectricity"" Secondary MarketSecondary Market""Cyclone Centre Cyclone Centre
""Transport & Connecting Transport & Connecting Road NetworkRoad Network
-- Cluster of GPsCluster of GPs-- GP/ClustersGP/Clusters-- Gram PanchayatGram Panchayat-- VillageVillage-- VillageVillage-- Cluster of villagesCluster of villages-- Cluster of villages in Cluster of villages in
coastal areascoastal areas-- Village/Cluster of Village/Cluster of
IV.IV. Basic Needs Versus Economic OpportunitiesBasic Needs Versus Economic Opportunities
Integrated Development: Integrated Development:
Basic Needs Basic Needs
++
Economic OpportunitiesEconomic Opportunities
==
Integrated DevelopmentIntegrated Development
Basic NeedsBasic Needs
Needed for AllNeeded for All
Social DevelopmentSocial Development
Economic Opportunity Economic Opportunity
Needed for Economic Needed for Economic GroupsGroups
Livelihood Support Livelihood Support SystemSystem
PartPart –– IIII
Process & ToolsProcess & Tools
Important features of the processImportant features of the process
•• T1: Data Collection & MappingT1: Data Collection & MappingVillageVillage--level Economic Infrastructure Surveylevel Economic Infrastructure Survey
Main features of the QuestionnaireMain features of the Questionnaire::–– General characteristics of the villageGeneral characteristics of the village–– Households by land ownershipHouseholds by land ownership–– Education patternEducation pattern–– Livelihood pattern (Farm, NonLivelihood pattern (Farm, Non--Farm, Service, Business, Farm, Service, Business,
Collection & Processing, Skilled work, Unskilled work and Collection & Processing, Skilled work, Unskilled work and Employment)Employment)
–– Main agricultural cropsMain agricultural crops–– Irrigation sourcesIrrigation sources–– FuelFuel
–– Major village produce Major village produce –– Infrastructure (Production, Credit and Banking, Market and Infrastructure (Production, Credit and Banking, Market and
Others)Others)–– Transport facility Transport facility –– Village resources (Livestock, Farm produce, Fishery and Other Village resources (Livestock, Farm produce, Fishery and Other
economic resources)economic resources)–– Access to Gram Panchayat level OfficesAccess to Gram Panchayat level Offices–– Access to vocational / technical training centresAccess to vocational / technical training centres–– Village enterpriseVillage enterprise–– Natural calamitiesNatural calamities–– Migration characteristicsMigration characteristics–– Tourism potentials Tourism potentials –– Infrastructure needsInfrastructure needs
•• Data processing and preparation of Gram Panchayat Data processing and preparation of Gram Panchayat infrastructure access database, Block databaseinfrastructure access database, Block database
•• Preparation of Block level rural infrastructure status Preparation of Block level rural infrastructure status maps : maps : –– Major economic groupsMajor economic groups–– ElectricityElectricity–– Secondary market Secondary market –– TransportTransport–– MigrationMigration–– IrrigationIrrigation–– Major economic infrastructure Major economic infrastructure
–– Major road networkMajor road network
Rural Economic Infrastructure at a Fleeting LookRural Economic Infrastructure at a Fleeting Look
Major Economic Groups Major Economic Groups –– Khallikote BlockKhallikote Block
Major Road Network Major Road Network –– Khallikote BlockKhallikote Block
T2: Problem Ranking & PrioritizationT2: Problem Ranking & Prioritization
•• Fixing access indicators for different rural infrastructure Fixing access indicators for different rural infrastructure
•• Methods and formula for quantifying access problemMethods and formula for quantifying access problem
•• Training workshops for Gram Panchayat functionaries and Training workshops for Gram Panchayat functionaries and officials on quantification of access problem. officials on quantification of access problem.
•• Preparation of infrastructure constraints and priority books forPreparation of infrastructure constraints and priority books for26 Gram Panchayats. 26 Gram Panchayats.
•• Block level problem priority maps for 22 infrastructure sectorsBlock level problem priority maps for 22 infrastructure sectors
T2 WorkshopT2 Workshop
Problem IndicatorProblem Indicator
Problem Scoring FormulaProblem Scoring Formula
Problem Priority Sheet Problem Priority Sheet –– Khallikote BlockKhallikote Block
Block Abstract of Travel Time Characteristics Block Abstract of Travel Time Characteristics to Important Destinationsto Important Destinations
Problem Priority Map : AgricultureProblem Priority Map : AgricultureInput Centre Input Centre –– Khallikote BlockKhallikote Block
Problem Priority Map : Road Network Problem Priority Map : Road Network ––Khallikote BlockKhallikote Block
T3: Project FormulationT3: Project Formulation
•• Training to Gram Panchayat functionaries and officials Training to Gram Panchayat functionaries and officials of 4 Gram Panchayats on formulating projects andof 4 Gram Panchayats on formulating projects andpreparing Fivepreparing Five--Year Gram Panchayat “Shelf ofYear Gram Panchayat “Shelf ofProjects” for economic infrastructure development. Projects” for economic infrastructure development.
•• Preparation of Gram Panchayat “Shelf of Projects” on Preparation of Gram Panchayat “Shelf of Projects” on economic infrastructure development for 4 Gram economic infrastructure development for 4 Gram Panchayats by the Gram Panchayat functionaries Panchayats by the Gram Panchayat functionaries following the T3 process flow. following the T3 process flow.
•• Preparation of Gram Panchayat wisePreparation of Gram Panchayat wiseinfrastructure intervention maps for 4 Gram infrastructure intervention maps for 4 Gram Panchayats:Panchayats:
"" AgricultureAgriculture"" Animal Husbandry Animal Husbandry "" Public FacilitiesPublic Facilities"" Handloom and Handicrafts Handloom and Handicrafts "" IrrigationIrrigation"" Micro Harbour (Jetty)Micro Harbour (Jetty)"" Road Network Road Network
T3 Training WorkshopT3 Training Workshop
Process Flow ChartProcess Flow Chart
Important stages of the processImportant stages of the process
•• Palli Sabha / Village general meeting / economic subPalli Sabha / Village general meeting / economic sub--groupsgroups–– Problem cluster identification and analysisProblem cluster identification and analysis–– Project idea formulation Project idea formulation –– Project screening on development objectivesProject screening on development objectives
•• Gram Panchayat Gram Panchayat –– Merging of projectsMerging of projects–– Preparation of eye cost estimatePreparation of eye cost estimate–– Assessing effectsAssessing effects–– Ranking of projectsRanking of projects
•• Gram Sabha / Panchayat general body Gram Sabha / Panchayat general body –– Approval of list of projects Approval of list of projects
•• Gram Panchayat Gram Panchayat –– ProgrammingProgramming–– Select and forward projects requiring technical and Select and forward projects requiring technical and
financial screening / advicefinancial screening / advice–– Forwarding of projects to other sources of funds Forwarding of projects to other sources of funds
•• Needs of Rural PopulationNeeds of Rural Population•• Traditional IRAPTraditional IRAP•• IRAP in India ContextIRAP in India Context•• PRIs, Decentralized Planning & Rural Infrastructure PRIs, Decentralized Planning & Rural Infrastructure •• Gram Panchayats Gram Panchayats •• Major Govt. of India Programmes for Rural Infrastructure DevelopMajor Govt. of India Programmes for Rural Infrastructure Developmentment
PartPart –– II•• Economic sector in rural Orissa Economic sector in rural Orissa •• Their needsTheir needs•• Provision of economic infrastructure by governmentProvision of economic infrastructure by government•• Basic needs versus economic opportunitiesBasic needs versus economic opportunities
PartPart –– IIII•• Process & Tools Process & Tools
-- T1: Data Collection & MappingT1: Data Collection & Mapping-- T2: Problem Identification & Prioritization (Training WorkshopT2: Problem Identification & Prioritization (Training Workshop –– 1)1)-- T3: Projection Formulation (Training Workshop T3: Projection Formulation (Training Workshop –– 2)2)
Thank YouThank You
ANNEX
Nepal
Mainstreaming IRAP tool in NepalJagannath Ojha, Planning Officer
DoLIDAR, MoLD, HMGN
INTRODUCTION:
Integrated Rural Accessibility Planning (IRAP) identifies the development needs of the ruralcommunities by making use of some basic concepts such as i) objective and participatory assessment of access constraints, ii) integrated approach to identifying solutions to improve the accessibility and iii) enhancing (or strengthening) decentralisation and local participation. Making use of theseconcepts an endeavour was made to adapt IRAP into the existing local- level planning system in Nepal recently. For the purpose of adaptation some pilot exercises of local-level planning were undertaken and on the basis of this experience IRAP Guidelines, Manual and Training Modules were developed. The pilot exercise and the documents developed thereafter represent the adapted IRAP tool in Nepal. This tool has found wide appreciation in development discourse in Nepal and is being applied toundertake local- level planning exercise currently for developing District Transport Master Plan(DTMP) of Rasuwa district. The tool will be used in number of other districts for developing (or updating) specific plans like DTMPs, District Perspective Plans and Annual Development InvestmentPlans in near future.
Albeit development needs are always integrated, the development practice in real life, however, is mostly divided into sectors. This holds true also in case of local-level development planning in Nepal. The local-level planning is practically comprised of different sectors; therefore, it is necessary that theIRAP tool be harmonised with the practice that is somehow divided into sectors before applying it to produce different plans. This would mean truly mainstreaming IRAP by devising appropriate indicators among other things. This brief paper deals with the difficulties and experiences in the ongoing efforts to mainstream IRAP in Nepal.
THE COUNTRY: NEPAL
Nepal geographically occupies approximately the middle third part of the Himalayas and its southern slopes descend down through range of mountains, hills and valleys to the fringe of Gangetic plain. It is a land-locked country surrounded by India in the east, south and west and by Tibetan autonomous region of China in the north. The country has a political system of multiparty democracy with two tiers parliament. The country is divided into five development regions, seventy five districts, 58 Municipalities and 3913 village development committees (VDC).
Topographically Nepal is viewed to have been divided into three major strips running east westparallel to each other. The northernmost strip comprising the high mountains and fringes of the Tibetan plateau is called the Himalayan belt. The mountains and hills strip with a few remarkablyfertile valleys at the south of the Himalayas is called the mountain belt extends down to the southern plains. The mountain belt is sometimes divided into mountain belt in the north and hills belt in the south. The southernmost strip at the foothills, called the Terai, and is the main chunk of the plain land in the country. Some parts of the Terai are trapped between the Mahabharat mountain range and the Churiya hills range and are called inner Terai.
Total plain area of the country amounts to some 23 % of the country’s 147,181 square kilometres comprising the valleys, inner Terai and the Terai. In Nepal, given its topography, as some 77 % of area is covered with rugged hills and mountains movement of people and goods has always been difficult. Of the remaining plain land majority is in the Terai which, in turn, is criss-crossed by rivers and streams with wider fans and constantly changing their courses. The rivers create difficulty in movement of goods and people and thus, inaccessibility has always been a problem for rural Nepal whether in the hills or the plains. Isolation and difficulties, inefficiency and drudgery of transport are prominently felt development problems of rural Nepali society. In fact, this difficulty has been often attributed to be the main hurdle on the path of achieving rapider pace of economic and social development in Nepal.
Nepal: Terrain type and related details
Topography Elevation(in metres above
msl)
Population( in % of total
area)
Area(in % of total)
Number of districts
Remarks
Mountain Between4,877 – 8,848
7.3 35 16 Trans-Himalayan areas also are included in this.
Hills Between610 – 4,877
46 42 39 Highly populated valleys like Kathmandu, Pokhara, and Surkhet are in this category.
Source: Information from Statistical yearbook of Nepal 1997.
China
Settlement pattern in the hills and mountains is generally scattered with sparsely located householdsas dictated by the rugged topography. Only in relatively fewer spots there are clustered settlements owing to commercial activities or being an administrative centre. Clustered households with much less scattered housing dominate the characteristics of settlement pattern in the plain areas. Thesesettlements amidst agricultural lands are normally connected among themselves as well as to outside area by a network of tracks or wide trails that are motorable during dry season. In the terai the rural settlements are distinctively connected with esta blished urban commercial / administrative centre or evolving semi-urban commercial centres (extended village) in the area. Most of the tracks refereed to as roads by the local people, have been spontaneously developed over the time. The local people do upgrade or repair some critical sections so that walking; plying motorised vehicles, IMTs, animal drawn-carts, handcarts and pack animals is possible.
LOCAL GOVERNANCE AND DEVELOPMENT PLANNING
Lowest political unit in VDC and municipalities are wards; the peoples of the ward elects one ward chairman and 4 other members with at least one woman by direct voting. The number of wards in each village remains 9, whereas for the municipalities it varies from 9 to 35. The Village or municipality has an executive committee, which is comprised of chairperson, vice-chairperson and ward chairmen representing from each wards. There is village or municipal council, which is the legitimate body of these institutions. All the elected members from ward are the members of the council. Direct voting of the people from their defined boundaries elects these all officials. Theboundaries of district, village development committee (VDC) and wards are defined by the central government according to population, area, interest of the people and service flow. There is indirect election system of DDC officials. Each district is divided into 9 to 17 Ilakas according to parliament constituency. The VDC council members elect the Ilaka member and DDC chairperson and vice-chairpersons. DDC council is the legitimate body of the district development committee, whichcomprises each VDC and municipality chairperson and vice-chairperson; DDC executive body and members of the parliament of the district became the member of the council.
Local Self-Governance Act 1999 provides for these local authorities and are identified as local governments. From development and administrative point of view the district is very important unit as the bottom-up process of need identification and top-down process of investment allocation from the central agency merge at this level. They have the overall responsibility for local-level development activities including planning and implementation of development activities. Under the existing legal framework and following certain guidelines they are liable to prepare perspective plans, periodicplans, annual investment programmes among others. Local-level development planning system isdefined by a procedure comprising of 14 steps. This procedure is very much participatory in nature and produces investment plans. The investment plans are for VDC level decision making (upto 7th
step) at the bottom. The next level is that of DDC’s investment decision and finally the plan is for central-level investment through sectoral agencies (step 8 and up).
The following table shows the details of the planning system.
Steps Theme Activity Who / WhenPrimary Information Data analysis and preparation of resource map DDC information centre Step 1 Guideline Fix budget Ceiling NPC/middle of NovemberStep 2 Revision of
guidelineRevision of guideline and budget ceiling DDC / Third week of November
Step 3 PlanningWorkshop
Discussion of plan priority and budget with DDC member and line agency heads
DDC/ End of November
Step 4 VDC meeting Discussion of possible priority sector and programme / projects at ward and settlement level
VDC/ Third week of December
Step 5 Selection of Projects
Discussion of felt need of community, prioritise projects and fill-up of demand collection
Community/ Third week of December
Step 6 Ward Meeting Compilation of community demand, prioritisation and recommendation for VDC
Ward meeting/ Last week of December
Step 7 VDC Meeting Compilation of ward level projects, Resource estimation, Prioritisation, Classification of projects according to resource, which is implemented through VDC, and have to recommend for district level.
VDC/January first week
Step 8 VDC Council Meeting
Prioritisation and approval of programmes for implementation and recommenda tion of the projects that have to implemented through district
VDC Council/ Second week of January
Step 9 Ilaka Level PlanningWorkshop
Compilation and Prioritisation and Recommendation of projects received through VDC Council
Coordinated by Ilaka Member / First week of February
Step 10 Sectoral Planning Meeting
Classification of projects recommended from Ilaka level, Prioritisation and recommendation for process
Sectoral Committee of DDC/ Third week of February
Step 11 IntegratedPlanningFormulation
Inclusion, Exclusion and revision of priority of the projects on recommendation of Sectoral Planning Committee
Integrated Planning Committee of DDC/ End of February
Step 12 DDC Meeting Compilation and analysis of projects from Sectoral committees and appraisal of compiled projects i.e. environmental, economic and social , Prioritisation of projects, classification of projects according to resource i.e. implementation through own resource or requires central level resources through sectoral ministry.
DDC / First week of March
Step 13 DDC Council Approval of programmes and policies of district Second week of MarchStep 14 Implementation Presents the approved programmes to the central
agencies.Implementation of programmes after approval of central agencies
Fourth Week of march
After approval generally at end of July.
The following chart illustrated the structure of the planning system indicating bottom-up demand generation and top-down investment decision.
Local-level Planning System in Nepal
Ministry of Finance
National Planning Commission
District CouncilDistrict Council District Council
Prioritisation, Coordination between projects, integration, fund allocation,
VDC Council VDC CouncilVDC Plan; Prioritised projects, resource allocation
Final recommendation for budgetary allocation
Settlements
Demand Collection from the
SettlementsSettlements
Line agencies / MinistriesRecommendation for budget
NGOs/ INGOS & Donor Agencies
Resource
Bo
tto
m-u
p P
roce
ssT
op
-do
wn
Pro
cess
AIs = Weighted Travel Time + Weighted Quality Aspect of SOR facility= (Time In applicable Slab x Df ) + Grade Physical Quality of SOR facility + Grade Management of Service
and AIe = Households {Time In applicable Slab x D f ) + Grade Physical Quality of SOR facility + Grade Management of Service
IRAP TOOL IN NEPAL
IRAP Tool developed for Nepal addresses the need of DDCs in undertaking their planningresponsibilities. It is a generic tool adapted within the existing planning system. The IRAP Guidelines provides for theoretical and policy perspective as to how IRAP concepts are to be adapted and integrated into the existing planning system. IRAP Manual deals with the procedural part as to how to put it into practice while applying this tool in preparing one or the other plan.
The tool can be used to identify local needs in an objective manner by considering accessibilitymeasured in terms of Accessibility Index. Accessibility Index (social if without number of households in a settlement and economic if with number of individual households) is composed of travel time and quality aspect of SOR (service, opportunity, resources) facility as shown below.
Travelling time is to be accounted in slabs and difficulty factor Df is assessed on the basis of participatory judgement. Integer value for Physical Quality of SOR Facility and Management of Services are to be assigned as according to the participatory assessment.
For actually putting this tool into practice it is necessary that all the relevant sectors are given due consideration. The IRAP Manual does address this issue by proposing particular schemes ofindicators with their conditional values. The sectors addressed by the Manual are Education, Health, Water Supply, Market Access, Communication, Forest Access, Irrigation and Electric Power. Choice of indicators and their assigned values is subjective and largely depends on the ground reality.Therefore, every time when this tool is applied to prepare one or the other plan specific choice of indicators in concerned sectors has to be made and such choice must be based on the knowledge of ground realities in that sector.
INTEGRATION OF IRAP IN SECTORAL PLANNING
As indicated earlier there are basically two levels of decision making in local-level development investment – at the purview of local governments and from the central government through the sectoral agencies present in the district. The IRAP Tool as developed and ready for use is primarilyfor first kind of decision making that is at the local government level. However, it is realised that IRAP can be very useful also for the sectoral local- level planning. Functioning of sectors in Nepal is vertically divided and largely isolated from one another , though their investment plan for the local-level activitie s must be discussed and approved by the District Council. Therefore, integration of IRAP concepts in local- level planning contexts of these sectors may be done separately taking a sector-by-sector approach. Obviously, different sectors practice different sets of indicators for project identification and prioritisation. It is this set of indicators where IRAP needs to be integrated.
The following is the list of different (development) sectors / sub-sectors present in the districts:
Sectors / sub-sectors Agency Remarks1 Health District Health Office, Ministry of Health2 Education District Education Office, Ministry of
Education and Sports3 Water Supply and
SanitationDivisional Water Supply Office, Ministry of Housing and Physical Planning
4 Agriculture District Agriculture Development Office,
Ministry of Agriculture and Cooperatives5 Communication District Post Office, District
Telecommunications Office, Ministry of Communications
6 Rural Transport District Technical Office, DoLIDAR, Ministry of Local Development
7 Irrigation Divisional Irrigation Office, Ministry of Water Resources
8 Forestry District Forest Office, Ministry of Forest9 Livestock District Livestock Office, Ministry of
Agriculture and Cooperatives10 Soil Conservation District Soil Conservation Office, Ministry
of Forest11 Industrial development District Small and Cottage Industries Office,
Ministry of Industry, Commerce and Supply.12 Tourism Tourism Promotion Centre, Ministry of
Tourism
SECTORAL INDICATORS
In any sector the choice of indicators may be complex particularly when quality aspect of the service facility is being addressed. The choice also depends on the very fact that required quality of any service facility varies from place to place and time to time. Reference may be made to various standards and policy targets for choosing one or the other sets of indicators. For example, thefollowing list of elements may be the indicators for primary education.
! Walking distance from the community (to the nearest school)! Type of road/trail and its condition! Means of transport! Children of primary school (age 6-11years) in the community! Sitting area in the class! Availability and condition of furniture! Water supply! Scholar and teacher ratio! Class and teacher ratio! Toilet! Separate toiled for female ! Number of female teacher! School enrolment ratio! Dropout ratio of nearest school! Ethnicity! Financial position of the school
CONCLUSION:ISSUES FOR DISCUSSION
There might be many more elements that may serve as indicator to the access or quality of the concerned service. It might not be possible to actually measure the magnitude of all the indicator-likeelements. Even when possible it might be extremely complex, and therefore, might not be desirable.Therefore these indicator-like elements should be carefully chosen so that they represent certain aspect in a straight forward and simple manner. Sometimes even indirect or proxy indicator may chosen. The chosen indicators then may be grouped together to represent the intended aspect. Forexample, walking distance, road or trail type and its condition and means of transport can be grouped together as they indicate ease or difficulty in physically reaching the facility. They may be called “Physical Access Indicator ”. Some of the elements like class teacher ratio, sitting area, water facility, toilet, furniture and play ground in case of education compositely indicate overall quality of the
service facility. Therefore, they can be put into groups as quality indicators and only selected ones ofwhich may be considered representatives for making actual measurements.
Mainstreaming IRAP in Nepal
Integration of IRAP tool in need identification and prioritisation of
sectoral projects
Jagannath Ojha, Planning OfficerDepartment of Local Infrastructure Development and Agricultural Roads (DoLIDAR),Ministry of Local Development,His Majesty's Government of Nepal
Integration of IRAP tool intoSectoral Planning
• Nepal Country Context
• Planning System and Local-levelPlanning
• IRAP tool
• Integration of IRAP values in Sectoral Planning
• Conclusion: Issues for discussion
Country Context of Nepal........1
Country Context of Nepal........2
Country Context of Nepal........3
• Divided into 5 Development Regions, 75 Districts, 58 Municipalities and 3913 Village Development Committees (VDC) with 9 wards in each.
• Local Self Governance Act 1999
• Wards, as the lowest elected and organised unit, has one or more settlements
• VDC (rural) / Municipality (urban) has legislative role and functional responsibility
• Election of District Development Committee
Planning System and Local-levelInvestment Planning ........ 1
National Development Plans:
• Perspective Plans e.g. APP, Priority Investment Plan, Five-year Plans (current is 10th), Annual Investment Plan (Budgetary Speech) ............
Local-level plans:
• District Perspective Plan, District Periodic Plan, District Transport Master Plan, Annual Investment Plan.......... (Local Authorities particularly of DDCs);
• Central-level projects, Annual Investment Plan ............(Sectoral Agencies in the district);
Planning System and Local Level Planning ......2
Ministry of Finance
National Planning Commission
District CouncilDistrict Council District Council
Prioritisation, Coordination between projects, integration, fund allocation,
Co-ordination between projects and integration, Prioritisation
VDC Council
VDC Council VDC CouncilVDC Plan; Prioritisedprojects, resource
allocation
Final recommendation for budgetary allocation
Settlements
Demand Collection from the
SettlementsSettlements
Line agencies / MinistriesRecommendation for budget
NGOs/ INGOS & Donor Agencies
Bottom-up
Process
Top-down
Process
Planning System and Local Level Planning ......3
• Local Level Planning follows 14 Steps according to LSGA 1999
• Bottom-up process: need identification /demand collection, investment decision
• Top-down process: investment decision
• Merging of the two processes: DDC
IRAP tool ......................... 1
AIs = Weighted Travel Time + Weighted Quality Aspect of SOR facility= (Time In applicable Slab x Df ) + Grade Physical Quality of SOR facility + Grade Management of Service and
AIe = Households {Time In applicable Slab x Df ) + Grade Physical Quality of SOR facility + Grade Management of Service
"IRAP Piloted during 2002 – 3 in 4 districts
"Guidelines, Manual and Training Modules for adapting IRAP in Nepal developed: DDC the target user of IRAP tool, adaptation in the prevailing planning system, quality aspect of SOR taken into consideration, .........
" Government and other stakeholders welcome the IRAP tool;
" Currently IRAP tool is being used in Rasuwa for updating DTMP
" Future plans to apply IRAP in more districts;
IRAP tool ......................... 2
Integration of IRAP values in Sectoral Planning ..... 1
• Sectoral agencies of the government at the district: NeedIdentification, Project Prioritisation, Investment Planning and Implementation;
• Involved in the DDCs planning process as well as in their own;
• Sectors / sub-sectors work with their own set of indicators with respect to policy priority and standards;
• IRAP basic values: Need identification through integrated solutionto access constraints (Physical Access and Quality Aspect of service facility) in a participatory manner.
• "Access Constraints" can be objectively assessed by looking intovarious indicators ( "Access Indicators").
• Integration of IRAP values: Adapting or combining these indicators with the existing ones or re-molding the existing ones to include these.
Integration of IRAP values in Sectoral Planning ..... 2
Sectors / sub-sectors Agency
Health: District Health Office, Ministry of Health
Education District Education Office, Ministry of Education and Sports
Water Supply and Sanitation: Divisional Water Supply Office, Ministry of Housing and Physical Planning
Communication: District Post Office, District Telecommunications Office, Ministry of Communications
Agriculture: District Agriculture Development Office, Ministry of Agriculture and Cooperatives
Rural Transport: District Technical Office, DoLIDAR, Ministry of Local Developmen t
Irrigation: Divisional Irrigation Office, Ministry of Water Resources
Forestry: District Forest Office, Ministry of Forest
Livestock: District Livestock Office, Ministry of Agriculture and Cooperatives
Soil Conservation: District Soil Conservation Office, Ministry of Forest
Industrial development: District Small and Cottage Industries Office, Ministry of Industry, Commerce and Supply.
Tourism: Tourism Promotion Centre, Ministry of Tourism
Government Sectors in the district:
Integration of IRAP values in Sectoral Planning ..... 3
Walking distance from the communityType of road/trail and its conditionMeans of transport
Class and teacher ratioStudents and teacher ratioNumber of female teacherSitting area in the classAvailability and condition of furnitureAvailability and condition of water supplyChildren of primary school (age 6-11years)Availability and condition of toilet Separate toiled for female School enrolment ratioDropout ratio of nearest schoolEthnic composition of students Financial position of the schoolETC..........
Physical Access Indicators
Quality Indicators of service facility
List of indicator-like elements in primary education: Example
Conclusion: Issues for Discussion.... 1
Choice of representative indicators:
• Should be simple, objectively assessable, and adaptable to the concerned sector;
• Depends upon general conditions prevailing in the rural areas of the country;
Issues for Discussion:
• Integration of IRAP in sectoral planning: an area of expansion, specialisation and part of the mainstreaming;
Strengthening Local Capacity for Sustainable Rural Infrastructure Development for Poverty Alleviation in TAO of Thailand- Local Level Planning 1
Local Level Planning Process Improvement in Infrastructure Development: Case Studies in Thai Sub-District Local Government
Khon-Kaen UniversityNarong Leaungbootnak
Asian Institute of Technology, AlumniKriangsak Chatanantavet
AbstractAny planning process is considered as the most critical function influencing thesuccess of infrastructure development, especially for the local government. InThailand, the Tambol Administrative Organization (TAO), which is the smallest local government unit, was recently outlined as a rural development initiative. Fromreviews of existing TAO planning processes, five groups of problems were identified: operational, functional, knowledge competency, public participation, and thoserelated to government agencies. These problems were then linked and mapped ontofour improvement areas: quality management, knowledge competency, goodgovernance and public participation. The infrastructure planning process was drawn up on the basis of these four improvement areas. The proposed process was thereafterreviewed and updated with input from focus group sessions of TAO’s majorstakeholders in order to ensure its applicability in practice. In addition to a focus on encouraging public participation of the major stakeholders, the final planningprocess shows the effective local level planning procedures with well-defined duties and responsibilities.
Keywords: Local Government, Infrastructure Development, Local level planning,Process Improvement
1. Introduction
Public sector decentralization is undertaken mainly in pursuit of a vast range of development policies and goals. The actual process, which is dependent on such policies, is complex and subject to diverse interests in line with certain objectives of decentralization such as the improvement of income and living. Not only democratic countries but socialist countries like China and Russia have also implemented the decentralization system (Serda, 2001). The implementation of decentralizationprograms was initiated in the West, and later adapted in the East, especially in Asia and Thailand in particular. A few countries, such as India and the Philippines alreadyhave substantial experience over the years and are currently building on past efforts. Itis however worthy to note that decentralized systems will not succee d without support from the central and state governments recognizing it as the mandate of the country. Efforts lacking adequate national commitment have been a key factor predictably leading to unsatisfactory results (Smoke, 2000). Initially implemented in 1992,Thailand’s decentralization scheme became an active policy issue and latercontributed to major substantial changes in the new constitution of 1997. Thesechange s effected the incorporation of decentralization in at least eight sections of the new constitution and clearly addressed that the state shall decentralize powers to localities and provide such localities the right to formulate their own self-governingbodies (Thai Parliament, 1997).
Strengthening Local Capacity for Sustainable Rural Infrastructure Development for Poverty Alleviation in TAO of Thailand- Local Level Planning 2
Infrastructure plays an important role in economic development through itscontributions to economic growth, poverty alleviation and environmentalsustainability (Gregory, 1997). However, in order to sustain the well being of local communities, a huge budget is required for infrastructure development. It was found from many studies that budgeting processes have the deficiency of ensuring effectiveand fair allocation of budgets (Tinakorn and Sussangkarn, 1996; UN ESCAP, 2003). The budgetary processes therefore, have to be strengthened to ensure that the scarce public funds are allocated effectively to those areas likely to have maximum impact in terms of public service delivery. The allocation process must take into account past performances which should be used as an input for consideration, leading to better outcomes (World Bank, 2002).
The developmental plan of the local governments of Thailand, including TAO,follows the central government policy guidelines in defining its strategic plan, five-year plan and annual plan. The strategic plan states in detail, the means of achieving the vision and mission whereas the five-year plan serves as a general framework within which the annual budgetary plan is prepared. Generally, TAO personnel plan their expenditures based on their expected revenues from four (4) main sources: taxes, central government subsidies, properties and enterprises, and loans. However, in reality, the value of collected taxes is overestimated and the transfer of supported revenue from the central government is greatly delayed. This results in an ineffective budgeting plan with uncertain expenditures (Suwanmala, 2002).
Top-down planning of a budget allocation process in rural infrastructure projects without the involvement of beneficiary communities and parties has often proven to be ineffective and an unnecessary waste of resources. Projects centered around thedevelopment of rural infrastructure ought to address the real needs of local people and optimize the use of local resources based on cost perspective during the budget allocation system, all coupled with community participation (Donnges, 2003). Budget allocation, especially for project development, tend to be more effective if the local people or their representatives influenced project selection by providing information and participating in the selection process. Participation via dialogues empowerspeople in budgetary decision-making and thus leads to fruitful outcomes of effectivemanagement of the Local Government (Michener , 1998; Cohen and Uphoff, 1980; Pongquan, 1992).
2. Problem Identification and Classification
Problem identification is one of the key components required to comprehensively capture the attributes of the TAO operating system and problems therein. These budget allocation problems were captured from focus group interviews andsystematically structured thereafter, see table 1. As suggested by Hudson et al. (1997) and World Bank (2002), these problems are categorized under two main parts;internal and external. The internal key parameters in operational, functional, and knowledge competency, are directly related to the TAO internal problems whereas the external key parameters: public participation and related government agencies are directly related to the TAO external problems.
The findings show the diversity of problems, which are grouped into five keyproblems:
Strengthening Local Capacity for Sustainable Rural Infrastructure Development for Poverty Alleviation in TAO of Thailand- Local Level Planning 3
(1) The TAO operation procedures are most often, not clearly defined. Thisobscures the main objective of the team and thus causes a lack of coordination amongst the members. In the long run, the objective cannot be reached. Various bottlenecks are faced along the course of operationsand these include: insufficient land for construction despite adequate budget, delays in progress of work, limited time frames for urgent works, errors arising from incomplete and inaccurate information. Consequently, all this leads to ineffective operational processes.
(2) Roles, duties, and responsibilities of TAO personnel, which are also notwell defined makes team members to refrain from taking on difficult tas ksbut rather concentrating on influential and beneficial activities. Thiseventually leads to inefficiency, duplication of responsibilities and over working of TAO personnel.
(3) TAO personnel lack competency and have inadequate knowledge intechnical and management know-how and government regulations. Thisresult in low efficiency and effectiveness of operations, poor decisionmaking in crucial activities, work elements not meeting standardspecifications, and certain activities not being carried out due to legaldoubts. Irrevocably, resulting outputs and outcomes do not meet the specified goal.
(4) Public participation of TAO stakeholders is not well organized and thiscaus es conflict during the period of budget allocation where theircontribution towards the decision of project selection is very low . Such projects do not usually conform to requirements of the community and thus, the project allocation equality in each area is not satisfied. This once again, leads to internal conflict and creation of social plights within the community.
(5) There seems to be a lack of contribution and cooperation from relatedgovernment agencies especially when there is reference to approvals and support information from such agencies. This hinders a smooth workingprocess. In certain cases, some personnel have conflicts of interestunderlying their authority. Members of the political circle also influenceand force TAO personnel to favor and acknowledge their requirements.Thus, there is an ineffective and inefficient expenditure of the existing limited budget.
3. Background
ILO/ASIST-AP developed a framework to enhance capacity building at the Tambollevel to be later applied to local level planning. This would include small-scalecontractors for the execution of infrastructure works. This research is based on theframework; “Strengthen the Local Capacity for Sustainable Rural Infrastructure Development for Poverty Alleviation in Thailand” in which the second phase isconcerned with Local Level Planning.
In phase 1 of the research, existing planning systems were studied to discover meansof enhancing the sub-district level capacity building by customizing and adapting IRAP concepts to the TAO planning process in Thailand. As the initial phase of the study was successfully completed, the second phase study was setup as acontinuation. The main aim of the study is to serve as a support to the Thai
Strengthening Local Capacity for Sustainable Rural Infrastructure Development for Poverty Alleviation in TAO of Thailand- Local Level Planning 4
Government in local capacity building at the sub-district level to ensure its effectiveapplication in local level planning in decentralized infrastructure works. To achieve the goals of the study, two sub-objectives needed to be achieved. These are: (a) to test and modify the draft-planning manual, an output of the first phase study, to be userfriendly and meet user requirements, and (b) to prepare a planning manual at the sub-district level to efficiently implement and utilize the improved infrastructure planning system.
Figure 1. The IRAP Planning Process in the TAO of Thailand
4. Literature Review
The TAO planning cycle, which is an output of the first phase of the study was used as a guideline to explore and carry out in-depth studies. It consists of eight steps i.e. information preparation, intervention formulation (village level), interventionformulation (sub-district level), project proposal, developing a plan proposal (draft), public hearing, decision-making, and implementation.
Three gray areas (i.e. mapping, prioritization and public participation) were identifieddue to their importance in crosscutting the IRAP concept and TAO process. Somefacts and conclusions obtained from the first phase may be summarized as follows.
Mapping: The need for mapping is to lead to further conclusions or questions and support planners to find instigated solutions to assessed problems. The study indicated that TAO had failed to formally apply the concept of mapping to itsplanning system. As mapping needs to be applied in TAO development plans, it is imperative to understand this concept in order to ensure its proper application.Once this concept is understood, it will serve as a guideline and thus provide
IRAPPlanning Cycle
4. Three Years Rolling Plan Formulation (Sub-district level)-Problems collection-Problem prioritization-Intervention formulation-Project prioritization-Project proposal-Three years rolling plan proposal
3. Three Years Rolling Plan Formulation (Village level)-SWOT analysis-Problems identification-Problem prioritization-Intervention formulation-Project prioritization-Project proposal
1. Information Preparation-National development plan-Provincial development plan-District development plan-Village basic data-Household basic need data-Map & infrastructure information
2. Strategic plan Formulation(Sub -district level)
-Where we are now? (SWOT)-Where we want to be? -How will we get there?-TAO strategic plan-Approval and endorsement
7. Action Plan Formulation-Project team assignment-Project timeline-Resources allocation-Project Leader
5. Coordination with Other TAO In The Same Area -Continuous-Same direction-Synergy-Team working
6. Annual Budget Allocation Formulation-First year from rolling plan-Executive approval-Council approval-Endorsement and declaration
Strengthening Local Capacity for Sustainable Rural Infrastructure Development for Poverty Alleviation in TAO of Thailand- Local Level Planning 5
direction for developing a mapping out system, which may be later applied in the development plan
Prioritization: The IRAP process has its primary focus on prioritization.Although the multi-criteria in each country differ, indices calculated from a rigid framework provides better reliability compared to the TAO planning process.Since such rigid frameworks have not been applied in the TAO, informal means for ranking problems/projects such as the multi-criteria system are proposed.
Public Participation: Public participation is officially encouraged at both the national and local levels. Since TAO personnel are uncertain and are not able todistinguish activities requiring public participation, who should participate, and how they should participate . This was realised during discussions with forty-eight(48) relevant personnel in five (5) TAOs regarding twelve issues, which wereconcluded and used to design the TAO manual. These twelve issues are 1) level of participation, 2) characteristics of collaboration, 3) participant’s feeling, 4)evaluation stage , 5) group sample , 6) level of willingness , 7) number of people to participate , 8) remuneration, 9) time spent in the activity, 10) limitations of the activity, 11) level of expectation, and 12) type of participation.
It can be concluded from the study that both people and tools should be utilizedsynergistically . It is important that the beneficiaries ought not to expect onlysatisfaction and convenience from the development. Once they are aware of their necessities and expectations from the TAO and they in return understand the people’sneeds, a right choice would be made. This leads to optimization and thus overall satisfaction of the community. It is important to note that people themselves ought to be more participatory in all stages of the entire process i.e. preparing stage,developing stage and monitoring stage. Despite the extensive need for resources to achieve this, it might prove to be the only means to familiarize with the people and their needs and thus cater to them accordingly.
Since a TAO planning development process involves many sectors in all levels e.g.national development plan, law, regulations, and traditions and cultures in each local area, it is necessary to deliberate on arising issues and be heedful during the entire proc ess. An overview giving a broader and clearer view of the process has to be first considered prior to focusing on details as it will facilitate problem identification and solving. Thereafter, a rigid framework and manual are required by the TAO to ensureproper guidance. At this point, it should be taken into consideration thatprojects/activities are to be covered in all TAO’ duties and responsibilities. Finally, trainings/seminars should be conducted within the community to educate, create self-awareness, and allow the people to participate in the process.
5. TAO Development-Plan Manual
The draft of a TAO development plan manual is an output of the first phase of the study. It was first published in the seminar proceedings on ‘Strengthening of Local Capacities in Implementing Infrastructure Projects’ organized by ASIST-AP, ILO on 19 December 2002. The regulation (Rev. B. E. 2541) consists of a long-term plan (10-15 years) called ‘TAO Strategic Development Plan’, a medium-term plan called
Strengthening Local Capacity for Sustainable Rural Infrastructure Development for Poverty Alleviation in TAO of Thailand- Local Level Planning 6
‘TAO 5-Year Development Plan’, and a short -term plan called ‘TAO AnnualDevelopment Plan’.
Later in 2003, the Ministry of Interior formulated Regulations on the Preparation and Integration of Local Development Plans B. E. 2546 (2003)in an attempt to actualize and update the plan (Rev. B. E. 2541). The most recent and revised regulation consists of a TAO Strategic Development Plan as a long-term plan whereas the 3-YearDevelopment Plan serves as a rolling plan. In addition, a TAO Action Plan was drawnup not as a development plan but to gather working plans, projects and activities in the Tambol each fiscal year. The manual was therefore adjusted to be in line with the new MOI regulation.
Figure 2. Structure of TAO Development Plans Rev. B.E 2541 & Rev. B.E. 2546
Strengthening Local Capacity for Sustainable Rural Infrastructure Development for Poverty Alleviation in TAO of Thailand- Local Level Planning 8
6. Methodology
To achieve the objectives and sub-objectives of the study, prototype and model projects are utilized to test the planning procedure as well as the applicability of the manual in order to identify loopholes and revise accordingly. Figure 3 shows the methodology used in this phase. The research methodology consists of four main processes: demonstration preparation, identification of key areas, action pla ns and implementation.
Demonstration Preparation: This process involves preparation activities such as selection of the TAO, planning, collection of basic data based on TAOs’ profiles, and the mobilization of stakeholders in order to secure their cooperation in theimplementation of these activities. Reports of stakeholder meetings and action plansare quite necessary.
Identification of Key Areas: In this process, meetings of stakeholders are held to select and appoint a taskforce committee for the above-mentioned demonstration.Since there are many villages within any given TAO area, these villages would be given priority to determine the order of the demonstration. The job description is thendefined and outlined to identify the roles and responsibilities of all the stakeholders in the committee. Thereafter, the taskforce selects the areas of interest and on conclusion will submit a report at the end of each activity.
Action Plans: The detailed strategic plan for the demonstration has to be formulated and the required resources allocated to various activities in such a way as to achieve the stated goals and objectives of the demonstration. The detailed plan of action has tobe drawn up, and once accepted by the responsible persons, it would be approved andsent to the TAO committees for further actions.
Implementation: The implementation of any activity or task depends on the priority placed on it. In this final process, the strategic plan for the demonstration would beformulated at the TAO level, while the rolling plan would be formulated at the village level. Monitoring and evaluation of the results are required thereafter and appropriateaction would be taken based on the result. Revisions would be made and corrections taken to improve upon poor results as necessary. Suggestions are also made as they would be required for further action reports.
7. Results of the Study
Nong-Wang-Nang-Bao TAO and Bang-Sai-Pa TAO were selected as field studies,basically due to the willingness of the people to participate in the demonstration. Since the participation of the people is very important for this study, it was necessaryto ensure the willingness of the members of the community to help and support the process. The field study commenced in November 2003 and finished in December 2003.
Strengthening Local Capacity for Sustainable Rural Infrastructure Development for Poverty Alleviation in TAO of Thailand- Local Level Planning 9
7.1 Demonstration Preparation The researchers conducted the process following the procedure shown in theframework. With the support of all people involved, the preparation works ransmoothly. Once the preliminary work was concluded, data collection started. Some information was obtained from the primary data sources e.g. Kor Chor Chor 2 Kor and Jor Por Thor. Since, secondary data was required to support the consultants, afield survey was conducted. The entire set of date and information gathered from the survey was grouped into Physical and Geographical Characteristics, People andResidence, Infrastructure and Public Utilities, Land Usage, Career and Income.
7.2 Identification of Key Areas It was found from the study that a multi-criteria prioritization method could not be used for measurement especially at a village level due to its complexity. Therefore, a new and simple method called “First Ranking Vote” which was basically adapted from random picks was proposed for the prioritisation process at the village level.There are however, some weak points in this method: lack of clear criteria for the selection process. The results showed that the new method was easier to use and moresuitable at the village level. Unfortunately, even the new method could not be used in certain events due to improper intentions and time constraints.
7.3 Action PlansPublic participation and strong commitment from high-level TAO personnel and the community are very significant and contributory to the success of this study. It is often found that in a field study, some people do not cooperate and this situation could be attributed to many factors. People have low faith in the ability of a research to improve their quality of life. The economic conditions could be another contributingfactor. People in a satisfactory state might not see any obvious need to improve the TAO. It is also worthy to note that the nature of jobs may not permit free time forpeople to participate in the study. Negative attitudes of community leaders is also asignificant factor. Naturally, people tend to look up to and follow directives of theircommunity leaders, and once the leader offer no support to the study, inevitably thepeople will also, most likely not support it either.
7.4 ImplementationMeetings at the TAO level is a key activity for obtaining information and formulatingthe strategic plan at this stage. This study focused on the village level by applying tools of SWOT. This made it possible to dig deeper into the root causes of problemsas well as the people’s fundamental needs, and come up with suitable solutions. The development strategy was later converted into an action plan, which consists of goals and indicators. Concrete indicators were setup to be measured and correctivemeasures would be taken by the responsible persons.
8. Conclusion & Recommendation
The conclusions arrived at from the study of selected prototypes w ithin the three gray areas, which are mapping, prioritization and public participation may be summarizedas follows:
Mapping: In the field study, mapping was not effectively applied for a TAO planning system. There are two main issues, which have to be addressed. Firstly,
_______________________________________________________________________________________________________________________________Strengthening Local Capacity for Sustainable Rural Infrastructure Development for Poverty Alleviation in TAO of Thailand- Local Level Planning
10
mapping out to be updated as the latest information is required to avoid problems and lead to better outcome. Secondly, mapping has to be documentedelectronically since it provides an easy-to-use format and thus, can be easily updated.
Prioritization: Complicated procedures such as the prioritization process couldnot be used in certain activities at the village level. A new method, which is simple and more practicable, was proposed and tested in the second study.However, the study showed that the new method is not applicable in all cases due to issues such as public participation.
Public Participation: Generally, Thai people do not share their opinions or ideas in the public. Thus, the researcher/trainer need to motivate the people as much as possible to secure their participation. The choice of motivation depends on many factors, e.g. nature of activity, people and time.
It is evident that there are obstacles to be faced during the implementation of themanual. The obstacles arise from both the manual and human aspects. In the initially drawn up manual, too many forms were provided and this resulted in the people’s unwillingness to participate in the study. Therefore, only necessary forms with clear explanation would be retained.
Lack of clear understanding of roles and responsibilities of TAO personnel, poorfaith in the benefits of the study, economic conditions, nature of jobs, as well as the negative attitudes of community leaders were significant barriers in achieving the objectives of the study.
To overcome the aforementioned obstacles, SWOT analysis was proposed andapplied at the village level, to measure its potential and develop strategies. Thisstrategy is converted into an action plan, which is made up of conspicuous goalsand concrete indicators. At the end of the study, the information generated wasused to adjust and improve the strategic plan at the TAO level.
9. References
ASIST Asia Pacific, International Labour Office, Sub -district Administrative Offices:Manual for Local Planning, Technology and Employment for Local Development(Thai Version). Bangkok, Thailand.
ASIST Asia Pacific, (2000), Integrated Rural Accessibility Planning (IRAP): Second Expert Group’s Meeting. ASIST-ILO, Geneva.
Chalaern-ngam C. and Luangbutnak N., (2001), Infrastructure Management inTambol Administration Organization. Asian Institute of Technology, Bangkok,Thailand.
Dingen R. (ASIST Asia Pacific), (2000), A Guide to Integrated Rural AccessibilityPlanning in Malawi. ASIST-ILO, Geneva.
_______________________________________________________________________________________________________________________________Strengthening Local Capacity for Sustainable Rural Infrastructure Development for Poverty Alleviation in TAO of Thailand- Local Level Planning
11
Jayant Kumar Routray, Local Development Planning in Nepal: Methodological and Operational Issues. Asian Institute of Technology
Local Development Department, (B.E. 2540), Lecture Paper: Training Program for TAO Council and TAO to Improve Abilities in Project Planning and Management.Ministry of Interior, Bangkok, Thailand.
Lue V. Zwaenepoel, SWOT Methodology and Regional Development Planning . EU Consultant, Regional Strategic Planner
Makasiranon Veravuth, Visionary Leadership (in Thai). 4th Edition, Expertnet,Thailand.
Population and Social Research Institute (B.E. 2539), “Scripture of TAO Members”, Academic Issue No. 226, Mahidol University.
Sub-district administration Division (B.E. 2542). TAO Council and TAO’ s Profile. Department of Local Administration, Bangkok, Thailand.
Sub-district administration Division. Law, Regulation and Obligation, TambolAdministration Organization (Thai Version). Department of Local Administration, Bangkok, Thailand.
Sub-district Administration Division, (B.E. 2542), The Conference Aiming to Improve TAO Performance in Year 2542. Local Development Department, Bangkok, Thailand.
Sub-district Administration Division, (B.E. 2545), Manual for an Expert (District Level) in the Program of Improving TAO Performance in Year 2545. LocalDevelopment Department, Bangkok, Thailand.
Local Level Planning Process Improvement in Infrastructure Development: Case studies in Thai
Sub-district Local Government
Researchers: Dr. Chotchai Charoen-ngamMr. Narong LeaungbootnakMr. Kriangsak ChatanantavetMiss. Pimonsiri Kongsitti
THAILAND
Presentation Outline
•Thailand and administrative structure•TAO Organization structure and duties •Structure of TAO development•IRAP planning cycle•TAO key problems•Development methodology•TAO Strategic Plan formulation•TAO 3-years Rolling Plan Formulation•TAO Action Plan Formulation•Detail of Strategic Plan Formulation
Strategy factors to be success
! To enhance and strengthen the existing planning system
! Executive commitment! Competent team leader! Competent team members! High impact to development goal! High severity if the system is not in used
Limitations
! It is not definitely IRAP planning system, because it is not concern so much with accessibility, and Thailand go beyond the accessibility problems.
! The IRAP system can involve only the mapping and prioritization to enhance and strengthen the existing planning to reach the development goal
Regional Administration(Dec 2001)
Population 62,308,887
Provinces 75
Districts 876
Sub-districts 7,255
Villages 71,864Local Governments
BMA 1
Pataya 1
Municipals 1,129
PAOs 75
TAOs 6,744
Thailand, administrative structure
The Parliament
The CabinetIndependentAgencies
Office of the Prime Minister
FunctionalMinistries
Ministry ofInterior
BangkokMetropolitan
AdministrationDep. State Enterprises
Dep. of LocalAdministration
Regionalunits
Provincial Governor
ProvincialAdministrativeOrganization
Provincial Departmentsand State Enterprises
Provincial DepartmentOf Local
Municipalities Pattaya City
District Head
District DepartmentsTambol Administrative
Organization(TAO)
Local Administration
Central Administration
Regional Administration
Administrative structure of Thai governmentAdministrative structure of Thai government
Sub – District section
Municipalities
Dep. ofAdministration
TAO organization structure
Clerkoffice
Financialdivision
Civil work division
Public health division
TAO clerk
Executivecommittee
TAOCouncil
TownPlanning
SupplyWater
Electricity
Drainagesystem
City hall,sport etc.
Agricultureorg. &Coop.
FamilyIndustry
Peopleoccupation
Publicassets
Makeprofit from
TAO
Market,piersetc.
Commer.Activity
Touristpromotion
Waterwaysand roads
Hygienecontrol
Diseaseprotection
Disasterprotect &Alleviation
Education,Religion &
culture
Gender,children &old people
Naturalresources
& Envt.
Local art,custom
etc.
Others,requestedby Govt.
TAO
TAO’s Duties &
Responsibilities
New Development plan
Year 2003
Former Development plan
Year 1998-2002
Strategic Plan
3-Years Rolling Plan
Action Plan
Strategic Plan
5-Years Plan
Annual Plan Annual Budget Allocation
Annual Budget Allocation
Structure of TAO Development Plan
5-Key problems were found
! Unclear planning procedure! Unclear personnel Roles, duties, and responsibility ! Inadequate knowledge competency in technical,
management, and government regulation
!Unorganized Public participation of TAO stakeholder!Uncooperative of related government agency
External Factors
Internal Factors
PlanningSystem
Existing
Public Participation
QualityManagement
Update Improvement Model Scrutiny
Verification and Expression No
KnowledgeCompetency
Good Governance
Review and Updat ing
Key Concepts Affecting Improvement Process
P rob lemsIdent i f icat ion
Related Government Agency Problems
External factorsPublic participationProblems
Knowledge Competency
Internal factors
Functional Problems
Operational Problems
Final Improvement Model
SatisfyYes
planning system
planning systemDraft Improvement Model
DevelopmentMethodology
IRAPPlanning CycleIn TAO Level
4. Three Years Rolling Plan Formulation (Sub-district level)-Problems collection-Problem prioritization-Intervention formulation-Project prioritization-Project proposal-Rolling plan proposal
3. Three Years Rolling Plan Formulation (Village level)-SWOT analysis-Problems identification-Problem prioritization-Intervention formulation-Project prioritization-Project proposal
7. Action Plan Formulation-Project team assignment-Project Leader-Project timeline-Resources allocation
5. Coordination with TAO In The Same Area (District level)-Continuity-Same direction-Synergy-Team working
6. Annual Budget Allocation Formulation-First year from rolling plan-Executive approval-Council approval-District chief approval-Endorsement and declaration
1. Information Preparation-National development plan-Provincial development plan-District development plan-Village basic data-Household basic need data-Map & infrastructure information
2. Strategic plan Formulation(Sub-district level)
-Where we are now? (SWOT)-Where we want to be? -How will we get there?-TAO strategic plan-Approval and endorsement
Household RepresentativeVillage Community RepresentativeSub-district Community RepresentativeDistrict Community RepresentativeNew Elected representativeSub-district Council member Representative