+ All Categories
Home > Documents > Integrated Supply Chain Model for Sustainable Poultry ...

Integrated Supply Chain Model for Sustainable Poultry ...

Date post: 01-Jan-2022
Category:
Upload: others
View: 3 times
Download: 0 times
Share this document with a friend
329
Curtin Graduate School of Business Integrated Supply Chain Model for Sustainable Poultry Production in Bangladesh: A System Dynamics Approach Mohammad Shamsuddoha This thesis is presented for the Degree of Doctor of Philosophy of Curtin University
Transcript

Curtin Graduate School of Business

Integrated Supply Chain Model for Sustainable Poultry

Production in Bangladesh: A System Dynamics Approach

Mohammad Shamsuddoha

This thesis is presented for the Degree of

Doctor of Philosophy

of

Curtin University

i

DECLARATION

To the best of my knowledge and belief, this thesis contains no material previously

published by any other person except where due acknowledgement has been made.

This thesis contains no material which has been accepted for the award of any other

degree or diploma in any university.

Mohammad Shamsuddoha

Date: 14 May 2014

ii

DEDICATION

To My Loving Family

My Mom, Dad (Deceased), Sister, Brother and Parents-in-Law

My Wife: Tasnuba Nasir (Nomi)

My Kids: Fawaaz and Faizaan

“THANKS TO ALL THOSE WHO KEEP ME IN THEIR CONSTANT PRAYERS”

iii

ACKNOWLEDGEMENTS

“In The Name of Allah, The Most Beneficent, The Most Merciful."

First, thanks to my creator Allah to give me honour and opportunity to pursue a

PhD under a prestigious business school and scholarship.

My deepest appreciation goes to Professor Mohammed Quaddus, my supervisor.

It would not be possible to pursue a PhD using rigorous methodology without receiving

his patience, guidance and supervision. I really owe my deepest gratitude to him for his

encouragement, guidance and support, especially in the critical stages of my PhD. I also

thank Mrs Quaddus for encouraging comments whenever I have had the chance to meet

with her. My sincere gratitude also goes to Associate Professor Desmond Klass, my co-

supervisor, for his guidance on this journey.

My heartfelt gratefulness goes to the Australian Government and Curtin

University for their exclusive IPRS scholarship along with tuition and living expenses. I

am also thankful to the University of Chittagong, Bangladesh for allowing me to pursue

my PhD under study leave. Special thanks to Associate Professor Therese Jefferson who

has motivated me throughout the study. My extended appreciation goes to Associate

Professor Jeremy Galbreath, Professor Alma Whiteley, Professor Alison Preston,

Professor Al Rainne, Rod McDonald from Rockefeller College, USA for their kind

mentoring. In addition, I would like to convey my warmest gratitude to all the CGSB

staff and my alumni PhD colleagues.

I am particularly indebted to my parents for their immense contribution to my

life to travel to here. My father would have been the happiest person in the world to see

my success. As he died in 1994, I will really miss the opportunity to show my success to

him. However, my Mom and elder brother and sister will be happy to see my

achievements. Without them, it would never have been possible to have the patience to

accomplish such a journey.

Foremost, my honest and sincere gratefulness to my caring and loving wife,

Tasnuba Nasir, who is beside me to cheer me up at all times although she is also a PhD

student. She is used to cooking and managing most of the housework for the sake of

allowing me to study. There is no word to convey how much I love her. I have really

deprived my kids a little, 11-year-old Fawaaz and 21-month-old Faizaan. They are used

to seeing me as the busy father with a laptop all the time. Thanks for their

unconditional sacrifice, immense love and patience. My achievements are dedicated to

all of you.

Well, the list of people who I need to thank will not fit in a single

acknowledgements section. I have just mentioned some people whose contribution is

obvious. I may have missed a few names. May Allah give reward to all my relatives,

friends, colleagues and staff for their heartfelt assistance.

I love you all!

iv

ABSTRACT

The concepts of sustainability and supply chains are essential elements for modern

businesses in facing the immense challenges of competition and in managing economic,

social and environmental sustainability. Contemporary literature reveals that, to date,

the poultry livestock sub-sector has not received sufficient consideration from

academics. This particular industry is suffering from unstructured supply chain

processes, lack of awareness of the implications of the sustainability concept and

failure to recycle poultry wastes. Structured supply chain processes and the

sustainability concept are assumed to be mandatory to achieve additional sustainable

benefits. So far, no initiatives have been undertaken by academics to close the research

gap. To ensure an integrated sustainable supply chain process, research on this

particular industry is worthwhile. Thus, the current study is an attempt to develop an

integrated poultry supply chain model based on a case study. This current research has

considered both sustainability and supply chain issues in order to incorporate them in

the poultry industry in Bangladesh. The integration process model is an extended

version derived from real-life scattered processes carried out by different supply chain

members. By placing the forward and reverse supply chains in a single framework,

existing problems can be resolved to gain economic, social and environmental benefits,

which will be more sustainable than present practices.

This research incorporated the theoretical foundations of sustainability and the supply

chain to examine possible improvements in the poultry production process along with

waste management. This quantitative research also adopted the positivist paradigm

and ‘design science’ methodology with the support of ‘system dynamics’ and the ‘case

study’ method. Initially, a mental model was developed followed by development of the

causal loop diagram based on in-depth interviews, focus group discussion and

observation techniques. The causal model helped to understand the linkages between

the associated variables for each construct. Finally, the causal loop diagram has been

transformed into a stock and flow (quantitative) model, which is one of the

prerequisites for a system dynamics (SD)-based model. Various equations and

formulae were deployed to construct the complete stock and flow model to replicate

real-life relationships in a virtual simulation environment. Moreover, a decision

v

support system (DSS) tool was used to analyse the complex decision-making process in

selecting an accurate extension of the project.

The findings revealed that integration of the supply chain could bring economic, social

and environmental sustainability along with a structured production process to

support the research objectives and research questions. It is also observed that the

poultry industry could apply the model outcomes in their real-life practices with minor

adjustment. This present research has both theoretical and practical implications. The

proposed model’s unique characteristics in mitigating the existing problems, an ideal

for farmers, are supported by the literature. As for practical implications, the poultry

industry can follow this structure (as directed by the research model) applying their

comprehensive policy prior to testing it in the simulation model to see the complete

impact. Positive outcomes will provide enough confidence to implement the desired

changes within the industry and their supply chain networks. At the same time,

associated supply chain members may have the opportunity to use the same model for

better efficiency and performance.

vi

PUBLICATIONS FROM THIS DISSERTATION (UNTIL JANUARY 2014)

1. Shamsuddoha, Mohammad. 2010. "A Sustainable Supply Chain Process Model for

Bangladeshi Poultry Industry." In Curtin Business School (CBS) HDR Colloquium

2010 Perth, Australia, edited by Joanne Boycott, 1-7. Curtin University: Curtin

Business School.

2. ———. 2011a. "Applying Reverse Supply Chain in the Poultry Industry."

Emerging Research Initiatives and Developments in Business: CGSB Research

Forum 2011, Perth, Australia: Curtin University.

3. ———. 2011b. "Reverse Supply Chain Process as Environmental Sustainability in

the Poultry Industry of Bangladesh." Curtin Business School Doctoral Students'

Colloquium 2011, Perth, Australia: Curtin Business School, Curtin University.

4. ———. 2012a. "Achieving Sustainability through Poultry Supply Chain."

Emerging Research Initiatives and Developments in Business: CGSB Research

Forum 2012, Perth, Australia: Curtin University.

5. ———. 2012b. "Supply Chain Poultry Model: A Vensim Based Analysis." Curtin

Business School Doctoral Students' Colloquium 2012, Bentley, Perth: CBS, Curtin

University.

6. ———. 2013a. "Livestock Wastes Reuse: A System Dynamic Approach." In Curtin

Business School (CBS) HDR Colloquium 2013, Bentley, Perth, Western Australia,

edited by Fay Rola-Rubzen and Jenny Goodison, 17-24. WA, Australia: Curtin

Business School, Curtin University.

7. ———. 2013b. "Socio-Economic and Environmental Success through Effective

Poultry Forward and Reverse Supply Chain Process." Philosophy, Social and

Human Disciplines Series 1: 43-55.

8. ———. 2013c. "Waste Management: A Vensim Analysis." Emerging Research

Initiatives and Developments in Business: CGSB Research Forum 2013, Perth,

Australia: Curtin University.

9. Shamsuddoha, Mohammad, Desmond Klass, and Mohammed Quaddus. 2011. "A

Simulation Supply Chain Model for a Sustainable and Environment Friendly

Poultry Industry: Insights from Bangladesh." In Australian and New Zealand

Academy of Management (ANZAM), Wellington, New Zealand, edited by Kevin

Voges and Bob Cavana, 1-12. Newzealand

vii

10. ———. 2013. "Poultry Wastes Reuse to Achieve Environmental Sustainability."

In Australian and New Zealand Academy of Management (ANZAM), Hobart,

Australia, 1-15. Australia

11. Shamsuddoha, Mohammad, Mohammed Quaddus, and Desmond Klass. 2011a.

"Incorporating Reverse Supply Chain in the Poultry Process of Bangladesh." In

Australian New Zealand Marketing Academy Conference 2011, Perth, Western

Australia, 1-11. ANZMAC.

12. ———. 2011b. "Reducing Environmental Hazards through Reverse Supply Chain

Model." 5TH Asian Business Research Conference, Dhaka, Bangladesh: World

Business Institute (WBI).

13. ———. 2013a. "Poultry Supply Chain: A System Approach." 31st International

Conference of the System Dynamics Society, Cambridge, Massachusetts USA: System

Dynamics Society.

14. ———. 2013b. "Sustainable Livestock Farming for Improving Socio-Economic

Condition." Jurnal Teknik Industri 15 (2): 67-76.

15. ———. 2013c. "Sustainable Poultry Production Process to Mitigate Socio-

Economic Challenge." Humanomics, Emerald Publishing (Accepted).

16. ———. 2013d. "A System Dynamics Approach for Poultry Operation to Achieve

Additional Benefits." In Winter Simulation Conference 2013 Washington DC, USA,

35-43. http://www.wintersim.org/.

viii

TABLE OF CONTENTS

PARTICULARS PAGE

CHAPTER 1: INTRODUCTION 1

1.1 OVERVIEW 1

1.2 BACKGROUND OF THE RESEARCH 4

1.3 PROBLEM STATEMENT 5

1.4 RESEARCH QUESTIONS AND OBJECTIVES 8

1.4.1 Research Questions 8

1.4.2 Research Objectives 8

1.5 FOCUS AND SCOPE OF THE RESEARCH 9

1.6 DEFINITION OF TERMS 9

1.7 SIGNIFICANCE AND CONTRIBUTION OF THE RESEARCH 10

1.8 ORGANIZATION OF THE THESIS 12

1.9 SUMMARY 15

CHAPTER 2: LITERATURE REVIEW 16

2.1 INTRODUCTION 16

2.2 SUSTAINABILITY 17

2.2.1 Sustainability: A Brief Review of the Literature 17

2.2.2 Triple Bottom Line Sustainability 18

2.2.2.1 Sustainability and Economic Benefits 20

2.2.2.2 Sustainability and Social Benefits 21

2.2.2.3 Sustainability Environmental Benefits 21

2.2.3 Findings and Gaps 24

2.3 REVIEW OF SUPPLY CHAIN THEORY AND MODELS 25

2.3.1 Managing an Efficient Supply Chain 25

2.3.2 Review of Supply Chain Models 26

2.3.3 Forward Supply Chain (FSC) 28

2.3.4 Reverse Logistics (RL) and Reverse Supply Chain (RSC) 31

2.3.4.1 Reverse Logistics (RL) 31

2.3.4.2 Practising Reverse Supply Chain 32

2.3.4.3 Managing Reverse Supply Chain 33

2.3.4.4 Reverse Supply Chain Process 34

2.3.4.5 Reverse Logistics Theory and Poultry Reverse Supply Chain 37

ix

2.3.5 Findings and Gaps 38

2.4 SUSTAINABLE SUPPLY CHAIN 38

2.4.1 Frameworks for Sustainable Supply Chain Management(SSCM) 39

2.4.2 Sustainable Supply Chain Process 40

2.4.2.1 Product Design 42

2.4.2.2 Manufacturing By-products 42

2.4.2.3 By-products during Product Use 43

2.4.2.4 Product Life Extension 43

2.4.3 Environmental Friendly Supply Chain 43

2.4.4 Integrated Poultry Forward and Reverse Supply Chain 44

2.4.5 Literature and Gaps 46

2.5 SUSTAINABLE SUPPLY CHAIN IN THE POULTRY INDUSTRY 47

2.6 BANGLADESH POULTRY SUPPLY CHAIN AND SUSTAINABILITY 51

2.6.1 Grandparent (GP) to Parent Stock (PS) 52

2.6.2 Day-old Chicks (DOCs) to Mature Chicken 53

2.6.3 Hatchery and Feed Mill 53

2.6.4 Waste Processing Centre 55

2.6.5 Processing Plant and Final Consumption 55

2.6.6 Literature Gap and Research Model 55

2.7 SUMMARY 56

CHAPTER 3: BANGLADESH POULTRY INDUSTRY OPERATION AND

RESEARCH CASE DESCRIPTION 57

3.1 INTRODUCTION 57

3.2 BANGLADESH POULTRY INDUSTRY 57

3.3 PRESENT STATUS OF BANGLADESH POULTRY INDUSTRY 58

3.3.1 Bangladesh Poultry Industry at a Glance 59

3.3.2 Trends of Poultry Farms in Bangladesh 60

3.3.3 Poultry Meat and Egg Consumption 62

3.3.4 Nutritional Status 62

3.3.5 Costing and Pricing for Day-Old Chicks (DOCs) 63

3.3.6 Day-old Chicks’ (DOCs) Price and Farmers’ Profitability 64

3.3.7 Agent-level Profits 65

3.3.8 Protein Sources 65

3.4 SCOPE OF POULTRY BUSINESS 66

3.5 CONTRIBUTION TO RURAL AND NATIONAL ECONOMY 66

x

3.6 INPUT, OUTPUT AND PROCESS OF BANGLADESH POULTRY 67

3.6.1 Simplified Poultry Supply Chain Process 70

3.6.2 Bangladesh Poultry Forward Supply Chain 71

3.6.3 Bangladesh Poultry Reverse Supply Chain 72

3.7 POULTRY COMMERCIAL BREEDING 74

3.7.1 Pure Line 75

3.7.2 Great Grandparent (GGP) 76

3.7.3 Parent Stock (PS) Breeder 77

3.7.4 Day-old Chick (DOC) 77

3.7.5 Ultimate Broiler Farming 77

3.8 FORECASTED GROWTH OF BANGLADESH POULTRY INDUSTRY 78

3.9 THE CASE INDUSTRY DESCRIPTION 79

3.9.1 Nahar Agro Limited – The Case Farm 79

3.9.1.1 Nahar Agro Group 79

3.9.1.2 Historical Background 80

3.9.1.3 Vision 80

3.9.1.4 Market Share 82

3.9.1.5 Market Coverage 83

3.9.2 Nahar Products 84

3.9.2.1 Day-old Broiler Chicks 84

3.9.2.2 Day-old Layer Chicks 84

3.9.2.3 Various By-products 84

3.9.2.4 Other Products 85

3.9.2.5 Production Status of Various Products 85

3.9.3 Sources of Day-Old Parent Stock 86

3.9.4 Farming under Different Calamities 87

3.9.4.1 Poultry Disease 88

3.9.4.2 Natural Disaster 88

3.9.4.3 Over/Under-production 89

3.9.4.4 Government Policy 90

3.9.4.5 Competitors’ Actions 91

3.9.4.6 Market Demand 92

3.10 SUMMARY 93

CHAPTER 4: RESEARCH METHODOLOGY 94

4.1 INTRODUCTION 94

xi

4.2 RESEARCH PARADIGM 94

4.3 RESEARCH METHODOLOGIES 97

4.3.1 Research Design for System Development 97

4.3.2 Design Science Method 98

4.3.3 Operation of System Dynamics 99

4.3.4 Simulation Study under System Dynamics 101

4.3.5 Definition of Case Study 102

4.3.6 Integration of Design Science, System Dynamics and

Case Study 102

4.4 RESEARCH DESIGN 103

4.4.1 System Dynamics Research Framework 103

4.4.2 Research Process Followed Throughout This Study 105

4.4.2.1 Problem Definition and Structure 107

4.4.2.2 Identify Key Variables 109

4.4.2.3 Build Causal Loop Model (Qualitative) 110

4.4.2.4 Stock and Flow (Quantitative) Model Building 113

4.4.2.5 Run Simulation Model 116

4.4.2.6 Model Reliability and Validity 116

4.4.2.7 Test policy and Extreme Condition Situation 120

4.4.2.8 Forecasting Future Behaviour 121

4.4.3 Methods of Data Collection 121

4.4.3.1 Observation 122

4.4.3.2 In-depth Interviews 122

4.4.3.3 Focus Group 123

4.4.3.4 Documents and Records 124

4.4.4 Research Tool 124

4.4.5 Data Analyses 125

4.4.6 Problems Faced In Data Collection 127

4.4.6.1 Focus Group Session 127

4.4.6.2 System Dynamics and Simulation Terminology 127

4.4.6.3 Documents and Records 127

4.5 SUMMARY 128

CHAPTER 5:POULTRY SUPPLY CHAIN MODEL: A SYSTEM DYNAMICS

APPROACH

129

5.1 INTRODUCTION AND CONTEXT 129

xii

5.2 QUALITATIVE SYSTEM DYNAMICS MODEL FOR POULTRY SUPPLY

CHAIN 130

5.2.1 Causal Model Development 130

5.2.2 Identifying the Key Variables 131

5.2.3 Initial Loop with Key Variables 133

5.2.4 Comprehensive Causal Model 137

5.3 STOCK AND FLOW MODEL FOR SIMULATION (QUANTITATIVE) 140

5.3.1 Simple Stock and Flow Model on ‘Eggs and Chicks’ 140

5.3.2 Stock and Flow Rate 141

5.3.3 Complete Stock and Flow Model 142

5.3.4 Causes Tree 143

5.3.4.1 Causes Tree for ‘Mature Parent’ Variable 143

5.3.4.2 Causes Tree for Parent Chicks 146

5.3.4.3 Causes Tree for Eggs 147

5.3.4.4 Causes Tree for Hatchery 148

5.3.4.5 Causes Tree for Poultry Litter 149

5.3.4.6 Causes Tree for Total Employment 149

5.3.5 Length of Loops 151

5.3.6 Integrated Stock and Flow Model for Poultry Supply Chain 154

5.3.6.1 Parent Stock 156

5.3.6.2 Parent Capacity (Capacity Decision) 157

5.3.6.3 Profit and Loss 159

5.3.6.4 Eggs and Chicks 160

5.3.6.5 Farmers and Middlemen 161

5.3.6.6 Poultry Litter and By-products 162

5.3.6.7 Poultry Feathers 163

5.3.6.8 Employment 164

5.3.6.9 Bakery Items 165

5.3.6.10 Poultry Intestines 166

5.4 SUMMARY 166

CHAPTER 6: RESULTS OF SIMULATION 167

6.1 INTRODUCTION 167

6.2 METHODS OF DATA COLLECTION FOR VARIABLES 168

6.3 RESULTS OF POULTRY FORWARD SUPPLY CHAIN 171

6.3.1 Parent Chicks and Mature Parent and their Rates 172

xiii

6.3.1.1 Parent Chicks: Comparison with Reality 174

6.3.1.2 Mature Parent: Comparison with Reality 175

6.3.2 Simulated Behaviour for Eggs, Hatchery Stock and Chicks 176

6.3.2.1 Egg Production: Comparison with Reality 176

6.3.2.2 Chick Production: Comparison with Reality 177

6.3.3 Chicks, Middlemen, Farmers and Broiler Chicken 178

6.3.4 Mature Parent Capacity and Gap 179

6.3.5 Forward Supply Chain and Employment 180

6.4 RESULTS OF POULTRY REVERSE SUPPLY CHAIN 182

6.4.1 Poultry Litter and By-products 184

6.4.2 Real and Simulated Behaviour of Poultry Litter and

By-products 185

6.4.3 Poultry Birds and Feather Production 185

6.4.4 Bakery Items, Broken and Unhatched Eggs 187

6.4.5 Poultry Birds and Intestine Collection 189

6.4.6 Reverse Supply Chain and Employment 190

6.5 SIMULATION OF INTEGRATED POULTRY SUPPLY CHAIN MODEL 191

6.5.1 Simulation Analysis for Integrated Model 191

6.5.2 SyntheSim Mode of Integrated Model 191

6.6 RELIABILITY AND VALIDITY OF THE MODEL 194

6.6.1 Model Reliability 194

6.6.2 Model Validity

194

6.6.2.1 Boundary Adequacy Test 195

6.6.2.2 Structure Verification Test 196

6.6.2.3 Dimensional Consistency Test 197

6.6.2.4 Parameter Verification Test 198

6.6.2.5 Extreme Condition Test 198

6.6.2.6Sensitivity Analysis (Structurally Oriented Behaviour Test) 202

6.7 SCENARIO ANALYSIS 204

6.7.1 Scenario One: Increased Parent Chicks and Mature Parent

Capacity, Reduced Decision Time 207

6.7.2 Scenario Two: Consider Less Mortality and Maturing Time,

Less Unhatched and Broken Eggs, Increased Hatching

Percentage along with Doubled Rise in Hatchery Capacity

210

6.7.3 Scenario Three: Consider Reduced Cost per Parent and Other

Costs, Increased Chicks’ Price and Increased Biogas Production 213

xiv

6.8 SUMMARY 215

CHAPTER 7: DISCUSSION OF RESULTS 216

7.1 INTRODUCTION 216

7.2 RESEARCH QUESTION ONE: WHAT IS THE MOST APPROPRIATE

SUSTAINABLE POULTRY PRODUCTION PROCESS WITHIN THE

BANGLADESH POULTRY INDUSTRY IN LIGHT OF THE ECONOMIC,

SOCIAL AND ENVIRONMENTAL ISSUES?

216

7.2.1 Sustainable Poultry Production 217

7.2.2 Sustainable Benefits (Economic, Social, and Environmental)

from Poultry Activities 219

7.2.3 Economic Activities in Poultry Farming 222

7.2.3.1 Financial Profitability 222

7.2.3.2 Value Addition 222

7.2.3.3 Sales and Cost of Goods 223

7.2.4 Social Activities in Poultry Farming 223

7.2.4.1 Employment Creation 224

7.2.4.2 Poverty Reduction 225

7.2.4.3 Create Self-employed Young Entrepreneurs 225

7.2.4.4 Creating New Ventures and Family Business Creation 226

7.2.4.5 Social Welfare and Care 226

7.2.5 Environmental Activities in Poultry Farming 226

7.2.5.1 Waste Recycled or Reused 227

7.2.5.2 Reducing Environmental Degradation 228

7.2.5.3 Biofuel (Biogas) 228

7.2.5.4 Environmental Certification 229

7.2.6 Summary 230

7.3 RESEARCH QUESTION TWO: IN WHAT WAYS CAN THE POULTRY

FORWARD SUPPLY CHAIN (FSC) BRING SOCIAL CHANGES LEADING

TO EMPLOYMENT GENERATION AND, THEREBY, REDUCING

POVERTY?

231

7.3.1 Forward Supply Chain and Various Social Involvements 231

7.3.2 New Ventures (SME) and Employments 232

7.3.3 Poverty Alleviation 234

7.3.4 Summary 235

xv

7.4 RESEARCH QUESTION THREE: HOW CAN THE PRINCIPLES OF THE

REVERSE SUPPLY CHAIN (RSC) BE USED TO RECYCLE POULTRY

WASTES EFFECTIVELY?

235

7.4.1 Poultry Litter 236

7.4.2 Hatchery and Eggs 237

7.4.3 Poultry Feathers 238

7.4.4 Poultry Intestines 239

7.4.5 Summary 240

7.5 SUMMARY 241

CHAPTER 8: CONCLUSIONS AND FUTURE RESEARCH DIRECTIONS 242

8.1 INTRODUCTION 242

8.2 SUMMARY OF THE RESEARCH 242

8.3 CONTRIBUTIONS OF THE RESEARCH 246

8.3.1 Theoretical Contributions 246

8.3.2 Practical Contributions 247

8.4 IMPLICATIONS FOR POULTRY INDUSTRY AND POLICY MAKERS 249

8.4.1 Using Simulation as a Decision-making Tool 249

8.4.2 Using System Dynamics as a Decision-making Tool 249

8.4.3 Decisions Relating to Business Expansion 249

8.4.4 Improvements on Existing Situation 250

8.5 RESEARCH LIMITATIONS 251

8.6 FUTURE DIRECTIONS 252

REFERENCES 253

APPENDICES 293

Appendix A: The Bangladesh Poultry Model in SLDP 294

Appendix B: System Dynamics Modelling Approach in “SD-based”

Research 295

Appendix C: List of Variables with Units and Equations Used 295

Appendix D: Some Pictures from the Case Industry 302

xvi

LIST OF TABLES

Particulars of the Tables Page

Table 2.1: Economic Activities Related to the Study 20

Table 2.2: Social Activities in Poultry Farming 22

Table 2.3: Environmental Activities in Poultry Farming 23

Table 2.4: Major Stages of Poultry Supply Chain in Australia 48

Table 2.5: Different Stages of Poultry Supply Chain 54

Table 3.1: Snapshot of Bangladesh Poultry Industry 2012 60

Table 3.2: Bangladesh Poultry at a Glance 61

Table 3.3: Per Capita Poultry Product Consumption 62

Table 3.4: Contribution of the Livestock Sector to GDP 67

Table 3.5: By-products from Poultry Wastes 69

Table 3.6: Population Dynamics of Commercial Poultry 76

Table 3.7: Present and Forecasted Bangladesh Poultry 78

Table 3.8: Top Seven Day-old Broiler Chick Producing Companies 82

Table 3.9: Top Seven Layer Chick Producing Companies in Bangladesh 83

Table 3.10: Poultry Production per Division 84

Table 3.11: Production of Various Products for Particular Periods 85

Table 3.12: Broiler Grandparent Farms (2010) 86

Table 3.13: Parent Stock Marketing Companies (2010) 87

Table 3.14: Farms and Poultry Birds affected by Avian Influenza (AI) 88

Table 3.15: Demand Projection for Poultry Products 92

Table 4.1: Research Methodologies under Positivist and Interpretivist

Paradigms 96

Table 4.2: Methodological Framework for This Study 108

xvii

Table 4.3: Core Confidence-Building Tests 119

Table 5.1: Process of Data Collection at Different Levels 132

Table 5.2: Important Variables for Modelling 133

Table 5.3: Eleven Additional Variables for Causal Model Extension 137

Table 5.4: Loops Associated with Key Variable of ‘Mature Parent’ 152

Table 5.5: Identifying Main Areas and Key Variables for Quantitative Model 155

Table 5.6: Purposes and Equations for Determining Parent Stock 157

Table 5.7: Purposes and Equations for Determining Parent Capacity 158

Table 5.8: Purposes and Equations for Determining Profit and Loss 160

Table 5.9: Purposes and Equations for Determining Eggs and Chicks 161

Table 5.10: Purposes and Equations for Determining Farmers and Middlemen 162

Table 5.11: Purposes and Equations for Determining Poultry Litter and By-

products 163

Table 5.12: Purposes and Equations for Determining Poultry Feathers 163

Table 5.13: Purposes and Equations for Determining Employment 164

Table 5.14: Purposes and Equations for Determining Bakery Items 165

Table 5.15: Purposes and Equations for Determining Poultry Intestines 166

Table 6.1: Data Collection Methods and Purposes 169

Table 6.2: Extreme and Normal Values for Parent Chicks 198

Table 6.3: Extreme and Normal Values for Mature Parent 200

Table 6.4: Sensitivity Set-up 204

Table 6.5: Changes for Scenario One 208

Table 6.6: Changes for Scenario Two 211

Table 6.7: Changes for Scenario Three 214

Table 7.1: Benefits from Poultry Activities 220

Table 7.2: Economic Activities in Poultry Farming 222

Table 7.3: Social Activities in Poultry Farming 224

xviii

Table 7.4: Environmental Activities in Poultry Farming 228

Table 7.5: Social Impacts through Poultry Rearing 233

Table 7.6: Unused Eggs 238

Table 7.7: Feather Production 239

Table 7.8: Intestine Production 240

xix

LIST OF FIGURES

Name of the Figures Page

Figure 2.1: Sustainability: The Triple Bottom Line 19

Figure 2.2: Simplified Supply Chain 27

Figure 2.3: Normal Supply Chain with Recycling 27

Figure 2.4: Materials Flow 29

Figure 2.5: FSC with Eco-friendly Process 30

Figure 2.6: Reverse Process 35

Figure 2.7: Supply Chain Process 36

Figure 2.8: Sustainable Supply Chain Management 40

Figure 2.9: Australian Chicken Meat Industry Supply Chain 47

Figure 2.10: Poultry Supply Chain in USA 49

Figure 2.11: Poultry Supply Chain for Bangladesh Poultry 53

Figure 3.1: Trend in the Number of Poultry Farms 61

Figure 3.2: Number of GP and PS Farms 62

Figure 3.3: Nutrition Status 63

Figure 3.4: DOC Costing and Pricing 64

Figure 3.5 : Profit/kg at the Farmer Level 64

Figure 3.6: Profit/kg at the Agent Level 65

Figure 3.7: Poultry – The Cheapest Source of Protein 65

Figure 3.8: Input–Output Poultry Process Model 70

Figure 3.9 : Broiler Chicken Supply Chain 71

Figure 3.10: Bangladesh Poultry Forward Supply Chain 72

Figure 3.11: Bangladesh Poultry Reverse Supply Chain 74

xx

Figure 3.12: Number of Birds and Generations Involved in Transmission of

Commercial Broiler Genetics 75

Figure 3.13: Figure 3.13: Industry Layout (google map with reality) for Nahar

Agro (Mirarsharai Project) 81

Figure 4.1: System Dynamics, Case Study and Simulation 98

Figure 4.2: Steps of System Dynamics Approach 104

Figure 4.3: Process Needs and Considerations in “SD-based” Research 105

Figure 4.4: Simulation Modelling under System Dynamics Methodology 106

Figure 4.5: Key Variables and Their Behaviour over Time 109

Figure 4.6: Simple Stock and Flow Model for Poultry Parent Farm 114

Figure 4.7: Formal Steps of Model Validation 118

Figure 5.1: Simple Negative Loop of ‘Eggs and Chicks’ Causal Model 131

Figure 5.2: Combination of Positive and Negative Loops 131

Figure 5.3: Initial Loop with Key Variables 134

Figure 5.4: Extended Causal Diagram 136

Figure 5.5: Complete View of Poultry Causal Model 139

Figure 5.6 Basic Stock and Flow Model 141

Figure 5.7: Simplified Stock and Flow Model for Integrated Poultry

Supply Chain 144

Figure 5.8: Complete Stock and Flow Model for Integrated Poultry

Supply Chain 145

Figure 5.9: Causes Tree for Mature Parent 146

Figure 5.10: Causes Tree for Parent Chicks 147

Figure 5.11: Causes Tree for Eggs 148

Figure 5.12: Causes Tree for Hatchery 148

Figure 5.13: Causes Tree for Poultry Litter 149

Figure 5.14: Causes Tree for Total Employment 150

xxi

Figure 6.1: Stock and Flow Model for Poultry Forward Supply Chain 172

Figure 6.2: Simulated Behaviour for Parent Chicks and Mature Parent 173

Figure 6.3: Comparison between Simulated and Real-life Parent Chicks 175

Figure 6.4: Comparison between Simulated and Real-life Mature Parent 175

Figure 6.5: Simulated Behaviour for Eggs, Hatchery Stock and Chicks 176

Figure 6.6: Comparison between Simulated and Real-life Egg Production 177

Figure 6.7: Comparison between Simulated and Real-life Chick Production 178

Figure 6.8: Simulated Results for Chicks, Farmers, Middlemen and

Broiler Chicken 179

Figure 6.9: Simulated Results for Mature Parent Capacity and Gap 180

Figure 6.10: Simulated Behaviour for Forward Supply Chain and Employment 181

Figure 6.11: Stock and Flow Model for Poultry Reverse Supply Chain 183

Figure 6.12: Simulated Behaviour for Poultry Litter, Biogas, Fish Feed

and Fertilizers 184

Figure 6.13: Comparison between Simulated and Real-life By-products 186

Figure 6.14: Simulated Behaviour for Poultry Birds and Feather Production 187

Figure 6.15: Simulated Behaviour for Broken, Unhatched Eggs and

Bakery Items 188

Figure 6.16: Comparison between Simulated and Real-life Bakery Eggs 189

Figure 6.17: Simulated Behaviour for Poultry Birds and Intestines 189

Figure 6.18: Simulated Behaviour for Reverse Chain and Employment 190

Figure 6.19: SyntheSim Mode for Integrated Poultry Supply Chain Model 192

Figure 6.20: Summary of Integrated Poultry Supply Chain Model 196

Figure 6.21: Extreme Condition Test for Parent Chicks 199

Figure 6.22: Extreme Condition Test for Mature Parent 201

Figure 6.23: Extreme Condition Test for Biogas 201

Figure 6.24: Zero Mature Parent Capacity 203

xxii

Figure 6.25: Sensitivity Set-up Window 204

Figure 6.26: Sensitivity Results for ‘Mature Parent’ Variable 205

Figure 6.27: Sensitivity Results for ‘Chicks’ Variable 205

Figure 6.28: Sensitivity Results for ‘Biogas’ Variable 206

Figure 6.29: Simulated Behaviour of Parent Chicks and Mature Parent

under Scenario One Test 209

Figure 6.30: Simulated Behaviour of Wastes under Scenario One Test 210

Figure 6.31: Simulated Behaviour of Reject and Hatching Eggs under

Scenario Two Test 212

Figure 6.32: Simulated Behaviour of Farmers, Chicks and Mortality

under Scenario Two Test 212

Figure 6.33: Simulated Behaviour of Costs, Sales and Profits 213

Figure 6.34: Simulated Behaviour of By-products 214

Figure 7.1: Sustainable Poultry Process 218

Figure 7.2: Simulated Behaviour of Costs, Sales and Profits 223

Figure 7.3: Poultry Process and Sustainability 230

Figure 7.4: Employment from Forward Supply Chain 235

Figure 7.5: Poultry Wastes Usage under Reverse Supply Chain Process 237

1

CHAPTER 1:

INTRODUCTION

1.1 OVERVIEW

Bangladesh is a developing country which has many difficulties from economic, social

and environmental perspectives. Despite such difficulties, Bangladesh is still doing

better in various indexes compared to other homogeneous and neighbouring countries.

Bangladesh is managing to supply food and other basics to its huge population of 160

million people. It has achieved self-sufficiency in food production, more than doubled

per capita income within a decade, reduced the poverty rate by a substantial

percentage and controlled the birth rate, as well as many other achievements. In the

livestock sector, Bangladesh has maintained the pace of growth rate as per the demand.

Among livestock species, poultry chicken meat, which is a great protein source for the

human body, is most popular and part and parcel of Bangladeshis’ daily consumption.

The poultry industry is one of the important sub-sectors in Bangladesh, contributing in

endless ways to Bangladesh’s society and economy (Alam et al. 2009; Asaduzzaman

2000). This sub-sector has an immense reputation for creating employment

opportunities, cheap sources of protein supply, and direct and indirect income sources

for millions of people (Das et al. 2008a). Bangladesh has about 120,000-130,000

poultry farms of all sizes – small, medium and large – with a total investment of around

US$2 billion (Rahman 2012). In addition, around two billion chickens in Bangladesh

generate some 22 million tonnes of poultry litter (mixture of poultry excreta, spilled

feed, feathers, and material used as bedding in poultry farming) a year (Rahman 2012;

Saleque 2013). However, this industry still has tremendous scope to grow in terms of

production and engaging more people for their livelihood.

Unfortunately, this industry has failed to adopt modern concepts, technologies and

value addition in poultry product procurement and wastes processing. As a result, this

industry fails to take the opportunity of maintaining sustainable growth. Furthermore,

the poultry supply chain network in Bangladesh is scattered in nature, and each supply

chain member deals with a small fragmented process. Owing to minimum coordination

among supply chain players, the cost of production goes up. Moreover, farmers are

facing problems in assessing market demands, which often causes over- and under-

production. Certainly, over- and under-production lead to an unsustainable situation in

2

the relevant market. Therefore, it is essential that dynamic sustainability and supply

chain concepts be practised within the poultry production process and supply chain.

Here dynamic sustainability refers as constant learning and problem solving, ongoing

adaptation of interventions to concentrate on better adjustments between

interferences and existing contexts to expect the superior outcome over time

(Chambers, Glasgow, and Stange 2013). It is not likely to get sudden improvement

rather progressing it a slow and steady way to achieve sustainable growth. For

instance, to improve the Bangladesh poultry situation, the industry needs to practice a

dynamic, structured and integrated supply chain process along with sustainability

concepts. The logic behind of implementing improvements over the poultry industry

due to limited resources (funds, appropriate policy and method). Dynamic system can

adopt necessary changes over time to build this industry more sustainable and

profitable. This research has placed a special focus on comprehending how supply

chain and sustainability practices can be carried out to mitigate socioeconomic

challenges.

The Bangladesh poultry supply chain process is also complex in nature because it deals

with many uncertainties like different calamities and disasters. Supply-demand

imbalance, market price, low productivity, incorrect futuristic assumption, natural

disaster like flood, cyclone, seasonal variation are the few names of uncertainties.

These uncertainties hinder Bangladesh’s poultry industry in achieving sustainable

growth. To overcome this situation, the poultry industry needs an appropriate

production process, which can be designed through a rigorous supply chain process

model, techniques and methodology. The simulation technique in conjunction with

system dynamics is a creative tool to support policy analysis and decision making in

similar circumstances (Maliapen 2003; Wang et al. 2007). At a corporate level, many

industries are interested in reviewing and revising the complex production process

through applying suitable methodology, tools and techniques. In practical terms,

traditional methods which cannot immediately track problems are used to evaluate

strategic decisions involved in maintaining poultry processing. In the past, researchers

have rarely offered poultry industry executives a sustainable process and other insights

that were easily understandable.

In the supply chain perspective, there are a number of participants at different levels of

the poultry forward supply chain process (Barratt 2004). However, they are not

3

coordinated and unaware of what to do with their immediate and preceding supply

chain member regarding meeting optimum demand requirements. Each of the

members is highly centred on their own process rather investigating the consequences

of their ignorance within the process. For example, breeder farmers concentrate on

producing more chicks without considering how much supply is needed by the

immediate distribution houses. In addition, distribution houses simply sell their chicks

with a minimum profit margin and never think about breeder farmers’ problems

relating to costs, supply and market variability. Similarly, the reverse supply chain

along with waste management (Nagurney 2005; Rubio 2008) is never prioritised by

farmers and policy makers. They always assume that someone will do the waste

management or that it has no additional monetary benefit. However, reverse supply

chain concept is using for different electronic wastes in various countries (Nagurney

2005). The same concept can be applied in this current research. Yet, most of the

supply chain members never consider the social and environment benefits that are also

linked with long-term goodwill. Such a self-centric business attitude destroys their

good image with customers (Labus and Stone 2010). Subsequently, customers erupt

with several complaints against them, which are related to high pricing, supply

vulnerability, low quality and the degraded environment. In seeking to overcome such

disorganized circumstances, an integrated forward and reverse supply chain with

sustainable practices can ensure economic, social and environmental benefits (Linton,

Klassen, and Jayaraman 2007).

Realizing the current situation as discussed above, the poultry industry in Bangladesh

needs to reduce the gap between the ideal supply chain and current practices. System

dynamics (SD) approach may be a solution for this research as it aims to build an

interactive and integrative model where maximum coordination among the supply

chain members will be ensured. System dynamics can be offered suitable extended

model with simulation results for the complex supply chain system (Jain, Wadhwa, and

Deshmukh 2009). At the same time, the SD approach considers the other perspectives

of production forecasting, sustainable benefits prediction and benefits from poultry

wastes reversal through making by-products. Such dynamic research may consist of

designing a revised process model which by examining possible inputs can find out

desired outputs. These methods can be key sources for upgrading the existing situation

of a particular business process. Later, proper analyses from model testing can be key

sources for increasing and improving learning about better decision making or

4

appropriate policy making as policy makers can receive alternative ideas from ‘what-if’

analyses using the model(s) to compare with reality (Morecroft 1988b).

The necessity of the current research is enormous due to the existing supply–demand

gap, opportunities to invent supplementary benefits from the existing operation, and

the chances of creating more small and medium enterprises (SMEs), entrepreneurs and

employment. In addition, poultry value-added products and by-products from wastes

are still a new idea for Bangladesh. Such enormous scope is the instigator of the current

study to examine these issues to find out a suitable sustainable poultry process. The

study inspects a parent stock (PS) farm renowned in terms of production, experience

and process as a case. However, other parts of the industry such as grandparent (GP),

broiler and layer farms and individual distribution houses are beyond the scope of the

current research.

1.2 BACKGROUND OF THE RESEARCH

The poultry industry in Bangladesh consists of an extended forward supply chain

which starts from grandparent (GP) breed rearing and finishes with the final products

of chicken eggs and meat (Laughlin and MIBiol 2007). In addition, giant companies are

managing their wastes through converting them into valuable by-products (Reinhardt

2000). In fact, they are managing their wastes not for profit but in order to protect their

sensitive poultry breed from possible diseases. However, the profit motive is also

appropriate if wastes are properly handled and reversed through an appropriate

channel. There is an immense opportunity to implement reverse logistics in the poultry

industry. Interestingly, a little evidence is found on reversing poultry wastes for the

potential and existing market. Again, a number of supply chain members exist within

the poultry forward and backward process. With such a supply chain network, the

poultry industry has significantly contributed to the society and economy of

Bangladesh (Saleque and Mustafa 1997). Unfortunately, the Bangladesh poultry supply

chain is not structured enough to obtain its potential maximum benefits.

Furthermore, environmental issues are increasingly important due to huge population

pressures, limited land resources, food crises and drastic climate changes (Liverman et

al. 1988). Indeed, the current poultry farming process is damaging the environment

which creates more burdens for Bangladeshi society. Consequently, strong awareness

5

is mounting in support of implementing environmentally friendly operations for

poultry businesses through designing an effective supply chain and introducing the

concept of reversing wastes at the national and industry level (Mudgal et al. 2010).

Inappropriately, most poultry farmers do not have scientific knowledge on modern

poultry and poultry waste management, which results in tonnes of poultry wastes

being dumped in the lowlands, rivers and on vacant land (Zavodska 2000). In this

situation, it is crucial to implement a proper supply chain and apply sustainability

theory to this particular industry and its operations. This research proposes a realistic

poultry process model with necessary extension which includes the concept of

integrating both forward and reverse supply chains. It is assumed that the use of a

reverse supply chain has the potential of removing environmental hazards by utilizing

existing poultry wastes (Mbuligwe and Kaseva 2006). In addition, various by-products

from poultry wastes are socially, economically and environmentally feasible for home

and industrial use. This approach is also beneficial for economic and social gain for the

community through creating additional profit, new businesses and entrepreneurs.

Therefore, it is justified to conduct a research study in this field to gain maximum

benefits towards achieving sustainability. Successful implementation of the current

study will add theoretical and practical knowledge to modify the existing poultry

process for the sake of gaining sustainable benefits.

1.3 PROBLEM STATEMENT

Sustainability performance and outcomes are the major concern for modern companies

to ensure maximum facilities (Siddique and Quaddus 2011; Quaddus and Siddique

2011). Again, sustainable planning should therefore be done to accomplish the targeted

goal (Quaddus and Siddique 2004). Moreover, a sustainable process helps to expand

the current business operation and extend its supply chain network (Moore and

Manring 2009). Obviously, an extended network accommodates many small and

medium enterprises (SMEs) as supply chain members and stakeholders. In addition

sustainability brings triple bottom line (social, economic and environmental) success to

the industry concerned (Savitz 2006; Dyllick and Hockerts 2002; Epstein 2008;

Blackburn 2012). Conversely, sustainability cannot be achieved until or unless the

supply chain process is smooth and efficient (Lee 2004). An effective supply chain

assists a firm to achieve sustainability. In addition, an efficient supply chain contributes

to society in terms of employment creation (Porter and Kramer 2011),

entrepreneurship development (Ketchen Jr and Hult 2007) and increased firm

6

performance in various aspects of profitability, productivity and optimality

(Gunasekaran, Patel, and McGaughey 2004; Beamon 1999). The above-mentioned

literature reveals that both sustainability and sustainability concepts help a firm to

achieve so many things by incorporating sustainable outcomes. It is assumed from the

various literature and observation that the Bangladesh poultry industry is not

considering such issues in their operation. To date, the concerned industry is only

motivated by the ‘produce as much as it can’ policy without considering these facts.

This study now attempts to relate the above concepts within the research context to

address the research questions.

Bangladesh is considered to be one of the suitable countries in the world for poultry

rearing due to access to cheap labour, easy access to the community, available

indigenous items and shortage of supply compared to growing demand. As discussed

earlier, such suitability can be justified by reason of employment creation,

entrepreneur development, social and economic changes in rural, urban and suburban

areas and environmental restoration. However, it is argued that the Bangladesh poultry

industry does not have structural and technological facilities to adopt modern concepts

in its processes (Jensen and Dolberg 2003). In practice, the poultry industry consists of

small farmers who are involved in rearing a couple thousand poultry birds with their

modest investment (Dolberg 2001). Several studies have been conducted on areas such

as identifying problems and future prospects (Ali and Hossain 2012; Shamsuddoha and

Sohel 2004); poultry production and demand projection (Nielsen, Roos, and Thilsted

2003; Dolberg 2004); the relationship among production, efficiency and breed (Sazzad

1992); etc. In addition, other studies have also been conducted on poverty eradication

and employment creation through poultry farming, (Fattah 2000; Rahman 2003;

Permin, Pedersen, and Riise 2001); poultry farming as alternative income generating

activities (AIG) (Shamsuddoha and Sohel 2008); contract farming (Begum 2005); semi-

scavenging poultry production (Nielsen, Roos, and Thilsted 2003); poultry disease

(Islam et al. 2003); rural development through poultry (Sazzad 1992; Mack, Hoffmann,

and Otte 2005); family poultry (Guèye 2002; Jabbar and Seré 2004); etc. Arguably,

poultry farmers cannot implement optimum production and maintain sustainable

growth without an innovative policy (Jabbar et al. 2005; Jabbar 2005). Thus, innovative

policy with sustainable design can make the difference to gain ultimate sustainable

success for the industry.

7

There has been no evidence of research conducted on the poultry supply chain in light

of Bangladesh poultry. It is also rare to find academic writings on the global poultry

supply chain perspective. Thus, academics have rarely dealt with poultry sustainability

and supply chain issues except for a few conceptual studies conducted in recent times.

Recent studies have proposed the different important areas of poultry supply chain

frameworks, and poultry forward and reverse supply chains (Gwin, Thiboumery, and

Stillman 2013; Constance et al. 2013). All these studies have included simplistic models

with trivial analyses which is not sufficient for poultry farmers to carry out their own

upgrade. These studies have not considered an integrated supply chain model and have

failed to deploy a rigorous tool for research reliability in analysing the what-if (policy)

circumstances of the poultry industry. Without reliable inferences, it would be very

challenging to follow these study recommendations, as companies have invested huge

capital that does not support too many experiments. These existing problems with the

research gaps have motivated the current study to construct an integrated model for

achieving sustainable outcomes.

Since 2010, the integrated supply chain along with forward and reverse networks,

poultry wastes, by-products and sustainability have been addressed in several

publications published in different journals and presented at conferences. In addition,

researchers have also considered the reversal of poultry wastes back to the industry for

recycling and reuse to produce by-products thus attaining possible sustainable benefits

(Vieira et al. 2012). This approach has the potential of creating new windows for small

and medium enterprises (SMEs) that will contribute towards more employment

opportunities and reduce poverty. In this research, socioeconomic and environment

factors receive priority: the focus is for the industry to reuse its wastes for the sake of

solving societal challenges. It is a major concern to conduct research on this burning

issue as thousands of small businesses along with millions of people are involved in this

industry. The proposed model can be examined virtually to gain insights and a well-

thought-of understanding of the implications and benefits of various strategies rather

than investigating and overwhelming resources in the real-life situation. This is why

carrying out this research is justified to achieve a sustainable industry that might be

useful for Bangladeshi society. Notable problems exist in the Bangladesh poultry

industry as highlighted in the above paragraphs. It is worth mentioning that developing

a sustainable poultry production process is the topmost priority to which no one has

yet contributed significant procedures to address. Last but not least, the research gap

8

on forward and reverse supply chains needs to be addressed appropriately through

integrating them in one framework.

1.4 RESEARCH QUESTIONS AND OBJECTIVES

The specific purpose of this study is to develop an integrated supply chain model to

design a sustainable poultry production process. Simultaneously, forward and reverse

supply chains are examined in light of the economic, social and environmental benefits.

The model is tested and evaluated to gain more understanding with respect to three

research questions and five research objectives. These are mentioned in the section

below.

1.4.1 Research Questions

To address the purpose of this study, the following three research questions (RQs) have

been developed:

RQ 1: What is the most appropriate sustainable poultry production process for the

Bangladesh poultry industry in light of the economic, social and environmental

issues?

RQ 2: How can the principles of the reverse supply chain (RSC) be used to recycle

poultry wastes effectively?

RQ 3: In what ways can be the poultry forward supply chain (FSC) bring social changes leading to employment generation and, thereby, reducing poverty?

1.4.2 Research Objectives

These three research questions have led to the development of the following research

objectives (ROs). The specific objectives of the proposed research are to:

RO 1: Examine the present status of the poultry industry in Bangladesh in relation to its

production, process, distribution and consumption of poultry products;

RO 2: Develop a sustainable poultry supply chain model in light of the economic, social

and environmental aspects;

RO 3: Assess environmental issues in different stages of the poultry production

process;

RO 4: Investigate the implementation of a reverse supply chain (RSC) in recycling and

reusing poultry wastes; and,

9

RO 5: Identify the social impact of a forward supply chain (FSC) in the Bangladesh

poultry industry on employment generation.

1.5 FOCUS AND SCOPE OF THE RESEARCH

As mentioned earlier, the focus of this research is to model the poultry process in the

simulation environment then integrate and extend it to cover most parts of the supply

chains and to utilize all resources effectively. This research considers a case poultry

farm, which is one of the top-ranked farms in terms of production in Bangladesh.

Several poultry farming systems exist with mainly meat, egg and day-old chick

producing farms. This research takes a day-old chick farm (also known as a parent

stock farm) as a research case. Therefore, this study does not consider factors at the

national or regional level. Likewise, the variables have been considered for building a

simulation model in the poultry industry, which may not be applicable at the global,

national and regional levels. At the same time, it may not be applicable for another

associated industry like poultry feed, marketing or meat and egg producing industries

either in the original country or abroad. However, the model can be replicated in the

above-mentioned industry if variables are replaced on individual farms. Notably, this

study considers only the day-old broiler chick unit from the case parent farm and its

associated supply chain up to broiler farm level.

1.6 DEFINITION OF TERMS

Sustainability is commonly defined as utilizing existing resources to meet the needs of

the present without compromising the capability of future generations to meet their

needs (Daly 1994). Sustainability also focuses on natural balance (e.g. the natural

environment) with only inherent acknowledgement of social and economic

accountabilities (Jennings and Zandbergen 1995).

Sustainable supply chain management (SSCM) is the management of material,

information and capital flow along the supply chain while taking dimensions of

sustainable development, that is, economic, social, and environmental into

consideration with final consumers’ and stakeholders’ requirements (Seuring and

Muller 2008b). To achieve sustainability, social and environmental matters need to be

considered to integrate green/environmental issue within the process (Seuring and

Muller 2008b, 2008a).

10

Forward supply chain (FSC) is a combination of related activities within the supply

chain process from converting raw materials to producing finished goods (Cooper,

Lambert, and Pagh 1997). Lee and Tang (1997a) and Blackburn, Guide, Van

Wassenhove and Souza (2004) introduced the concept of the FSC for substantial

financial benefits.

Reverse supply chain (RSC) denotes the sequence of activities essential to retrieve a

product from a client and either dispose of it or recover value (Prahinski and

Kocabasoglu 2006a). Again, the RSC can reduce the adverse environmental effects of

extracting raw materials and waste dumping (Canan, Carol, and Robert 2007).

Parent stock (PS) refers to a mother breed of poultry genetics. Pedigree stock ("pure

line") is the highest level of genetics followed by great grandparent (GGP) and

grandparent (GP) generations, parent stock (PS), and broiler and layer (AAFC 2012).

Broilers are chickens bred and raised specifically for meat production (Kruchten

2002).

System Dynamics (SD) is a methodology and mathematical modelling technique for

framing, understanding and discussing complex issues and problems (Radzicki and

Taylor 2008). Structurally, system dynamics incorporates feedback information,

causality and non-linear relationships between variables of complex systems. The

concept of causality in model development has been explained in details in chapter 5.

(Williams and Hummelbrunner 2010; Cellier 1991).

1.7 SIGNIFICANCE AND CONTRIBUTION OF THE RESEARCH

The current study contributes to both theoretical and practical aspects of the

Bangladesh poultry industry. The present research is undertaken to contribute

additional knowledge to the poultry livestock sub-sector and its supply chain. In an

attempt to examine the existing Bangladesh poultry process model, this research will

propose a revised process model. The proposed poultry process model will address the

issues of sustainability, and efficient forward and reverse supply chains. The process

model will examine how the social and environmental issues can be dealt with in an

integrated way using forward and reverse supply chains. Thus, the proposed research

11

will produce additional knowledge, and contribute significantly on the theoretical

aspects of poultry forward and reverse supply chains.

Furthermore, this research seeks to contribute to relevant practices in the Bangladesh

poultry industry by developing a sustainable poultry process model based on the

simulation tool. The model will be developed to support real-life situations to promote

optimal outcomes within limited resources. It is thus expected that the practical

application of the study will contribute significantly to the poultry sector of Bangladesh.

It will reveal how the issues related to the poultry productivity, namely, efficacy,

resource utilization and the environment can be managed by effective use of poultry

wastes. Moreover, the revised process model along with the knowledge of

sustainability and forward and reverse supply chains will benefit poultry

entrepreneurs, executives, stakeholders and workers, the relevant livestock ministry

and officials, and the local community. Consequently, this study will significantly

contribute to the practical aspects of the Bangladesh poultry industry.

There is no evidence of research conducted on this topic where a poultry supply chain

has been analysed based on system dynamics methodology with a simulation tool. This

study combines the effectiveness of the theory of system dynamics and simulation

modelling to develop true representations of a poultry supply chain for a particular

case industry analysing operations and strategic behaviour. In practice, poultry

industrialists and policy makers can apply this visual interactive model as a learning

tool to improve their decision-making processes. They can also test their intuitive

perception by running sensitivity analyses, observing undesirable strategic behaviour,

exerting effective policies, visualizing the impacts and modifying the model to include

other related issues or scenarios. Such decision-making tools are currently not

available in the poultry industry and therefore make a significant contribution to both

theory and practice. Thus, this current research is anticipated to contribute to the

existing theory, practice and relevant policy.

Theoretical contributions

The theoretical contributions of this research is that it explores and integrates the

forward and reverse supply chains taking into consideration the maximization of

economic, social and environmental gains. This research explores ways of integrating

forward and reverse supply chain products for different groups of customers by

12

considering existing calamities and adopting innovative policies. This particular area

adds value to theory which is absent in the Bangladesh context. In addition, this

research will improve the current practices of demand and supply measures compared

to reality. This study presents a broader picture, if not the complete one, to researchers

and educators.

Practical contributions

Poultry producers and stakeholders were looking for such a method from which they

could achieve the future behaviour of particular inputs and outputs. Input and output

values rely on existing circumstances of capacity, investment, calamities and dynamic

policy. Measuring future behaviour in a timely way for various variables is the key to

making decisions for better profitability and sustainability. This research model can be

implemented in the poultry practices in Bangladesh at different levels of the supply

chain of grandparent/parent-broiler farms, suppliers, distributors and retailers.

1.8 ORGANIZATION OF THE THESIS

This thesis is organized and presented in eight chapters. The chapters are intimately

related and complementary to each other. The brief outline of the chapters is as

follows:

Chapter 1: Introduction

In this current chapter, a brief discussion is provided which reveals the importance of

the research and the gap in existing literature. The discussion determines the focus and

locus of the research that leads to presentation of the research questions. The research

objectives elaborate the research questions concentrating on the very specific areas.

This chapter also presents the overall organization of the current thesis.

Chapter 2: Literature Review

This chapter discusses the fundamentals of sustainability, the supply chain, the

sustainable supply chain, the poultry supply chain process, the forward and reverse

poultry process, integrated process, poultry wastes reversal and various by-products

created from poultry wastes. The literature review attempts to relate the current study

to the relevant concepts of sustainability and the supply chain. At the same time, the

poultry supply chain is discussed in light of sustainability. Finally, the gaps, identified

13

from the literature review, ultimately guide this current study to enrich the present

context.

Chapter 3: Bangladesh Poultry Operation and Research Case Description

This chapter consists of an overview of the Bangladesh poultry operation and the

poultry case description. Initially, the chapter discusses the Bangladesh poultry

industry’s operations and includes details about its present status, scope, input–output

process, modern technology used in poultry farming, poultry production systems,

including poultry genetics, calamities and policy issues in poultry. The study attempts

to incorporate most of these issues in the model so that the model can be treated as

realistic within a virtual computer screen. The chapter later provides information

related to the case industry. The vision, mission, present status, farming process, scope

and market share of the research case are discussed in this chapter. Moreover, other

areas including farming under the effect of calamities and policy adaptation have been

incorporated in this chapter so that the reader will have a good understanding of the

case poultry farm and its operations.

Chapter 4: Research Methodology

This chapter presents the methodology supporting this study. The chapter mainly

focuses upon discussing and determining the appropriate research approach engaged

in carrying out this research. In addition, the research paradigm, research design,

research tool, research case, data collection, model construction, a way of quantifying

the simulation model, analyses of model output and limitations of the data collection

and methodology are also included in this chapter.

Chapter 5: Poultry Supply Chain Model: A System Dynamics Approach

This chapter discusses the process of designing a causal (qualitative) and stock and

flow (quantitative) poultry supply chain model under a simulation environment.

Initially, the causal model is developed based on observation, focus group discussion,

and in-depth interviews. The causal model is designed with all possible interrelated

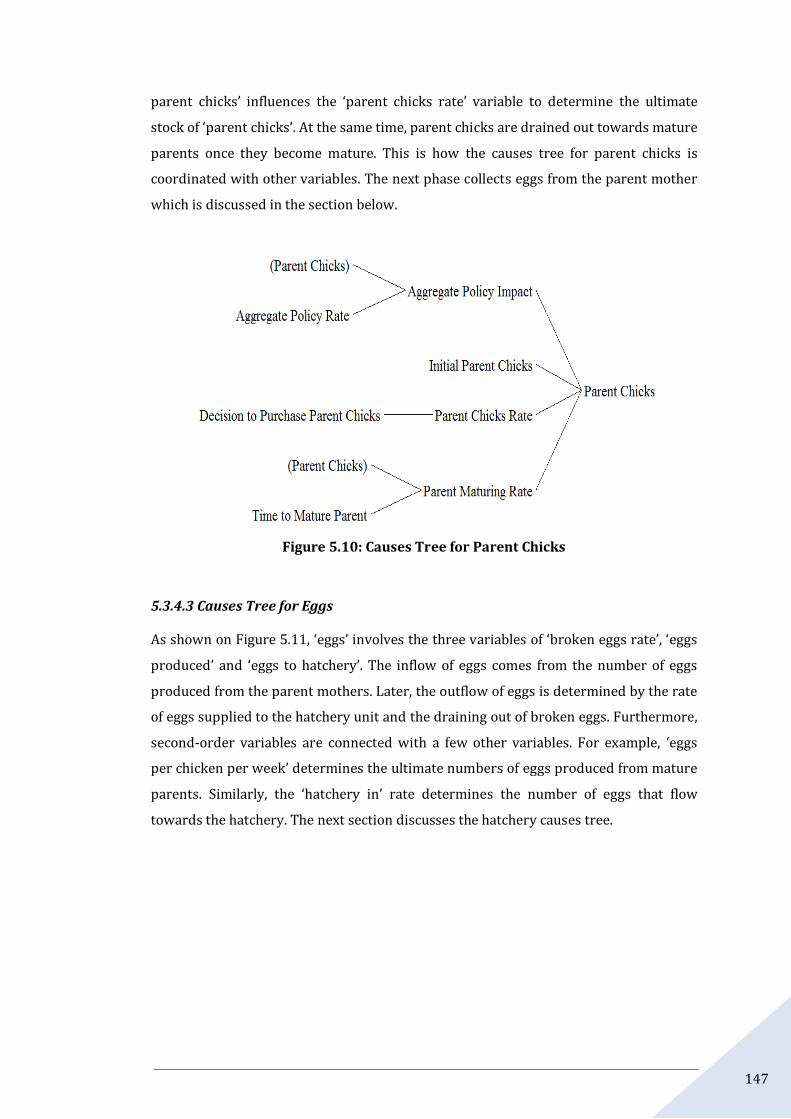
variables using loops. In addition, causes trees for important variables are also

discussed in these sections. The stock and flow diagram is later constructed based upon

a causal loop diagram by adding appropriate co-variables, data, equations and lookup

functions. By adding these variables with equations, the model anticipates working as if

it were a practical operation maintained in the case industry. In addition, the length of

14

the loops under a major loop is discussed to acknowledge the complexity of system

behaviour. Finally, the integrated stock and flow model is discussed in light of different

segments of the simulation model.

Chapter 6: Results of Simulation

This chapter discusses the simulation results for the forward, reverse and integrated

poultry supply chains. In the first section, the study discusses the forward supply chain

of the poultry industry in Bangladesh. Various rates, variables and equations are

described in this section to replicate the forward supply chain. Similarly, this chapter

discusses the reverse supply chain of the poultry industry in Bangladesh which is

mostly a concern with regard to poultry wastes. This reverse chain considers poultry

wastes that are generated in different stages of the poultry process. The model creates

a supply chain where all the wastes are collected for reusing or recycling making

further by-products to achieve more benefits, including environmental sustainability.

In addition, reverse supply chain rates, opportunities for by-product production and

sustainable benefits are also discussed. Finally, simulation results for the integrated

supply chain process are presented in order to understand its effectiveness.

Chapter 7: Discussion of Results

The results from the simulation analysis are discussed in this chapter. The implications

of the research findings are also discussed in this section to realize the practical

implementation. More specifically, this chapter presents discussion of the research

findings based on theoretical and practical perspectives. Various scenarios are also

created to make assurances about the findings of the integrated model.

Chapter 8: Conclusions and Future Research Directions

The final chapter presents the summary of the research and its significant

contributions to theory and practice. This chapter acknowledges the limitations of the

current research and hence proposes recommendations for future research outlining

the possible directions.

15

1.9 SUMMARY

This chapter provided the background of the current research and established the

scope of the current research thesis. It provided an overview of the existing literature

gap and outlined how the gap has been addressed through this research. It discussed

briefly the existing research in the supply chain and sustainability areas along with the

poultry livestock sub-sector. Moreover, the possible research structure using

sustainability and supply chain concepts with the help of a system dynamics (SD)

research process were also addressed in the above discussion. Furthermore, the

research objectives, research questions and key definitions were mentioned in order to

understand the direction of the current research. This chapter then presented a brief

outline of the organization of this research thesis. To reveal the literature gap, the

following chapter discusses relevant research studies.

16

CHAPTER 2:

LITERATURE REVIEW1

2.1 INTRODUCTION

This chapter presents the literature review relevant to the current study. The literature

review is focused on several aspects explaining sustainability, supply chain models, the

sustainable supply chain, the sustainable supply chain in the poultry industry and the

status of the Bangladesh poultry industry in light of achieving sustainability. Relevant

sections highlight the literature gap while presenting the literature review. This

chapter finds that there is only a little evidence of research conducted on the existing

poultry process model based on system dynamics and simulation. Such studies have

not considered the integrated poultry operation for achieving sustainable production.

This chapter also finds the research gap in integrating forward and reverse supply

chain as a whole and poultry supply chain integration in particular. The rationale of the

study emerges from the existing literature helping the reader to understand why it is

important for this particular context. Relevant concepts and contexts are discussed

throughout this chapter to understand the facts that can be deployed in the current

study to fill the research gap. Again, the theoretical basis helps to understand the

various concepts that may follow in the relevant practice. Accordingly, the research

develops a conceptual framework which helps to construct a poultry process model

based on the above concepts and the literature gap for this research context. The

1 Parts of this chapter have been published in the following publications:

a. Shamsuddoha, Mohammad. 2010. "A Sustainable Supply Chain Process Model for Bangladeshi Poultry Industry." In Curtin Business School (CBS) HDR Colloquium 2010 Perth, Australia, edited by Joanne Boycott, 1-7. Curtin University: Curtin Business School.

b. ———. 2011a. "Applying Reverse Supply Chain in the Poultry Industry" Emerging Research Initiatives and Developments in Business: CGSB Research Forum 2011, 71-79, Perth, Australia: Curtin University.

c. ———. 2013a. "Livestock Wastes Reuse: A System Dynamic Approach " In Curtin Business School (CBS) HDR Colloquium 2013, Bentley, Perth, Western Australia, edited by Fay Rola-Rubzen and Jenny Goodison, 17-24. WA, Australia: Curtin Business School, Curtin University.

d. ———. 2011b. "A Simulation Supply Chain Model for a Sustainable and Environment Friendly Poultry Industry: Insights from Bangladesh." In Australian and New Zealand Academy of Management (ANZAM), Wellington, New Zealand, edited by Kevin Voges and Bob Cavana, 1-12. New Zealand

e. Shamsuddoha, Mohammad, Mohammed Quaddus, and Desmond Klass. 2011a. "Incorporating Reverse Supply Chain in the Poultry Process of Bangladesh " In Australian New Zealand Marketing Academy Conference 2011, Perth, Western Australia, 73-81. ANZMAC.

f. ———. 2013a. "Poultry Supply Chain: A System Approach" 31st International Conference of the System Dynamics Society, 117-125, Cambridge, Massachusetts USA: System Dynamics Society.

g. ———. 2013c. "Sustainable Poultry Production Process to Mitigate Socio-Economic Challenge." Humanomics. (accepted)

h. ———. 2013d. "A System Dynamics Approach for Poultry Operation to Achieve Additional Benefits" Winter Simulation Conference 2013, 35-43, Washington, DC, USA: http://www.wintersim.org/

17

following section addresses the sustainability issues which can be adopted with the

supply chain for better output.

2.2 SUSTAINABILITY

No matter what the operation, almost every industry, institution, country and

organization is pursuing the achievement of sustainability. The literature on

sustainability is discussed in the following section.

2.2.1 Sustainability: A Brief Review of the Literature

The most popular and cited definition of sustainability is derived from the “Brundtland

Report” of the World Commission on Environment and Development (WCED 1987, 1),

in which sustainable development means “meeting the needs at the present without

compromising the ability of future generations to meet their own needs.” With

reference to the United States (US) Environmental Protection Agency, sustainability is

denoted as reservation or recovery of social conditions and ecological capabilities

(Sikdar 2003b; Elkington 1994; Jennings and Zandbergen 1995). The reasons behind

the growing interest in sustainability are limited resources (Davis 1990; Wakeford

2012; Daily and Ehrlich 1992); over-population (Davis 1990; Daily and Ehrlich 1992);

poverty condition (Rhyne 1998); chaotic industrialization (Barrera-Roldán and

Saldıvar-Valdés 2002); dwindling living standards (Munro and Holdgate 1991);

polluted natural resources (Tilman et al. 2002); global climate change (Belisle 2011);

escalation in the consumption of non-renewable resources (Goodland and Daly 1996);

and troubled biodiversity and ecosystems (Tilman, Wedin, and Knops 1996). Such

issues are creating problems in achieving optimum growth that are hindering

companies’ profitability.

As a result, an understanding of the following issues has become a priority for academic

scholars in solving these problems: the ecological influence of economic activity (Erlich

and Erlich 1991); ensuring food security (Lal et al. 2002); meeting fundamental human

needs (Savitz and Weber 2006); and the safeguarding of non-renewable resources

(Whiteman and Cooper 2000). Again, Diesendorf (2000) includes the three principles

of environmental protection, economic growth and societal equity within sustainability.

These are sometimes referred to as the “triple bottom line: social, economic and

environmental or people, profit, and planet” (Elkington 2004a; Norman and MacDonald

18

2004; Peacocka and Shermanb 2010; Elkington 1994). Furthermore, Shrivastava

(1995) perceived sustainability as the potential for reducing long-term risks associated

with resource depletion, pollution and waste management. Management, supply chain,

production process, operations and engineering domains are considered in applying

sustainability theory for improved productivity (Bakshi and Fiksel 2003). Yet, in the

management literature, sustainability focuses on the natural environment, with implied

appreciation of economic and social responsibilities (Starik and Rands 1995; Jennings

and Zandbergen 1995). The operation management literature has, likewise, considered

sustainability from three perspectives of ecology, society and economy (Sarkis 2001;

Hill 2001; Daily and Huang 2001). In the macroeconomic viewpoint of sustainability,

this research has also taken short- and long-term viewpoints in defining and

incorporating sustainability within the current production process (Starik and Rands

1995). Remarkably, sustainability in the engineering field clearly combines three

dimensions of organizational sustainability defining it as “a wise balance between

economic development, environmental stewardship, and social equity” (Sikdar 2003b;

Go´ncz et al. 2007).

In contrast, Shrivastava (1995) described sustainability as proposing the possible risk

reduction of resource depletion, variations in energy costs, product accountabilities,

wastes contamination and management (Syahruddin 2013). Overall, sustainability is

widely known as three-factor success as discussed in the above sections. This three-

factor success is also known as triple bottom line (TBL) success. To attain the same in

the poultry industry in Bangladesh, the industry needs to incorporate triple bottom line

concepts in their existing production system (Dolberg 2004; Ward 2002; Akter and

Farrington 2007, 2008, 2009). To explore these three factors, the following section

discusses sustainability and the details of its components to understand the relevant

indicators.

2.2.2 Triple Bottom Line Sustainability

Interrelated measurements of profits, people and the planet (triple bottom line/3BL)

are the important instrument to support and achieve sustainability aims for livestock

business (Bader 2008; Heijungs, Huppes, and Guinée 2010). During the mid-1990s,

Elkington (1994) attempted to design a framework for sustainability to measure

performances at the corporate level. Later, this framework would be called the triple

bottom line (TBL) dealing with economic benefits (profits), investment return and

19

providing value for shareholders to comprise environmental and social measurements

(Elkington 1998, 1994). However, Savitz and Weber (2006) expressed the opinion that

sustainability was an essential code for smart management. Since then, industries have

become determined to implement sustainable concepts for the sake of better outputs at

various levels. Thus, sustainable performance depends on the three above-mentioned

components of economic, society and environment, which are depicted in Figure 2.1

(Elkington 2004b, 1998).

Figure 2.1: Sustainability: The Triple Bottom Line (Carter and Rogers 2008)

Conversely, triple bottom line (TBL) sustainability comprises risk management,

transparency, strategy and culture (Hacking and Guthrie 2008; Savitz and Weber 2006;

Henriques and Richardson 2004). After that, the effectiveness of applying the triple

bottom line to achieve sustainability was examined in the previous literature (Gladwin,

Kennelly, and Krause 1995; Hart 1995; Elkington 1998; Henriques and Richardson

2004; Jennings and Zandbergen 1995; Sarkis 2001; Savitz and Weber 2006; Shrivastava

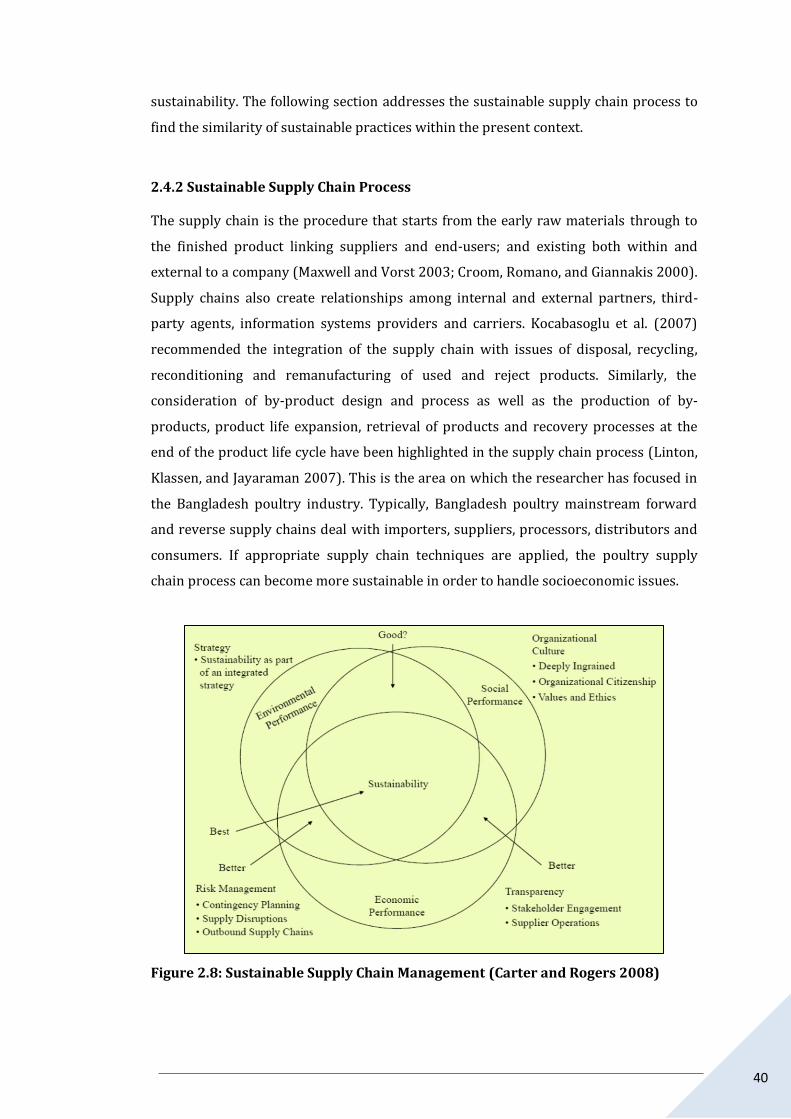
1995; Starik and Rands 1995). As shown on Figure 2.1, Carter and Rogers (2008)

argued that any two out of three components can also be treated as ‘bearable’ (social

and environmental), ‘equitable’ (social and economic) and ‘viable’ (economic and

social). Success in all three factors is called sustainable as discussed above. Hence, the

poultry industry in Bangladesh needs to be studied in light of triple bottom line

sustainability so that the industry can be managed efficiently to serve the country’s

people. The economic, social and environmental sustainability matters are discussed in

the following sections.

20

2.2.2.1 Sustainability and Economic Benefits

Sustainable economic performance refers to elements such as employment, profit,

value addition and sales which are also the main elements of small business

(Venkataraman 2002). Some scholars have argued that employment frequency

(turnover) is also logically linked with economic performance. To support this

viewpoint, Bjerke (2007) found substantial links between sales, revenues and

employment. In addition, many scholars have used profit as an indicator of economic

success (Chen et al. 2007; Honig 1998; Davis et al. 2010; Kreiser and Davis 2010). In

fact, profit is a fresh blood flow into a business which is necessary to extend and

continue the current business. At the same time, the cost of goods sold is a vital

component for economic performance which measures ultimate profitability (Zainol

and Wan Daud 2011; Laforet 2011; Shrader and Siegel 2007). According to the Global

Reporting Initiative (GRI) (GRI 2009), Dow Jones (Knoepfel 2001) and the Institution of

Chemical Engineers (IChemE) (Sikdar 2003a) present a number of economic indicators

is shown in Table 2.1 which are found to be relevant to the Bangladesh poultry

industry. Hence, financial profitability, value addition, sales and cost of goods are the

main performance indicators to measure economic factors in achieving economic

sustainability.

Table 2.1: Economic Activities Related to the Study

Indicators: Economic Factors GRI IChemE Dow

Jones

Others

Financial Profitability (Dees 1998) Y Y N Y

Value Addition (Ahmad and Seymour 2008;

Acs and Armington 2004; Cobb et al. 2009) Y Y N Y

Sales and Cost of Goods (Cobb et al. 2009;

GRI 2009) N Y N Y

Again, the economic issue is the priority for every business, including its own

stakeholders’ financial performances. The poultry business is no exception to this. The

agro-based supply chain targets are a suitable location, supply–demand harmonization

and, ultimately, curtailing waste and improving productivity at every stage of a product

life cycle are the priorities (Sharma and Patil 2011). Practically, the yields are

uncertain, and the available raw material quantities cannot be judged as required with

on-time delivery of the final meat products (Mont, Dalhammar, and Jacobsson 2006).

21

Complaints are directed at the middlemen and retailers who take major shares from

the profit or costs as they have been accustomed to playing a powerful role among the

stakeholders (Hovelaque, Duvaleix-Tréguer, and Cordier 2009). In fact, middlemen

have some limitations relating to cost and to providing the product to their clients. To

address this, the sustainable development initiative has evolved for some time to

support companies to develop more sustainable products (Maxwell and Vorst 2003).

Quality, market stability, technical matters and cost issues are the main considerations

for economic sustainability (Maxwell and Vorst 2003).

2.2.2.2 Sustainability and Social Benefits

For social wellbeing, sustainability considers security, a modest lifestyle, comfort and

health by maintaining eco-friendly goods and services (McMichael, Butler, and Folke

2003). These can be achieved through employment generation, poverty reduction,

entrepreneurship development, facilities for young entrepreneurs, and providing social

care (Reynolds et al. 2001; Yunus 2007; Åstebro and Thompson 2011; Dyer and Chu

2003). Ultimately, social benefits reduce the rich–poor divide for that particular society

(Butler 2000; McMichael, Butler, and Folke 2003). According to the GRI, Dow Jones and

IChemE, a number of social indicators are similar to the current study context. Table

2.2 lists employment creation, poverty reduction, young entrepreneur creation, new

venture creation and ensuring social welfare as relevant indicators for social

sustainability. The current study has examined how social benefits can be achieved

through poultry operations.

2.2.2.3 Sustainability and Environmental Benefits

Currently, profitability, productivity and the environment are receiving more and more

focus from manufacturing organizations (Sarkis 2001). Among them, the environment

is the burning issue for societies such as Bangladesh. Similarly, it has attracted

appropriate attention from academics and practitioners since the 1990s, which shifted

classical thoughts from the profit-making goal (Boyazoglu 2002). Obviously, everyone

attempts to gain maximum benefits which is also expected of most businesses. It is

argued that environmental management can be done for ‘not for profit’, which will

convince and motivate the customer to buy the products from such an eco-friendly

operation. Moreover, strong awareness is demonstrated by environmentalist groups to

maintain standards for eco-friendly procedures in a production and supply operation.

22

For example, 90% of US manufacturers have existing environmental strategies and

80% trust their environmentally friendly operations (Boyazoglu 2002; Arbab, Criss,

and Miller 1998).

Table 2.2: Social Activities in Poultry Farming

Indicators: Social Factors GRI IChemE

Dow

Jones Others

Employment Creation (Reynolds et al. 2001; GRI

2009; Cobb et al. 2009; Knoepfel 2001) Y Y Y Y

Poverty Reduction (Yunus 2007; Krantz 2001;

Coulthard, Johnson, and McGregor 2011; Rhyne

1998)

Y Y Y Y

Create Self-employed Young Entrepreneurs

(Wagner 2003; Freytag and Thurik 2010; Lazear

2003; Åstebro and Thompson 2011; Lynch 2004;

GRI 2009; Cobb et al. 2009; Knoepfel 2001)

Y Y N Y

Creating New Ventures and Family Business

Creation (Stock and Watson 2003; Dyer and Chu

2003; Heck and Stafford 2001)

Y Y Y Y

Social Welfare and Care (Seelos and Mair 2005a;

Hall, Daneke, and Lenox 2010; Sundin 2011) Y Y N Y

Environmental sustainability is also improving our lifestyle and reducing threats to

human health, genetic diversity, and habitat alteration associated with modern

agriculture (Robert 1997). These days, scientific production faces the challenge of

developing a new paradigm which embodies the concept of sustainability (Sands and

Podmorea 2000). However, farming needs to take appropriate measures in its

surrounding environment to achieve environmentally sustainable production (McRae,

Smith, and Gregorich 2000). Simultaneously, environmentally sustainable farming not

only improves ecological balance but also protects wildlife habitat, and increases the

visual beauty of farmland, efficient nutrient cycling and the optimum storage and

filtering of water (McRae, Smith, and Gregorich 2000). Theoretically, scholars have

proposed frameworks for evaluating sustainability using various scales (Liverman et al.

1988; Lal 1991; Senanayake and Sustain 1991; Stockle, Martin, and Campbell 1994).

Therefore, a combination of various efforts will help to achieve environmental

sustainability.

23

Arguably, the most serious environmental costs from livestock farming are perhaps

experienced from dumping wastes in the natural environment of vacant land, river

water and cropland. For livestock welfare, sustainable production needs to be ensured

through an appropriate triple bottom line framework (Ostrom 2002; McMichael, Butler,

and Folke 2003). Currently, the poultry industry is facing environmental challenges

relating to air (odour) (Colletti et al. 2006) and water quality. This degraded air and

water quality hampers the poultry industry in terms of spreading disease and

maintaining optimum health. Kliebenstein (1998) has suggested that agricultural

industries can escape from such disaster through their collective efforts in improving

the positive environmental impact of process technologies. To protect from the above

disaster, industry needs to follow standard indicators to improve the situation for the

present and future. With reference to the GRI, Dow Jones and IChemE, a number of

economic indicators match the current study. Table 2.3 lists waste recycling, waste

reuse, reducing environmental degradation, biofuel and environmental certification

which can help a farm to achieve environmental sustainability.

Table 2.3: Environmental Activities in Poultry Farming

Indicators: Environmental Factors GRI IChemE Dow

Jones

Others

Waste Recycling or Reuse (Sikdar 2007; Gertsakis

and Lewis 2003; Tipnis 1993; Edwards and Daniel

1992)

N N N Y

Reducing Environmental Degradation (Dean and

McMullen 2007) Y Y N Y

Biofuel (Biogas) (Hill et al. 2006) N N N Y

Environmental Certification (GRI 2009) Y N N Y

Alternatively, the widespread and renowned concept of "3R" denoting to reduce,

reuse and recycle is predominantly based on production and consumption (Kalk 2012;

Srinivas 2007). Policy makers and industrial personnel are trying hard to adjust to such

concepts if an enormous amount of waste comes from their industry. Policy makers are

increasing their attention towards possible recycling and possible reuse of raw

materials and industrial/manufacturing wastes, and overall reduction in resources

(Srinivas 2007). Again, reflection on the adoption of the 3R concept is influencing

product life cycles, and raw materials use, manufacture, reuse and disposal (Srinivas

2007). Consciousness is growing day by day to implement the reduce, reuse and recycle

24

(3R) concept everywhere in our everyday life to achieve a sustainable environment

(Bushnell et al. 2011; Alahari, Kohli, and Torr 2008). This research context is similar to

the 3R concept in seeking to recycle, reduce and reuse poultry wastes for the sake of

making valuable by-products for further daily usage.

2.2.3 Findings and Gaps

The above discussion on sustainability has revealed the definition of sustainability and

the importance of its implementation in an operation to ensure maximum benefits.

Moreover, three components of sustainability have also been discussed. Unfortunately,

sustainability continues to be challenging at the corporate level in terms of applying the

relevant theory to their operation when diverse stakeholders are involved (Carter and

Rogers 2008). They are even struggling to identify the exact extent of present demand

and future needs in order to assess resource and technology requirements, and to

coordinate accountabilities with the different stakeholders in the supply chain (Hart

1995; Barnett 2007; Peredo and Chrisman 2006). Carter and Rogers (2008) also found

that the Brundtland Report’s definition on sustainability is far-reaching in seeking to

achieve goals for the current and future, and that it is hard to assess the appropriate

roles of supply chain members (Shrivastava 1995). For better growth and profitability,

industry needs to make the effort to implement sustainability concepts in their

business operation. Without such effort, companies may fail to maintain the pace of

sustainable growth and profitability to run their business in the long run. Conversely,

the poultry industry in Bangladesh is seen to be struggling to implement the

sustainability concept in its operation. In fact, the industry does not have sufficient idea

about how sustainability would work with the existing operation. In addition, the

Bangladesh poultry industry is currently fast reaching actual demand for chicken and

chicken products. Farmers do not like spending additional money to achieve

sustainability whereas, they could achieve more benefits if they implemented the

sustainability concept. Such failure to adopt sustainability is caused by an

inappropriate poultry process network, lack of coordination among stakeholders and

failure to maximize resource usage. Thus, the current research has found it necessary

to implement such a valuable concept in the poultry operation for the sake of economic,

social and environmental sustainability. In addition, this study is also focused on such a

gap to ensure a sustainable poultry process for maximum benefits. The next section

addresses supply chain theory and the model to distinguish the forward and reverse

processes.

25

2.3 REVIEW OF SUPPLY CHAIN THEORY AND MODELS

The supply chain has been a widespread concept for business and academia for the last

three decades. A number of definitions and explanations of the supply chain concept

are available in various scholars’ writings. The supply chain is the process that starts

from managing raw materials through to the final consumer associating with the

relevant supplier, retailers, other parties that provide services to the customer (Cox,

Blackstone, and Spencer 1995) and different points of consumption (Svensson 2007).

Fundamentally, the supply chain is a combination of various parties and processes

including production, and backward and forward processes within a firm. Once again,

the supply chain includes every step towards producing and distributing the ultimate

product, on or after the supplier’s supplier to the customer’s customer (Cooper,

Lambert, and Pagh 1997; Council 1999; Ellram and Cooper 1993; Lummus and Vokurka

1999; Lummus and Alber 1997). In addition, the supply chain follows the process of

proper planning, sourcing, manufacture and delivery which manages the supply–

demand situation, raw materials sourcing, the manufacturing system, warehousing and

inventory, order management and distribution heading to consumers (Quinn 1997;

Lummus and Vokurka 1999; Cooper, Lambert, and Pagh 1997).

Moreover, Mentzer, et. al. (2002) highlighted the supply chain as a conventional

business component for systemic, strategic and tactics coordination with other

functions. Supply chain management manages and incorporates all of these activities

into a unified process (Tan 2002; Ponomarov and Holcomb 2009). Again, it links within

one chain all related stakeholders, including suppliers, carriers, third-party companies,

and information systems providers (Carbone and Martino 2003). The supply chain

therefore deals with the total process starting from production and ending with

consumption. However, dynamic supply chain processes extend beyond the

consumption level adding processes such as reverse logistics. The next section

discusses managing the supply chain within a process.

2.3.1 Managing an Efficient Supply Chain

Supply chain management (SCM) has received attention since the 1990s, even though

the method was introduced in the early 1980s (Oliver and Webber 1982; Svensson

2007). Typically, in SCM, the beginning point is with the suppliers or producers (Carter,

Ferrin, and Carter 1995; Ellram and Cooper 1993; Lambert and Cooper 2000; Novack

26

and Simco 1991) while consumption denotes consumers, customers or end-users in a

supply chain (Min and Mentzer 2000; Lambert, Cooper, and Pagh 1998; Jones and Riley

1985; Svensson 2007). The term ‘supply chain management’ has a direct relationship

with ‘supply chain’. The first literature found on logistics was in the 1980s, as an

inventory management tactic with emphasis on the supply of raw material supplies. In

the managerial literature, including within the agro sector, SCM links the purchasing

function with the corporate planning process as an integral part (Vorst, Silva, and

Trienekens 2007; New and Payne 1995; Scott and Westbrook 1991). In the early 1990s,

academics used a theoretical stance to explain SCM clarifying how it is identical to

traditional supply chain approaches of flowing materials and information (Christopher

1998). Yet again, Tan (2001) and Croom (2000) stated that SCM is a broader strategic

approach to materials and distribution management. They also discussed it from

various perspectives of purchasing and supply, logistics and transportation, industrial

organization, marketing and strategic management. The above matters need to be

considered to manage an efficient supply chain in a production process. Such

discussions lead to later implementation to efficiently manage supply chain practices.

The following section reviews a few supply chain models along with forward and

reverse supply chains.

2.3.2 Review of Supply Chain Models

A number of supply chain models have been discussed in the existing literature. The

most common and simplified supply chain model starts with product conception and

ends with consumption. Figure 2.2 presents a simple supply chain starting with

product conception, then raw material collection through to the end of life of a product.

Maxwell and van der Vorst (2003) highlighted a simple supply chain model, in which

product conception is the starting point of a supply chain network. Later, product

conception is followed by raw material collection, a smooth production process, well-

managed distribution, consumption and end-of-life procurement. It has been assumed

that the model is too simple to implement as the reality is different. In support,

Lambert et al. (1998) and Stevenson and Spring (2007) found that managing the entire

supply chain is a difficult and challenging task for the concerned industry. Is this

because different supply chain members have identical roles to play which are not

similar to each other’s responsibilities? Only proper coordination among the supply

chain members can solve the problems.

27

In another example, New and Payne (1995) depicted a supply chain network

(Figure 2.3) which started from collecting raw materials from the earth followed by

converting processed materials; physical distribution; the ultimate manufacturers,

traders, retailers and consumers; and recycling products by reversing used materials.

In a competitive market, manufacturers continuously update their product offers in

order to better satisfy customers’ requirements with the purpose being that goods are

distributed at the targeted cost, time and quality (Pero et al. 2010). The latter model

(Figure 2.3) is little different from the model above (Figure 2.2) as it has given

emphasis to physical distribution, warehousing and recycling wastes. At the same time,

it is assumed that smooth and efficient physical distribution and warehousing facilities

are the key to reaching customers in the quickest way. Moreover, care should be taken

with recycling opportunities when these appear as necessity in terms of profitability,

protecting the surrounding environment, implementing regulations and customer

expectations.

Figure 2.2: Simplified Supply Chain (Maxwell and Vorst 2003)

Figure 2.3: Normal Supply Chain with Recycling (New and Payne 1995)

28

Furthermore, Tsoulfas and Pappis (2006) designed another supply chain model with

proper disposal of wastes and recycling, which is depicted in Figure 2.4. In this

particular model, raw material suppliers, production process, distribution, wholesaling,

retailing followed by end-of-life activities, disposal, recycling, etc. are involved in a

supply chain to maintain a standard operation. It is observed from this model that

communication with suppliers and selection of materials and processes are vital in an

effective supply chain. This model also deals with end-of-life products. It emphasises

that proper disposal, recycling, disassembly, refurbishment, repair and direct reuse can

add more value to the industry to maximize its profits. Such practices not only maintain

better quality products and services but also ensure better environmental and societal

sustainability. The concept of this model is used in this current study to build a poultry

process model with the above-mentioned facilities to ensure a structured production

process.

Even continuously changing products often cannot satisfy customers who instead

demand a new product line with assorted products (Hoek and Chapman 2007, 2006).

For these frequent changes, SCM needs to be involved with product design, organizing

and executing all the activities from planning to distribution along the entire value

chain, including the network of suppliers, manufacturers and distributors

(Childerhouse, Aitken, and Towill 2002; Vonderembse et al. 2006). The poultry

industry can include new lines of products such as different breeds with production

capabilities, longer life cycles, etc. The next section addresses the forward supply chain

aspect.

2.3.3 Forward Supply Chain (FSC)

The normal supply chain process concept is similarly applied to define the forward

supply chain process that starts and ends with raw materials and customers,

respectively (Cox, Blackstone, and Spencer 1995; Rogers et al. 2002; Poirier and Reiter

1996; Bowersox 2011). It also links the internal and external partners of suppliers,

carriers, investors, policy makers and intermediaries. Briefly, the forward supply chain

(FSC) is the step-by-step process of converting raw materials to finished goods

(Kocabasoglu, Prahinski, and Klassen 2007). In the same way, the poultry forward

supply chain starts with collecting the parent stock breed followed by collecting

hatchable eggs from the parent breeder, hatching the eggs in the hatchery, distributing

29

the chicks to farmers through middlemen, rearing them for a certain time by farmers

and selling meat and eggs to the ultimate customers. The steadier this supply flow, the

more benefits occur in relation to achieving sustainability.

Communication With Suppliers

Extraction of Virgin Materials

Distribution

Suppliers

Retailers/Customers

Selection of Materials and

Process

Storage

Parts of Production

Assembly

Storage

Distribution

Proper Disposal

Recycling

Inspection

Disassembly

Refurbish

Repair

Direct Reuse

Retailers Customers UseEnd-of-life Products

Company

Figure 2.4: Materials Flow (Tsoulfas and Pappis 2006)

Recently, businesses have shifted towards creating a market rather than waiting to

receive demand from customers. Most businesses need a good supply chain network so

they can simultaneously serve their own company’s purpose and customer needs. To

reach the customer quickly, the company needs to have an effective and efficient supply

chain. Structured supply chains not only help to reach customers but also to receive

prompt product return and deliveries from suppliers. The collective and supportive

relationships throughout the forward supply chain are needed to increase the degree of

integration, to receive maximum benefits, to create a strategic position and to secure

desired profits ahead of their competitors (Fuente, Ros, and Ortiz 2010). Nevertheless,

various authors such as Monczka and Morgan (1997), Lambert et al. (1998), Rushton,

Croucher and Baker (2010), Chandra and Kumar (2001), and Rudberg and Olhager

(Rudberg and Olhager) identified the following characteristics for forward supply chain

management:

30

Fragmented chain (each supply chain member is focused on its own fragmented

processes),

Integration of decisions and processes between suppliers and clients, and

Information systems connecting the different members of the chain.

The above characteristics can also be treated as limitations for the forward supply

chain (FSC) due to the defined features. Arguably, these characteristics can achieve

expertise for the individual parties of the FSC. Furthermore, the FSC is the main channel

through which a product travels from producers to consumers. In addition, the FSC

needs to adapt to continuous changes in the adjacent members’ circumstances. Larson

(2008) designed a framework (Figure 2.5) in which the FSC is linked with the reverse

supply chain, regulatory requirements and sustainability issues. At the same time,

Larson emphasised designing an environmentally friendly and stable product life cycle.

Therefore, the FSC is concerned with producing products from quality raw materials

and efficiently supplying them to customers with adequate feedback. The next section

discusses reverse logistics, and the reverse supply chain and its process.

Figure 2.5: FSC With Eco-friendly Process (Larson 2008)

31

2.3.4 Reverse Logistics (RL) and Reverse Supply Chain (RSC)

The current study proposed the use of reverse supply chain (RSC) concepts for poultry

waste management. Poultry waste management endeavours to find a suitable way to

recover value from unused wastes to assure additional benefits. The following sections

discuss reverse logistics, the reverse supply chain, managing the reverse supply chain,

reverse processes and components, and the relationship between the reverse supply

chain and the environment.

2.3.4.1 Reverse Logistics (RL)

Reverse logistics (RL) is “the process of planning, implementing, and controlling the

efficient, cost effective flow of raw materials, in-process inventory, finished goods and

related information from the point of consumption at the point of origin in the purpose

of recapturing value or proper disposal” (Hawks 2006). It is now believed that RL as a

field is “unique enough to undergo specialized research” (Tibben-Lembke and Rogers

2002). This particular area has started contributing to the economy more substantially

than expected. Reverse flow is increasing day by day and covers a wide range of

industries (Li and Olorunniwo 2008) due to growing consensus and pressure from

environmental activists (Dekker et al. 2004). For example, the RL market in the United

States (USA) was worth approximately US$58 billion in 2004, comprising 10.7% of the

US economy (RLEC 2007).

In further examples, car manufacturing companies are using auto parts from recalled

and end-of-life cars, electronics companies (e.g. Apple, Dell and Sony) collect lead and

mercury from scrapped and reject products (Li and Olorunniwo 2008; Williams et al.

2008). On the other hand, retailers are unhappy with a higher rate of returns of

between 5% to 50% from customers (Rogers and Tibben-Lembke 1999). Sometimes,

return policy increases the costing averaging twice to thrice the value of the product

due to liberal return policies for intense competition (Guide and Van Wassenhove

2003; Biederman 2006; Rogers et al. 2002; Rogers and Tibben-Lembke 1999). To

prevent this, companies need to have a good policy which will protect them from

economic losses (Dekker et al. 2004). Modern companies need to undertake vigorous

study to learn how to design the reverse supply chain as a profitable network

(Biederman 2006; Guide and Van Wassenhove 2003; Richey 2005)

32

Furthermore, environmental benefits can be achieved along with business profit when

firms consider recycling and recovery of valuable resources from products at the end of

the product life cycle or used products (Giudini 1996; Fleischmann et al. 1997). In

particular, recovery of products aims to improve the exploitation of used products, or

their parts, through recycling and remanufacturing (Ayres 1995). The new activities of

recycling or improving used products can create new products with a different market

niche reducing environmental degradation (Lee, O’Callaghan, and Alien 1995; Daniel,

Pappis, and Voutsinas 2003). Then again, industry needs to consider creating market

demand while measuring price-sensitiveness for durable end-of-life products that have

been further processed for recovery (Karakayali, Emir-Farinas, and Akcali 2007).

Ultimately, the recovery process can be done through a different channel: it may create

a new product line for a segment of existing customers as well as new customers

earning additional profitability and achieving environmental sustainability. The next

section discusses how to practise the reverse supply chain operationally.

2.3.4.2 Practising Reverse Supply Chain

It is regulatory in some regions (countries) that the surrounding environment cannot

be damaged by production processes producing finished products or parts of products

(Hart 2008). Environment preservation and its related rules and regulations with

return policies are being adopted throughout the world (Toffel 2003). For example, the

automotive industry in Japan, Taiwan and the European Union has endorsed relevant

regulation on the collection and re-processing of after-life vehicles (Lee and Tang

1997b; Johnson and Wang 2002; RecyclingTodayOnline 2004; Hart 2008). Owing to

increasing popularity of reverse production and networks, academic studies on product

recovery have grown significantly. A few studies have also been conducted on network

design, organization of channel operations and reverse logistics (Dekker et al. 2004;

Dyckhoff 2004).

In practice, the European Union (EU) and the USA are leading in environmental

legislation which is related to societal concern about the environment (Dennis and

Kambil 2003). Their legislation is includes a mix of waste prevention, material

recycling, energy recovery, and disposal options (Dennis and Kambil 2003). The

recovery of end-of-life products is starting to be perceived as a business opportunity

providing several benefits (Guide and Van Wassenhove 2006). Therefore, designing an

effective reverse supply chain along with the existing forward supply chain is required

33

to manage after-use of products and wastes (Fleischmann et al. 2001). The above-

mentioned literature presents ways in which to introduce and design reverse supply

chain practices along with existing forward chains to maximize the facilities. The next

section discusses how to manage the reverse supply chain in a complex operation.

2.3.4.3 Managing Reverse Supply Chain

Reverse supply chain management (RSCM) is defined as “the effective and efficient

management of the series of activities required to retrieve a product from a customer

in order to either dispose of it or recover value” (Prahinski and Kocabasoglu 2006b;

Defee, Esper, and Mollenkopf 2009). In addition, Fleischmann et al. (2000) emphasised

RSCM for leftover products (used or wastes) and extended it to include manufacturer

responsibilities (Erol et al. 2010; Prahinski and Kocabasoglu 2006b). For instance, a

study was conducted on automotive, electronics and other industries in Turkey to

reveal the RSCM operational infrastructure and found many inconsistencies as none

revealed systematic RSC practices (Murphy and Poist 2003; Sahay, Gupta, and Mohan

2006; Lee 2008; Zhu, Sarkis, and Lai 2007; Zhu and Sarkis 2006). The same study

attempted to explore the motivation behind implementing RSC in an industry

operation. In contrast, a number of studies explored the difficulties in implementing

reverse supply chain strategies due to economic and other concerns (Rogers and

Tibben-Lembke 2001; Fawcett, Magnan, and McCarter 2008; Wycherley 1999). They

also argued in favour of keeping multiple sources of reverse facilities rather than

attempting from maiden sources, a strategy which may not be profitable.

The initiative and motivation for RSCM and RSC practices vary depending on individual

industry’s motives, enforcement, practices, skills, etc. (Connelly and Limpaphayom

2007; Zhu, Sarkis, and Lai 2007). Zhu and Sarkis (2006) also investigated various

Chinese companies’ differing motives and practices in a green supply chain to explore

vertical to virtual integration of reverse logistics with the mainstream channel. It was

found that vertical integration requires substantial financial investment, which is also

complex in nature. The outsourcing issue has been involved in a few studies regarding

successfully maintaining the reverse process through third parties (Göl and Çatay

2007; McIvor 2000). Factors relating to outsourcing to third parties to maintain reverse

supply chain operations were also discussed (Meade 2002). Companies either need to

maintain a strong supply chain network to manage RSC activities or can hand over such

34

responsibilities to a third party company. The next section presents the RSC process in

order to understand how to implement RSC practice in an operation.

2.3.4.4 Reverse Supply Chain Process

Studies conducted on supply chain management (SCM) have identified greater

concentration on the forward chain rather than the reverse flow (Prahinski and

Kocabasoglu 2006b). Used products and waste material flow from the ultimate

customers to reverse processors has received much less consideration by academics

and industry policy makers (Rogers and Tibben-Lembke 2001; Stock, Speh, and Shear

2002). According to Guide and Van Wassenhove (2002), a reverse supply chain (RSC)

process requires the retrieval of a used or unused product from a customer and either

disposing, reusing or reselling it. Reverse processes also include aspects such as a

prompt product return policy (Daugherty, Autry, and Ellinger 2001); information

support (Daugherty, Myers, and Richey 2002); supplier performance (Daugherty et al.

2005); innovation (Richey, Genchev, and Daugherty 2005); dynamic reverse logistics

process (Starkowsky, Spicer, and Riddell 2009); and proper recycling (Ritchie et al.

2000).

Figure 2.6 presents a reverse process pyramid where recovery is not the consideration

but the collection process, direct recovery, reuse, remanufacturing, recycling and

incineration also need to be considered (Starkowsky, Spicer, and Riddell 2009; Brito

and Dekker 2004). Figure 2.6 presents the flow opposite to that shown in Figure 2.7.

Nevertheless, both models use reverse processes for various products and wastes to

recover value from them. The ultimate destination for the RSC process is to find a

market for recovered products. Without a suitable market for by-products, it would be

challenging to sustain this process due to the costs involved. Many companies have

accepted these challenges through creating potential markets by using pricing

strategies. In the poultry context, it is possible to make valuable by-products from

unused products (eggs, feathers, intestines) and wastes (litter, feed). Such by-products

can be sold in different market segments to gain extra profit which also helps with

reinvestment in reverse management.

In support of the above statement, Figure 2.6 highlights the collection of used and

unused material for further value recovery with finding suitable markets to sell the

recovered products. Figure 2.7 is modelled based on used products returned by final

35

customers and finding appropriate ways to reuse them to partly recover value. For the

current study, it is important to use a similar reverse process in the poultry industry to

recover value. Prahinski and Kocabasoglu (2006b) mentioned several key steps for the

RSC process as discussed below:

Re-use, Re-sale, Re-distribution-------------------------------------------

RepairRefurbishing

RemanufacturingRetrievalRecycling

Incineration

Collection Inspection/Selecting/Storing Direct Recovery

Reprocessing

Market

Figure 2.6: Reverse Process (Brito and Dekker 2004)

a) Acquisition

The acquisition concept can be used in this study to utilize unused resources of

the poultry industry. Acquisition is a procedure by which a product is returned,

whether it is used, unused, defective, damaged or wastes (Rogers and Tibben-

Lembke 2001; Guide and Wassenhove 2001). The products for recovery

basically come from the forward supply chain but can maintain an alternative

reverse flow through junkmen, scavengers, dealers, brokers and non-OEM

(original equipment manufacturer) remanufacturing (Ginter and Starling

1978). Importantly, waste streams can either be used for landfill or diverted to

reuse to gain recoverable value (Wojanowski, Verter, and Boyaci 2007). The

acquisition concept can reuse poultry wastes to generate valuable by-products.

Obviously, valuable by-products will provide opportunities to achieve

economic, social and environmental sustainability.

b) Reverse logistics

As with acquisition, reverse logistics is the process of recovering appropriate

value from and disposal of products at the end of the product life cycle (Bayles

36

and Bhatia 2000). Activities include distribution, location (Fleischmann et al.

2001), storage and transportation of reusable items (Rosenau et al. 1996) and

minimizing the retrieval cost to gain financial benefits (Bloomberg, LeMay, and

Hanna 2002). This concept emphasises the distribution, storage and

transportation of reusable wastes. Such a concept can be used in the poultry

supply chain for waste management.

c) Inspection

The quality of recovered products should go through a standard inspection with

the objective being to gain customer acceptability (Carter and Ellram 1998;

Johnson 1998). Inspection is an important phase for waste management as

quality wastes produce quality by-products for further recovery. For example,

poultry litter needs to be examined (the ingredients checked) before making

plans for reprocessing.

Final User Market

Collector

Remanufacturer

Remanufactured Service parts Market

Part and/or Material Recycling Market

Used Product

Used Product

Part and/or ProductRemanufactured part

Figure 2.7: Supply Chain Process (Karakayali, Emir-Farinas, and Akcali 2007)

d) Reconditioning

Product improvement and recovery options are determined through the

disposition strategy and reconditioning process, such as refurbishing,

remanufacturing or recycling (Penev and RON 1996; Scheuring, Bras, and Lee

1994). Recycling is the key concept in this study, as it is more appropriate than

other concepts for waste management for the poultry industry.

37

2.3.4.5 Reverse Logistics Theory and Poultry Reverse Supply Chain

It can be argued that the reverse supply chain (RSC) and reverse logistics (RL) have

nothing to do with the poultry industry. Reviewing the above literature, reverse

logistics happen when used products and materials flow back to the producer or third

party for further processing. Poultry products are perishable and there is almost no

chance of the reversal of waste chicken meat other than for it to be appropriately

dumped. Even so, this research would like to argue that the poultry industry can

maintain reverse logistics. The logic behind this view is as follows.

Firstly, a number of studies have mentioned recycling, reusing and recovering value

from wastes is part of reverse supply chain (Alahari, Kohli, and Torr 2008; Gadde,

Rabinovich, and Chase 1997; King et al. 2006; Brodin and Anderson 1998; Field and

Sroufe 2007). In the poultry industry, wastes are recycled and reused to recover value

through making substantial by-products for further consumption.

Secondly, the reverse supply chain is also defined as the structured management of the

retrieval of used products or parts of products from customers for the sake of disposal

or value recovery (Prahinski and Kocabasoglu 2006b; Defee, Esper, and Mollenkopf

2009). In the poultry industry, chicken and eggs are the final products while intestines,

feathers, unhatched eggs and eggshells remain after products are consumed. Such

wastes help the industry to produce valuable by-products to recover value. Obviously,

this process follows reverse logistics theory, thus convincing this study to declare the

presence of reverse logistics in the poultry supply chain.

Thirdly, the reverse supply chain also emphasises agreements on excess products and

extended producer responsibilities in light of end-of-life and product-return

opportunities and laws (Erol et al. 2010; Prahinski and Kocabasoglu 2006b). For

instance, poultry feed is consumed by poultry birds that generate litter (excreta). The

poultry litter is then used for recycling. Poultry litter then makes biogas, fertilizers,

animal feed and fish feed. Wastes from biogas production can be later used as fertilizer

and artificial charcoal. Thus, a long reverse supply chain exists within an integrated

poultry supply chain.

Fourthly, a reverse logistics system also addresses the retrieval of all possible products

and waste materials to gain extra economic value with products' return (Ferrer and

38

Clay Whybark 2000; Ferrer and Whybark 2001; Guide 2006; Guide and Van

Wassenhove 2003; Fuente, Ros, and Ortiz 2010; Fuente, Rosa, and Cardos 2008). In

practice, most poultry by-products such as biogas, fertilizer, reject eggs and intestines

provide an additional monetary gain: feathers sold in the market also have an economic

gain.

The above discussion reveals details of the reverse supply chain and its associated

issues. The reverse supply chain is found to be a concept for dealing with used products

and wastes to recover value. Such an operation creates more opportunities to make

additional profits along with substantial societal and environmental impacts. The next

section highlights the literature gap based on the above discussion.

2.3.5 Findings and Gaps

Supply chain theory along with supply chain management and models have been

described in the previous sections. This study thus found that efficient supply chain

management can maximize the benefits which include on-time delivery of products,

efficient logistics and transportation, steady consumption, coordinated networks and

reverse logistics. Furthermore, supply chain models highlight structured connectivity

between supply chain channel members, smooth physical distribution and

warehousing, recycling wastes and managing end-of-life products. Such processes are

matched with the forward supply chain process which emphasises converting raw

materials into final products. Moreover, each fragmented chain accomplishes particular

processes efficiently. Conversely, the reverse supply chain concerns an efficient process

for recapturing value through proper disposal, reconditioning and recycling. Only a few

studies have discussed the integration of forward and reverse processes to ensure

more benefits. It was found that no study has been undertaken combining the poultry

livestock sub-sector and an integrated supply chain. Thus, the current study is focused

on the integration of these two supply chain networks to maintain sustainable

production processes. To continue the above discussion, the following sections address

the sustainable supply chain issue in relation to the research context.

2.4 SUSTAINABLE SUPPLY CHAIN

The study of sustainable supply chain management has increased considerably in

recent years in academic and business arenas. Seuring and Muller (2008b) reviewed

39

191 journal and conference papers, published between 1994 and 2007, to excavate the

view of sustainable supply chain management. They disclosed two strategies: supplier

management for risks and performance and supply chain management for sustainable

products. Again, the economic dimension dominated most of the reviewed research

with only minor attention on social and environmental issues (Seuring and Muller

2008a). In addition, integrated social and environmental aspects also did not receive

much attention in the past literature (Seuring and Muller 2008b). In reviewing previous

studies by Seuring and Muller (2008b), Drumwright (1994), Carter and co-authors

(Carter and Jennings 2002a; Carter 2000a, 2000b, 2004, 2005; Carter and Jennings

2002b, 2004); found that 140 papers discussed green topics/the environment; 49 dealt

with the environment and social issues; only 20 papers focused on the social aspect,

and 31 papers was classified as discussing sustainability. To achieve sustainability,

integration of two or three dimensions start appearing from 2002 (New 1997; New and

Payne 1995). Later, Kärnä and Heiskanen (1998) and Sarkis (2001) published a few

leading papers to integrate sustainable dimensions. Thus, integrating various

dimensions is important to gain aggregate sustainability for the industry, society and

the surrounding environment. The next section discusses sustainable supply chain

management frameworks to understand how a sustainable supply chain can be

achieved.

2.4.1 Frameworks for Sustainable Supply Chain Management (SSCM)

Lambert et. al. (2006) indicated that SSCM is the integration of key business processes

through to the end-user adding value for customers and other stakeholders whereas

other research has defined it as risk management, transparency, strategy and culture

(Carter and Rogers 2008). Importantly, the firm’s economic goals should be shielded by

addressing social and environmental matters (Carter and Jennings 2002a, 2002b), and

organizations should not treat the supply chain carelessly to achieve sustainability

(Porter and Kramer 2002). Carter and Rogers (2008) developed a SSCM framework

(Figure 2.8) in which the success of the three factors of sustainability was discussed

based on their match with each other. For instance, the combination of ‘social and

environmental’ performances was treated as ‘good’ (although questioned due to zero

economic benefits); ‘economic and social’, and ‘economic and environmental’

performances were considered ‘better’; and all three combinations were viewed as

‘best’. This means that the best possible results are driven through three-factor

40

sustainability. The following section addresses the sustainable supply chain process to

find the similarity of sustainable practices within the present context.

2.4.2 Sustainable Supply Chain Process

The supply chain is the procedure that starts from the early raw materials through to

the finished product linking suppliers and end-users; and existing both within and

external to a company (Maxwell and Vorst 2003; Croom, Romano, and Giannakis 2000).

Supply chains also create relationships among internal and external partners, third-

party agents, information systems providers and carriers. Kocabasoglu et al. (2007)

recommended the integration of the supply chain with issues of disposal, recycling,

reconditioning and remanufacturing of used and reject products. Similarly, the

consideration of by-product design and process as well as the production of by-

products, product life expansion, retrieval of products and recovery processes at the

end of the product life cycle have been highlighted in the supply chain process (Linton,

Klassen, and Jayaraman 2007). This is the area on which the researcher has focused in

the Bangladesh poultry industry. Typically, Bangladesh poultry mainstream forward

and reverse supply chains deal with importers, suppliers, processors, distributors and

consumers. If appropriate supply chain techniques are applied, the poultry supply

chain process can become more sustainable in order to handle socioeconomic issues.

Figure 2.8: Sustainable Supply Chain Management (Carter and Rogers 2008)

41

When sustainability practices have been absent, company management has attempted

to establish the triple bottom line concept in order to achieve in the environmental,

economic and social dimensions of sustainability (Dyllick and Hockerts 2002; Elkington

1998). According to Svensson (2007), there are a number of views that attempt to

address features of sustainable business operation and philosophy, for example:

a) Sustainable supply network management (Young and Kielkiewicz-Young

2001);

b) Supply chain environmental management (Lippman 1999);

c) Sustainability labelling schemes (Boer 2003),

d) Environmental purchasing (Zsidisin and Siferd 2001);

e) Green purchasing strategies (Min and Galle 1997);

f) Environmental product differentiation (Reinhardt 1999),

g) Corporate social responsibility (Dyllick and Hockerts 2002).

h) Environmental marketing (Sheth and Parvatiyar 1995; Peattie 1995)

i) Green marketing (Crane 2000);

j) Environmental management (Hoffman 2000); and

k) Life cycle assessment (Welford 1999),

l) Reverse logistics (Zikmund and Stanton 1971);

m) product returns; source reduction; recycling; material substitution; reuse of

materials; waste disposal; refurbishing; repair; and remanufacturing (Stock

1998).

The above-mentioned features are important to any business operation. However, it is

assumed that it is not possible to adopt all these features; instead, attempts are made to

incorporate them step-by-step. The implementation of such features may be easy for

large companies whereas small organizations will struggle to do so. Different types of

industry are known to have their own processes, operation and capability which may

not be similar to other industries’ processes. It is therefore challenging to integrate

these features in the context of the current study which is the main objective of this

research.

A significant number of recent research publications have focused on environmentally

linked supply chains with the major challenge being to transform them into sustainable

businesses (EC 2006, 2011; Dewick, Foster, and Green 2007; Zhu, Geng, and Lai 2011).
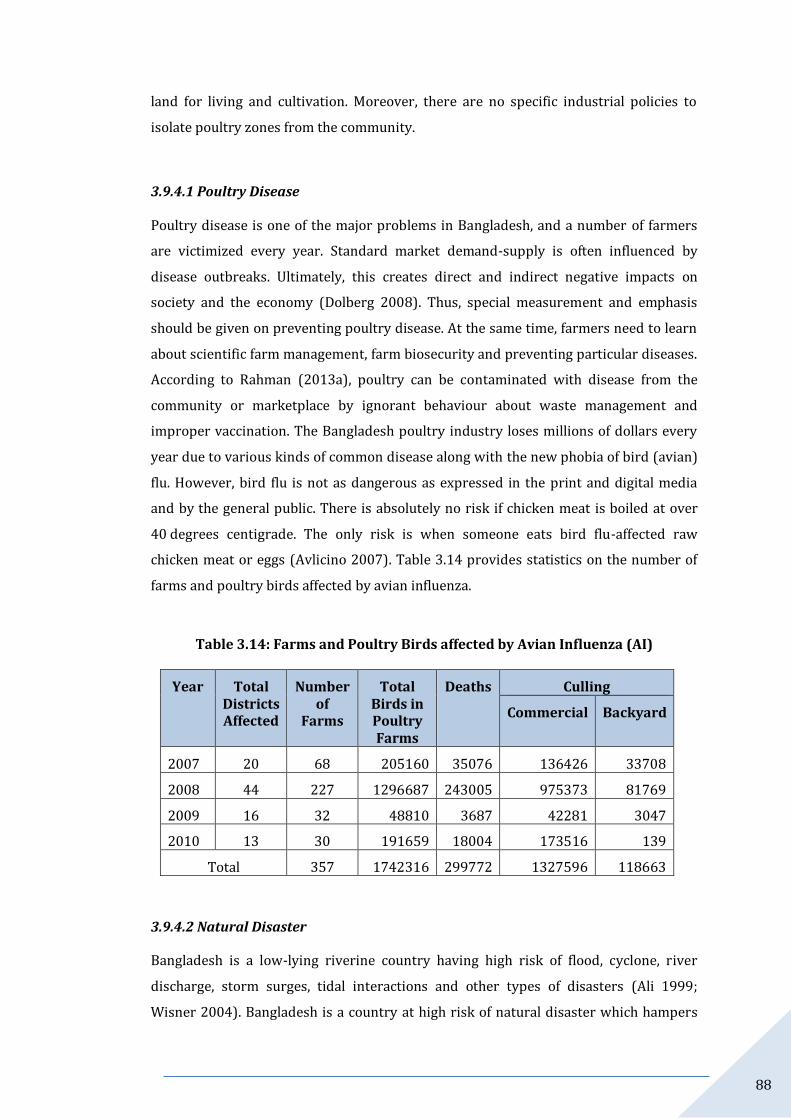
42

Vachon and Mao (Vachon and Mao 2008) found a positive statistical association

between the supply chain, suppliers and environmental performance while recycling

wastes. Similarly, Seuring (2004) concluded that supply chain sustainability requires

consideration of business fluctuations through integrated supply chain management.

Concentration on the environment and sustainable operations are to be considered in

the entire supply chain process during the production, consumption and post-disposal

disposition of products (Linton, Klassen, and Jayaraman 2007). However, the

interaction between supply chains and sustainability is the important consideration for

operations and the environment (Corbett and Kleindorfer 2003) and for operations and

sustainability (Kleindorfer, Singhal, and Van Wassenhove 2005). In addition, optimizing

operations is important to achieve a sustainable supply chain, which ensures the

greatest value of products or services at the lowest possible cost (Handfield 1999;

Leenders and Blenkhorn 1988). The latest consensus on the sustainable supply chain is

that it should integrate with product strategy, engineering by-products, by-products

produced during product use, product life extension, product end-of-life, and recovery

processes at end-of-life (Quariguasi Frota Neto et al. 2010; Linton, Klassen, and

Jayaraman 2007; Büyüközkan and Berkol 2011; Fabbe-Costes, Roussat, and Colin

2011). To manage an effective reverse chain, the following discussion is the key for a

business operation in maintaining waste recycling, reuse and reconditioning.

2.4.2.1 Product Design

Product design needs to be considered for customer preference and suitability prior to

conversion to a by-product. Without considering customer preference, a newly

designed product may fail to create appeal for further consumption. Moreover,

environmental impact over the new product’s life cycle and afterwards is also

considered in terms of maintaining ecological sustainability (Rebitzer et al. 2004;

Wilkins et al. 2006; Karna and Heiskanen 1998). For example, environmentally friendly

poultry slats (beds) are used in commercial farms to ensure their reuse for the next

flock.

2.4.2.2 Manufacturing By-products

By-product production from different poultry wastes is dominant in the current

research. This involves the reduction and elimination of poultry wastes through cleaner

process technologies (Kemp 1994; Clift 1995); quality production techniques (Zink

2007; Zhu, Sarkis, and Lai 2008; King and Lenox 2001); and use of waste to produce

43

new by-products (Frosch and Gallopoulos 1989). For instance, poultry wastes can be

recycled to make a number of useful by-products.

2.4.2.3 By-products during Product Use

It would be worthwhile if the poultry industry could convert its wastes into valuable

by-products during product use. By doing so, the waste storage issue could be solved

due to immediate use of wastes. Economic benefits would be recognized through

extended producer involvement and responsibility, provision of products (Michaelis

and Coates 1994) and manufacturers who could provide support for original product

sales (Wise and Baumgartner 1999). For example, poultry farming is a continuous

process in which it is possible to make by-products during the ongoing production and

rearing of different sizes of poultry flock. This appropriate concept is useful for

Bangladesh context where farmers can access additional benefits from diverting wastes

into valuable by-products.

2.4.2.4 Product Life Extension

Product life extension is another important issue in which a product can be used for

longer than expected. A number of methods are used to collect and extend the life of

after-use products (Linton and Jayaraman 2005). Intelligent manufacturers never miss

opportunities for product life extension (Guide and Van Wassenhove 2003; Linton and

Johnston 2000) and vibrant highly profitable remanufacturing businesses (Arndt 2005;

Lund et al. 1982; Lund and Mundial 1984). At the practical level, approximately 20% of

eggs remain unhatched and are excluded. Poultry owners supply these eggs to small

and medium bakeries as cheap raw materials. Poultry entrepreneurs are extending

eggs' life to customers and thus are saved from immediate dumping.

2.4.3 Environment Friendly Supply Chain

Environmental success is an integral part of integrated sustainability. Environment has

to be taken care through production process and supply chain activities. ‘The Limits to

Growth’ (Meadows et al. 1972) and ‘Beyond the Limits: Global Collapse or a Sustainable

Future’ (Meadows and Randers 1992) were the two leading books in which authors

justified their logic about the limitation of Earth’s resources. Definitely, the Earth has a

limited capacity for growing raw materials and consistently supplying it to human

beings (Karlsson 1999). At the same time, it is impossible for humans to stop

consuming resources to fulfil their own needs. Thus, sustainable development involves

44

consideration of the reduced potential for depletion of resources while consuming a

product (Tsoulfas and Pappis 2006). Therefore, the recovery of used products, in

particular, is also named as a closed-loop supply chain (Cooper, Browne, and Peters

1991). Closed-loop and reverse logistics are the effective process and control of

recovering value for competitive advantage (Porter 1985; Fleischmann 2000;

Fleischmann et al. 2005). Chen and Paulraj (2004) developed a framework of supply

chain management where supplier and buyer performance linked with strategic

purchasing are based on the buyer-supplier relationship in terms of supply network

structure and logistics integration. At the same time, they considered environmental

inconsistencies or uncertainties among all the relationships. Without considering the

environment, no supply chain network can be effective enough to achieve

sustainability.

According to poultry farm owners, a strong relationship exists between the existing

supply chain, disease outbreak frequency and present environmental conditions of

excess rainfall, summer heat exhaustion, humidity, floods, cyclones and contamination

from pollution (Rahman 2013c; Chowan 2013; Mannan 2013). Recent studies (Van de

Vorst, Beulens, and Van Beek 2000; Riddalls, Bennett, and Tipi 2000; Chang and

Makatsoris 2001; Higuchi and Troutt 2004; Erkoc, Iakovou, and Spaulding 2005; Son

and Venkateswaran 2007) have emphasised supply chain behaviour under

catastrophes and uncertainties. Researchers have used operational research that helps

to reduce the problem complexity while simulation has focused on internal and

external uncertainties and actions in response (Vo and Thiel 2011). Poultry has a

relatively low environmental impact compared to other animal production due to

efficient feed utilization (Vries and Boer 2010). Waste feed can create hygiene

problems for the farm. In addition, poultry dust, zoonotic diseases (avian influenza,

Salmonella, Campylobacter), and bacteria are risky for human health (PVE 2010). The

economic viability of the poultry meat and egg sectors is also under pressure. Thus,

care should be taken of the environment to protect against such damage. The next

section discusses the feasibility of forward and reverse supply chain integration.

2.4.4 Integrated Poultry Forward and Reverse Supply Chain

It has been reviewed in earlier discussions (see sections 2.3.3 and 2.3.4) that both the

forward and reverse supply chain processes are important for any business operation.

To gain more benefits, it is essential for a collaborative effort rather than approaching it

45

in a fragmented way (Fuente, Rosa, and Cardos 2008). Such collaborative effort can

bring more sustainable results in light of obtaining higher economic benefits and a

strategic position among competitors (Fuente, Rosa, and Cardos 2008). To do so, a

company needs to redesign its collaborative model involving its various stakeholders.

Min and Zhou (2002) gave priority to analysing the supplier–client relationship before

designing an integrated relationship whereas Kaihara (2003) placed emphasis on

examining the inter-company scenario to find out the feasibility of integrating the

supply chain processes. The integrated model for supply chain management (IMSCM)

not only considers the traditional flow of the supply chain from raw materials to

products to the client, but also envisions reverse supply chain operations (Fuente, Rosa,

and Cardos 2008). At the same time, a reverse logistics system helps a firm to collect

and recycle products and wastes exploring how to achieve possible economic value

(Rogers and Tibben-Lembke 1999; Ferrer and Clay Whybark 2000; Ferrer and

Whybark 2001). Thus, an integrated supply chain can provide more benefits to the

industry and society. The current study has also considered an integrated poultry

supply chain for the sake of maximizing economic, social and environmental benefits.

Thus, it is a matter of analysing and examining the consequences of integrating various

supply chain processes. In most cases, it is assumed that sustainable outcomes are

ensured through an integration process.

The Bangladesh poultry forward supply chain starts from rearing the grandparent

breed followed by the parent stock farm or breeder farm, hatchery, distributor,

broiler/layer farms (day-old chick consumers), wholesaler, retailer and processor. Day-

old broiler chicks (DOCs) are supplied to distributors to distribute to the ultimate

farmers who produce meat and eggs for the general public. Then, mature chickens are

grown from DOCs which are ready to flow towards the open market, restaurants,

processing units, etc. (Schwartz 1991). In this process, issues such as economic, social

and environmental issues can be covered. Each of these issues covers a number of

concerns, for example, employment generation is addressed as a social issue.

On the other hand, the reverse supply chain is a relatively new concept dealing with

product return, recycle and reuse to keep the environment intact by using industry

wastes (Papageorgiou 2009; Dowlatshahi 2000). Realistically, the poultry industry has

no chance of product retrieval, return or reconditioning due to the perishable nature of

its product. However, there is plenty of scope to recycle or reuse poultry wastes. It is

46

also evident from the in-depth interviews that various poultry wastes are generated in

the poultry production process namely litter, feed waste, feathers, broken eggs,

rejected eggs and intestines. By reusing poultry wastes, industries can make valuable

products such as fertilizers, biogas, pillows, charcoal and bakery items. It is likely that

someone may argue that no reverse logistics exists in the poultry industry.

Traditionally, reverse logistics deals with the end-of-life product. Logically, this study

argues that a reverse supply chain is present within the poultry supply chain. For

example, poultry birds consume feed which is supplied from the feed mill as a final

product. This feed consumption generates poultry litter (excreta) which can be

reversed to recycle into by-products. Again, chicken meat is a final product which is

reared at farm level. Intestines and feathers can be collected from the final product of

chicken meat when it is slaughtered in a processing centre. In this way, poultry wastes

flow back to the same industry or a third party industry for value recovery. Such

practices are similar to the reverse logistics theory. Therefore, forward and reverse

supply chains can be integrated in the poultry industry to maximize the benefits.

Following sections will discuss the sustainable supply chain concept for the Bangladesh

poultry industry.

2.4.5 Literature and Gaps

The above section has discussed sustainable supply chain theory with a comprehensive

model. It was found that such a supply chain could be achieved to ensure economic,

social and environmental benefits. The model (Figure 2.5) discussed above presents the

options of achieving two-component sustainability (among social, economic and

environmental dimensions) if it is not possible to incorporate three factors at once. The

systematic progress of adopting various sustainable strategies is emphasised. In

contrast, the Bangladesh poultry industry is yet to consider the above issues in their

operation to attain maximum benefits. Therefore, the current study is focused on

achieving sustainable success for the existing poultry process through adopting the

above model. The proposed integrated poultry model takes into consideration the

above literature to gain sustainable success in the poultry supply chain. To continue the

above discussion; the next section discusses sustainable supply chain issues within the

poultry industry in various countries.

47

2.5 SUSTAINABLE SUPPLY CHAIN IN THE POULTRY INDUSTRY

Modern agriculture now feeds 6,000 million people around the world through the

blessings of science and technology (McRae, Smith, and Gregorich 2000). At the same

time, an efficient supply chain helps an industry to serve its customers on time. For

example, global animal meat production has doubled in the past couple of decades,

mainly from better yields resulting from effective supply chain management and

superior technologies along with artificial feed (Tilman et al. 2002; Tilman et al. 2001).

The sustainability supply chain is becoming a major focus for the poultry industry

worldwide, as resources, including raw materials, become limited and expensive in

meeting the growing demand (Harris 2013). To design a sustainable poultry industry,

an effective supply chain network is needed to maintain optimum demand and supply.

In fact, the poultry supply chain is a complex process involving a number of parties

such as suppliers, farmers, distributors, agents, sub-agents, meat processors, etc. The

Victorian (Australia) chicken meat industry is designed as a vertically integrated supply

chain (Figure 2.9) which includes quarantine facilities, breeding farms, feed mills,

hatcheries, grow-out/broiler farms and processing plants (DEPI 2013). The complexity

of the poultry supply chain depends on the context (location), skills, maintaining the

safety process, quality control and financial capabilities to invest (Gwin, Thiboumery,

and Stillman 2013).

Figure 2.9: Australian Chicken Meat Industry Supply Chain (DEPI 2013)

It is observed from above figure 2.9 and Table 2.4 (DEPI 2013) that the poultry supply

chain in Australia is classified into four major stages: quarantine (mother breed

rearing), breeding farms, broiler grow out farms and processing units. Each stage has a

variety of tasks to accomplish: for example, the breeding unit has to maintain its own

feed mill and hatchery units to supply feed and hatch the day-old chicks (DOCs) for

48

further supply. Even a feed mill has many tasks such as steadily supplying feed to the

farm units. It is noted that chicken growth and genetics will be hampered if feed supply

is interrupted. Similarly, quarantine facilities, broiler farms and chicken feed

processors have their individual processes to complete to achieve proper production.

Figure 2.10 presents the vertical poultry supply chain in the USA. Moreover, the USA is

the leading chicken meat producing country in the world followed by Brazil and China

(Mundi 2011). This standard supply chain starts with primary breeding companies and

ends with processing units followed by final consumption by consumers. This

particular supply chain network has been designed by the National Chicken Council of

USA. The difference between the Australian and US supply chain is regarding

procurement of by-products from processing plants through further processing units

(see Figure 2.10). The US poultry industry is highly concerned to ensure the quality and

to maintain sustainable growth through market demand analysis.

Table 2.4: Major Stages of Poultry Supply Chain in Australia

Stages Descriptions

Quarantine Facilities

Eggs are imported from US and UK suppliers of genetically highbred chickens. The eggs are hatched and raised for nine weeks in quarantine facilities. The hatched birds are known as great grandparent (GGP) birds.

Breeding Farms

The great grandparent (GGP) birds are bred out for several generations. The offspring of the parent birds are then raised for meat production.

Broiler Grow Out Farms

The day-old chicks hatched from the parent generation are delivered by the processing company to its own farms or contracted farms. They are grown out for between 30-65 days.

Processing The processing company selectively collects chickens of varying sizes from broiler farms depending on its needs. The chickens are then processed into a range of fresh, chilled, frozen and value-added products.

Different countries use diverse poultry supply chain models selecting the model which

most suits their environmental context. In Australia, poultry farmers are guided by the

Poultry Cooperative Research Centre (CRC) on how to maintain sustainable production

and other related matters (Poultryhub 2013). For example, Poultry CRC emphasises the

following issues to achieve sustainability:

a) Maintaining poultry health and welfare

49

b) Improving resource utilization and reducing environmental impacts of

poultry production

c) Controlling poultry product-associated food safety issues and enhancing

egg quality for consumers

The CRC helpline is always interactive for farmers and their stakeholders to assist them

in achieving sustainable production and supply to the ultimate destinations. This

practice is one of the effective interactive processes between researchers, farmers and

the country’s policy makers. Scientific information relating to disease management,

rearing procedures and feed ingredient use updates are important issues for relevant

stakeholders. It is assumed that such information flows can be useful for the current

study’s context.

Figure 2.10: Poultry Supply Chain in USA (NCC 2012)

In contrast, the US poultry industry mostly maintains a vertically integrated supply

chain with an efficient production system which is demand responsive (Hinrichs and

Welsh 2003). The US poultry industry has several unique characteristics: integrated

ownership, geographically concentrated production and identical marketing systems to

50

maintain sustainability (Kandel and Parrado 2005; Constance et al. 2013). Moreover,

most US consumers are habituated to processed chicken consumption and 90% of their

poultry industry is directly linked to processing (Hinrichs and Welsh 2003; Smith

2001). This linkage with processing units enables them to be informed of the exact

demand status from food manufacturers to meet the ultimate customers’ needs (Welsh

and Hubbell 1999; Hinrichs and Welsh 2003). Brazil, China, France, Malaysia and

Thailand poultry supply chains are also coordinated with the same stakeholders. They

have incorporated sustainability concepts to meet present and future demands of their

products. Large poultry meat producing countries are meeting increasing customer

demand through maintaining sustainable growth in their current operation.

On the other hand, Boyazoglu (2002) stated that improved and scientific waste

management are needed to optimize resource utilization and reduce the accumulation

of nutrients in air, soil and water. In addition, more research is required to improve

intensive farming systems in the animal excretion of nutrients whilst maintaining

production levels (Malechek and Scottsdale 1982). A number of frameworks have been

developed by various researchers living in different parts of the world based on

different locations and market potential. One renowned framework named the ‘Farm

System Simulator’ (FSSIM) offers a generic structure enabling the assumption of

situations and supply response (Janssen et al. 2010). For example, farmers in the

European Union (EU) are forced to consider not only economic aspects but also

environmental and social consequences (Janssen et al. 2010). In this situation, bio-

economic farm models can be used for assessing agricultural emissions on the

environment (Falconer and Hodge 2001; Ittersum and Rabbinge 1997; Wossink,

Lansink, and Struik 2001) and biodiversity effects from agriculture (Meyer-Aurich et al.

1998; Oglethorpe and Sanderson 1999; Schuler and Kachele 2003).

On the other hand, the German model MODAM has been applied to gain benefits from

reusing wastes since the 1980s (Meyer-Aurich et al. 1998; Kachele and Dabbert 2002;

Uthes et al. 2008; Zander and Ka¨chele 1999). Simultaneously, the MIDAS model

(Kingwell and Pannell 1987; Morrison et al. 1986) was used on sheep farms in South-

West Australia (Gibson, Kingwell, and Doole 2008; Kingwell et al. 1995; Kopke, Young,

and Kingwell 2008). Furthermore, the CropSyst model (Stockle, Martin, and Campbell

1994) has been applied to different environments (Confalonieri and Bocchi 2005; Pala,

Stockle, and Harris 1996; Wang et al. 2006). Another model named the Global Trade

51

and Analysis Project (GTAP) is frequently used for different policy and trade questions

(Hertel 1999). Likewise, the CLUE (Conversion of Land Use and its Effects) model

(Veldkamp and Fresco 1996) was applied to many different locations at spatial scales.

The above models have been used in different agro-based industries linked with

various livestock and crop farming and effective supply chain processes in developed

countries. The current research has studied the above models to adopt suitable

concepts and design in order to develop an integrated supply chain process model for

the Bangladesh poultry industry. The next section deals with Bangladesh poultry

supply chain and sustainability.

2.6 BANGLADESH POULTRY SUPPLY CHAIN AND SUSTAINABILITY

A very few literatures were found on Bangladesh poultry and sustainability issues

which dealt with an existing supply chain model. The current research has developed a

simple supply chain model based on commercial poultry farming. This was based on

the study’s in-depth and focus group interviews with people with poultry expertise. It

was found that the Bangladesh poultry supply chain consists of various levels of poultry

breed rearing, procuring and processing units such as grandparent (GP) and parent

stock (PS), broiler/layer, feed mill, processing centre and waste procurement unit.

Figure 2.11 (developed for this research) depicts the existing supply chain network in

the poultry industry in Bangladesh. The Bangladesh poultry supply chain starts with GP

bird rearing followed by PS, broiler/layer, hatching of eggs in the hatchery, production

of day-old chicks (DOCs) through to feed processing in the feed mill, making value-

added chicken products in a processing centre, etc. Figure 2.11 also shows the waste

management centre which procures various valuable by-products for further

consumption.

Table 2.5 shows various stages of existing poultry operations in the Bangladesh

context. These stages are named as grandparent (GP) farms, parent stock (PS) farms,

hatchery unit, feed mill, broiler farm, slaughtering plants (open market), processing

centre, distribution house and consumption. In Bangladesh, people are still accustomed

to consuming chicken bought live from the open market which hinders grow up

processing plants for further value-added products. Gradually, people have started

consuming processed chicken due to the chores of their busy daily lives (Rahman

2013c). Unfortunately, the Bangladesh poultry supply chain is suffering from lack of

coordination between different key stakeholders. Each supply chain member is

52

assumed to be responsible for their part of the fragmented process without

coordination between succeeding and preceding processes. This unorganized chain

hinders the achievement of optimum growth for meat and egg distribution to the

Bangladesh society. This is the particular area of the research gap which needs to be

filled through designing an effective supply chain process. This study has attempted to

propose such a coordinated supply chain network so maximum benefits can be ensured

for stakeholders. The next section briefly discusses the different stages of the poultry

supply chain.

It has been mentioned that there is no evidence in the previous literature of research

conducted in Bangladesh on the sustainable poultry supply chain. The only model (see

appendix A) found in the literature is focused on small-scale poultry rearing through

the help of the Department of Livestock Service (DLS). This poultry supply chain

existed from the 1980s to 1990s. At that time, the Government of Bangladesh directly

assisted farmers to supply day-old chicks (DOCs). The total perspective later changed

due to the need to manage increasing demands which were handled by commercial

poultry farmers and large investors working together to mitigate the supply–demand

situation. Recently, private owners have been managing breeding facilities, farm

management and supply chain networks themselves rather than expecting to receive

help from the government agency. According to Vo and Thiel (2011) and in-depth field

study, the most recent poultry supply chain process is often composed of the following

stages (see Table 2.5).

2.6.1 Grandparent (GP) to Parent Stock (PS)

The Bangladesh poultry supply chain starts with day-old GP chicks, imported from

highbred genetics companies of the USA, France and China. These breeds are

sophisticated and sensitive and should be reared in a quarantined and hygienic

environment. The eggs produced from the GP are then hatched to produce PS day-old

chicks. Later, PS are grown to maturity and produce eggs for further hatching of day-

old broiler and layer chicks. The next step is to rear day-old chicks for a certain time to

grow them into mature birds for final consumption.

53

2.6.2 Day-old Chicks (DOCs) to Mature Chicken

The ultimate farmers rear day-old chicks (DOCs) for 25 to 65 days to grow them to

mature chickens. However, Bangladesh poultry farmers rear DOCs for a maximum of

45 days having an expectation of 2.5 kilogram (kg) weight for an individual broiler bird.

In contrast, poultry meat consumers prefer to buy a chicken weighing around 1.25 kg to

1.75 kg. To grow a chick to this weight, farmers need to be rear them for an average of

30 days. The mature chickens are then supplied to the open market and processing

centres for direct sales and making value-added products, respectively.

Grand Parent

Layer/Broiler Meat/Eggs

Fertilizer

Parent Stock

Hatching Egg Production

Hatchery

Wastes Processed Chicken Food

Layer/Broiler Farm

Day Old Chicks

Ultimate Customers

Feather

Charcoal

Fish/Duck Feed

Biogas

Feed Mill

Figure 2.11: Poultry Supply Chain for Bangladesh Poultry

2.6.3 Hatchery and Feed Mill

The hatchery and feed mill are a necessary part of GP and PS farms. It is better to

maintain individual feed mills to procure feed for the sensitive birds for quality

reasons. Feed ingredients are an important factor for producing healthy optimum

numbers of eggs and quality meat. Feed mill operation can be extended for day-old

54

chick, layer and broiler farms. On the other hand, a hatchery is used to hatch eggs to

produce the succeeding breed’s day-old chicks. Hatchery establishment in a poultry

operation is expensive. The necessity of incorporating this operation within a poultry

supply chain depends on the production capacity of the mother breed farm. From the

opinion of poultry experts, it is expected that a hatchery unit needs to be maintained if

weekly production is approximately 50,000. The next section deals with the poultry

waste processing unit.

Table 2.5: Different Stages of Poultry Supply Chain

Stage Tasks to Accomplish

Grandparent Farm

Grandparent (GP) breed produces healthy hatchable eggs for producing day-old parent stock (PS) chicks.

Parent Farm Parent stock breed produces healthy hatchable eggs for producing day-old broiler/layer chicks.

Hatchery Unit Hatchery unit takes 21 days to hatch the eggs for GP and PS breeds.

Feed Mill Feed mill procures consistent feed for GP, PS, broiler and layer birds as per standard requirements.

Broiler Farm The chickens are grown up to 2.2 kg in 40 days. On a given day, fully-grown mature chickens are transported to the open market and slaughtering plants for direct sales and further processing.

Open Market Mature chickens and consumable eggs are sold in the open market.

Slaughtering Plants

This stage involves the slaughtering of chickens, de-feathering, evisceration, chilling, maturation, cutting and packaging as well as the pricing for products from the entire chicken. In Bangladesh, the general public are accustomed to consuming chickens bought live from an open market rather than dressed or processed chicken.

Processing Centre

This stage is where value is added to the chickens (pre-cooking, adding spices, etc.) and where chickens are mostly used as an ingredient for the preparation of chilled food (ready meals, sandwiches, etc.). A lower percentage of people are accustomed to consuming processed chicken or different parts of the chicken such as thigh, drumstick, wings and pieces.

Waste Processing Unit

The waste processing centre produces different valuable by-products for household or small industry consumption.

Distribution Processed chicken products are collected from the processing centre, and then delivered to wholesalers and retailers.

Consumption This refers to the commercialisation of the product among wholesalers, retailers and markets, i.e. household purchasing, storage, cooking, catering, consuming and disposing of food.

55

2.6.4 Waste Processing Centre

Poultry genetics produce a huge quantity of different kinds of wastes which can be used

for making further by-products. The valuable by-products are then sold to different

segments of the market. Some by-products can even be used within the poultry

industry. For example, biogas from wastes can be used on the same farm to operate

heating systems. At the same time, fertilizers, unused eggs and some other wastes can

be resold to different groups of small industries to make other types of products.

2.6.5 Processing Plant and Final Consumption

The last stage of the poultry supply chain in Bangladesh is the final consumption of

produced chicken, eggs and various by-products produced from wastes. The poultry

supply chain provides fresh meat, eggs and value-added meat products which are

produced in various types of processing plants and transmitted to customers with the

help of distribution companies. The following paragraph describes a few models which

are used in different countries to upgrade agro-based farming.

2.6.6 Literature Gap and Research Model

The literature review in the previous sections has proposed that there is a strong

relationship between achieving sustainability and having a structured supply chain.

This connection between sustainability and the supply chain may be suitable for the

economy, society and the surrounding environment. In addition, the above literature

review also discussed the sustainable supply chain, the poultry supply chain around the

world and recent poultry supply chain practices. From the literature, the study has

achieved an understanding about the literature gap on integrating sustainable supply

chains. Consequently, the study has developing an integrated model for a structured

poultry supply chain which will contribute in a much better way to Bangladesh society,

the economy and the environment. However, gaps still remain in implementing this

theory in practical fields, the particular industry or specific operations which might

implement this sustainable production process. At this point, the researcher has taken

the Bangladesh poultry industry as a research area in which to implement

sustainability and the structured supply chain through developing effective forward

and reverse supply chain integration.

56

The above literature failed to disclose a single integrated model which had followed

sustainability and pragmatic supply chain concepts to improve the process. It is noted

that the literature search was confined to the above-mentioned concepts and the

poultry supply chain. In these circumstances, this study is taking the initiative to

develop an integrated model where forward and reverse supply chains will act together

to make the business more sustainable. To develop an integrated model, the study

followed the components of sustainability (economic, social and environmental) and

supply chain integration strategy. Firstly, the process in the case industry was modelled

(see chapter 5); then the necessary extension was undertaken restructuring the supply

chain players to achieve smooth mobility of products. In addition, a few fragmented

poultry processes were added to the case industry supply chain process; for example,

third party companies normally deal with various aspects of waste processing. The

current research tries to adopt these aspects as much as possible to maximize the

benefits for stakeholders and customers. Moreover, time variations, policy difficulties,

profit goal, time taken in making input decisions and a few other ratios were also

incorporated into the model to build a realistic poultry process. Furthermore, the

model is run over six years with the four-year output treated as forecasted future

productions. Such facilities will help poultry owners to understand what could happen

in the future. Finally, the model contains a number of constant inputs: these can be

experimented with by changing values to see possible changes that could occur in

reality. The final section of this chapter includes a summary of the above discussions.

2.7 SUMMARY

This chapter offered the literature review of this current study. The appropriate details

of theoretical concepts from sustainability, supply chain, forward and reverse supply

chains, integrated supply chain, sustainable supply chain, poultry supply chain process

and sustainable poultry supply chain have been reviewed. At the same time, research

gaps have been identified in both the sustainability and supply chain contexts. The next

chapter discusses the Bangladesh poultry operation and describes the case industry in

light of the current study.

57

CHAPTER 3:

BANGLADESH POULTRY INDUSTRY OPERATION AND

RESEARCH CASE DESCRIPTION2

3.1 INTRODUCTION

This chapter discusses the basics of poultry industry operation in general and

Bangladesh poultry in particular. It also discusses the poultry breeds, production

system, structure, process, supply chain network, calamities of poultry operations and

poultry waste management including by-product production. The significance of the

poultry industry in Bangladesh is a focus in this chapter showing its scope and future

demands. The final section includes the research case description describing their

existing operations and procedures for maintaining poultry farming in the Bangladesh

environment. Simultaneously, market share, coverage, various products, market

demand and diversified technologies used in their operation are also included in this

chapter.

3.2 BANGLADESH POULTRY INDUSTRY

The total population in Bangladesh is approximately 148.69 million at an annual

growth rate of 1.1% and over 71.9% (BTI 2012) of the total population live in the rural

areas and are highly reliant on the farming system. The contribution of the livestock

sub-sector to gross domestic product (GDP) and the agriculture sector as a whole is

currently 3.2% and 19%, respectively (BBS 2010). The Bangladesh poultry industry

started to grow rapidly from 1980, and 0.15 million poultry farmers and 6 million

2 Parts of this chapter have been published in the following publications:

a. Shamsuddoha, Mohammad. 2010b. "A Sustainable Supply Chain Process Model for Bangladeshi Poultry Industry." In Curtin Business School (CBS) HDR Colloquium 2010 Perth, Australia, edited by Joanne Boycott, 1-7. Curtin University: Curtin Business School.

b. ———. 2012. "Achieving Sustainability through Poultry Supply Chain” Emerging Research Initiatives and Developments in Business: CGSB Research Forum 2012, 57-65, Perth, Australia: Curtin University.

c. ———. 2011b. "A Simulation Supply Chain Model for a Sustainable and Environment Friendly Poultry Industry: Insights from Bangladesh." In Australian and New Zealand Academy of Management (ANZAM), Wellington, New Zealand, edited by Kevin Voges and Bob Cavana, 1-12. New Zealand

d. ———. 2013. "Poultry Wastes Reuse to Achieve Environmental Sustainability." In Australian and New Zealand Academy of Management (ANZAM), Hobart, Australia, 52-59. Australia

58

livelihoods directly depend on it (Rahman 2007). More than 10 million people are

indirectly involved with the poultry industry. The total population of poultry is 200-

220 million, and the daily waste produced from this industry is around 15-20 million

tonnes (Bhuyian 2007). The poultry industry contributes to the nation by providing a

cheap source of high-quality nutritious animal protein in terms of meat and eggs (Das

et al. 2008a). About, 20% of animal protein in Bangladesh originates from the poultry

sector (Das et al. 2008a, 2008b). The chicken population is particularly dominant

within poultry species at about 90%, followed by ducks (8%) and a small number of

quails, pigeons and geese (Das et al. 2008b, 2008a). Recently, the commercial poultry

breeds have been popular with farmers rather than the traditional scavenging breed,

which is helping to increase the poultry population every year. Moreover, the life cycle

for the commercial breed is comparatively short which is convenient for economic

mobility in terms of gaining profits.

Historically, Bangladesh rural people have reared free range (backyard) and

scavenging poultry species, helping them to generate a small income along with

maintaining required protein for their family through eggs and meat (Das et al. 2008b).

These indigenous birds have relatively low productivity (35-40 eggs and 1-1.5 kg meat

per bird per year) (Das et al. 2008b). In rural areas, the majority of the people are

landless, underprivileged, malnourished, uneducated, and living below the poverty line

(Jabbar et al. 2005; Shamsuddoha and Sohel 2004). For these people, small-scale

poultry rearing plays a very significant role in additional income generation, poverty

reduction, women’s empowerment, supplementing required protein and nutrition, and

overall economic development (Shamsuddoha and Sohel 2004). The poultry sector has

immense opportunities for engaging unemployed people, meeting protein deficiencies,

making various sustainable by-products from its wastes, and the possibility of earning

money, empowering people and eliminating poverty from the country. The present

status of Bangladesh poultry is discussed in the following section.

3.3 PRESENT STATUS OF BANGLADESH POULTRY INDUSTRY

As mentioned earlier, Bangladesh has a long history of poultry rearing under the

traditional backyard, free range and scavenging species system (Reneta 2005). In this

poultry rearing system in most of the rural part of Bangladesh, local chickens (Desi or

local breeds) are dominant over other similar types of species (Nielsen 2007). In this

way, poultry is established as an alternative income generating activity for the rural

59

people of Bangladesh (Shamsuddoha and Sohel 2004). Poultry not only provides a

small income and protein but also contributes enormously to the country’s GDP

(Gerbens-Leenes, Nonhebel, and Krol 2010). In the early 1990s, a number of private

parent stock (PS) and breeder farms shifted their operations to produce commercial

day-old broiler and layer chicks (Reneta 2005). Thousands of poultry farms were

established through private ownership without adequate scientific knowledge.

Hundreds of poultry owners practice the triple bottom line framework of sustainability

(social, economic and environment) in an unorganized way. In fact, they only follow the

profit motive and do not spend time on implementing sustainable processes.

In addition, poultry owners are currently integrating foreign technology and rearing

improved genetic breeds in their commercial farms: this has the potential to make the

industry more profitable and sustainable. Importantly, Bangladesh is self-sufficient in

parent stock (PS) day-old chicks in meeting existing demand (Bessei 1993). This

achievement helps commercial poultry farmers to get a steady supply of day-old chicks

from local genetic farms. On the other hand, massive poultry production is also creating

an enormous amount of poultry wastes. Huge opportunities still exist to utilize poultry

wastes as not many farmers are capitalizing on poultry wastes to make economically

viable reusable products. Reversing poultry wastes to the same industry or individual

small and medium industries can help to achieve more economic, social and

environmental benefits for Bangladesh society. In this manner, the environment can be

protected from unorganized dumping of poultry wastes and can generate additional

income through making by-products. By doing so, other benefits can be achieved such

as poverty eradication, women’s empowerment, involving new entrepreneurs, food

value addition, filling the nutrition gap and maintaining food security. Thus, from the

above discussion, it is evident that the Bangladesh poultry industry is increasing its

production day by day to meet the demand. However, the industry is yet to follow the

modern concepts to achieve sustainable benefits. The following subsections address

trends in Bangladesh poultry, meat and egg consumption; nutrition status; costing and

pricing; day-old chick pricing; profitability; and protein status.

3.3.1 Bangladesh Poultry Industry at a Glance

The Bangladesh poultry industry has immense potential to contribute to individual

livelihoods, the country’s economy and aggregate GDP. The Bangladesh poultry

industry started scientific farming from the mid-1990s (Kabir 2013). Over the last two

60

decades, the poultry farming sector has grown into a formal industry attracting BDT

(Bangladeshi Taka) 150 billion in investment with six million people directly and

indirectly employed (Saleque 2009). Currently, there are five grandparent (GP) farms

producing 280,000 parent stock (PS) per week (Rahman 2013b). According to Kabir

(2013), 32 parent stock farms are producing 5.3 million day-old chicks per week. In

addition, 50,000 large- and medium-scale commercial farms along with 100,000 small

farms are producing over 9,800 metric tonnes of broiler meat, and 125.8 million eggs

per week. Table 3.1 and Figure 3.1 provide evidence of the above information relating

to the Bangladesh poultry industry and its status.

Table 3.1: Snapshot of Bangladesh Poultry Industry 2012 (Kabir 2013)

Particulars 2012

Investment 150 Billion BDT

Employment Generation 6 Million

Number of Grandparent Stock Farms 5

Production of Parent Stock/Week 2.8 Million

Production of Day-old Chicks/Week 5.3 Million

Broiler Meat Production 9,800 Metric Tonnes/Week

Egg Production/week 1260 Million

Table 3.2 presents some parameters on the Bangladesh poultry industry which were

explored by Boddington (Boddington 2007). The parameters consist of grandparent

and parent stock supply, government policy, stability, input industry, grain, genetics

and day-old chick (DOC) sales. The number of GP farms, market trends, mortality and

feed conversion ratio (FCR) are vital information for the Bangladesh poultry industry.

These reveal that the industry is still far behind the standard practice. For instance, FCR

is 2.0 to 2.2, which is remarkably higher than the standard FCR of 1.0 to 1.2. This ratio

increases the ultimate meat cost creating losses for farmers. The next section presents

statistics on trends in the Bangladesh poultry industry.

3.3.2 Trends of Poultry Farms in Bangladesh

Trends are important to consider in understanding the growth rate of certain items.

Figure 3.1 reveals that there were 43,589 poultry farms in 1993 and this increased to

around 150,000 in 2007. Informally, poultry experts have indicated that Bangladesh

61

has more than 200,000 poultry farms of various sizes. Figure 3.2 presents the number

of GP and PS farms from 2008 to 2012, showing the upward trend. As there is no

mandatory farm registration system, government or related authorities are not aware

of the current exact number of poultry farms in Bangladesh. It is evident from

observation that the poultry industry has expanded by a significant percentage in the

last decade. The Bangladesh poultry industry has failed to maintain that pace due to

policy; calamities, including bird flu (avian influenza) outbreaks and natural disaster;

and misjudgement of supply–demand projections (Sonaiya 2007). The next section is

discusses poultry meat and egg consumption.

Table 3.2: Bangladesh Poultry at a Glance (Boddington 2007)

Parameter Parameter

Grandparent

(GP) farms

>8 Retail channel 99% wet market

(fresh meat and

produce)

Parent stock

(PS) supply

100% self-sufficient Price $/kg $1.14

Stability Growing – Immature

growers >130,000

Broiler flock –

Performance – FCR

2.0-2.2

Input industry Mortality (%) 7-7.2

Grain Imported Market weight (kg) 1.08-1.43

Genetics 100% self-sufficient Market age (days) 30-33

DOC sales Dealer/Agent Integration <1% non-integrated

Figure 3.1: Trend in the Number of Poultry Farms (Fattah 2000; Raihan and Mahmud 2008)

62

Figure 3.2: Number of GP and PS Farms (Kabir 2013)

3.3.3 Poultry Meat and Egg Consumption

Poultry meat and egg consumption is an important national issue. The more broiler

meat consumed by people, the more opportunities there will be to extend poultry

farming. Bangladesh is still below the standard level in its consumption of chicken

meat. As shown in Table 3.3, the people of Pakistan, Sri Lanka, Indonesia and Malaysia

are consuming 5.5, 5.7, 7.0 and 38 kg of meat per capita per year, respectively.

Furthermore, chicken egg consumption correspondingly is 60, 54, 87 and 320 eggs per

capita per year. In comparison, Bangladeshi people only consume 3.2 kg broiler meat

and 41 eggs per capita per year. This rate shows the low consumption of both broiler

meat and eggs per year compared with neighbouring countries. There is an opportunity

for poultry farmers to fill the supply gap if they keep the price within consumers’

expected range. For this, the poultry industry in Bangladesh needs an effective supply

chain to maintain standard pricing on meat and eggs. The next section addresses

nutritional status coming from animal meat sources.

Table 3.3: Per Capita Poultry Product Consumption (Kabir 2013)

Particulars

Kg/Capita/Year

Bangladesh Pakistan Sri Lanka Indonesia Malaysia

Broiler Consumption

3.2 5.5 5.7 7.0 38

Egg Consumption

41 60 54 87 320

3.3.4 Nutritional Status

Nutrition is an important concern for a country like Bangladesh where huge number of

people lives below the poverty line and consume significantly less nutrition than their

63

actual needs. At present, the average calorie intake from animal sources is 6%

compared to the global average of 15%. Increased poultry consumption can lead to

attaining a balanced diet for the population. Expansion of poultry farms leading to

economies of scale and lower prices can ensure chicken affordability and steady

consumption of poultry meat. In this way, Bangladesh can reach the Millennium

Development Goal (MDG) nutrition target level for exterminating hunger and

malnutrition among children. Figure 3.3 supports the above statement of calorie

deficiency and targeted standard consumption. The next section discusses the day-old

chicks’ (DOCs) price, which is important for this study as it is dealing with DOCs.

Figure 3.3: Nutrition Status (Kabir 2013)

3.3.5 Costing and Pricing for Day-Old Chicks

Discussions and debates are continuing about the pricing of day-old broiler chicks.

Broiler farmers complain about the higher price of day-old chicks (DOCs) while DOC

producers grumble about the costing per unit chicks. The in-depth interviews verified

that both are correct in expressing such protests. The price is increasing day by day as

raw material prices escalate. Moreover, expensive medication and utilities prices are

also increasing total costs per unit chicks’ production. On the other hand, farmers are

not getting an optimum chicken price from the final market which is causing frustration

over the chick’s price. Figure 3.4 shows the DOC price and cost lines where the cost is

rising while the price is lagging behind the cost line. As a result, broiler farmers and

64

parent stock (PS) farmers are losing their capital due to consistent negative profit. The

DOC price and profitability are described in the next section.

Fig 3.4: DOC Costing and Pricing (Kabir 2013)

3.3.6 Day-old Chicks’ (DOCs) Price and Farmers’ Profitability

This intrinsic mismatch in supply and demand of day-old chicks (DOCs) makes it

extremely difficult to predict variability in prices. Figure 3.5 depicts the status of

farmers’ profit and loss information from January to December 2012. The graph shows

that farms had to accept losses for eight cycles out of twenty-three cycles. Such

frequency is alarming to recover the losses based upon trivial profit cycles. It is

noticeable that farmers face low price challenges several times within a year. This

forces them to accept capital losses thus hindering the growth of new poultry

businesses. The following section briefly discusses agent-level profits which are vital

for supply chain members.

Figure 3.5: Profit/kg at the Farmer Level (Kabir 2013)

65

3.3.7 Agent-level Profits

Agents make minimum profits even if the market is unstable for pricing or if there are

supply–demand matters. Figure 3.6 reveals that for most of 2012, agents made profits

although farmers failed to do so. Agents usually deal with chicks based on commission.

Thus, they are able to protect themselves from losses in comparison to farmers. The

next section discusses protein sources from different species of fish and meat including

broiler chicken.

Figure 3.6: Profit/kg at the Agent Level (Kabir 2013)

3.3.8 Protein Sources

Figure 3.7 shows the comparison between species such as fish and animals providing

evidence that chicken is the cheapest protein source in Bangladesh. The figure also

provides information on growth in recent years for every species.

Note: Roih and Hilsa are types of fish.

Figure 3.7: Poultry – The Cheapest Source of Protein (Kabir 2013)

The above discussion has revealed the basic information relating to the Bangladesh

poultry industry. The trend of poultry farm growth was found to be substantially higher

66

than expected. In addition, information about meat consumption, protein requirements

and nutrition requirements helps us to understand the importance of this sector in

supplying the meat and eggs required by the nation. In addition, profitability and the

costing of products is important for the poultry industry. Consequently, trends of

pricing, costing and profitability have been discussed in order to understand the

opportunity and scope. The following section discusses the scope of the poultry

business in Bangladesh.

3.4 SCOPE OF POULTRY BUSINESS

The scope of poultry farming is huge due to its various methods of rearing such as

scavenging, free range, indigenous, commercial and semi-commercial. On the other

hand, per capita chicken meat consumption in Bangladesh is only 3.2 kg whereas in

Malaysia, people consume 38 kg (Boddington 2007; Kabir 2013). Having a huge

population with minimum consumption creates a large demand-supply gap. In

addition, Bangladeshi people depend on commercial farming rather the naturally

growing poultry bird due to its short life cycle. Naturally growing birds take longer to

generate meat than commercial poultry which can complete a cycle within 25-40 days.

Moreover, the supply–demand gap is the main concern for policy makers and farmers.

In other statistics, the projected meat consumption was approximately 582 million kg

in 2010 whereas the projected production was approximately 300 million kg (Kabir

2013). This huge production gap is what poultry producers are attempting to meet.

Furthermore, it is recognized that Bangladeshi people’s food intake involves the

consumption of significantly less calories than standard requirements. Such deficiency

of calorie intake can be met through massive and structured poultry rearing. Thus,

there is plenty of scope to increase poultry production in Bangladesh in order to adjust

the protein and calorie deficiency of the whole nation.

3.5 CONTRIBUTION TO RURAL AND NATIONAL ECONOMY

Small-scale poultry production which is an important earning source for rural people

has developed in large numbers. In the last few years, recognition of small-scale

commercial poultry production has accelerated the pace of poverty reduction (Ali and

Hossain 2012). Various articles in the literature reveal another picture and additional

information about the Bangladesh poultry industry. It is difficult for a researcher to find

out authenticity unless a governmental portal or statistical bureau provides

confirmation of its accuracy. In line with this, Ali and Hossain (2012) reported that in

67

Bangladesh 44% of the daily human intake of animal protein comes from livestock

products having US$1.5 billion investment with direct employment of six million

people. In another article, Chowdhury (2011) highlighted that per day poultry meat

and egg production are 1.6 million kg and 23.5 million, respectively.

Table 3.4: Contribution of the Livestock Sector to GDP (Raihan and Mahmud

2008; BBS 2008)

Particulars Year

2000-2001 2005-06 2008-09 2012-13

GDP (%) 2.95 2.92 2.73 2.45

Annual Growth Rate 2.81 6.15 15.83 13.91

The Livestock Production Index shows that Bangladesh has been able to register

growth in livestock since 1990. The livestock sector’s contribution to GDP was 2.80% in

1990-91, which increased to 2.92% in 2005-06 (Raihan and Mahmud 2008). Yet, the

livestock sub-sector grew at a rate higher than the annual growth rate of the overall

agricultural sector. Again, poultry constitutes 14% of the total value of livestock output.

From 1983 to 1996, the chicken population increased substantially with an annual

growth rate of 3.6% (Giasuddin et al. 2002; Rahman et al. 2002; Alam et al. 2003). To

gain an understanding of the poultry production process, the following section

discusses the forward and reverse supply chain processes in the poultry livestock sub-

sector in Bangladesh.

3.6 INPUT, OUTPUT AND PROCESS OF BANGLADESH POULTRY

The input, output and process of a business operation are important aspects to note.

Every industry operates its business with input, processing the input and coming up

with final products. Studies on most businesses are primarily on market feasibility,

market potential, existing demand and supply, societal impact, environmental hazards,

economic output, and government rules and regulation. The poultry industry in

Bangladesh is no exception. Figure 3.8 shows the poultry input-process-output

sequence which starts from the imported or locally collected grandparent (GP) breed.

The grandparent (GP) breed is produced from pure line genetics. The pure line breed is

managed by a few countries such as the USA, Canada, France, China, etc. The immediate

successor breeds (GP) are then supplied to various suitable countries through

68

direct/indirect channels. Bangladesh has 8-10 grandparent (GP) farms with parent

stock (PS) breed chicks’ production by Paragon, Kazi, MM Agha, CP farms, etc. A

number of parent stock/breeder farms are available to rear these day-old chicks

(DOCs) to produce eggs for broiler day-old chicks.

It is noted that rigorous management, a bio-secured environment and huge

investments are required for this kind of sophisticated farming. As a result, broiler and

layer day-old chicks grow up within a certain period of time to produce meat and eggs

for final consumers. This study has focused on the meat producing broiler industry due

to its research scope. Figure 3.8 shows that feed, medicine and vaccines, skilled-

unskilled-semi-skilled labourers, management decisions, egg production, mortality

rates, utilities such as electricity, gas and water, transportation and government

decisions are the key input for the poultry industry. These basic elements are vital for

this industry to achieve sustainable production and better profitability. The supply

chain network can later be enhanced from the ultimate products of meat and eggs

towards different processed foods. This is also a major scope for further research.

The process phase generates large amounts of poultry wastes comprising excreta,

reject and broken eggs, culled birds, rejected day-old chicks, feathers, intestines and

waste feed. Poultry wastes can be used as raw materials in various small and medium

industries (SMEs) for making economically viable by-products. Examples include small-

scale power using poultry excreta biogas, pillow-making industry using feathers,

industry manufacturing fertilizer from manure and wastes, fish feed from intestines

and rejected eggs, and artificial charcoal (fire sticks) from poultry litter. In fact, the

whole poultry supply chain network is more complex than it appears in Figure 3.8 even

though this research has only focused on the broiler meat producing industry that is

associated with grandparent farms, breeder farms and broiler farms. It is clearly shown

that the poultry process is generating a number of valuable by-products in addition to

its main products of meat and eggs. In addition, a number of other industries are

involved with the poultry industry such as feed, medicine, pathological/diagnostic,

logistics, cages, expertise, breed suppliers, importers, distributors and other associated

farmers. This huge network creates so many opportunities for farmers, people and

investors. At the same time, structuring such a network is difficult as so many players

surround the main industry. It is always challenging to maintain profitable

relationships with stakeholders without the implementation of an effective supply

69

chain within this industry. For this reason, the researcher attempted to discover further

improvements in this industry in light of a sustainable supply chain related to triple

bottom line theory.

In Figure 3.8, the different output can easily be classified from three different

viewpoints. From the economic viewpoint, fresh meat, fresh eggs and processed meat

are the main economic products for the poultry owner. In addition, there is significant

potential to make good quality economically viable by-products from poultry wastes.

From the social viewpoint, the Bangladeshi poultry industry is rich as it engages more

than 15 million people directly or indirectly (Kabir 2013). This business extends into

remote areas helping to reduce poverty, diminish unemployment and empower poor

women. Finally, from the environmental viewpoint of sustainability, appropriate

poultry waste management keeps the environment unchanged or intact and recycles or

reuses wastes economically. Table 3.5 presents possible by-products from poultry

wastes that could mitigate the social, economic and environmental problems. At the

same time, these by-products can be used in different industries like crops, power and

fish. Every stage of the poultry supply chain process can indicate social, environmental

and economic wellbeing which is essential to achieve sustainability.

Table 3.5: By-products from Poultry Wastes

Wastes By-Products Industry Problems Mitigated

Poultry Droppings/

Litter

Fertilizers Crops Economic, social and environmental

Biogas Power Ditto

Charcoal Power Ditto

Poultry Feed Wastes Fish Feed Fish Ditto

Broken Eggs Fish Feed Fish Ditto

Poultry Feathers Beds and Pillows Pillows Ditto

Unhatched Eggs Cakes and Biscuits Bakery Ditto

70

Feed

Medicine & Vaccination

Mortality Values

Management Decision

Egg Production Values

Hatching Values

Utilities

(e.g.; Fuel, LPG,

Power, Water)

Transport

Culled Bird

Rejected Egg Offtake

Fresh Eggs

Final Bird Offtake

Wastes

DOC

Grand Parent

Bird Mortality/Culled Bird

Layer/Broiler Meat/Eggs

Manure

Parent

Hatching Egg Production

Hatchery

Wastes Processed Chicken Food

Govt. Policy & Political Situation

Skilled/ Semi Skilled Labor

Unskilled Labor

INPUT Process Output

Layer/Broiler Farm

Day Old Chicks

Ultimate Customers

Feather

Charcoal

Fish/Duck Feed

Biogas

Fresh Meat

Processed Chicken Food

3.6.1 Simplified Poultry Supply Chain Process

Chicken meat is a highly consumed agricultural product and the main source of protein

in the world. The high production cycle, high risks and market instabilities are some of

the main challenges of poultry production which are also faced by the broiler industry.

A chicken meat supply chain (Figure 3.9) consists of a pure line (pedigree) farm,

grandparent (GP) farm, parent farm (P), broiler farm, slaughterhouse and the

distribution channel. Figure3.9 shows a simple chicken meat supply chain.

Figure 3.8: Input–Output Poultry Process Model

71

Figure 3.9: Broiler Supply Chain (Shoushtari, Ghasemi, and Zarezadeh 2011)

The broiler supply chain is a complex socioeconomic system which involves several

parties and dealing with a number of sustainability aspects. Managing a complex

system is a complex task. In Bangladesh, above 90% of chicken are sold in the open

market as live birds to ensure compliance with the halal concept (Shafie and Othman

2006). Halal meat is mandatory for Muslim people with the reading of a particular

blessing required before slaughtering the chicken. Bangladesh is a country where the

majority of people are Muslim. For this, entire open slaughterhouses have the privilege

of ensuring the halal meat supply. In addition, chicken meat is further processed to

produce value-added chicken products that are for sale in supermarkets and

restaurants.

3.6.2 Bangladesh Poultry Forward Supply Chain

The forward supply chain is the process that starts from collecting raw materials and

goes through to final consumption of the finished product (Cox, Blackstone, and

Spencer 1995). In the same way, the poultry forward chain starts with gathering the

grandparent (GP) mother breed from abroad followed by hatching parent stock (PS)

chicks, distributing them to the parent stock/breeder farm, rearing them and collecting

eggs from parent stock, hatching and distributing day-old broiler chicks, rearing them

for a certain period to grow into mature broiler chickens and collecting meat from

broiler birds. These processes involve many ultimate farmers, unskilled-semi-skilled

workers, skilled workforce, foreign consultants, scientists, entrepreneurs and

middlemen at each level. Success within the poultry industry mostly relies on how each

step smoothly connects with the following steps to manage steady supply as per

current demand.

72

INPUTS

- Local and Foreign

- Local/Imported

Technology

- Local/Imported Feeds

-Skilled and Unskilled

Labour

-Transportation

-Government Policy

-Utilities (Water, Power,

Gas)

-Local and Foreign

Expertise

Ultimate

Farmers

Parents/

Breeder FarmHatchery Day Old Chicks

Feed and

Chick SellersBroiler/Layers

Grandparent

Chicks

Value Added

Chicken Products

Hotel &

RestaurantsWholesalers Retailers

Supermarkets

& General

Stores

Customers

Grandparent

Grower Farm

Middlemen MiddlemenMiddlemenMiddlemen Middlemen Middlemen

Figure 3.10: Bangladesh Poultry Forward Supply Chain

As shown in Figure 3.10, Bangladesh poultry starts from grandparent chicks and ends

with the ultimate customers. Inputs are almost the same for each step of grandparent

and parent stock breeding and broiler birds. Notably, every step of breeding is

associated with a number of middlemen. Agents, sub-agents, distributors, transporters,

consultants, food processors, food shops and restaurants, and the skilled and unskilled

workforce are also linked with the poultry middlemen. Value is added as general

customers, supermarkets, general stores, hotels and restaurants, wholesalers and

retailers consume chicken products. Figure 3.10 shows the inputs to this industry along

with major players in the forward supply chain. The next section describes the

Bangladesh poultry reverse supply chain.

3.6.3 Bangladesh Poultry Reverse Supply Chain

The reverse supply chain clearly addresses the issues of disposal, recycling,

reconditioning and remanufacturing (Kocabasoglu, Prahinski, and Klassen 2007);

disposal or recovery value (Prahinski and Kocabasoglu 2006b; Guide and Van 2002); or

reducing negative environmental impacts by extracting waste disposal (Kocabasoglu,

Prahinski, and Klassen 2007). Poultry wastes can be reused for disposal, recycled to

make valuable products, remanufactured into economically viable by-products or have

recovered value all of which is similar to the theoretical reverse supply chain. A

73

number of judgments lie behind calling this operation a reverse chain although the

majority of people are predetermined to disagree. The explanations are the same as for

the reverse chain presented in chapter 2, the literature review chapter. Various poultry

wastes are generated from poultry operations such as litter (Burak Aksoy et al. 2008;

Rivera-Cruz et al. 2008); broken and reject eggs (Narahari et al. 2000); waste poultry

feed (El-Boushy and Poel 1994); feathers (Shih 1993); and intestines (Burns and

Stickney 1980). Figure 3.11 presents details of various wastes and their sources from

different poultry processing areas. For example, dead and culled chicken come from

grandparent birds; similarly, litter (excreta) comes from grandparent and parent

stockbreeder birds. Accordingly, the figure also shows the type of by-products that can

be generated from particular wastes. For instance, poultry litter waste can produce

biogas, artificial charcoal, fertilizer and fish feed. Similarly, other wastes make different

kinds of valuable by-products such as bakery items from unused eggs. Most by-

products have great potential to meet social, economic and environmental aspects that

will make the industry and society more sustainable.

Evidently, no final products can be retrieved to the mother company from the ultimate

customers, as poultry products are perishable in nature. The most common

understanding of a reverse supply chain is that products or accessories are retrieved,

going back to the main company to be generated into new products by recycling or

reuse. However, the poultry industry uses the reuse and remanufacturing concept for

reversing poultry wastes to make economically viable by-products. This process can be

adopted by the same companies that are producing various poultry wastes.

Alternatively, these wastes can be taken as raw materials to a third party company to

produce by-products. Different small and medium industries (SMEs) can be established

to handle different poultry wastes. The reverse process starts with collecting poultry

wastes and ends with supplying by-products to the final customers. A number of

industries are operating this reverse process within their network to get maximum

benefits from by-products such as biogas, fertilizers and fish feed.

74

Parents/

Breeders

Farm

HatcheryDay Old

Chicks

Feed and

Chick SellersBroiler/LayersGrandparents

FertilizersBiogasFish/Duck

FeedCharcoal Beds/Pillows

Crops

Industry

Power for

SME &

homeusers

Fish FarmsHome-usersPillow/Bed

Industry

Dead/

CulledChicken

Reject/

Unhatched

Eggs

Reject Chicks Feed Waste IntestinesFeathersLitter

Bakery

Figure 3.11: Bangladesh Poultry Reverse Supply Chain

3.7 POULTRY COMMERCIAL BREEDING

Breeding for meat and egg production is a remarkably complex process and very costly

(Pym n.d.; Crawford 1990). Broiler breeders need to manage to maintain the pace of

growth as it is closely related to the output of day-old chicks. Genetic improvements in

breeder performance have been steady and consistent since the late 1970s (Hocking

2009). The modern poultry industry maintains scientifically improved genetic birds so

that they can initiate an efficient and sustainable industry (Gillespie and Flanders

2010). Furthermore, continuous improvements in poultry genetics need to be quicker

than in other species because poultry breeders have the advantages of a large

population size and a short generation interval (Lister 2010). Such progress will

maintain the pace in achieving a more efficient and precise breed for commercial

poultry species (Hocking 2009). The following sections discuss the top genetics of

poultry breeding as shown in the figure 3.12.

75

Figure 3.12: Number of Birds and Generations Involved in Transmission of

Commercial Broiler Genetics (McKay 2008; Lu et al. 2003)

Above figure 3.12 shows that poultry genetics starts from pure line and ends with

consumption of ultimate meat and eggs. At the same time, the right hand side of the

above figure shows the numerical figures of generating following genetic from the

preceding genetic. For example, a thousand of poultry pure line genetic creates tens of

thousands immediate breed and 4500 millions of broiler birds which ultimately

produced 7 million tonnes of poultry meats. Therefore, poultry is a quickly growing

genetics with massive productions of ultimate products. The following sub-sections are

briefly discussed in the following.

3.7.1 Pure Line

Pure line is a uniform strain of organism that is relatively pure genetically because of

continued inbreeding and artificial selection (Marshall 1977). All successful breeding

programs will ensure that welfare standards continue to improve to ensure that

poultry production is a sustainable industry (Hocking 2009). The pure line is

genetically the topmost breed within commercial poultry (Muir et al. 2008) which

ensures the quality of successor breeds like great grandparent and grandparent. For

example, one thousands pure line mother poultry breed can produced around tens of

thousands great grandparent which known as GGP breed to the farmers. These breeds

are sophisticated in nature to rear with a prescribed control housing systems. In

Bangladesh, there is no pure line farm established yet.

76

3.7.2 Great Grandparent (GGP)

The Bangladesh poultry industry recently achieved self-sufficiency in parent stock (PS)

production (Boddington 2007). More special care and management is needed to

optimize the performance of a PS producing farm as these farms are highly

sophisticated (Boddington 2007). Currently, Bangladesh poultry owners are producing

around 350,000 to 400,000 PS per year (Saleque 2013). At the present time,

commercial parent breeder poultry farms are supported through five to eight (the

majority say five) grandparent farms with production of approximately 130,000 per

week of parent stock day-old chicks: however, they are not always in production

(Saleque 2009). Saleque also reported in the same article that five grandparent farms

produce 62% of the parent broilers. Kazi, Paragon. CP, Aftab and Nourish are the major

grandparent farms in Bangladesh (Saleque 2013). Recently, three or four existing

parent breeder companies extended their business into GP farming. The situation

depends on the existing demand for PS chicks by the PS farms. As shown on Table 3.6,

PS production in 2005 was 120,000 increasing to 168,800 in 2010. These numbers of

PS are sufficient for the existing production capacity. It is expected that GP farmers are

now capable of increasing production (Rahman 2013b) by up to 30-40% if demand

rises. A grandparent starts producing eggs at about 22-24 weeks of age and finishes

production at about 60 weeks of age, producing between 100-120 fertile eggs (Leeson

and Summers 2010). These grandparent flocks produce the next generation of day-old

parent breeder chicks. At any one time, there might be 150,000-175,000 grandparents

of all ages on the ground across Bangladesh. These grandparent flocks produce the next

generation of birds, called the parent breeders. Table 3.6 shows the population

dynamics of commercial poultry in Bangladesh.

Table 3.6: Population Dynamics of Commercial Poultry (Saleque 2009)

Items Years

2005 2006 2007 2008 2009 2010

Grandparent Stock (GPS)

(‘000)

120 125 120 148.8 145.0 168.8

Parent Stock – Local 1291 2410 2040 2400 2960 2900

Parent Stock – Imported 1454 1488.7 650.0 771.5 168.8 474.3

Total Parent Stock 2745 3898.7 2690 3171.5 3128.8 3374.3

Total Broiler Chicks (Million) 192.5 288.2 325.6 301.3 297.2 320.5

77

3.7.3 Parent Stock Breeder

According to the Australian Chicken Meat Federation (ACMF), grandparent breeders

produce fertile eggs to hatch day-old parent stock breeder chicks under the same

sophisticated farming management (ACMF 2005, 2013). The third generation of parent

stock breeders will then produce fertile eggs to hatch day-old broiler chicks which are

then reared by the ultimate farmers until they become mature broiler chicken for final

consumption (ACMF 2005). A large number of parent stock breeds were imported from

the USA, France, India and Thailand. Due to avian influenza in other countries,

Bangladesh put an embargo on imports. The Bangladesh poultry industry has been self-

sufficient in breeder PS production since 2009 (Saleque 2013).

3.7.4 Day-old Chick (DOC)

Currently, day-old chick demand is about 9.2 million per week whenever farmers

produce 9.2 million which indicates self-sufficiency. However, many calamities hamper

the Bangladesh poultry operation causing falls in production that range from slow to

drastic. Falls in production lead to supplies falling and farms closing down. In 2012, due

to bird (avian) flu and other calamities, the number of farms dropped from 114,638 to

60,824, eliminating almost half the farms (Effedlink 2012). In interviews with poultry

experts, they expressed the view that the actual figure was higher than the official

statistics. They indicated that the number of broiler farms was around 200,000

(Saleque 2013) and that approximately 60,000 farms were shut down due to various

calamities and lack of finance (Saleque 2013; Rahman 2013a). The volatile nature of the

market is the main reason for leaving poultry farming: otherwise, it is still a profitable

business for which there is a demand. Prediction is very important for the Bangladesh

poultry industry as many aspects need to be considered when undertaking farming

amidst calamities and disasters (Rahman 2013a).

3.7.5 Ultimate Broiler Farming

According to the Poultry Consultancy (www.thepoultryconsultancy.com), the broiler is

a type of lower-level poultry breed raised specifically for chicken meat production.

They are recognized for their fast growth rate with short life cycles and having a high

feed conversion ratio (FCR). Usually, broiler birds are harvested at the weight level of

1.5-2.5 kg which takes a maximum of 4-8 weeks (Rahman 2013b; Saleque 2013). In

Bangladesh, people like to consume broiler chickens weighing 1.25-1.75 kg. Due to this

habit, farmers have to sell their mature broilers at this weight which usually takes 4-

78

5 weeks to harvest. Between 320-350 million mature broiler birds are ready for

ultimate consumption as per 2010 data. The above information has been taken from in-

depth interviews with poultry executives from the case industry.

3.8 FORECASTED GROWTH OF BANGLADESH POULTRY INDUSTRY

There are no authentic sources for getting accurate data about broiler production in

Bangladesh. The main reasons for inaccurate data are improper and irregular data

maintenance by the government statistical bureau and optional registration of poultry.

Those rearing at least 1,000 birds in a flock are easily identifiable by middlemen or

agents. However, those rearing less than 1,000 birds are hard to trace as they may not

have attachments to distributors, feed producers or agents. Thousands of such farms

have been established by small farmers in their backyard, rooftop or on vacant land

near their home as a hobby or as an experimental case. It is assumed that the moderate

farmer will be able to have eight batches of birds in a consecutive cycle per annum.

Consecutive cycles depend on whether there are calamities (disease, natural disaster,

rapid growth or a fall in production) throughout the country. Each cycle lasts up to 4-

6 weeks with a few days’ break between cycles. Commercial poultry follows the “all in-

all out” rule which means that birds that came in together, go out for sale together.

Present and forecasted information from Boddington (2007) is presented on Table 3.7

to show the possible growth that can be achieved.

Table 3.7: Present and Forecasted Bangladesh Poultry (Boddington 2007)

Flock Size 2007 2010 2015 2020

Grandparent (GP) 111,111 127,000 197,800 343,779

Parent Stock (PS) 5,555,555 6,388,000 10,200,000 17,188.000

Day-old Chicks (DOCs) 364,000,000 598,500,000 962,850,000 1,608,000,000

Commercial Broiler 343,800,000 541,500,000 687,775,000 1,149,206,000

Integrated/Contracted

Broilers

2,000,000 8,122,500 229,000,000 383,068,000

Forecasted Consumption

(kg/year/person)

315,000,000

(2.25kg/hd)

582,000,000

(3.82/hd)

867,501,000

(5.19kg/hd)

1,448,200,000

(8.67kg/hd)

Chicken Required 333,333,333 570,000,000 917,990,000 1,532,275,000

79

The Bangladesh poultry industry is found to be substantially growing and has forecast

sustainable growth if surrounding circumstances remain same. For instance, there

were 127,000 grandparents in 2007 which is projected to increase to 343,779 in 2020.

Similarly, the PS breeders, DOCs, commercial broilers, contracted broilers and

consumption were also forecast with all results highly satisfactory in terms of the

growth rate. It is important for the Bangladesh poultry industry to maintain the pace of

growth to achieve sustainable growth along with minimization of the demand-supply

gap. The following section provides information about the case industry for this

research.

3.9 THE CASE INDUSTRY DESCRIPTION

This section describes the research case which is a prominent poultry parent stock

farm in Bangladesh. The current research has developed a model based on a case

industry. Consequently, more needed to be known about the case industry and its

history, market share, vision, production, supply chains, products and the technologies

used in their operation. In addition, farming under different calamities is also discussed

in this section.

3.9.1 Nahar Agro Limited – The Case Farm

The following discussion describes the research case industry. Elements discussed are

confined to vision, products, market share, farm management, capacities and

technology used by the case farm.

3.9.1.1 Nahar Agro Group

Nahar Agro Group is one of the largest organized parent stock (PS) farms in

Bangladesh. Their main breeds are Hubbard Classic, Cobb and Ross which are breeds

common to all other parent stock farms in Bangladesh. Presently, they have a number

of poultry sheds in three different places based in the Chittagong Division of

Bangladesh. Figure 3.13 shows the layout for one of the project unit located at

Mirarsharai, Chittagong, Bangladesh. The layout shows the location with the Dhaka-

Chittagong highway nearby and it is isolated from the nearest locality. Such a place is

ideal for poultry farming. They have chosen an isolated and well-protected area as

protection against possible disease outbreaks. The parent stock (PS) sheds are

environmentally controlled so that no wild birds or species can enter, and ventilation is

80

activated to regulate temperature. All farm employees live on the farm and a strict no

visitors' policy is enforced. Appendix D is added some pictures (taken from Mirarsharai

projects) to visualize how the farm look like.

3.9.1.2 Historical Background

Nahar Agro Group Limited is an agro-based industry which began operations in 1986

as a small-scale dairy and poultry rearing company. They formed an agro-based group

of companies that include dairy, poultry, fisheries and crops and vegetables. Poultry

and dairy are their main businesses in their roperation. Among them, poultry has been

the project with the highest investment since 1995. Nahar Agro is ranked within the

top ten in the poultry industry in Bangladesh. Nahar Agro Group is a family-owned

company that started operations in 1986 with 35 laying hens and 15 dairy cows. The

initial investment was around A$3,000. The present business is worth approximately

A$10 million excluding other associated businesses. The main initiator of this small

business operation was the late Tipu Sultan Mahbubur Rahman, who was an ex-officer

of Bangladesh Railway having worked there since 1963. After his death in 1994, his

wife, Shamsun Nahar, and two of his sons followed him into the business, inspired by

his motivation to operate livestock and agro-based businesses for the company’s profit

as well as for the country’s benefit. His elder son, Mohammad Rakibur Rahman Tutul,

with much motivation, has developed himself as an outstanding entrepreneur within

the limits of his capability. His younger brother has always backed the company with

his knowledge, time and hard-working attitude. They started adding new concepts

(technology, dynamic ideas and risk measurement) into their farming along with high

technology from the USA, France, China, India and Canada. At the same time, they

managed to get bank finance to develop their new projects which significantly helped

them with their business growth.

3.9.1.3 Vision

The vision of the case industry is simple: they want to be a market leader by achieving

sustainability and acquiring all the hi-tech (high technology) concepts in their existing

farming. Initially, they simply started their business and did not put much thought to

the impact of hi-tech, analysis of the supply chain and sustainability. Now, they are

trying hard to incorporate this knowledge in their farming operation to achieve

sustainability and stability as well as more market share to soon become a market

leader.

81

Highway

Shed 1

Control Poultry Shed

Chicks Grading at Hatchery

Shed 2

Hatchery

Shed 3

Shed 4

4-storied Shed 24-Storied

Shed 1

Biogas Plant

Napier Grass Land

Agricultural Land

Rail Network

Fish Culture

4-Storied Shed 1

Pond Area

Highway

Figure 3.13: Industry Layout (google map with reality) for Nahar Agro (Mirarsharai Project)

82

3.9.1.4 Market Share

It is difficult to be exact about the market share for the case industry as a developing

country like Bangladesh does not have any statistics with which to evaluate it. Private

agencies and newspaper reporters have accumulated relevant information about

existing production and operation of various poultry companies in Bangladesh. They

have prepared reports with approximate market shares and production targets. In this

way, concerned people can get an idea about an individual farm's production, scope

and market share. Currently, Nahar Agro Group has the highest chick production in the

Chittagong Zone (Chittagong is the second largest city in Bangladesh) and is ranked in

10th position among all poultry companies in Bangladesh. They are planning to

increase their business by at least 10-20% growth in every year subject to demand and

the situation with regard to calamities.

Table 3.8 presents a list of the top seven day-old broiler chick producing companies in

Bangladesh. Among them, Nahar Agro’s farm (the research case) is positioned as fifth

with its maximum capacity of 800,000 and production of 500,000 day-old broiler

chicks per week. Kazi (www.kazifarms.com) and CP (www.cpbangladesh.com) farms

are the leading companies in Bangladesh and produce more than 50% of the total

production of broiler chicks. It is noted that the case industry has two separate farms in

a different location for its parent stock farm, and the figure in Table 3.8 is the total for

both projects. These farms are named as Nahar Poultry Complex Limited and

Mirarsharai Poultry Farms Limited. This study has chosen Nahar Agro Complex Limited

for the modelling purpose.

Table 3.8: Top Seven Day-old Broiler Chick Producing Companies (Kabir 2013)

SL No. Hatchery Max. Capacity

DOC/week

Current DOC

Production/week

1 Kazi 3,662,320 2,200,000

2 CP 2,500,000 2,300,000

3 Nourish 1,416,400 1,200,000

4 Aftab 1,000,000 650,000

5 Nahar Agro 800,000 500,000

6 Paragon 742,000 500,000

7 MM Agha 600,000 450,000

83

Table 3.9 presents the market position for day-old layer chick production in

Bangladesh. Nahar Agro is positioned third among all the layer chick farms in

Bangladesh. The current study did not consider layer chicks and confined the study to

broiler chicks. There is a significant difference between broiler and layer farming. Layer

farming collects eggs daily while broiler farming produces meat. The supply chain

network, farming procedure and life cycle are significantly different between the two

types of farms.

Table 3.9: Top Layer Chick Producing Companies in Bangladesh

SL No. Particulars Max. Capacity DOC/week Current DOC/week

1 Kazi 260,000 250,000

2 CP 300,000 200,000

3 Nahar Agro 100,000 75,000

4 Paragon 500,000 75,000

5 Nourish 70,000 65,000

6 Phenix Hatchery 65,000 60,000

7 Goualondo Hatchery 50,000 40,000

3.9.1.5 Market Coverage

The market coverage of the Nahar Agro Group is mainly based in the Chittagong Zone,

with Chittagong, the second largest city in Bangladesh, having an effective seaport.

Chittagong is one of the fastest growing cities in the world (Citymayors 2013; Xfinity

2013). A major commercial and industrial centre, the city also has a globally

competitive special economic zone (Dailystar 2012). With major infrastructure projects

being undertaken in the city, including a deep-sea port, regional neighbours of

Bangladesh, including India and China, have eyed Chittagong as a future regional transit

hub (Indianexpress 2011). The above information reveals that Chittagong has

tremendous prospects in the business sector. In addition, Nahar Agro covers markets

for their chicks in Comilla, Vairab, Dhaka, Rajshahi, Bogra, Khulna and Sylhet regions.

Dhaka and Chittagong Divisions hold more than 70% of the broiler market and the rest

of the market share is distributed among the other divisions in Bangladesh. Table 3.10

supports the above statement.

84

Table 3.10: Poultry Production per Division (BBS 2009; Dolberg 2008)

Division Number of

Commercial Poultry

Percentage (%)

Barisal 1001077 4.6

Chittagong 4281804 19.6

Dhaka 11634021 53.3

Khulna 1668594 7.7

Rajshahi 2052593 9.4

Sylhet 1171560 5.4

Total 21809649 100.00

3.9.2 Nahar Products

The product line for the case industry is discussed in the following sections.

3.9.2.1 Day-old Broiler Chicks

Nahar Agro Group is the producer of the following breeds: Hubbard Classic from

France, Cobb-Vantress 500 from the USA and Ross 308 from the USA which are

acknowledged to be the best broiler breeds in the world. The Hubbard Classic and Cobb

broiler chicks of Nahar Agro are considered among the best-performing chicks in the

domestic market, and are sold through a long forward supply chain network. The other

breed is also popular in the day-old broiler chick market.

3.9.2.2 Day-old Layer Chicks

Nahar Agro Group is also the producer of and distributor for Shaver 579 breed day-old

layer chicks in Bangladesh. Hy-line International of the USA is the oldest poultry

breeding company in the world, and is the leading breeder of layers.

3.9.2.3 Various By-products

The main products of the case industry are day-old broiler and layer chicks. In addition,

they produce a number of by-products from poultry wastes generated from their farm.

Biogas, fertilizer and fish feed are the main valuable by-products generated from

wastes.

85

3.9.2.4 Other Products

Day-old chicks are the core products of the case industry. The case farm produces eggs

which are mainly used for hatching chicks. A good percentage of eggs either remain

unhatched or are rejects at the hatchery and farm level, respectively. They are sold to

the nearest bakeries to make confectionery goods such as biscuits, cakes, etc. Moreover,

they sell the aged parent birds for meat consumption in the open market through

middlemen. A huge amount of meat is produced at the end of life of a mature parent

flock. A flock size can be more than 50,000 birds at a time. For instance, a mother

parent grows up to 4 kg at the end of their productivity life cycle.

3.9.2.5 Production Status of Various Products

Table 3.11 displays statistics of various products produced within the farm. Parent

chicks are imported or locally collected: they then grow at the farm from day-old chicks

to the maximum age of 70 weeks. The number of parent chicks, mature parent and day-

old chicks, and the amount of biogas, fertilizer and fish feed for nine different weeks are

shown on the table. It is observed that parent chicks are maintained at around 120,000

while mature parents are around 170,000 to produce the desired amount of

approximately 420,000 day-old chicks. On the other hand, weekly biogas production is

around 36,000 cubic metres (cm2) followed by an average 1.7 tonne of fertilizer and

2.75 tonne of fish feed. The figures on Table 3.11 show the perceived knowledge about

the farm production capacity of various products.

Table 3.11: Production of Various Products for Particular Periods

Week Parent Chicks

Mature Parent

Chicks Biogas

(CM2)

Fertilizer

(Tonne)

Fish Feed (Tonne)

1 120890 170158 413926 36,579 1.70 2.75

2 120896 170873 419833 36,618 1.70 2.74

3 120902 169888 423896 36,540 1.72 2.73

4 120907 172903 428991 36,579 1.60 2.75

5 120913 167018 423866 36,066 1.58 2.73

6 120919 170933 417377 35,947 1.55 2.70

7 120924 167948 413836 35,813 1.55 2.69

8 120930 165963 410088 35,774 1.60 2.69

9 122936 162408 403806 36,124 1.62 2.71

86

3.9.3 Sources of Day-Old Parent Stock

Initially, Nahar Agro imported their day-old chicks’ parent stock from different

countries like France, USA, Canada and Australia. A significant percentage of chicks died

while travelling thousands of miles to reach their destination. Moreover, local roads

and highways are not structured well for travelling towards the destination farm from

local airports. Altogether, travelling to the destination farm from the country of origin

was more difficult and costly than expected. Furthermore, the local environment was

completely opposite to the original country in terms of climate, humidity and

temperature. To prevent this travelling disaster, Nahar Agro decided to rear some

flocks from birds locally produced from different GP farms. These farms, named as

grandparent (GP) farms, imported day-old GP chicks from different developed

countries to produce day-old parent stock chicks. Table 3.12 provides details of GP

farms’ names, population and production per week. These chicks are better habituated

to the existing environment because their preceding genetic (GP) mother grew up in

the same environment. Breed collection from the same environment has better

resistance than imported birds which come from other countries. Noticeably, different

countries have different climate conditions which create adjustment problems for the

parent bird. Change of climate may also hamper the production and life cycle of the

birds. Currently, Nahar Agro is close to being self-sufficient in local GP farming and PS

chicks.

Table 3.12: Broiler Grandparent Farms (2010)

Name Origin List of GP Population Production/

Week

Aftab GP

Farms Ltd.

France Hubbard Classic 20,000 15,000

France/USA France/USA Ross-308, Cobb-500 20,000 25,000

Kazi GP

Limited

USA Cobb-500 30,000 40,000

Kasila

Bangladesh

USA Cobb-500 15,000 10,000

Paragon GP

Limited

France/USA Hubbard Classic 24,000 30,000

Rashik GP Germany Lohman-Meat 15,000 10,000

87

There are a few companies that are distributing local parent stock (PS) to breeder

farms situated in different parts of Bangladesh. Different breeds like Isa Brown, Shaver

Brown/White/Black, Lohmann, Hisex Brown/White, Hubbard, Bovan’s Goldline and

Colored Broiler are used in trade with breeder farmers. Table 3.13 presents a list of

major parent stock marketing companies and their breeds’ original country, types of

birds and breed name. The case industry is also listed as it deals with the mother chicks

as a mediating company.

Table 3.13: Parent Stock Marketing Companies (2010)

Name Imported From Type List of Parent Stock (PS)

Advance Bio-

products Limited

France,

Netherlands,

Canada

Layer ISA Brown,

ISA White

Ample Animal

Care

Netherlands,

France, Canada

Layer

Broiler

Shaver Star Cross 579 Brown,

Shaver White, Shaver Black,

Advance Animal

Science Co. Ltd.

Germany Layer

Broiler

Lohmann Brown Classic/Lite, Lohmann

White (Lohmann LSL Lite), Lohmann

Indian Runner (LIR)

Bengal Overseas

Limited

Netherlands,

France, Canada

Layer Hisex Brown and White, Bovan’s

Brown and Goldline, Bovan’s White-

Nera-Gold, Dekalb White and Black

Poultry

Consultant & Dev.

Services

France, USA Layer

Hubbard

Broiler

Novogen Brown, Novogen White,

Hubbard Classic, Hubbard HI-Y, Flex,

Colored Broiler

Novelty Animal

Health

Germany Layer Brown Nick, Brown Nick, Brown Egg

Layer Brown Nick, White Egg

Nahar Agro Group France, USA Broiler

Layer

Hubbard Classic, Shaver Brown Layer

3.9.4 Farming under Different Calamities

The Bangladesh poultry industry has to face many calamities in their operation. The

researcher found two types of calamities: natural and man-made/control calamities.

Poultry disease and natural disaster belong to natural calamities and over/under-

production, market demand, government policy and competitors’ actions are under

man-made calamities. Bangladesh is a densely populated country with a small area of

88

land for living and cultivation. Moreover, there are no specific industrial policies to

isolate poultry zones from the community.

3.9.4.1 Poultry Disease

Poultry disease is one of the major problems in Bangladesh, and a number of farmers

are victimized every year. Standard market demand-supply is often influenced by

disease outbreaks. Ultimately, this creates direct and indirect negative impacts on

society and the economy (Dolberg 2008). Thus, special measurement and emphasis

should be given on preventing poultry disease. At the same time, farmers need to learn

about scientific farm management, farm biosecurity and preventing particular diseases.

According to Rahman (2013a), poultry can be contaminated with disease from the

community or marketplace by ignorant behaviour about waste management and

improper vaccination. The Bangladesh poultry industry loses millions of dollars every

year due to various kinds of common disease along with the new phobia of bird (avian)

flu. However, bird flu is not as dangerous as expressed in the print and digital media

and by the general public. There is absolutely no risk if chicken meat is boiled at over

40 degrees centigrade. The only risk is when someone eats bird flu-affected raw

chicken meat or eggs (Avlicino 2007). Table 3.14 provides statistics on the number of

farms and poultry birds affected by avian influenza.

Table 3.14: Farms and Poultry Birds affected by Avian Influenza (AI)

Year Total Districts Affected

Number of

Farms

Total Birds in Poultry Farms

Deaths Culling

Commercial Backyard

2007 20 68 205160 35076 136426 33708

2008 44 227 1296687 243005 975373 81769

2009 16 32 48810 3687 42281 3047

2010 13 30 191659 18004 173516 139

Total 357 1742316 299772 1327596 118663

3.9.4.2 Natural Disaster

Bangladesh is a low-lying riverine country having high risk of flood, cyclone, river

discharge, storm surges, tidal interactions and other types of disasters (Ali 1999;

Wisner 2004). Bangladesh is a country at high risk of natural disaster which hampers

89

various kinds of businesses every year. The poultry industry is no exception. Market

demand and supplies are completely affected by natural disasters when they occur. In

the event of a massive flood, a huge number of poultry farms have to stop production

due to their farm areas being washed away or under floodwater. Farmers lose their

capital forever as no insurance cover is available for them. Thousands of farmers are

never able to recommence farming due to inadequate sources of further finance. Others

somehow manage with funds from financiers, friends or personal loans at high interest.

In this way, some are successful while others are not. Nevertheless, those who carry on

their businesses within the vicissitudes of calamities ultimately achieve success in

terms of profitability.

3.9.4.3 Over/Under-production

Over-production and under-production are major problems for the poultry industry of

Bangladesh. Poultry production is a business which is always controlled by the natural

cycle. The natural cycle is one in which the production cycle cannot be manipulated

(reduced or deviated from), such as the 21 days that are needed to hatch an egg. When

a farm forecasts their future production, they write out their plan in such a way that

this forecasted production would become a reality in the near future. Once a flock was

started at their farm, it must be carried on through to completion as no one could stop

the chicks growing or the farm’s production. This is why the industry has under- and

over-production based on market volatility. Market volatility relies on the trend of

chicken and egg consumption by the general public. The consumption of eggs and

chicken is also linked to seasons, festivals and the frequency of social events such as

weddings, birthdays and post-wedding parties. In summer, chicken consumption is

higher than that of the red meats, beef and mutton. Again, when poultry disease breaks

out, people panic which leads to drastic falls in chicken-related product consumption.

Bangladesh is a country of hospitality and events involving social gatherings are

frequently part and parcel of the lives of Bangladeshi people. Frequent social events

create demand for more chicken. Above all, these situations and events are uncertain: it

is difficult for farmers to predict exact demand arising from these circumstances.

Moreover, there are no statistics that predict the current number of farmers, their

capacity and possible immediate production. This is why farmers face over- and under-

production circumstances. However, under-production provides extra profit but, at the

same time, misses the opportunity to make a higher volume profit. On the other hand,

90

in the case of over-production (a low demand situation), farmers are crushed by drastic

falls in the prices of chicken and eggs also leading to an uncertain future. In that

situation, they have to carry on their business although they start losing their capital. In

fact, other factors such as disease, retail consumption tendencies and seasonality are

also responsible for lost capital. For example, the outbreak of bird flu in 2007 closed

two-thirds of the country’s poultry farms which led to half of the five million people

within this industry also being victimized (IRIN 2013).

3.9.4.4 Government Policy

The Bangladesh government’s Livestock Policy from 2007 is critical to the biosecurity

situation stating that: “[w]hile the growth of the poultry industry has contributed to

economic growth and income of commercial farmers, indiscriminate and unplanned

growth of breeder farms and commercial poultry farms, particularly in and around

cities and towns is creating environmental hazards. There are at present no guidelines

for environmental protection and bio-security when establishing poultry farms. The

use of antibiotics in feeds is thought to be common and a cause of public health

concern” (GOB 2007, 9). This statement is about environmental hazards; however, the

government has never provided proper logistics support or consultancy to implement

this policy. Bangladesh poultry policy is mostly concerned with environmental and

import issues via legal methods or smuggling from the neighbouring country of India.

According to the Government of Bangladesh (GOB), the import of all kinds of poultry

eggs is banned. The same applies to chicks, except day-old chicks of parent stock

(mother of broiler chicken) and grandparent stock (mother of parent stock) (GOB

2009). It is however, legal to import poultry feed. These restrictions are because

poultry meat and egg prices tend to be lower in India than Bangladesh. For instance,

the price of broilers in India was reported to be US$1.35 per kg in Mumbai against

US$1.82 in Bangladesh (June 2008). For eggs, the price in India was US$4.70 per 100

(www.wattpoultry.com) against US$7.30 per 100 in Bangladesh (GOB 2007). This is

why smugglers attempt to push their products from the other side of border to make

extra profit. Poultry entrepreneurs are always complaining about the effect of imported

eggs, chicks and breeder parents. If these are imported from other countries, local

businesses cannot beat them through price. Thousands of poultry businesses finally

shut down for the above-mentioned reasons every year.

91

Recently, the government did not take appropriate initiative to control the existing

market supply and demand creating an imbalance of market supply. The government

made the almost suicidal decision to invite nine giant foreign companies to do business

in the local market. Local companies are now really struggling to compete with them in

terms of capital, technology and market coverage.

3.9.4.5 Competitors’ Actions

According to The Financial Express, nine different foreign companies have managed to

get permission from the Bangladesh government to open their businesses. In addition,

foreign companies have taken loans from overseas financial organizations at a 4-5%

interest rate while local farms are managing loans at interest rates of 14-16%. This

pushes up the ultimate production cost for local companies. Local poultry farmers do

not welcome foreign competitors and foreign investment as such a policy will destroy

the country’s local poultry industry. In total, 0.15 million poultry farms would be

committed to meeting the local demand for meat and eggs if they could avail

themselves of better policy, financing and logistics (Boddington 2007)

www.thefinancialexpress-bd.com).

In the past couple of years, the government has allowed India’s leading companies of

Venkitashire, Suguna, Amreeta and Godrej to open their businesses which will be a

complete disaster for local farm owners and processors (EFeedlink 2011). Local farm

owners have assured that they are very much capable of producing 80-90 million day-

old chicks per week which is the country’s current demand. They also added that they

were currently producing 320,000 metric tonnes of meat and five million eggs annually

having BDT 120 billion (A$1.6 billion) in investments through 150,000 poultry farms

and direct employment of 3.5 million people. At the same time, the bird flu of 2007-08

resulted in a BDT 50 billion (approximately A$700 million) loss and 2.5 million people

became jobless (National-Chicken-Council 2012). In this situation, the Bangladesh

government has recently allowed foreign investors to invest in this sub-sector without

judging the possible impacts on local farmers and processors. Such decisions may be

suicidal for local investors due to their financial incapability compared to foreign

investors.

92

3.9.4.6 Market Demand

The poultry industry in Bangladesh is expanding rapidly. A parent population of

5 million produces 52 million day-old chicks a year and the annual growth rate is 15-

20%. Broiler meat production is currently at 2.2 million tonnes a year, with 300 million

eggs produced. Despite this rapid growth and with the emergence of a new breed of

young entrepreneurs, there is still a great demand for poultry meat and eggs. The

country has a population of 14 million people who need a daily protein requirement of

70-100 grams. Currently, the average poultry meat consumption is just one kilogram a

person a year, while just 28 eggs per person are eaten each year (Hunton 2001).

However, major challenges are that the supply of hatching eggs from imported breeds

does not meet the demand, resulting in chicks of inferior quality being hatched or

illegally imported. In the feed industry, the majority of ingredients (estimated at 80%)

have to be imported, and since most feed mills are small and independent, the cost of

imported materials is very high. This leads to the use of inferior ingredients and

subsequently the poor performance of commercial birds. Such problems are not

surprising in such a rapidly expanding industry. Previous data revealed that day-old

chick numbers increased from 39.5 million (from 31 hatcheries) in 1998 to 106 million

(from 42 hatcheries) in 2000. Layer parent stock was expected to double in number

from 1999 levels by 2005, and broiler parent stock to increase five-fold in the same

period (Hunton 2001). Table 3.15 supports the above statements.

Table 3.15: Demand Projection for Poultry Products (Islam 2003)

Poultry Products by Type

Base Year

2000

Projection for Poultry Products Over

the Next 20 YeaErs

2005 2010 2015 2020

Poultry Eggs (Million)

Scavenging

Layer (Commercial)

Total

1323.08

1683.92

30007.00

1912.57

2434.18

4346.75

2146.10

2731.40

4877.50

2374.59

3022.20

5396.79

2581.15

3285.10

5866.25

Poultry Meat (‘000 Tons)

Scavenging

Layer (Commercial)

Broiler (Commercial

Total

90.42

67.22

14.27

171.91

119.60

88.91

18.87

227.38

134.27

99.81

21.19

255.27

148.62

110.48

23.45

282.55

161.62

120.14

25.50

307.25

93

3.10 SUMMARY

This chapter has discussed two different aspects: the Bangladesh poultry operation and

the research case description. Firstly, this chapter discussed details of the existing

status, trends, scope and contributions of the industry; this was followed by discussion

of the Bangladesh poultry supply chain, modern poultry operation, commercial breeds,

broiler meat production and other relevant matters. This information revealed the

importance of the poultry sub-sector for the Bangladesh economy and its people.

Poultry is also the cheapest protein source for the Bangladesh community and the

industry continues to make a consistent contribution to the country’s GDP and

employment creation. The second phase discussed the research case’s description in

light of their mission, vision, market share, products, current production and

technologies for maintaining sustainable farming. These sections also discussed various

calamities and factors which need to be addressed in order to have successful farming.

This information helps the understanding of the whole operation of the case farm

among other giant farms in Bangladesh. Hence, the chapter has presented the

Bangladesh poultry operation and the case industry description to further develop

knowledge on both. The next chapter discusses the research methodology used in this

study.

94

CHAPTER 4:

RESEARCH METHODOLOGY3

4.1 INTRODUCTION

The purpose of this chapter is to present the research methodology used to conduct the

current research with particular emphasis on the fundamentals. The chapter also

discusses the issues relating to the research methodology, research design and

research tool of the study (Bonoma 1985). Numerous authors have defined research

methodology as systematic investigation to explore the facts or principles or to collect

proper information through appropriate investigation based on specific research

objectives and questions (Tress, Tress, and Fry 2006; Ritchie and Lewis 2003; Bernard

2012; Denzin and Lincoln 2011; Wilkes and Krebs 1995). The relationship between the

research context, methodologies and process can be conceptualized through a research

framework. Consequently, this study used case study, system dynamics and design

science methods to attain the research goals. This chapter also explains the details of

the adopted methods under the positivist paradigm that includes the rationale and

justification behind using them to conduct this research.

4.2 RESEARCH PARADIGM

The research paradigm has been defined as “a broad view or perspective of something”

(5Taylor, Kermode, and Roberts 2006). An explanation of the paradigm also exposes

how a research study could be accomplished and directed by a particular paradigm

(Weaver and Olson 2006). In addition, paradigms are the practices and processes to

3 Parts of this chapter have been published in the following publications:

a) Shamsuddoha, Mohammad, Desmond Klass, and Mohammed Quaddus. 2013. "Poultry Wastes Reuse to Achieve Environmental Sustainability." In Australian and New Zealand Academy of Management (ANZAM), Hobart, Australia, 52-59. Australia

b) Shamsuddoha, Mohammad, Mohammed Quaddus, and Desmond Klass. 2013a. "Sustainable Livestock Farming for Improving Socio-Economic Condition " In 3rd International Forum & Conference on Logistics and Supply Chain Management (LSCM), Bali, Indonesia, 107-116.

c) ———. 2013b. "Sustainable Poultry Production Process to Mitigate Socio-Economic Challenge." Humanomics

d) ———. 2013c. "A System Dynamics Approach for Poultry Operation to Achieve Additional Benefits." In Winter Simulation Conference 2013 Washington DC, USA, 35-43. http://www.wintersim.org/.

95

accomplish an investigation following proper methodological aspects. Similarly, a

paradigm offers a conceptual framework which reflects how a research study is

designed, how data are collected and interpreted, and how the findings are presented

(Myers 1997). There are two main underlying paradigms that researchers commonly

use to conduct their research: the positivist and interpretivist research paradigms

(Mingers 2001; Onwuegbuzie and Leech 2007; Mingers 2003; Orlikowski and Baroudi

1991; Dwivedi 2007). The most popular definitions for these two paradigms are as

follows:

Positivism research philosophy is defined when a phenomenon being studied has

a stable reality measurable from the outside by an objective observer (Gerring 2007;

Pervan 1994; Bernard 2012; Straub, Boudreau, and Gefen 2004).

Interpretivism is described as a research philosophy interested in human

meaning in social life and in its clarification and description by the academic (Erickson

1985; Denzin and Lincoln 2011).

Positivism is associated with the quantitative research method and research

philosophy (Johnson and Onwuegbuzie 2004; Cresswell 2003) that uses information

that flows from a logical and mathematical stream of valid scientific process

(Fairclough 2003; Larraâin 1979). At the same time, data and information are gathered

from empirical evidence to justify and validate the ongoing research (Cohen, Manion,

and Morrison 2011). Furthermore, positivist research uses formal propositions,

quantifiable measures of variables, formulation of hypotheses, hypothesis testing, and

drawing of inferences about a phenomenon from the sample to a stated population

(Orlikowski and Baroudi 1991). According to the above literature, the positivist

paradigm deals with quantitative research as used in the current study. On the other

hand, the interpretivist approach aims to develop a natural science through social

interpretation (Neuman 2005). Therefore, the interpretivist researcher sees the reality

and thus has to plunge into the actor’s mind by feeling, hearing and observing how the

actor interprets a thing (Schwandt 1994). In terms of research design, qualitative

research is normally adopted by interpretivist researchers (Creswell 2003). To

understand more accurately, descriptions of research methodologies are presented in

Table 4.1. In reviewing previous literature, it was found that most studies either

followed a mono-method approach (such as a positivist (quantitative) or interpretivist

(qualitative) paradigm) or a mixed method approach. The current study is no exception

to the common practice of conducting research in various fields. However, the nature of

96

the current study matches quantitative research under a positivist paradigm. Thus, a

positivist paradigm has been adopted for the sake of accomplishing the study.

Table 4.1: Research Methodologies and Paradigms (Pervan 1994; Maliapen 2003; Galliers 1993)

Paradigm

Research

Methodologies

Description

Po

siti

vism

Laboratory

Experiments

The study includes accurate relationships between controlled variables with participants to solve an artificial problem.

Field Experiments An experiment is involved with participants for solving a real problem. A small number of variables are used to solve the problem.

Survey A snapshot of opinions or a real-world situation at a particular point in time, usually utilizing a questionnaire to all participants and analysed using statistical methods.

Case Studies A planned and focused investigation of hypothesized relationships in one or more organizations. A researcher acts as an observer. A large number of variables are involved with little or no control.

Theorem Proof The development and testing of theorems through mathematical modelling of situations in which truth is derived based on a well-specified set of derivation rules.

Forecasting The use of various extrapolation methods to take facts and/or opinions using particular assumptions in order to deduce future outcomes.

Simulation An investigation of behavior in a system which is an idea of the real world with some controlled variables, but not to the extent of a laboratory experiment.

Inte

rpre

tivi

sm

Subjective/

Argumentative

Reviews

An expression of the views of the research(s) based mostly on opinion and speculation derived from a range of experiences or reviews of literature.

Action Research An investigation of relationships in one or more organizations where the research is involved and the researcher's impact must be acknowledged and identified.

Descriptive/

Interpretive

Research based on the researcher's interpretation of situations, events, phenomena, previous literature or past developments.

Future Research Similar to forecasting.

Role/Game Playing

Similar to simulation.

97

Instead of positivism and interpretivism, the terms quantitative and qualitative

paradigms are used by some researchers (Wholey, Hatry, and Newcomer 2010;

Neuman 2005; Erickson 1985). The quantitative paradigm is an outcome-oriented

approach and focuses on natural science world views. Laboratory experiments, field

experiments, surveys, case studies, theorem proofs, forecasting and simulation are

classified under positivism, whereas subjective/ argumentative reviews, action

research, descriptive/interpretive, future research, and role/game playing are found

under interpretivism. The current research is found to fall under the positivism

approach. The next section deals with the research methodologies employed in the

current research.

4.3 RESEARCH METHODOLOGIES

Studies use research methodology, a combination of a continuing process, methods and

tools for conducting research, to inform their readers exactly how they intend to

undertake their research and how to lever the data. This current study also employed

design science research (DSR) methodology, system dynamics (SD) and the case study

approach with the support of computer simulations. These research approaches

provide valuable feedback to one another. For instance, the design science

methodology is used to design an extended supply chain model for a particular case

industry following the system dynamic process.

4.3.1 Research Design for System Development

Research design covers the methodology and procedures engaged to conduct scientific

research (Yin 2009). The design of a research study defines the study type (such as

qualitative, quantitative or descriptive) and its data collection methods and an

analytical plan (such as statistical, mathematical or simulation analysis)(Cohen,

Manion, and Morrison 2011; Yin 2009). This study adopted system dynamics and

quantitative methodologies with the support of a simulation tool to generate analyses

of the proposed supply chain process model.

Figure 4.1 demonstrates how a case study follows system dynamics methodology to

develop and use computer simulation to accomplish required tasks. The system

dynamics approach needs to be used to develop the concept, to undertake further

amendment or alteration and then evaluate the impacts on stakeholders due to

98

changes. Research has been conducted on a particular case industry using system

dynamics, such as health care (Maliapen 2003), banking (Intrapairot 2000), energy

(Rodríguez et al. 2002) etc. This study examined a poultry supply chain process which

has not previously been examined by academics using such rigorous methodology.

Thus, this study attempted to fill the gap in this field in particular, and structured

poultry operation in general.

Case Study(Nahar Agro)

Design Science Methodology

Computer Simulation

System Dynamics Approach Concept

Development Impact

Figure 4.1: System Dynamics, Case Study and Simulation (Nunamaker and Chen

1990; Forrester 1994b; Maliapen 2003)

4.3.2 Design Science Methodology

In this study, the research paradigm of positivist ontology, empirical epistemology and

quantitative methodology is used based on a real case of the poultry supply chain

process. Under quantitative research, ‘design science’ methodology was chosen for this

study. Historically, design science research emphasises the expansion and performance

of (designed) artifacts with the explicit intention of improving performance (Peffers et

al. 2008; Peffers et al. 2007). This methodology can be applied in a process model for

the sake of improving the system. Design science is concerned with ‘devising objects or

variables to attain goals’ (Simon 1969; Sein et al. 2011). March and Smith (1995)

focused on two main activities of design science research (DSR): firstly, building an

artifact and, secondly, evaluating it. They described four types of design science

products: constructs, models, methods and implementation (March and Smith 1995;

99

Hevner and Chatterjee 2010) adding that the artifact (variable) is the component used

in designing and developing soft or hard objects that can meet a specific research

purpose and goal.

In addition, DSR can be used to design a model where a new or improved technology

and processes are invented (Venable 2006b, 2006a; Venable 2010). Therefore, DSR is

about innovation that includes derivation, design, development, construction,

prototyping or other ways of creating something new. Methodologically, DSR falls

under the positivist category (Venable 2010). In comparison with information system

(IS) researchers, DSR helps to understand reality, and attempts to create artifacts that

serve human purposes for better structural design (Peffers et al. 2008; Simon 1969). To

support this, Hevner, March, Park, and Ramet (2004) proposed seven guidelines for

DSR: design as an artifact, problem relevance, design evaluation, research

contributions, research rigour, design as a search for new process and communication

of the research. Similarly, Hasan (2003) defined design and development research as a

further development and improvement of a product or program. In an experiential

view, Richey and Klein (2007) specified DSR as the systematic study of design,

development and evaluation processes on an empirical basis. In this current study’s

context, the researcher has found similarities with this design-based methodology.

Therefore, design science is used as the methodology to examine the Bangladesh

poultry process to redesign the integrated supply chain for targeting better outputs.

The system dynamics (SD) research process (method) is also involved in undertaking

the current research. The next section discusses the system dynamics (SD) method and

its operation.

4.3.3 Operation of System Dynamics

System dynamics is gaining popularity at an impressive exponential rate due to its

unique ability to exemplify the practical world. Moreover, it can handle the non-

linearity, feedback loop structures and complexity that are integral parts of a system

that may belong to the society and industry or any type of agency (Forrester 1994b).

System dynamics (SD) deals with a system which is interconnected with its associated

components/variables through cause and effect over time (Deaton and Winebrake

2000; Elshorbagy, Jutla, and Kells 2007; Pathak et al. 2007; Hjorth and Bagheri 2006).

The cause and effect between the variables makes a feedback loop. The feedback

principle in SD requires the flow of information to be communicated between the

100

various components within the system (Nurse 2008). Jay Forrester (1961) from

Massachusetts Institute of Technology (MIT) first introduced system dynamics by

writing ‘Industrial Dynamics’. System dynamics consists of the two key words ‘system’

and ‘dynamics’. A system is a collection of mutually interacting, consistent and inter-

reliant mechanisms that affect the whole structure of the system (Karnopp, Rosenberg,

and Perelson 1976; Deaton and Winebrake 2000). Dynamics can be termed as the

degree that defines any change over time (Carlsson et al. 2002). Hence, system

dynamics is a technique to conceptualize the structure in the system where the

components within the system are connected in such a manner that they form feedback

loops, thereby representing the overall behaviour within the system (Maliapen 2003;

Krasner 1984). From the modelling viewpoint, Radzicki and Taylor (Radzicki and

Taylor 2008) expressed SD as a mathematical modelling technique and a dynamic

methodology for constructing, perceiving and describing complex problems.

Structurally, SD incorporates feedback information, causality and non-linear

relationships (Williams and Hummelbrunner 2010; Cellier 1991).

To build an interactive model, a causal loop (cause–effect or influence) diagram needs

to be constructed when following SD methodology (Sterman 2000). In an SD-based

simulation model, there are two types of feedback loop, named as the positive and

negative feedback loop (Sterman 2000, 14). To capture the feedback mechanism of a

system, negative (balancing) or positive (reinforcing) feedback loops are to be

determined (Sterman 2006; Maliapen 2003). In a positive feedback loop, linked

variables are repetitively increasing or decreasing their values. In a negative feedback

loop, linked variables and their values only decrease from the previous value (Sterman

2000; Wolstenholme 1990). At the same time, the negative feedback loop reveals goal-

seeking behaviour affected by disruption(s) when the system pursues an equilibrium

situation (Sterman 2006; Maliapen 2003). The qualitative (causal) loop contributes two

important roles in SD modelling. Firstly, it helps to construct preliminary hypotheses

(cause–effect relationship with variables) during the model development and secondly,

it can create a straightforward representation of a SD model (Vlachos, Georgiadis, and

Iakovou 2007; Georgiadis, Vlachos, and Iakovou 2005; Wolstenholme 1990). There is

debate about constructing a causal model prior to building a stock and flow model

although it can be done in either order (Sterman 2001; Forrester 1994b; McDoland

2013). Hence, the current research has constructed a causal model first then has built a

stock and flow model.

101

The structure of an SD model contains stock (state) and flow (rate) variables which

represent accumulations (i.e. inventories) and flow variables (i.e. order rate) in a

system (Sterman 2000; Wolstenholme 1990). Principally, the stock and flow model

(quantitative) is built based on a causal loop diagram and connected with interrelated

variables of the model (Sterman 2001). In this phase, the mathematical representations

are given input for connected variables to run the system in a simulation environment.

(Sterman 2000; Wolstenholme 1990). The mathematical equations are formed based

on the real-life relationship between the variables or how the system flow works

moving forward and backward. Nowadays, high-level graphical simulation programs

(such as iThink, Stella, Vensim and Powersim) support the analysis and study of these

systems (Chaerul, Tanaka, and Shekdar 2008). Alternatively, a final version of the stock

and flow model can draw a causal model using research tool (simulation) facilities. To

understand the relationship between the SD model and simulation, the following

section discusses simulation modelling techniques.

4.3.4 Simulation Study under System Dynamics

A simulation study constantly answers a "what if?" inquiry for different imaginary

situations. Such epidemiological studies typically inquire about the bias, precision and

accuracy of estimators, confidence intervals and statistical tests (Maldonado and

Greenland 1997). Several things can possibly be done through simulation, for example,

examining the impact of variable selection (Maldonado and Greenland 1997); model-

form selection (Maldonado and Greenland 1993); model-form misspecification

(Maldonado and Greenland 1997); misclassification (Thomas 1995); missing-data

processes (Greenland and Finkle 1995); hierarchical regression (Witte and Greenland

1996); and factoring (Maldonado and Greenland 1998). Therefore, it is evident that

simulation can do significant analyses which are able to play a strong role in any kind of

quantitative research. The facility of simulation has inspired the current study’s

researcher to deploy it to develop a suitable supply chain model and to conduct

analysis and forecast the futuristic scenarios of the poultry industry. A case study can

help to build a supply chain system through simulation tools to do further examination

for better outcomes (Meredith 1998). To accomplish simulation modelling, the current

study used the case study method to draw a supply chain model.

102

4.3.5 Definition of Case Study

Case study is defined as an empirical/practical investigation that inspects a current

phenomenon within its real-life context (Yin 2003). A case study is used to cover

contextual conditions because they might be highly pertinent to the phenomenon being

studied (Yin 1994). Furthermore, case study can be called upon as the research

methodology which can focus on understanding or investigating relationships in either

one or many organizations (single or multiple cases). Therefore, it can be used for

many purposes, including providing description, testing theory and generating theory

(Yin 2009, 1994; Yin 2011; Yin 2003). Thus, a study can produce multiple levels of

analysis within a single case using combined sources of data collection such as archives,

interviews, questionnaires and observations. However, based on this research strategy,

the researcher is an observer, and a large number of variables are involved with little

or no control. Outcomes derived from a case study can be either qualitative or

quantitative or both (Eisenhardt and Martin 2000; Galliers 1993; Galliers 1992). The

next section provides justification for choosing the case study method for the SD model.

System dynamics (SD) models have been used for the improvement and analysis of

complex systems for the past two decades (Lyneis and Ford 2007). Moreover, SD

models enable the handling of strategic management decisions and plans (setting the

schedule, delay, budget, structure, process model, etc.) for any complex system for a

business or projects based on past behaviour of projects (Lyneis, Cooper, and Els 2001;

Lyneis and Ford 2007). Normally, a case study is used to investigate organizational,

managerial and operational processes within an organization to gain more holistic and

meaningful characteristics of real world events (Courtney 2001). It also assists with

explaining what is really occurring, producing relevant propositions which can be

tested in a more rigorous fashion (Andersen, Richardson, and Vennix 1997; Coyle

2000). For example, Wolstenholme (1990) used qualitative modelling to study the

unintended effects of policy on the delivery of community care. The current research

used the case study method to accomplish the research objectives and questions.

4.3.6 Integration of Design Science, System Dynamics and Case Study

The above discussions have clearly described design science (DS) methodology, the

system dynamics (SD) method and case study. This current study has attempted to

integrate these three methods to accomplish the research objectives. This study used

DS methodology to extend and upgrade the current poultry supply chain through

103

integrating forward and reverse supply chains. The SD method was deployed so its

rigorous process could be adopted for developing and analysing the simulation model.

Obviously, the research has been assisted by a poultry industry case study to develop a

supply chain model. Thus, the research design for this study follows system dynamics

(SD) procedures to model a case industry under the design science (DS) methodology.

4.4 RESEARCH DESIGN

Every research study has its own research design which needs to be followed to

anticipate the research goals. In fact, a research design is a “blueprint” which expresses

the strategic plan for conducting a study (Yin 2009). This design also provides an

overall structure for a systematic approach for model construction, data collection, data

analysis through research tools and interpretation of the analysis for a research study.

Moreover, the nature of the research problem justifies the type of research design (Yin

2009). Before commencing the research process in this study, a few research designs

were considered as will be discussed next.

4.4.1 System Dynamics Research Framework

A research study is an investigation and it starts by defining and understanding

problems before moving towards achieving goals for further improvements (Forrester

1987; Forrester 1994b). Forrester’s diagram illustrated a six-step SD research process

(Figure 4.2) which begins from describing a system to implement changes in policies

and structure through a rigorous modelling process. Furthermore, Forrester also

mentioned the epistemological premises of the SD approach (Forrester, 1961). Real-

world complex operations can be dealt with by the SD methodology having unchanged

circumstances (Lane and Oliva 1998; Forrester 1961). This methodological diagram

helps to perceive the systematic procedure including the step forward and back to the

next task to accomplish SD research. Sterman (2000) later developed a comprehensive

SD process (Figure 4.3) for conducting research. In this model, Sterman included the

detailed process, which starts from the literature review, identifying the business

process, finding the exact input and output and many rigorous steps. This model is

replicated in a number of SD studies. In 2010, Van der Aalst et al. (2010) illustrated the

simulation modelling procedure (Figure 4.3) under SD methodology to support the

previous procedures. This procedure is as simplistic as Forrester’s prescribed SD

process.

104

Step 1

Describe the System

Step 2

Convert Description to

Level and Rates Equations

Step 6

Implement Changes in Policies

and Structures

Step 5

Educate and Debate

Step 4

Design Alternative Policies and Structures

Step 3

Simulate the Model

Figure 4.2: Steps of System Dynamics Approach (Forrester 1994b)

Furthermore, Donella Meadow (1989) and Dennis Meadows (1980) provided

ontological assumptions of interconnections in complex patterns along with

stock/level, rates and feedback loops; they indicated that information flows are

fundamentally diverse from physical flows, that delays and non-linearities arise out of

system structure. Sterman et.al (1994), Sterman (1989), and Sterman (2000) later

justified and recommended the practice of different approaches for typical problems.

However, Simon discussed the epistemological assumption of SD with ‘bounded

rationality'(Simon 1982; Simon 1979). Forrester (1971a) placed emphasis on building

a mental model that guides a complete quantitative model. Forrester and Senge (1980),

Sterman (1989) and Radzicki and Taylor (2008) observed that formal modelling in

system dynamics can use simulation tools to assist with gaining correct representation

and rigorous analysis for behaviour within a system. Moreover, a simulation program is

highly capable of perfectly mapping particular system behaviour that can be reliable in

the context of result output, using calculus for consistent inferences about dynamics

yields and can fix erroneous results on simplistic maps (Sterman et al. 1994).

After reviewing relevant literature, Jutla et al. (2006) designed a popular modelling

approach (see appendix B) under SD methodology. In this approach, the research

process starts with problem definition followed by gaining practical knowledge,

identifying key variables, defining system boundaries, developing a causal model and

stock and flow model construction. The research then needs to set up their connectivity

followed by the structure and reliability check, refining the model until it passes

validity tests, validating the model, generating the simulation results for implementing

105

changes, drawing various inferences and running necessary scenario analysis. Other

researchers have followed a similar type of process while conducting research under

SD methodology. A very similar SD procedure (figure 4.4) was developed by van der

Aalst et al. (2010) in their book titled “Business Process Simulation”. This book

thoroughly explained how a problem can be defined followed by qualitative and

quantitative model building with reliability and validity check for possible solutions.

The following section discusses the research process followed in this study developed

based on the information shown on Figures 4.2, 4.3 and 4.4 which support the current

research flow.

- Literature Review - Identify Key Players and Users

- Identify Business Processes- Identify Inputs and Output- Set targets and KPIs- Pilot Study

- Identify Variables- Constructing Qualitative and Quantitative Model using System Dynamics Literature- Conduct Interviews

Convert into System Dynamic Model

- Evaluation of Model Structure and

Conceptualization- Logical information input

and validation

- Construct complete Simulation Model- Decide Simulation Experiments- Alternative Experiments- Absorb Historical Data and Other Documents

- Outcome Evaluations- Answer Research

Questions

Massive Literature

Review

Structural Validated Model

Behavioural Validated Model

Final Production Process Model

Figure 4.3: Process Needs and Considerations in “SD-based” Research (Adapted from Sterman 2000)

4.4.2 Research Process Followed Throughout This Study

This study integrates forward and reverse supply chains of a case industry.

Interestingly, the majority of previous research has focused on a forward supply chain

whereas only a few studies were conducted on reverse chains (Aghalaya, Elias, and Pati

2012). The systems modelling approach can be useful for the analysis of relevant

supply chain processes via dynamic simulation. Examples of the application of SD

modelling show that it is already implemented in the automobile industry (Sterman

2000), paper recycling industry (Spengler and Schröter 2003). According to Angerhofer

106

and Angelides (2000), comprehensive problematic areas are used to apply System

Dynamics to solve the critical and complex situation. Previous literatures shows that SD

has been applied mostly to help in in corporate planning and rigor policy design

(Forrester 1961; Lyneis 1980), economic behaviour (Forrester et al. 1983), public

management and policy (Homer and Clair 1991) biological and medical modelling

(Hansen and Bie 1987), energy and the environment (Ford and Lorber 1977), theory

development in the natural and social sciences (Dill 1997), dynamic decision making

(Sterman 1989), complex non-linear dynamics (Mosekilde, Larsen, and Sterman 1991),

apparel (Angerhofer and Angelides 2000), pharmaceuticals (Achilladelis and Antonakis

2001), aircraft (Lyneis 1998), software engineering (Abdel-Hamid 1984), and supply

chain management (Towill 1996; Barlas and Aksogan 1997; Akkermans, Bogerd, and

Vos 1999). There are some other research have been found in the literature, and their

domain of researches on Information sharing in supply chains (Fiala 2005),

remanufacturing used in closed-loop supply-chains (Vlachos, Georgiadis, and Iakovou

2007; Georgiadis and Besiou 2008), Bullwhip effect in supply chains (Disney and Towill

2003), supply chain dynamics (Villegas and Smith 2006), Manufacturing system up

gradation (Lee and Kim 2008) and so many others. The research process based on

Table 4.2 is described next.

ProblemDefinition

Conceptual Model

Executable Model

Answers Solutions

Simulation Results

ValidatedModel

Modelling

Realizing

Verifying and Validating

Experimenting

Interpreting

Figure 4.4: Simulation Modelling under System Dynamics Methodology (Van der Aalst et al. 2010).

107

4.4.2.1 Problem Definition and Structure

The following sections discuss the procedures of problem definition and structure.

a) Problem Definition

The SD research study starts with a research problem definition followed by other

processes to find out answers to research questions. It is important to identify the

scope of the research and the targeted goal to identify the nature of perceived glitches.

The scope of the research will set the boundary whereas the goal is the targeted answer

to the problems. These questions should be quantifiable and easy to communicate in

the implementation of the research. It was important to justify whether or not a

simulation study was needed to conduct the current research. Forrester (1961)

assumed that a system dynamics (SD) study should have a purpose, a defined problem,

issue, or undesirable system behaviour that needs to be solved or corrected (Forrester

1958, 1968, 1971b). The long-term emphasis on problem definition has been identified

in many SD studies (Forrester 1969; Meadows et al. 1972; Richardson and Pugh III

1981; Sterman 1989) and is still at the core of the SD intervention process (Forrester,

1994). In a few cases, system behaviours are identified and described through a

reference graph (Mottershead and Friswell 1993). These relationships between

connected variables are framed into information feedback loops which can be deployed

in a model to replicate real circumstances (Lane and Oliva 1998). In addition, system

behaviour can be also perceived through in-depth understanding and observation. The

causal relationships between variables is called a 'dynamic hypothesis' which is a

potential explanation of how the structure is causing the observed behaviour (Lane and

Oliva 1998). Thus, understanding the problem definition behind building a system

structure in a SD model is important to regulate the model.

b) Problem Structure

In the problem-structuring phase, a behaviour-over-time graph is developed for the

case industry. Developing a ‘reference graph’ or historical trend graph is one of the

tools used in systems thinking (Aghalaya, Elias, and Pati 2012) to show the real-life

behaviour of the main variables in a system over an extended period of time. Typically,

the data or information can be taken from periods over several months to several

years. The more historical data gathered, the more accurate the prediction of future

trends. Similar behaviour trends can specify the variations and trends in the variable of

108

interest, for example, growth, decline, oscillations or a combination thereof. The key

variables are captured in a graph to present and perceive the general trends, directions

and variations but are not expressed in numerical values (Aghalaya, Elias, and Pati

2012).

Table 4.2: Methodological Framework for This Study

Phases Steps Things to do

Phase 1 Problem Definition and structure (Aghalaya, Elias, and Pati 2012; Maani and Cavana 2007; Eden 1994; Sterman 2000)

Behaviour-over-time graph development

Phase 2 Identify key variables (Aghalaya, Elias, and Pati 2012; Maani and Cavana 2007; Wolstenholme 1990)

Identify key variables through in-depth interview approach

Phase 3 Build causal loop model (qualitative) (Wolstenholme 1990; Sterman 2000; Forrester 1994b)

Connect identified variables based on cause and effect relationship. And build complete causal loop model with positive and negative loops.

Phase 4 Stock and flow (quantitative) model building (Wolstenholme 1990; Sterman 2000; Forrester 1994b)

Stock (level) and flow (rate) are to be added in the model variables to build a workable model. Rates and equations should be determined based on real-life relationship between variables.

Phase 5 Run simulation (Wolstenholme 1990; Sterman 2000)

Enter real/field data with starting variable

Phase 6 Model reliability and validity (Barlas 1996; Sterman 2001, 2000)

Examine structural validity and assess the data reliability in different phases

Phase 7 Test policy and extreme condition situation (Barlas 1996; Sargent 2005; Forrester and Senge 1980)

Considerable changes of key variable values to observe output reliability

Phase 8 Forecasting future behaviour (Wolstenholme 1990; Sterman 2000; Lyneis 2000)

Model run for 312 weeks and it has 104 weeks’ real-world data

In this study, the key variables were identified through in-depth interviews, focus

group discussion and observation techniques. A reference graph was later drawn

(Figure 4.5) to capture the historical output (behaviour) of key variables. The selected

key variables were parent chicks enter, mature parent, parent eggs produced,

employment created, fertilizers and biogas produced, number of farmers, broiler chicks

109

consumed and final broiler production. The data input in the graph covered two years

(104 weeks) with poultry chick production and distribution run on a weekly basis. The

fluctuations in the individual graph line denote the variations of production and

distribution over time. The parent eggs produced line, for example, fluctuates a number

of times in 104 weeks. Significant vicissitudes can be found in one graph line whereas a

drastic fall and rise means either a collapse or sudden rise of the market. Fluctuation in

the business is caused by demand-supply gap, over/under-production, calamities and

policy barriers. This research tried to discover these problems through

predicted/simulated future results to take appropriate action.

Figure 4.5: Key Variables and Their Behaviour over Time (BOT)

4.4.2.2 Identify Key Variables

Key variables' identification is an important part of an SD research model. Once,

problem has been identified and defined its structure, the immediate task is to

recognize key variables based in the system structure and problems. Variables can be

identified through secondary literature and from empirical (case) evidence through in-

depth interview, focus group discussions and observations (Aghalaya, Elias, and Pati

2012; Maani and Cavana 2007; Wolstenholme 1990). The current study is used in-

depth interviews to select the main variables to build a simulation model. The in-depth

interviews with various supply chain members are assisted to find out influential

variables along with supply chain members.

0

100000

200000

300000

400000

500000

1 815 22 29 36 43 50 57 64 71 78 85 92 99

106

Time (Week)

Real Parent Chicks

Real Mature Parent

Real Chicks

Real Bakery Eggs

Real Employments

Real Poultry Litter

Real Biogas

Real Fertilizer

110

4.4.2.3 Build Causal Loop Model (Qualitative)

In system dynamics, the causal model concept is an important phase prior to designing

a complete stock and flow (quantitative) model. Before building a causal model, the

modeller needs to sketch the diagram through the mental process. Without doing so, it

would be difficult to understand and realize the whole system along with functions of

the key variables. To define a mental model, Forrester (1961) offered the following

impression:

“A mental image or a verbal description in English can form a model of a corporate

organization and its processes. The manager deals continuously with these mental and

verbal models of the corporation. They are not the real corporation. They are not

necessarily correct. They are models to substitute in our thinking for the real system that

is represented” (Forrester 1961, 49; Doyle and Ford 1998).

Authors have variously described the mental model as ‘fuzzy and implicit’ and ‘highly

adaptable, and unable to handle complexity’ (Richardson and Pugh III 1981;

Richardson 1986); ‘extremely simple compared to reality’ and ‘mostly wrong’

(Meadows and Randers 1992); ‘not fixed’, ‘not simple’ and ‘contains rich information’

(Vazquez, Liz, and Aracil 1996); and ‘vastly simplified compared with the complexity of

the systems themselves’ and ‘dynamically deficient’ (Sterman et al. 1994). Although,

many researchers mentioned that the ‘mental model’ is an incomplete model, a number

of authors have recommended using this approach initially to conceptualize a process

followed by rigorous refinement (Klimoski and Mohammed 1994; Johnson 1988;

Storey, Fracchia, and Müller 1999; Williams, Ware Jr, and Donald 1981; Doyle and Ford

1998).

For the current research study, a mental model was used to develop the diagram of the

poultry process supply chain. Focus group discussion, semi-structured interviews and

observation tools were used to develop and conceptualize the current supply chain

model. This mental model was later converted to a causal model followed by a stock

and flow simulation model. Although system dynamics did not embrace the practice of

causal loop diagrams, many academics and researchers have incorporated such a

diagram in their work to make it understandable to readers (Wolstenholme 1999,

1985). Nowadays, few system dynamists suggest that these kinds of studies can be

carried out without the development of formal models (Wolstenholme and Coyle 1983;

Morecroft 1985; Wolstenholme 1985; Richardson 1986). It is always easier to deal with

111

causal loop diagrams which can be formed at the beginning of a model

conceptualization and which also have the strong possibility of being effectively

acknowledged (Richardson and Pugh III 1981; Richardson 1986). There are number of

studies in the literature which have been designed and described qualitatively from a

causal diagram model which is acceptable to academia. The next two sections discuss

the causal and feedback loop design for this study.

a) Causal Loop Diagram (CLD)

A causal loop diagram (CLD) is a visual interactive diagram which interconnects the

nearest variables having a positive or negative effect on one another. Such relationships

between the variables, represented by arrows, are usually characterized as either

positive or negative (Schaffernicht 2007; Sterman 2000, 12). Most SD models contain

dynamic feedback processes along with stock and flow structures, delays in time and

non-linearities (Sterman 2000, 12-13). These positive (or self-reinforcing) and negative

(or self-correcting) loops communicate with one another to devise the real dynamic

behaviour of a system (Sterman 1989, 2000). System dynamics (SD) is mainly used to

identify feedback loops created by linking resources or information flow

(Wolstenholme 1990, 13). Thus, such loops represent dynamic system behaviour

through flowing processes, boundaries, delays and strategic information within a

system (Wolstenholme 1990, 13). There is no alternative method of creating and

designing causal and feedback loops for a system in order to understand its real

behaviour over time and the policy implications for particular situation.

b) Positive and Negative Feedback Loop

Various studies in the literature have mentioned positive and negative links within a

causal loop. Without positive and negative links, it is difficult to judge the correct

nature of backward and forward flow in a model. Polarity is indicated through the plus

(+) or minus (-) sign at the top of the arrowhead. A plus (+) sign suggests that a change

to the variable at the end of the arrow will cause a change to the variable at the top of

the arrow in the same direction. Likewise, a minus (-) sign implies that a change to the

variable at the end of the arrow will cause a change to the variable across the top of the

arrow in the opposite direction (Richardson 1986). In fact, system behaviour over time

depends on how and in what ways system loops are interconnected with the variables.

Once causal model development is completed, the stock and flow model needs to be

112

designed. The next phase is to the execute qualitative model (the complete causal

model) which is discussed in the following section.

c) Execution of Qualitative Model

After understanding the overall concepts of a particular process or system, we need to

have a modern simulation software package to convert it as an executable model

(France and Rumpe 2007; Robinson 2006). If an executable model is designed using

computer simulation software, it can be experimented on in various ways. The question

of how to generate or design an executable model depends on the simulation tools used

to develop a model (Rauch et al. 1998). Simulation involves a real-life system structure

and design with an implementation phase where simulation packages allow the

building blocks to which the proper quantitative characteristics (e.g. time) must be

added (Zeigler, Praehofer, and Kim 2000; Van der Aalst et al. 2010).

To design an improved model, the study needs to have computer-based software which

will enable the tracking of relationships between/among the variables and their

dynamic behaviours (Müller and Pfahl 2008). Similarly, effective model building needs

a good understanding of simulation-based software so that one can design a model that

is almost similar to the real world (Senge and Sterman 1992; Andersen, Richardson,

and Vennix 1997; Lane and Oliva 1998). It is important to be aware of what philosophy

is used in building a simulation model so that goals can be achieved (Peterson 1992).

As mentioned earlier, a causal loop diagram model envisages the effects of

interconnected variables (Elias 2010). The loop diagram consists of a set of nodes

representing the interconnected variables (Aghalaya, Elias, and Pati 2012; Maani and

Cavana 2007).

As mentioned above, the relationships between variables, represented by arrows, can

be labelled as positive or negative. In a causal loop diagram, a positive (+) sign at the

top of an object (variable) denotes an increase (or decrease) at the end of an arrow

causing a corresponding increase (or decrease). If an increase in the causal variable

causes a decrease in the affected variable, a negative (-) sign is placed at the top of an

arrow (Aghalaya, Elias, and Pati 2012). This is how positive and negative relationships

are identified in the model deployed for constructing a complete stock and flow model.

The detailed explanation of the causal model is discussed in the next section. The

113

explanation also includes details of the causal and stock and flow model building

process.

4.4.2.4 Stock and Flow (Quantitative) Model Building

In building a stock and flow (quantitative) model, it is necessary to analyse, experiment

and test it from various aspects. Without a stock and flow model, it would be difficult to

replicate the realistic process in a virtual model. The process structure for the model

needs to be designed so that the system’s structure is represented by resource flows.

The resource flow consists of stocks (i.e. levels) and flows (i.e. rates). Due to the

limitations of causal loop diagrams, the stock and flow model is more popular with the

modeller and researcher. The reason for this popularity is that the stock and flow

model is used for its ability to capture stocks and flow information going forward and

in reverse within a system structure (Sterman 2000, 191). Causal loop diagrams are

very useful for understanding the system behaviour although they have some

limitations with the possibility of misinterpretation and misapplication (Sterman 2000,

191). However, there is no doubt about the importance of the causal model as it can be

used to advantage for any kind of project capturing the mental model of the causal

relationship between variables (Sterman 2000, 191). Next, the two key words of ‘stock’

and ‘flow’ need to defined.

Specifically, a stock is accumulated over time by inflows and outflows that only change

its value based upon flows. Simply stated, a stock is an accumulation or integration of

flows over time with the outflows subtracting from the stock (Sterman 2000, 192;

2001; Barlas 2007). Stocks create delays by accumulating the difference between the

inflow to a process and its outflow (Repenning and Sterman 2002). As shown on

Figure 4.6, stocks over time act like the formula below where outflows are deducted

from inflow by adding initial stock (t0). A flow (or "rate") changes a stock over time

(Meadows et al. 1972; Sweeney and Sterman 2000; Sterman 2000). It is easy to

differentiate inflows and outflow that determine the value of stock over time (Vlachos,

Georgiadis, and Iakovou 2007). The current model has a number of flows (rates) which

are connected to levels, constants and auxiliary variables to determine the inflow and

outflow rate. The following example is formed to aid in understanding how stock and

flow are connected with one another.

114

( ) ∫[ ( ) ( )] (

)

Figure 4.6: Simple Stock and Flow Model for Poultry Parent Farm

In Figure 4.6, the parent chicks’ rate is an inflow for parent chicks' stock which is

drained out through the parent maturing rate outflow. The preceding outflow is treated

as inflow for the subsequent stock of mature parents. Inflow and outflow can be

attached to auxiliary or constant variables to determine the ultimate rate. The following

discussion is based upon the stock and flow diagram.

a) Auxiliary, Constant and Table Function Variables

The rate of a stock changes through a function of any stock by a constant variable or by

exogenous inputs/outputs. Sterman (2000, 202) mentioned such variables as a

function of net change for immediate stock. For example, ‘parent chicks’ rate’ in

Figure 4.6 is determined by other influences with the help of stock. Such influences

come from auxiliary (random uniform), constant (fixed) or table function (exogenous)

variables. These variables are determining and regulating the net changes of a vachon

over time. The next section discusses stock and flow diagramming.

b) Diagramming for Stocks and Flows

For converting the stock and flow model from the causal loop diagram, this research

has used the Vensim application. Before introducing the quantitative model, it is

important to note the following (Sterman 2000, 192) based on Vensim (a software

package for simulation):

Stocks are represented by rectangles

Inflows are represented by a pipe (arrow) pointing into (adding to) the stock.

Outflows are represented by pipes pointing out of (subtracting from) the stock.

115

Valves control the flows.

Clouds represent the sources and sinks for the flows.

The above information is general practice for a Vensim (research tool) user. The

modeller can use any customized shape to recognize a variable in the model. For

example, this research used a circle for the variable ‘poultry litter’ and ‘eggs’ supply to

bakery’ and a hexagon for ‘chicks’ (see Figure 5.8 in chapter 5). In reality, both of these

variables are deployed as auxiliary variables in the model. The following section

discusses stock influence on dynamic behaviours.

c) Influence of Stocks on System Dynamics

According to Mass (1980) and Sterman (2000, 195), stocks are important in

engendering the dynamics of systems for the following reasons:

Stocks describe the state of the system

Stocks deliver the basis for actions

Stocks offer systems with inertia and memory

Stocks are the cause of delays

Stocks have divergent rates of flow and generate disequilibrium dynamics.

Therefore, stock is the main focus of any kind of system dynamics (SD) simulation

model due to its ability to influence and properly state the model and system. Delays in

a model are discussed in the next section.

d) Delays

Most systems have a delay which is the main source of unstable and oscillated

behaviour in a system (Sterman 2000, 409). A delay is also treated as a pause, break or

lag between initiation and finish of a resource transition (Stevenson 1994;

Wolstenholme 1990). Delays accomplish a few actions in a model based upon the type

of delay. For instance, when ‘parent chicks’ enter’ in a system model, the modeller

needs to consider a delay as parent chicks need at least 24 weeks to grow into the

mature parent to lay eggs. Repetitive use of delays in a system may oscillate the

behaviour of a stock. The subsequent section deals with organizational boundaries for a

model.

116

e) Organizational Boundaries

Wolstenholme (1990) and Sterman (2000) stated that organizational boundaries need

to be determined in order to model the system properly. Most organizations worldwide

adopt different types of organizational boundaries within a system based on location,

scope, finance, management, etc. Therefore, it is important to define the boundary of a

model to incorporate necessary variables in a system. The next section discusses policy

matters within a model.

4.4.2.5 Run Simulation Model

It is always time-consuming to convert a model from qualitative (causal model) to

quantitative (stock and flow) form. Obviously, it is a great success when a complete

simulation model runs successfully in its software environment. The job does not finish

yet in this stage. A number of trial and errors will fix the bugs for the model. The

experiments will be continued as long as it does not have a perfect match with the real-

life behaviour. Such steps are challenging and time-consuming in terms of effort given

to fix the model. In this situation, data may need to be collected for a number of times to

crosscheck to find the errors. Successful completion of the simulation model needs to

be run repeatedly to find it as workable as replicating the real-life process. The next

phase needs to be tested the reliability and validity issues for the simulation model.

4.4.2.6 Model Reliability and Validity

Model reliability and validity needs to be checked when a simulation model run

successfully with replicating real life outputs. The reliability and validity issues are

handled in the following way.

a) Model Reliability

Modelling is an iterative process of causal diagramming, scope selection, hypothesis

generation, quantification, reliability testing and policy analysis (Sterman 2000). The

model refinement process continues until the model is able to satisfy requirements

concerning its reality, robustness and ability to reproduce a historical pattern

(Jørgensen 2004). Such efforts will not only ensure reliability but will also explore

potential futures (Forrester and Senge 1980; Homer 1996). Most things in the world

are not measured including many that experience tells us are important (Homer 1996;

117

Homer and Oliva 2001). The objects chosen provide input into the model and originate

from experts’ minds by being certified as important elements the relevant process

(Homer 1996; Homer and Oliva 2001). However, inferences come from related data,

logic, guessing, observation or adjustments considered desirable to provide a better

simulated fit to history (Homer 1996; Forrester 1980; Graham 1980; Randers 1980). In

practical terms, research based on reliability theory has been conducted on the power

system (Chen, Thorp, and Dobson 2005); health system (Ware Jr, Kosinski, and Keller

1996); poultry operation; and the human system (Bonabeau 2002). Similarly, the

reliability of the current model will be tested in chapter 6 under section 6.6. Similar to

reliability, validation is an important issue for a SD model and is discussed in the next

section.

b) Model Validation

The modeller has the general expectation of validating their model to gain mass

acceptance of its compatibility with reality. According to Barlas (1996), there are two

theoretical sides of a SD model validation: the positivist and the pragmatist with the

latter approach meaning "adequacy with respect to a purpose". Usually, validation is a

gradual process of "confidence building." Many researchers (Kornbluh and Little 1976;

Wolstenholme 1990; Forrester and Senge 1980) also affirmed that no one method can

claim complete validation instead claiming comparative usefulness for desired

purposes rather than an exact fit between the model output and its past data, or

extreme "true/false" or "accept/reject" calibration (Forrester and Senge 1980;

Kornbluh and Little 1976; Roberts 1976; Wolstenholme 1990, 1999). Checkland’s

'hard' approach stated that models must sufficiently represent a part of the real world

whereas 'soft' approach models must only be internally valid (Winter, Brown, and

Checkland 1995; Checkland 1995). Yang (2004) and Sargent (2005) ensured that

simulation results were compared observing both historical and analysis data and

indicated that verification and validation may lead to adjustments in the simulation

model.

However, modellers may claim to have “verified” a model but validation and

verification of models are impossible. The word “verify” means “to establish the truth,

accuracy, or reality”. “Valid” is defined as correctly derived from premises and also

implies being supported by objective truth (Sterman 2000, 871). Models are designed

for simplified representations of the real world and differ from reality in ways large

118

and small, and infinite in number; however, a research proposition can be validated

(Sterman 2000, 871). Another popular statement is that a model can be validated if the

propositions are derived from the axioms of a closed logical system (Ayer 1952; Read

2012). A simulation model that is found to be accurate after validation is called a

validated model. As shown in Figure 4.7, Barlas (1996) designed a model validation

process which was followed to validate the model used in this study. At the same time,

a core confidence building test was relied upon for structural, behavioural and policy

tests (Barlas 1996; Forrester and Senge 1980; Wolstenholme 1990; Sterman 2000).

Table 4.4 presents the systematic validation process which has been proposed by the

above-mentioned expert researchers in the system dynamics (SD) field.

Figure 4.7: Formal Steps of Model Validation (Barlas 1996)

An executable model should not be thought to be correct and complete without

verifying its behaviour and components; therefore, it has to be verified. Qualitative or

quantitative errors, programming errors or wrong parameter settings are examined

through a validation process (Van der Aalst et al. 2010; Kleijnen 1995). An executable

119

model needs many trial runs with various changes such as input, values for the

constant and auxiliary variable, and linked information (formula). In the stress test, the

model is experimented on by changing the values of the key variables which are

subjected to extreme situations, for example, sudden calamities, excessive demand and

inadequate supply (Van der Aalst et al. 2010). The model’s interconnected behaviour

should behave best under extreme conditions which allows the researcher to verify its

validation. This verification is very important as discussed in various literature by

Sterman (2000), Forrester and Senge (1980), Barlas (Barlas 1996) and Wolstenholme

(Wolstenholme 1990) who emphasised core confidence-building tests on a working

model. The following section discusses experimenting through a simulation model.

Table 4.3: Core Confidence-Building Tests (Barlas 1996; Forrester and Senge

1980; Wolstenholme 1990; Sterman 2000)

Test

Type

Descriptions

Stru

ctu

ral

Val

idit

y

Structural Verification

Comparing the equations of a model with real-life practices and gaining knowledge from literature if available.

Parameter Verification

Appraising parameters of a model against knowledge of real system, both conceptually and numerically.

Extreme Conditions

Assigning extreme values and observing model behaviour.

Boundary Adequacy

Aggregating all appropriate relevant structure into the model.

Dimensional Consistency

Checking the right-hand side and left-hand side of each equation for dimensional consistency.

Turing Test Presenting a mixed collection of real and simulated output behaviour patterns to experts and asking whether they can distinguish between the real and the simulated patterns.

Beh

avio

ur

Behaviour Reproduction

Examining how well model-generated behaviour matches observed behaviour of a real system: behaviour reproduction tests include a symptom-generation test, frequency-generation, relative phasing, multiple-mode test and behaviour characteristics.

Anomalous Behaviour

Discovering anomalous features of model behaviour which sharply conflict with behaviour of the real system.

Used to defend particular model assumptions by showing how implausible behaviour arises if the assumption is changed.

120

Behaviour Sensitivity

Conducting sensitivity of model behaviour by experimenting with different parameter values and analysing their impact on behaviour.

Po

licy

Tes

t Changed-behaviour Prediction

Testing if a model correctly predicts how behaviour of a system will change if a policy is changed.

Policy Sensitivity Conducting policy sensitivity to reveal the degree of robustness of model behaviour, and identifying the risk involved in adapting a model for policy making.

4.4.2.7 Test policy and Extreme Condition Situation

A policy is a set of rules which policy makers use as a basis for decision making when

expected future events happen (Stevenson 1994). According to Forrester (1994a), 98%

of the policies for a system do not have significant influence on generating massive

change; only a few highly leveraged policies can change behaviour within the system.

Nevertheless, in a complex business process, finding high-impact policies may be

difficult as many interconnecting feedback loops can be found in a complex system. At

times, a policy, intended for solving a problem, may result in unexpected or unintended

outcomes (Maliapen 2003).

After successful validation testing of the model, the next phase is to experiment which

is based on research questions and objectives. These experiments should experiment

efficiently to obtain reliable and consistent results. A simulation experiment is based on

specified probability distributions or predictable values in a variable (Carson and John

2004; Kleijnen 1995). Quantitative results are accumulated which are returned upon

completion, and experiments continue until the expected results are achieved. In many

cases, this is achieved by dividing a run into sub-runs (Carson and John 2004). A few

experiments will be discussed in chapter 6 in section 6.7. According to Maldonado and

Greenland (1997), quantitative simulation results have to be interpreted in order to

communicate answers to research problems and questions. For each answer to a

research question, reliability should be checked to support the outcome. In cases in

which the reliability of a variable or model is too low to disclose any certain answers,

new or additional trials with experiments and model runs are required. In practice, a

number of processes, including experimentation and interpretation, may frequently

take place at the same time. Typically, a number of possible alternative circumstances

are compared and contrasted with one another. In that situation, several simulation

models are created and experimented with and the results compared. Often, several

121

possible improvements of an existing situation have to be compared through

simulation. The research questions and objectives are answered in detail in chapter 7.

When a simulation model has fulfilled and satisfied fundamental validity tests, it can

then be experimented with to examine and test the various policies and their impacts

on a system (Lane and Oliva 1998; Forrester 1961, 1968), to explore ‘what-if’ scenarios

(Morecroft 1988a) or to optimize key decisions (Wolstenholme and Coyle 1983; Coyle

1996, 2000; Keloharju and Wolstenholme 1988; Coyle 1985). If a model is complete,

valid, verified and dimensionally correct, then simulation can play ‘what-if’ analysis as

much the researcher wishes to (Maldonado and Greenland 1997). The model can be

repeatedly adjusted to represent possible or expected future situations by changing

parameters in the executive model. In each successive trial with its changes, the

adjusted model needs to be validated (Oreskes, Shrader-Frechette, and Belitz 1994;

Sargent 2005). The alternative model resulting from different trials then needs to be

analysed based on the consequences (Maldonado and Greenland 1993; Sterman 2000).

These sorts of experiments are mostly done over policy and uncertain related variables.

The above discussion acknowledges the research process followed in this study.

4.4.2.8 Forecasting Future Behaviour

Future projection is a vital thing for most of the operation. By doing so, industry can

achieve their targets and protect possible losses respectively. Bangladesh poultry is

making losses due to wrong prediction of disease time and demand variation for

different reasons like season, festivals, market situation and the likes. The current

research is operated the simulation model for 312 weeks which means six years. It can

be done for more than this if the farmers require it. This is how the model can forecast

the future trends which will help the farmers to prepare themselves to face the

situation. The following section describes the study’s data collection method.

4.4.3 Methods of Data Collection

This study employed five methods of data collection, namely, observations, interviews,

questionnaires, documents and focus group workshops. This study used several data

collection techniques to disclose, understand and experience the following:

Business and supply chain processes and procedures

Interactions and roles of stakeholders

122

Forward and reverse supply operation

Procuring process and markets for by-products

Probable integration of poultry forward and reverse supply chains

Creating equations based on relationships

Necessary information to construct simulation model

4.4.3.1 Observation

Observation is one of the most effective data collection methods for obtaining an

understanding of subjects (e.g. persons, groups and systems) under study. A researcher

can easily observe the subjects perform activities as a participant or as an onlooker

(Whitten, Bentley, and Barlow 1994). Data from observations consists of detailed

descriptions of people’s activities, behaviours, actions and the full range of

interpersonal interactions and organizational processes. Researchers use observational

data to understand the context of the observed subjects to an extent not entirely

possible using interviews or written documents. They also have the opportunity to see

things that may routinely escape conscious awareness among participants. Therefore,

direct experience gained from observations allows researchers to create a holistic

perspective, be open and be discovery-oriented and inductive in approach (Patton

1987). Similarly, the current research has used observation technique to find out the

actual cause and effect relationship between variables. For instance, observation is

appropriately used to identify different rates and stocks' variables of the study. To do

so, the researcher stayed in and visited all the relevant areas to find the similarity with

the information acquired from the in-depth interviews and focus group discussions. It

is noted that the researcher has covered farm operation (parent stock), hatchery

process (day-old chicks' production), middlemen (agents, dealers and sub-agents level)

to understand the real facts for the sake of build a simulation model appropriately.

Later, the information was merged and matched for the convenience of the current

study.

4.4.3.2 In-depth Interviews

There are two types of interviews: formal and informal. Formal interviewing is

conducted through structured questionnaires in sequence, and occasionally recorded in

a standardized form whereas informal interviewing does not require set questions or a

pre-determined framework (Bailey 2008; Moser and Kalton 1986; Robson 2011). In-

123

depth interviews are considered as the informal type and are often described as a

normal conversation between interviewer and interviewee (Legard, Keegan, and Ward

2003). An in-depth, qualitative interview is a useful tool to inquire and discover the

case’s status and situation through the methods of an open-ended, semi-structured

format, understanding and interpretation and recording responses to gain insights on a

subject (Guion, Diehl, and McDonald 2011). The main purpose of using this data

collection technique was to gather necessary information about the poultry process. In

addition, such technique is helped to crosscheck the variables and their relationships in

terms of cause and effect. Again, the current research has used in-depth interviews to

learn about the poultry process and operation at farm, distributor and supplier levels. A

simulation model was developed based on in-depth description and observation

methods. Stock, auxiliary and constant variables and their interrelated co-variables,

and rate values for each inflow and outflows were identified through the in-depth

interviews. With regard to the current study, primary information for this study was

collected mainly through in-depth interviews from the sample respondents of a poultry

case industry. This research used the in-depth interview technique to gain insights and

develop a poultry supply chain model. There were 12 respondents in total comprising

the top 12 executives, including the case farm owner, who each participated in an in-

depth interview.

4.4.3.3 Focus Group

Recently, focus group sessions have been used in research to gain insight into the

dynamic relationships, attitudes, opinions, motivations, concerns and problems related

to current and projected activity (McDaniel 1979). Moreover, focus group sessions are

helpful in answering questions of how and why something happens (Folch-Lyon and

Trost 1981). A focus group is a conversation in a group session that may have six to

12 respondents under the guidance of a moderator (Folch-Lyon and Trost 1981).

Furthermore, the main advantage of a focus group is that it provides the researcher

with the opportunity to observe a large number of interactions on a topic in a limited

period of time: it also provides clues about the range of variation of certain opinions or

characteristics. Focus groups were originally used as a marketing tool to help consumer

specialists find out what a group of people were thinking (Stewart, Shamdasani, and

Rook 2007). The main objectives of using this technique was to determine, verify and

acknowledge the various poultry operations, cause and effect relationship between

variables, equation formation for the rate variables and so on. The current study

124

conducted a focus group discussion with eight members who were selected from the

different units of the poultry process, namely, the parent stock (PS) farm, hatchery,

distribution and waste processor. The owner of the case industry and three top-level

executives also participated in this session to authenticate the process information.

Such diversified participation in a focus group meeting streamed valuable information

related to model variable, cause and effect relationship, equation formation and the

likes. Later, collected information was matched with other sources of information like

in-depth interview and observation.

4.4.3.4 Documents and Records

Documents are obtained directly from records, official publications, reports, personal

diaries and open-ended questionnaires. Documents provide basic information as a

background for conducting research or making decisions and stimulate a researcher to

generate additional ideas to pursue through direct observation and interviewing

(Charmaz 2006; Meystre et al. 2008). The main purpose of using this technique was to

determine stock and flow variables. In addition, documents and records is helped to

collect historical data set to compare with model output for verifying model and

reliability. Such information makes easy to build real-life relationship in a virtual world

like simulation. For the current research, secondary information was collected from

various documents and records maintained by the head office of the case industry.

Specifically, rate variables were adjusted accurately through the observation technique.

4.4.4 Research Tool

The research tool is an important component for any kind of research. Without having

an appropriate research tool, it would be hard to conduct analysis which guides a study

to find ultimate outcomes. The current research used rigorous simulation techniques to

analyse the model to respond to research questions. In the literature, Jay W. Forrester

introduced the principles of feedback and control to social variables which dealt with

the two key lessons of choosing an appropriate system and using the simulation

technique to discover the surprise behaviour of a system (Forrester 1971b). To

simulate a system, convenient and competent software such as Vensim is needed. The

development of Vensim has been motivated by modellers, researchers and relevant

consultants since its inception (Eberlein and Peterson 1992).This research used

Vensim simulation software.

125

VensimTM, the Ventana® Simulation Environment (Ventana Systems 1999), is an

interactive software environment that allows the development, exploration, analysis

and optimization of simulation models. Business process simulations with Vensim

software (Repenning 2002; Pfahl and Lebsanft 2000; Peterson and Eberlein 1994) are

used to refine theories, test system behaviours and perform sensitivity analyses for

strategic policies, reliability and validity through a reality check. Since computer

simulations provide time compression of visualized results of model analyses, they are

useful for enhancing insights about system behaviours and ways of improving them.

Vensim was created to increase the capabilities and productivity of skilled modellers

and has functionality that improves the quality and understanding of models (Eberlein

and Peterson 1992).

The attractiveness of Vensim software is based on its workbench-toolbox metaphor,

causal diagram tracing, statistical fit analysis and SyntheSim model of variables

(Eberlein and Peterson 1992). This rigorous Vensim software was used in this study to

draw the supply chain operation of a case poultry farm. Causal diagramming was then

developed which had positive and negative relationships between the variables. This

causal diagram later helped to build a stock and flow (quantitative) model with the

association of formulae, information and exogenous data. The research model was

completed through these processes and by having a massive unit and relationship

check of its various component variables. Finally, various analyses were made through

Vensim to successfully meet the criteria of system dynamics (SD) research in light of

validity, reliability and ‘what-if’ analysis. As computer simulations provide time

compression of the visualized results of model analyses, they are useful for enhancing

insights about system behaviours and ways of improving them.

4.4.5 Data Analyses

Data analysis is an important part of a research study. Generally, analysis is conducted

based on the research objectives and questions. Data analysis for the study’s research

questions is discussed in the section below.

Research Question One

What is the most appropriate sustainable poultry production process for the Bangladesh

poultry industry in light of the economic, social and environmental issues?

126

Analysis for Research Question One

The answer to the first research question was derived from the empirical case study.

The simulation finding also helped to understand the sustainable poultry production

process in light of the economic, social and environmental aspects of sustainability.

This three-factor sustainability was also explored in the existing literature. Visual

interfaces for the poultry case industry within the simulation model later helped to

validate such questions through due procedures.

Research Question Two

How can the principles of the reverse supply chain (RSC) be used to recycle poultry wastes

effectively?

Analysis for Research Question Two

The simulation model was designed based on two different supply chains, forward and

reverse. The poultry process generates various kinds of wastes, including poultry litter,

feathers, broken and unhatched eggs, intestines, waste feed, etc. The same information

was also investigated through the literature review. When data were collected, the

quantities of wastes were also noted to compare and contrast with the model’s output.

In reality, the Bangladesh poultry process is yet to process most of the poultry wastes

except for broken/unhatched eggs and litter. The model also designed the reverse

supply chain to collect wastes properly for the main operation or a third party

operation to process for economically valuable by-products such as biogas, bakery

products, fish feed and fertilizers. Real and model data were compared to understand

the effectiveness of using poultry wastes.

Research Question Three

In what ways can the poultry forward supply chain (FSC) bring social changes leading to

employment generation and, thereby, reducing poverty?

Analysis for Research Question Three

The simulation model also designed the forward supply chain which started from the

poultry parent stock (PS) farm and progress though to final consumers. A number of

127

articles in the literature were found on forward supply chains but not on the poultry

process. It was observed in real life that every step of the forward supply chain creates

opportunities for more employment, businesses and social changes in terms of

empowering poor and unemployed people. The model was designed in such a way that

a forward supply chain would determine the amount of employment based on total

poultry birds transacted or reared. The more birds are reared; the more employment

and business opportunities will be created.

4.4.6 Problems Faced in Data Collection

Only a few problems were faced in the data collection from the case industry: these are

discussed below.

4.4.6.1 Focus Group Session

In the modelling phases, it is worthwhile to understand the nature of the process and

its relevant activities (Dryer 1991). Naturally, with a small group of eight, it is much

easier to converse and reveal relevant information. The issues relating to facilitating

workshops and dealing with focus groups have been discussed earlier in this chapter. A

few managers from the main projects did not want to attend as the ongoing daily work

did not permit this to happen.

4.4.6.2 System Dynamics and Simulation Terminology

The management and respondents were ignorant about system dynamics (SD) research

and simulation. Initially, it was a bit difficult to gain their understanding. Nevertheless,

they gradually started to understand the model and the purpose of the simulation

modelling.

4.4.6.3 Documents and Records

The case industry had stored most of its data and documents in an unorganized manner

with no storeroom maintained in which to store them. Due to the chaotic storage of

their documents and computer files, delays were caused which created some

unhappiness among them.

128

4.5 SUMMARY

This chapter has described the research paradigm, methodologies and methods used

for this research. The detailed research process was then described based on the

system dynamics (SD) research process. In addition, relevant matters about qualitative

and quantitative modelling procedures were discussed. Discussion followed and the

logic was provided for why this research deployed design science (DS) methodology

under the positivism paradigm with the help of system dynamics (SD) research and the

case study method. The latter part of the chapter mentioned a few problems

encountered while conducting the study. This chapter tried to address almost every

aspect of research methodology used in this current research. The next chapter

discusses the supply chain model using the system dynamics (SD) approach.

129

CHAPTER 5:

POULTRY SUPPLY CHAIN MODEL: A SYSTEM

DYNAMICS APPROACH

5.1 INTRODUCTION AND CONTEXT

The focus throughout this chapter is to develop the qualitative and quantitative poultry

process model using the system dynamics (SD) approach. The initial focus is to develop

and describe the qualitative model or causal loop diagram for the particular case

industry and its forward and reverse supply chains. One of the prerequisites is to have

a causal or soft model before or after building a stock and flow diagram for a simulation

model. The chapter also examines the dynamic relationship and impact of one variable

on another through creating a loop. The key variables were identified through in-depth

interviews with the employer and top-level employees within the case industry. This

causal loop model was later used to develop the quantitative or stock and flow model.

The quantitative model incorporated stock (level) and flows (rates) for all connected

variables along with appropriate equations to express real-life relationships between

the variables.

The poultry industry in Bangladesh operates through a number of steps from its

mother breed through to mature chicken (broiler) consumption, which is a complex

process. Earlier (see chapter 1), the current study’s scope was defined with its research

starting from the poultry parents stock (PS) breeder to broiler meat production. At the

same time, the study in considering the reverse poultry supply chain explored the

reversal of poultry wastes to the main industry or a third party industry. However, this

research sought to integrate both supply chain processes so that the poultry industry

could achieve maximum benefits. The profitability and feasibility of an integrated

supply chain depend on the model’s output. If the output showed significant benefits,

the producer would then apply such concepts in their existing operation. Therefore, the

study needed to build such a model which would give full insight into processing,

possible output and other associated benefits such as employment. The next section

discusses building a causal loop diagram based upon the poultry case industry’s

130

information and its relationships with other supply chain members. The qualitative

system dynamics (SD) model for the case poultry industry is also discussed.

5.2 QUALITATIVE SYSTEM DYNAMICS MODEL FOR POULTRY SUPPLY CHAIN

The necessity for building a qualitative SD model (causal model) was described in the

methodology section in chapter 4 along with discussion on recent research practices.

This particular section develops a causal loop diagram for the research case industry

based on in-depth interviews, focus group discussion and observation techniques. It is

noted that the model is confined to the forward and reverse supply chain aspect of the

poultry process. The following sections present the poultry causal model building

process along with loops that exist in the poultry variables within the research

boundary.

5.2.1 Causal Model Development

As a first step, the study developed a simple causal model for ‘eggs and chicks’ with a

negative feedback loop. Figures 5.1 and 5.2 show a simple causal model developed

using key variables indicating the plus (+) or minus (-) sign on the top of the

arrowhead. As can be seen, a plus (+) sign indicates a positive relationship between the

variables, and a minus (-) sign implies a negative relationship. In Figure 5.1, a simple

causal loop diagram captures the feedback dependency of chicks and eggs. The arrows

indicate the causal relationships. The effect is positively related to the cause: an

increase in the total ‘eggs’ causes the rise in ‘chicks’. Alternatively, a decrease in egg

collection causes fewer chicks. If there are more eggs, then chicks rise and,

alternatively, fewer eggs produce fewer chicks: this is called a self-reinforcing

(positive) loop (Sterman 2000, 13).

According to the well-known book ‘Limits to Growth’, there is no growth which can

continue forever (Meadows et al. 1972). Such limits are generated from a negative

feedback loop between the variables. In Figure 5.2, the model consists of both positive

and negative feedback loops. Here, negative loops are self-correcting as they respond to

adverse change (Sterman 2000, 13). If eggs increase, parent chickens will increase.

When more hatching eggs come from parent mothers over a time, parents grow old

becoming aged parents with less fertility producing fewer more eggs. This means that

parents start decreasing which contains a negative tendency. Finally, the more eggs

131

hatched to produce day-old chicks, the less hatching eggs left in the stock which is a

negative loop. This is the way that loops work in a system dynamics (SD) model. The

causal model works to define the relationships between the variables. This cause and

effect relationship ultimately determines the influence in terms of positive and negative

changes in connecting variables. The study needed to identify key variables to consider

in building the causal loop model which is presented in the following sections.

Figure 5.1: A Simple Negative Loop of ‘Eggs and Chicks’ Causal Model

Figure 5.2: Combination of Positive and Negative Loops

5.2.2 Identifying the Key Variables

Generally, variables are chosen from the literature and their relationships with each

other are explored through research investigations and secondary sources (Greenland

1987). The present research faced challenges in choosing key variables and defining

the boundary of the study. No relevant literature was available on the supply chain

variables with regard to the Bangladesh poultry industry. Due to this situation, the

research has to accept an alternative technique where information was collected

EggsChicks

+

-

Eggs Produced

+

Chicks Hatched

-

Eggs Parent Chicken Hatching Eggs Day-Old Chicks+ + +

+ - -

132

through in-depth interviews, focus group discussions and observation. Table 5.1 shows

the process of collecting key information on the poultry case industry in Bangladesh.

Parent chicks and mature parent units were found to be the two most important

variables and both directed the rest of the poultry supply chain process. For example, a

small number of parent stock will produce less hatching eggs from which to hatch day-

old chicks.

Table 5.1: Process of Data Collection at Different Levels

SL No. Information and Data Process of Data Collection

1 Parent Chicks (Breeder

Farm Unit)

In-depth interviews, focus group

discussion, observation and industry

records

2 Mature Parent Unit In-depth interviews, focus group

discussion, observation and industry

records

3 Hatching Unit Observation and industry records

4 Distribution Unit Observation, in-depth interviews and

focus group discussion

5 Farming Unit Observation, in-depth interviews and

focus group discussion

6 By-products

Procurement Unit

In-depth interviews, observation and

industry records

After conducting in-depth interviews and focus group discussion with the employer

and top-level executives of the poultry parent stock (PS) farm, the study justified the

selection of a number of variables which were important for both the study and poultry

farming. In some cases, the observation method was also used to cross-check the

reliability of responses through in-depth and focus group outcomes. The list of

variables (Table 5.2) considered to be important were put into the system for

simulation for this research. It was a little challenging to consider appropriate and key

variables due to the lack of previous literature on the poultry supply chain. The

selection of variables is an important issue that helps to build a causal or soft model.

However, focus group discussion, in-depth interviews and observation made it easy to

select major variables in which dynamic behaviour could be found. Clearly, dynamic

behaviour depends on the dynamic loop system between variables that have a positive

or negative effect (Sterman 2000, 1989; Wolstenholme 1999, 1990). Similarly, level or

133

stock variables are linked with a few other auxiliary and constant variables with

positive or negative loops (Georgiadis, Vlachos, and Iakovou 2005; Vlachos, Georgiadis,

and Iakovou 2007). Key variables according to the respondents were identified with

these listed in Table 5.2. In the same table, level and auxiliary variables were taken

from different processing units such as the parent breeder farm, hatchery, distribution,

ultimate farmers and poultry wastes. At this point, the operational scope within the

variables was discussed. Ultimately, knowing the operational relationship between

variables led to a clear understanding about the existence of a dynamic loop between

the variables. The next section discusses the initial loop design for the poultry causal

model based on the causal diagram depicted in Figures 5.1 and 5.2.

Table 5.2: Important Variables for Modelling (Source: In-depth Interviews)

Process Unit Stock/level Variables Auxiliary Variables Did not

consider

Parent Breeder

Farm

Mature Parent

Mature Parent Capacity

Parent Chicks

Aged Parent

Culled Parent

Profits

Feed Supply

Disease

Hatchery Eggs

Hatchery

Day-old Chicks

Eggs per Parent

Broken Eggs

Eggs to Hatchery

Hatchery

Incubator

Distribution Middlemen Retail Rate

Retail Employment

Networking/

Scope

Ultimate Farm Farmers

Broiler Chickens

Time for Maturing

Chicken Supply

Calamities

Poultry Wastes Intestines

Feathers

Biogas

Fertilizers

Fish Feed

Artificial

Charcoal

Feed Wastes

Others Total Employment Minimum Employees Efficiency/Skills

Chicks Hatching Rate Chicks Mortality

5.2.3 Initial Loop with Key Variables

After having vigorous focus group discussion and in-depth interviews with the

respondents, the initial poultry supply chain was sketched, as shown in Figure 5.3. This

study is based on a poultry parent stock farm, which starts from the intake of ‘parent

134

breeder chicks and is followed by rearing parent breeder chicks for the particular

period to grow them into mature parents. Hatchable eggs are then produced by the

mature parent and the collected hatching eggs are sent to the hatchery unit. In the

hatchery, it takes 21 days to hatch the eggs then hatched chicks are supplied to the

distributor or middlemen. Middlemen and associate agents help the broiler chicks to

reach the ultimate farmers who rear them for another four to six weeks to mature.

Finally, mature broilers are served to consumers so they can eat the tasty meat as per

their requirements. This is the point of the utmost research boundary in making a

causal loop diagram for the poultry supply chain.

Figure 5.3: Initial Loop with Key Variables

In Figure 5.3, the causal diagram begins from the variable ‘parent chicks’ which is

positively connected with the ‘mature parent’ variable. This means, if more ‘parent

chicks’ input into the system, more ‘mature parents’ will grow up after a certain time.

Alternatively, this positive loop may generate negative growth if input is negative

(Wolstenholme 1990). The immediate variable of this poultry process is ‘eggs

produced', which comes from ‘mature parent’ at an approximate rate. These eggs go to

Eggs

Chicks

Total Sales

+

Profits

DesiredCapacity

Mature ParentCapacity

Parent Chicks

Mature Parent

Eggs Produced

+

+

+

Hatchery

+

+

+

+

+

135

‘eggs’ stock followed by ‘hatchery’ unit as further stock. Normally, the hatchery unit is

separate from the parent stock farm for the sake of maintaining hygiene.

All the collected eggs from the farm site are then usually shifted to the hatchery storage.

Hatchery storage has much larger capacity than the original capacity of the hatching

incubator. The case industry’s hatchery storage has three times larger capacity than the

hatching incubator for hatching chicks. The reason behind maintaining larger capacities

to control chicks’ production based on market demand and the situation regarding

calamities. It is also noted that eggs are input as a batch to the incubator for three

weeks. The standard and unique hatching time is 21 days (Ferguson and Joanen 1982)

including the three days in which the eggs stay in the setter machine. Three days later,

chicks are taken out from the setter machine. Then, these outgoing chicks are examined

thoroughly for proper grading by the hatchery quality control unit. High graded chicks

should have the prescribed weight, colour and energy. Finally, hatched chicks (broiler

or layer) are ready to travel to the ultimate farmers through dealers and distributors in

a different region. Altogether, 10 key variables were used to develop the initial causal

loop of the poultry process used to produce broiler/layer chicks.

The difference between parent chicks and broiler/layer chicks is genetic as parent

chicks are an immediate preceding breed of broiler and layer birds. Ready chicks are

packaged scientifically in a paper or bamboo box made with proper ventilation. They

are ready to travel all over the country as per sales requirements. Company-owned

transports deliver the chicks to the dealers of each sub-region. Dealers distribute the

chicks to sub-dealers who in turn distribute them to the ultimate farmers. Farmers rear

the chicks for 28-35 days depending on the market situation and demand. Mostly,

farmers sell their mature broilers within five weeks. This is the total process used to

create the causal loops. Within this journey, a number of equations and co-variables are

associated with the main key variables. These associated variables are known as

auxiliary and constant variables. The complete model was developed in the stock and

flow model where most of the necessary equations and formulae were incorporated to

run the model.

Figure 5.4 is an extended version of a causal loop diagram that has added 11 more

variables in the same loop in comparison with Figure 5.3. These newly added variables

are connected with the same loop with either positive or negative links. Newly added

136

variables are listed in Table 5.3 below. It is noted that minor loops like deaths, culled

and aged parents were ignored for model clarity. The additional variables in Table 5.3

were also considered in maintaining the supply chain dynamics in the Bangladesh

poultry industry. For example, ‘decision to purchase parent chicks’ is an important

variable which controls the dynamic behaviour of the whole supply chain. The more

parent chicks are input into the system, the more mature parent, eggs, chicks and

poultry wastes will be produced.

Figure 5.4: Extended Causal Diagram

Therefore, the rest of the output depends on how policy makers make the decision to

purchase parent chicks. The poultry business is a process which is completely

dependent on input. Poultry birds have to be maintained in a natural cycle of producing

eggs and meat which is not comparable with other daily products. More precisely, no

one can stop a poultry parent mother from producing eggs. At best, the eggs can be

consumed as our daily food intake rather than sending them to the hatchery to hatch

chicks. Similarly, the above listed variables have more importance in managing the

Eggs

Eggs toHatchery

Eggs hatchingChicks

Total Sales

+

+Profits

Ratio of Profits toDesired Profits

Effect of ProfitsRatio on Capacity

DesiredCapacity

Gap in Mature ParentCapacity to Desired

Capacity

New matureParent Capacity

Mature ParentCapacity

Ratio of MatureParent to Capacity

Effect of the Ratio ofMature Parent to Capacity

on New Orders

Decision to PurchaseParent Chicks Parent Chicks

Rate

Parent Chicks

Parent MaturingRate

Mature Parent

Eggs Produced

+

+

+

+

-

+

+

-

-

-+

+

+

+

+

+

Hatchery

+

+

+

137

poultry supply chain, production, reduction and other necessary matters. For the

reduction of future production, farmers can cull the parent mother so that egg output

will be reduced. If reduction is needed at the hatchery level, management can sell the

eggs to the open market for everyday consumption rather sending them to hatchery

incubators. This is how positive and negative flow can be maintained in a poultry

supply chain. Such combinations of negative and positive flow build the well-organized

dynamic behaviour of a system. The complete causal loop diagram (qualitative) model

for the integrated poultry supply chain is presented in the next section.

Table 5.3: Eleven Additional Variables for Causal Model Extension

SL No. Newly Added Variables

1 Decision to Purchase Parent Chicks

2 Effect of Profits Ratio on Capacity

3 Effect of the Ratio of Mature Parent to Capacity on New Orders

4 Eggs Hatching

5 Eggs to Hatchery

6 Gap in Mature Parent Capacity to Desired Capacity

7 New Mature Parent Capacity

8 Parent Chicks Rate

9 Parent Maturing Rate

10 Ratio of Mature Parent to Capacity

11 Ratio of Profits to Desired Profits

5.2.4 Comprehensive Causal Model

A number of variables exist in the poultry supply chain which starts from the ‘pure line’

breed and proceeds through to the ultimate consumption of meat and eggs . The study

considered only significant variables which play an important role in creating dynamic

behaviour in a poultry process system. An additional 13 important variables were

added to the current diagram in Figure 5.5 to represent more dynamic relationships

between the variables. Figure 5.5 is the complete view of the poultry causal diagram

where key variables were given as input according to their importance. A number of

variables were not given as input in this complete causal model due to the absence of

dynamic flow. A number of loops were designed in the same figure. The longest loops of

this causal model belong to ‘mature parent’ followed by ‘parent chicks’ and ‘hatchery’

138

variables. Numerous loops exist in Figure 5.5. For example, under the ‘parent chicks’

variable, there are 70 different loops of various lengths to express the complex nature

of the poultry supply chain. Similarly, almost every important variable in this diagram

contains a series of loops which is sufficient for understanding the dynamic

relationship between the variables.

It was evident from the in-depth interviews with respondents that a number of loops of

short length exist within the poultry forward and reverse supply chains. Figure 5.5

demonstrates a different expression of the causal diagram where most of the minor

loops were identified by adding plus (+) and minus (-) signs. Some of the variables do

not have a loop but instead are connected one way in a loop. This kind of variables

helps to form a loop or works as a driver of a loop. For example, policy variables and

calamities contain a bunch of co-variables such as political situation, disease, natural

disaster, finance, government policy, under/over-production, competitors’ actions and

market demand. Such variables do not have any loop but instead influence the next

loop of poultry ‘flock repeat’ and ‘parent chicks’ to assist the system flow of input and

information. Noticeably, these variables maintain an important role in driving the

model which determines the system behaviour of the entire model. Thus, the finalized

causal loop diagram is presented through the figure and explanation above. Figure 5.5

itself provides an adequate explanation of the relationships and loops existing between

the variables. Now, the causal loop diagram needs to be converted into the quantitative

stock and flow model. The necessary values for the linked variables need to be

provided to run the simulation model. Without running the simulation model, it would

be difficult to analyse the model to find the desired outcome of the current research.

The following section discusses converting the causal model into the stock and flow

(quantitative) model.

139

Figure 5.5: Complete View of Poultry Causal Model

Eggs

Eggs toHatchery

Eggs hatchingChicksTotal Sales

+

+

Profits

Ratio of Profits toDesired Profits

Effect of ProfitsRatio on Capacity

DesiredCapacity

Gap in Mature ParentCapacity to Desired

Capacity

New matureParent Capacity

Mature ParentCapacity

Ratio of MatureParent to Capacity

Effect of the Ratio ofMature Parent to Capacity

on New Orders

Decision to PurchaseParent Chicks Parent Chicks

Rate

Parent Chicks

Parent MaturingRate

MatureParent

Eggs Produced

+

+

+

+

-

+

+

-

-

- +

+

+

+

+

+

Desired MatureParent+

Gap in Desiredmature Parent

+

+

-

-

Parent no LongerProductive

+

-

Cost Per MatureParent Per Week

+

Total Cost +

-

Aged Parent

Sell Parent asMeat

+

+

+

Culled ParentRate

Culled Parent

+

+

+

-

+

Hatchery

+

+

+

UnhatchedEggs

Eggs DrainOut+

+

-

-

+

+

+

PoultryWastes

+

+

By-Products

+

+

-

140

5.3 STOCK AND FLOW MODEL FOR SIMULATION (QUANTITATIVE)

There is a debate on which should be built first, the causal model or the stock and flow

model? The question can be answered either way (Bouwer, Machado, and Bredeweg

2002; McDoland 2013) as was discussed in the methodology chapter (see chapter 4) .

Through explaining a causal loop diagram, one can understand the relationship

between related variables and the nature of a model. However, it is never possible to

understand whether or not the causal loop model replicated reality. To replicate reality

is not the only objective for building a model which is instead used for experimentation

until it achieves optimality or productive changes. To do so, there is no alternative to

converting the causal loop model into a stock and flow quantitative simulation model.

In addition, this model building needs appropriate research tools to run the simulated

model in order to observe the behaviour of the variables. Objectives, the process and

tools of the stock and flow model were discussed in chapter 4. A simulation model can

extend or eliminate variables to perceive the behaviour of the model. Moreover,

optimization, sensitivity, validity and reliability are major issues to be considered for a

good model. Initially, a simple stock and flow model on poultry ‘eggs’ and ‘chicks’ is

developed in the following section.

5.3.1 Simple Stock and Flow Model on ‘Eggs and Chicks’

A simple causal loop diagram was built in Figure 5.1 using the variables ‘eggs’ and

‘chicks'. A basic stock and flow model was developed based on the same variables, as

reflected in Figure 5.6. As shown on this figure, a stock named ‘eggs’ can accumulate the

resource and can be quantified at any point in time. The dimension of this level or stock

variable is in resource units of ‘eggs’. A flow or rate variable is used in both the right-

hand and left-hand side of the level variable to control the increment or decrement of

the flows. Such flows can be regulated by the constant variables of ‘eggs collect rate

from the parent mother’ and ‘hatching rate’. Incoming and outgoing flows are

controlling the stock of eggs. Flows can also be controlled by the auxiliary or lookup

variables. Outgoing chicks' rate cannot be higher than the eggs collect rates as stock is

never represented as negative. If incoming flows stop supplying eggs towards stock,

then there will be no eggs to hatch the chicks. This means that the operation should be

stopped after a certain time; otherwise, the model needs to be directed by other inflow

to continue the business process. To implement the realistic model in a virtual

environment, stock and rate variables are important to determine to run the model

141

which will act like a real-life process. The following section discusses different stock

and flow rates for the integrated model.

Figure 5.6 Basic Stock and Flow Model

5.3.2 Stock and Flow Rate

To construct the complete stock and flow poultry supply chain model, the researcher

spent a few days in the case industry to observe various operations. By observing the

related process for a few days, the researcher started to compare what was observed

with the information perceived through in-depth interviews and focus group

discussion. The most important task was to identify the flow rate for numerous

constant and auxiliary variables. The parameters are determined using different

distribution like average, random uniform and fixed rate. Different rates are

determined through diverse way to justify real life context based on the case industry

operation. These rates are important for the model as the real-life operation needs to

be reflected in the simulation model in order to check structural validity. The

information related to stock and rates was collected through in-depth interviews and

focus group discussion. Collected information was later checked through the

observation method. Only insignificant differences were found between in-depth

interviews, focus group information and observation. Despite the insignificance of the

differences, differentiated information was cross-checked which found the minor

differences in comparison to the given data. This deviation is frequent in the poultry

industry as this business works with live poultry birds and perishable eggs. Any kind of

calamities and political unrest can change the usual plan. Even fluctuations in market

demand for chicks and eggs are high in the Bangladesh economy which may cause a

radical flow change in the existing process.

Eggs

Eggs In Chicks Out

Eggs Collect Rate

From Parent Mother Hatching Rate

142

5.3.3 Complete Stock and Flow Model

As shown on Table 5.2, substantial stocks, auxiliaries and constants were identified

through the in-depth interviews. Variables were cross-checked by the researcher’s

rigorous observation to match reality. Finally, the variables were selected to use as

components of the model. The model building process was discussed in the

methodology section (chapter 4). After careful investigation, essential variables for

individual stocks were identified and then a more complete integrated supply chain

model was constructed for simulating the results. Figure 5.7 is the simplified version of

the completed model where the main stocks' variables were modelled with necessary

rate valves and auxiliaries.

As shown on Figure 5.7, parent chicks' stock is determined through deducting from

parent chicks' rate (inflow) and parent maturing rate (outflow). Outflow for parent

chicks' stock is treated as inflow for the mature parent stock. Then, the mature parent

has two different outflows of aged parent and culled parent. Here, ‘aged parent’ denotes

the bird that is already aged and unable to provide healthy hatchable eggs whereas

‘culled parent’ means the bird that develops sudden sickness and weakness and is to be

culled. At this point, total birds are counted through accumulating both parent chicks

and mature parents. Mature parents provide hatchable eggs that are forwarded to the

hatchery. In this stage, eggs and hatchery are the two different stocks determined by

the number of eggs produced and delivered to the hatchery. Later, the hatchery is used

to incubate all the delivered eggs to produce day-old chicks (DOCs). DOC production is

dependent on the hatching percentage and the performance of the hatching incubator.

Immediately, the DOCs are shifted towards the forward supply chain of distributors,

agents and sub-agents who supply them to the ultimate farmers. Finally, farmers rear

day-old chicks (DOCs) for a certain period to grow them as broiler chickens for final

consumption. In addition, Figure 5.7 models the reverse flow of poultry litter, feathers,

unused and unhatched eggs, and intestines for further processing. It is clearly visible in

the model that these wastes are used to make different by-products which are

represented as the stock variable. All these stock variables are connected with inflow

and outflow valves (rates) to determine the final stock remaining. Finally, the model

also displays an option to accumulate the amount of employment generation from the

various processes. Thus, this model is a more simplistic view than the later model (see

Figure 5.8).

143

Figure 5.8 shows the complete stock and flow diagram developed for the integrated

poultry supply chain. This is the final model which will be used for testing,

experimenting and validating with regard to the research objectives and questions.

‘Parent chicks’, ‘mature parent’, ‘eggs’, ‘hatchery’, ‘farmers’, ‘middlemen’, ‘consumer’,

‘poultry litter’, ‘bakery items’, ‘poultry feathers’ and ‘poultry intestines’ are the

influential variables in this complete stock and flow model. The model has been divided

into 10 different segments, named and numbered in the square boxes. For instance,

No. 1 represents ‘parent stock’ where parent day-old chicks and mature parent

operations are discussed. The difference between Figures 5.7 and 5.8 is that more

connections are incorporated with the existing variables to make a loop. Loops are the

determining factors to change a variable in either a positive or negative direction.

Figure 5.8 provides a more detailed view Figure 5.7 with the inclusion of profits,

capacity, diverse effects, policy matters and ratios thus making the model more

realistic. The following sections discuss causes' trees of the key variables to show their

domination and impact over other variables in the model. The linkage with the other

associated variables are easy to identify and these can be affected positively or

negatively through changing a certain value for a variable.

5.3.4 Causes Tree

According to the Vensim manual (McDoland 2013), when constructing and analysing a

model, a causes tree is an easy way to realize what is causing other things to make

changes. The causes tree diagram shows the causes of a variable; the uses tree diagram

shows the uses of a variable. Tree diagrams show causes and use up to two variables

distant (the default setting) (Eberlein 2003; Vensim 1999). It is easy to communicate

the causes behind the changing behaviour of a particular variable. This helps to trace

the causes variables for specific variables in a complex model.

5.3.4.1 Causes Tree for ‘Mature Parent’ Variable

The causes tree for the ‘mature parent’ variable is shown in Figure 5.9 which

represents the sequential order of connected co-variables with the main variable.

‘Culled parent rate’, ‘deaths’, ‘initial mature parent’, ‘parent maturing rate’ and ‘parent

no longer productive’ are the immediate connected variables for the mature parent

stock. Five co-variables which may have positive or negative impacts over a loop are

therefore associated with the 'mature parent' variable.

144

Figure 5.7: Simplified Stock and Flow Model for Integrated Poultry Supply Chain

145

Figure 5.8: Complete Stock and Flow Model for Integrated Poultry Supply Chain

146

Figure 5.9: Causes Tree for Mature Parent

For instance, ‘culled parent rate’, ‘deaths’ and ‘parent no longer productive’ have

negative impacts over ‘mature parent’. All three variables will force a decrease in

mature parent at different rates based on values provided in the next order variables

such as ‘culled per week’, ‘deaths rate due to disease’ and ‘average productive life’. The

variables, inside the brackets, help the immediate variable to decrease its value

depending on the particular rate values that are provided by the constant or auxiliary

variable. Alternatively, a variable such as 'parent chicks' can be either positive or

negative based on the rate provided through the next order variable of ‘time to mature

parent’. The reason is that the more ‘time to mature parent’ means a delay in

accumulating mature parents which will decrease the flow. Conversely, less ‘time to

mature a parent’ will lead to a flow of more mature parents to provide more production

in the next phase. This is how the poultry system is working to shift value from one

variable to another to maintain the optimum output for each variable.

5.3.4.2 Causes Tree for Parent Chicks

As shown in Figure 5.10, ‘parent chicks’ consists of four different variables of ‘aggregate

policy impact’, ‘initial parent chicks’, ‘parent chicks rate’ and ‘parent maturing rate’.

Therefore, ‘parent chicks’ is determined based on the behaviour of these four variables

that are connected with co-variables of ‘aggregate policy rate’, ‘decision to purchase

parent chicks’ and ‘time to mature parent’. Importantly, the ‘decision to purchase

147

parent chicks’ influences the ‘parent chicks rate’ variable to determine the ultimate

stock of ‘parent chicks’. At the same time, parent chicks are drained out towards mature

parents once they become mature. This is how the causes tree for parent chicks is

coordinated with other variables. The next phase collects eggs from the parent mother

which is discussed in the section below.

Figure 5.10: Causes Tree for Parent Chicks

5.3.4.3 Causes Tree for Eggs

As shown on Figure 5.11, ‘eggs’ involves the three variables of ‘broken eggs rate’, ‘eggs

produced’ and ‘eggs to hatchery’. The inflow of eggs comes from the number of eggs

produced from the parent mothers. Later, the outflow of eggs is determined by the rate

of eggs supplied to the hatchery unit and the draining out of broken eggs. Furthermore,

second-order variables are connected with a few other variables. For example, ‘eggs

per chicken per week’ determines the ultimate numbers of eggs produced from mature

parents. Similarly, the ‘hatchery in’ rate determines the number of eggs that flow

towards the hatchery. The next section discusses the hatchery causes tree.

148

Figure 5.11: Causes Tree for Eggs

5.3.4.4 Causes Tree for Hatchery

As shown on Figure 5.12, ‘hatchery’ is associated with four variables of ‘eggs hatching’,

‘eggs to hatchery’, ‘eggs drain out’ and ‘unhatched eggs rate’. The inflow of the hatchery

unit is determined by the number of eggs accumulating over time from the ‘eggs'

variable. ‘Hatchery unit’ is a very important variable for the poultry supply chain. If the

market is unstable and demand is low, farm management may make the decision to

drain out a certain percentage of eggs to maintain the necessary chicks flow. Moreover,

the hatchery unit always preserves a substantial percentage of eggs in their stock to

control the demand and supply situation of the market. For instance, if demand is very

high, then farmers will hatch the maximum capacity of chicks, whereas low demand

will cause them to decrease the number of hatching eggs going to the hatching

incubators. The following section discusses the causes tree for poultry litter.

Figure 5.12: Causes Tree for Hatchery

149

5.3.4.5 Causes Tree for Poultry Litter

Poultry litter is one of the important concerns for the current study. Litter can flow

from mature parent stock and broiler farms. However, this study is based on the parent

breeder farm which has a different life cycle to the broiler farm. In addition, the broiler

farm is beyond the scope of the research case. For this study, the model has only

considered the parent stock farm with regard to collecting poultry litter. As shown on

Figure 5.13, ‘poultry litter’ includes the two variables of ‘mature parent’ and ‘average

litter rate’. The accumulation of poultry litter depends on the litter collection rate over

the number of mature parents. Collected litter is then distributed to small and medium

industries (SMEs) to make by-products. The next section discusses the causes tree for

total employment which is very significant to analysis for this research.

Figure 5.13: Causes Tree for Poultry Litter

5.3.4.6 Causes Tree for Total Employment

As shown in Figure 5.14, ‘total employment’ consists of nine variables within the

employment opportunities of ‘mature parent’ and ‘average litter rate’. The

accumulation of total employment depends on various operations in a poultry supply

chain. Nine different variables lead to creation of employment in the poultry operation

in Bangladesh. Most employment comes from the levels of parent chicks, mature parent

and farmers. It is important to realize the opportunity of creating more employment

through reusing poultry wastes. The knowledge relating to cause and effects for a

specific variable with its associated variables is revealed in the above discussion. The

next section discusses the length of the loops which is essential for recognizing how to

track associates’ loops in a comprehensive qualitative SD model.

150

Figure 5.14: Causes Tree for Total Employment

The above discussion is presented causes tree for the important level variables of the

simulation model. Mature parent, parent chicks, eggs, hatchery, poultry litter and total

employment variables were discussed in the preceding sections. Causes tree is easy to

identify the connected variables with positive and negative relationship. In fact, causes-

tree can help to track a loop with related variables. It is also easy to understand that

how a level value determines through involving several variables. For example, figure

5.12 is shown the causes tree for hatchery (level) variable where four distinct variables

(eggs hatching, eggs to hatchery, eggs drain out, and unhatched egg rate) are involved

to determine the ultimate value. Again, these four different variables are linked with

other variables to determine their individual values. For instance, ‘eggs to hatchery’ is

regulated by the number of eggs flow with a ‘hatchery in rate’. This is how; modeller

can find this tool useful to track a loop and its associate second and third order

variables.

151

5.3.5 Length of Loops

Fundamentally, the length of loop means the loops under a major loop. Length of loop

denotes the number of variables associated with a particular loop before it returns to

the first variable. One variable can be used as part of a different loop. In theory, the

causal loop diagram defines an impression of system behaviour along with connected

variables (Sterman 1989; Wolstenholme 1990, 1999; Richardson and Pugh III 1981). A

number of loops exist in the current causal model. Specifically, major loops are linked

with the key variables of ‘parent chicks’, ‘mature parent’, ‘eggs’, ‘hatchery’ and ‘chicks’.

In fact, ‘mature parent’ is the most considerable variable in this causal model. The logic

behind giving more consideration to this variable is its impact over connected

variables. By way of illustration, if ‘mature parent’ declines, all other output will be

decreased with chicks, eggs and waste production hampered due to the reduction of

mature parents in the poultry system.

Furthermore, if ‘mature parent’ declines, this will have negative impacts on

employment generation, by-product procurement and many other aspects. Conversely,

if ‘mature parent’ increases, all the output will be increased or have a chance to

increase to achieve more profit with optimality. Table 5.4 presents the number of loops

and their length associated with the key variable of ‘mature parent’. The length of loops

signifies the number of variables linked with one variable which comes back to the

same variable. At this point, ‘loop 10 length 17’ means that the mature parent loop

consists of 13 different loops and it is discussing the 10th loop that has 17 different

variables associated with it. Loop number 10 contains 17 different linked variables,

starting from the ‘mature parent’ variable followed by another 16 variables which

travel back to the same variable to make a loop. Value changes for one particular

variable will definitely affect the following variables and the whole loop either

positively or negatively. In addition, a variable can be part of various loops. In this

situation, a value change for a participating variable from a different loop can also affect

other loops if it is part of other loops. This means that the loop will be affected if any

changes are made in a connecting variable within the same loop. Thus, the instrument

for checking the loop cycle is a useful component within the research tool. Using this

option, one can easily trace the sources of positive and negative influence over a

variable.

152

Table 5.4: Loops Associated with Key Variable of ‘Mature Parent’

Mature Parent Loops

Loop Number 1 of length 1 Mature Parent Capacity

Ratio of Mature Parent to Capacity

Effect of the Ratio of Mature Parent to

Capacity on New Orders

Decision to Purchase Parent Chicks

Parent Chicks Rate

Parent Chicks

Parent Maturing Rate

Mature Parent

Parent no Longer Productive

Loop Number 2 of length 1

Mature Parent

Culled Parent Rate

Loop Number 3 of length 1

Mature Parent

Deaths

Loop Number 10 of length 17

Mature Parent

Culled Parent Rate

Culled Parent

Sell Parent as Meat

Total Sales

Profits

Ratio of Profits to Desired Profits

Effect of Profits Ratio on Capacity

Desired Capacity

Gap in Mature Parent Capacity to

Desired Parent Capacity

New Mature Parent Capacity

Mature Parent Capacity

Ratio of Mature Parent to Capacity

Effect of the Ratio of Mature Parent to

Capacity on New Orders

Decision to Purchase Parent Chicks

Parent Chicks Rate

Parent Chicks

Parent Maturing Rate

Loop Number 4 of length 5

Mature Parent

Gap in Desired to Mature Parent

Decision to Purchase Parent Chicks

Parent Chicks Rate

Parent Chicks

Parent Maturing Rate

Loop Number 5 of length 6

Mature Parent

Ratio of Mature Parent to Capacity

Effect of the Ratio of Mature Parent to

Capacity on New Orders

Decision to Purchase Parent Chicks

Parent Chicks Rate

Parent Chicks

Parent Maturing Rate

Loop Number 6 of length 15

Mature Parent

Cost Per Mature Parent Per Week

Total Cost

Profits

Ratio of Profits to Desired Profits

Effect of Profits Ratio on Capacity

Desired Capacity

Gap in Mature Parent Capacity to

Desired Parent Capacity

New Mature Parent Capacity

Mature Parent Capacity

Desired Mature Parent

Gap in Desired to Mature Parent

Decision to Purchase Parent Chicks

Parent Chicks Rate

Parent Chicks

Parent Maturing Rate

Loop Number 11 of length 17

Mature Parent

Culled Parent Rate

Culled Parent

Sell Parent as Meat

Total Sales

Profits

Ratio of Profits to Desired Profits

Effect of Profits Ratio on Capacity

Desired Capacity

Gap in Mature Parent Capacity to

Desired Parent Capacity

New Mature Parent Capacity

Mature Parent Capacity

Desired Mature Parent

153

Loop Number 7 of length 15 Gap in Desired to Mature Parent

Decision to Purchase Parent Chicks

Parent Chicks Rate

Parent Chicks

Parent Maturing Rate

Mature Parent

Cost Per Mature Parent Per Week

Total Cost

Profits

Ratio of Profits to Desired Profits

Effect of Profits Ratio on Capacity

Desired Capacity

Gap in Mature Parent Capacity to

Desired Parent Capacity

New Mature Parent Capacity

Mature Parent Capacity

Ratio of Mature Parent to Capacity

Effect of the Ratio of Mature Parent to

Capacity on New Orders

Decision to Purchase Parent Chicks

Parent Chicks Rate

Parent Chicks

Parent Maturing Rate

Loop Number 12 of length 20

Mature Parent

Eggs Produced

Eggs

Eggs to Hatchery

Hatchery

Eggs Hatching

Chicks

Total Sales

Profits

Ratio of Profits to Desired Profits

Effect of Profits Ratio on Capacity

Desired Capacity

Gap in Mature Parent Capacity to

Desired Parent Capacity

New Mature Parent Capacity

Mature Parent Capacity

Ratio of Mature Parent to Capacity

Effect of the Ratio of Mature Parent to

Capacity on New Orders

Decision to Purchase Parent Chicks

Parent Chicks Rate

Parent Chicks

Parent Maturing Rate

Loop Number 8 of length 17

Mature Parent

Parent no Longer Productive

Aged Parent

Sell Parent as Meat

Total Sales

Profits

Ratio of Profits to Desired Profits

Effect of Profits Ratio on Capacity

Desired Capacity

Gap in Mature Parent Capacity to

Desired Parent Capacity

New Mature Parent Capacity

Mature Parent Capacity

Desired Mature Parent

Gap in Desired to Mature Parent

Decision to Purchase Parent Chicks

Parent Chicks Rate

Parent Chicks

Parent Maturing Rate

Loop Number 13 of length 20

Mature Parent

Eggs Produced

Eggs

Eggs to Hatchery

Hatchery

Eggs Hatching

Chicks

Total Sales

Profits

Ratio of Profits to Desired Profits

Effect of Profits Ratio on Capacity

Desired Capacity

Gap in Mature Parent Capacity to

Desired Parent Capacity

New Mature Parent Capacity

Mature Parent Capacity Loop Number 9 of length 17

154

Mature Parent

Parent no Longer Productive

Aged Parent

Sell Parent as Meat

Total Sales

Profits

Ratio of Profits to Desired Profits

Effect of Profits Ratio on Capacity

Desired Capacity

Gap in Mature Parent Capacity to

Desired Parent Capacity

New Mature Parent Capacity

Desired Mature Parent

Gap in Desired to Mature Parent

Decision to Purchase Parent Chicks

Parent Chicks Rate

Parent Chicks

Parent Maturing Rate

The above information on various loops is only related to the ‘mature parent’ stock

variable within the model. These causes can be traced from the model (see figure 5.8)

by using the research tools. The linked variables are listed in Table 5.4 along with their

loop number and length. Altogether, 13 individual loops are associated with the

‘mature parent’ variable, which contains various lengths of loops. Length of loops starts

from minimum 2 to maximum 20 variables. This list helps decision-makers and policy

makers to estimate the overall changes based upon the deviation of a key variable. It is

very important to communicate the loop’s length which assures the scope of the loop.

One particular loop may contain positive and negative relationships between different

variables. If so, it would be difficult to presume the ultimate behaviour of the system

until it was, or unless it was not, modelled with the stock (level) and flow (rate). A stock

and flow model can be produced showing the real behaviour of the system and the

behaviour of its individual variables over time. The current research is focused on an

integrated supply chain process which is discussed in the following section.

5.3.6 Integrated Stock and Flow Model for Poultry Supply Chain

An integrated poultry supply chain model was developed based on the causal loop

diagram depicted in Figure 5.5. All the necessary stock and flow variables were

connected with each other just as they are in real-life practices. The complete view of

the integrated poultry supply chain model is shown on Figure 5.7 on which necessary

variables have been connected with appropriate information, rates and formulae.

Altogether, 143 variables, including 22 auxiliary and constant variables and nine level

variables, were used in this model. After identifying the key variables, this study

detected the relevant auxiliary, rate and constant variables for the sake of replicating

155

the poultry supply chain operation. In doing so, a number of variables were found to be

associates with a key variable. The researcher split the whole model into 10 different

areas and also identified key variables for each area, as shown in Table 5.5.

Table 5.5: Identifying Key Areas and Variables for Quantitative Model

SL Main Areas Key Variables

1 Parent Stock Parent Chicks Rate, Parent Maturing Rate, Deaths, Aggregate

Policy Impact, Culled Parent, Aged Parent, Policy Variable

2 Capacity Decision Mature Parent Capacity, Desired Mature Parent, Ratio of

Mature Parent to Capacity, New Mature Parent Capacity,

Initial Gap in Mature Parent Capacity to Desired Parent

Capacity, Adjustment Time for Mature Parent Capacity, Time

to Make Purchasing Decision, Decision to Purchase Parent

Chicks, Effect of the Ratio of Mature Parent to Capacity on

New Orders

3 Profit and Loss Cost Per Mature Parent Per Week, Effect of Profits Ratio on

Capacity, Ratio of Profits to Desired Profits, Desired Profits,

Profits, Total Cost, Other Costs, Total Sales, Average Chicks

Price, Sell Parent as Meat, Average Meat Price

4 Eggs and Hatchery Eggs Produced, Eggs Per Chicken Per Week, Broken Eggs,

Eggs, Eggs to Hatchery, Hatchery, Eggs Hatching, Chicks,

Unhatched Eggs, Time for Eggs to Hatch, Hatching

Percentage

5 Farmers and

Middlemen

Farm In, Chicken Mortality Rate, Time to Mature Chicken,

Chickens Maturing for Market, Retail Rate, Middlemen,

Farmers, Broiler Chicken, Chicken Supply, Consumed, Time

Middlemen Hold Chickens

6 Poultry Litter Biogas, Biogas Conversion Rate, Fish Feed Conversion Rate,

Fertilizer Conversion Rate, Poultry Litter, Fish Feed, Average

Litter Rate, Fertilizer Conversion Rate

7 Poultry Feathers Feathers, Feathers Dumped, Feather Collection, Broiler

Feather Collection Rate, Broiler Feathers, Parent Feathers,

Parent Feather Collection Rate, Time to Collect Feathers

8 Employment Total Employment, Mature Parent Empl, Hatchery Empl,

Farmers Empl, Middlemen Empl, Chicks Dist. Empl, Biogas

Empl, Fertilizer Empl, Fish Feed Empl, Parent Chicks Empl

9 Bakery Items Eggs Supply to Bakery, Broken Eggs, Unhatched Eggs,

Unhatched Rate, Eggs Drain out due to Low Demand, Eggs

Drain Rate, Broken Rate

10 Poultry Intestines Intestines, Intestines Dumped, Intestines Collect,

"Intestines/Broiler", "Intestines/Parent"

156

The above-mentioned areas play important roles in operating a sustainable poultry

industry if they interact between variables. For example, reversing poultry wastes

needs to be organized to handle the different kinds of wastes for diverse usage. Poultry

litter can be used for making by-products such as fertilizers, fish feed, biogas, artificial

charcoal and also is used for land filling and fertilizing uncultivable lands. Therefore,

different by-products have distinctive processing which should have coordination

between the related variables. Furthermore, the producer needs to think about the

capacity and volume of poultry wastes that they can collect at best from their

operation. To establish a large or small by-product processing unit, it is expected that

the producer might consider either profitability or protecting from environmental

damage. Profitability is the main motive for running any kind of business (Teece 2010;

Lo 2010; Narver and Slater 1990) with a business always striving to do more and more

for its individual industry. Therefore, profitability or economic issues must be

considered when processing further by-products. However, at the same time, a

hygienic environment is one of the prime concerns with regard to the poultry business:

this may require farmers to process their poultry wastes to achieve environmental

sustainability rather than to obtain profits. Parent stock component from the model is

discussed in the following section (see figure 5.8).

5.3.6.1 Parent Stock

The topmost poultry breed is called pedigree stock or ‘pure line’ which is kept on high-

level biosecure farms in a few countries. The eggs collected from ‘pure line’ birds are

hatched in a special hatchery, and their immediate breeds are named as great

grandparent (GGP) and grandparent (GP) generations. Eggs collected from GPs are then

hatched to get a new breed of parent stock (PS) (AAFC 2012). Fascinatingly, 45,000,000

thousand commercial broiler genetics form a pure line or pedigree mother (Williams

1999). Therefore, poultry genetics is very costly and needs to organize proper planning

to manage these flocks. The current case industry maintains parent stock chicks, grows

them to collect eggs, and then sends the eggs to the hatchery to hatch broiler chicks.

Therefore, the quantity of parent stock that the farm needs to rear is a vital decision to

maintain optimum production. The case industry must consider market fluctuation,

season, supply–demand and other calamities to manage their parent stock flock.

Table 5.6 presents the ‘parent stock’ variable and the purposes of its co-variables and

their equations to construct and drive the model. It is strategic to determine the rate of

157

parent chicks entering the system to maintain optimum production. The difficult

question is: what is the ‘parent stock’ requirement for different seasons in a year? The

respondents of this study confirmed the seasonal adjustment of poultry parent stock

due to seasonal variation of market demand for the sale of chicks. Ultimately, the

production of chicks depends on the quantity of parent chicks reared by the farm. At

the same time, the farm policy maker needs to consider the impacts of different policies

on parent stock farming. Policies can be associated with finance, government assistance

for farming, market demand and competitors’ actions which are very important factors

needing to be considered to maintain sustainable farming. Decisions relating to parent

stock capacity are discussed in the next section.

Table 5.6: Purposes and Equations for Determining Parent Stock

Par

ent

Sto

ck

Co-Variables Purpose Equation

Parent Chicks Rate

At what rate do parent chicks enter the system per time boundary with delays? The rate depends on the ‘decision to purchase parent chicks’ variable.

= (Effect of the Ratio of Mature Parent to Capacity on New Orders * Gap in Desired to Mature Parent)/Time to Make Purchasing Decision

Parent Maturing Rate

At what rate are parents maturing with delays.

= Parent Chicks/Time to Mature Parent

Deaths How many deaths occurred due to disaster and disease?

= Deaths Rate due to Disease * Mature Parent * Deaths Due to Disaster

Policy Variable and Aggregate Policy Impact

How do policy variables change the system’s behaviour?

= Parent Chicks * Aggregate Policy Rate, where, Aggregate Policy Rate = (Policy Variable * Policy Impact Rate/Tenure) * PULSE TRAIN( 34 , Tenure, 68, 1000 )

Aged Parent

What is the maximum age of a parent to remain productive? The maximum tenure of remaining productive is 42 weeks.

= Mature Parent/Average Productive Life

Culled Parent What percentage is to be culled during parent growing stage?

= Mature Parent * Culled Per Week

5.3.6.2 Parent Capacity (Capacity Decision)

Table 5.7 represents the ‘parent capacity’ variable and the purposes of its co-variables

and their equations in constructing and determining the optimum parent capacity. It is

158

also predetermined to control the number (rate) of parent capacity through adjusting

poultry shed size. It is always expensive to maintain infrastructural support for greater

capacity than is required. Capacity needs to be adjusted to the supply and demand

situation in the market. Two types of capacity exist in the parent breeder farms,

namely, parent chicks and mature parent-rearing capacity. Obviously, mature chicks'

capacity building is much more expensive than parent chicks' infrastructure. Parent

chicks’ brooding can be done in the open poultry house whereas the mature parents

require environmentally controlled or a scientific shed to maintain biosecurity and

achieve maximum production. Moreover, the ratio between an existing number of

parents and capacity may influence redesigning for the ultimate parent capacity.

Similarly, a positive profit ratio may also lead to considering an increase in parent

capacity.

Table 5.7: Purposes and Equations for Determining Parent Capacity

Par

ent

Cap

acit

y

Co-Variables Purpose Equation

Mature Parent Capacity

How to calculate total mature parent capacity based upon new mature parent capacity and time adjustment?

= Gap in Mature Parent Capacity to Desired Parent Capacity/Adjustment Time for Mature Parent Capacity

Initial Gap in Mature Parent Capacity to Desired Parent Capacity

How to find out the gap between desired capacity and mature parent capacity

= Desired Capacity – Mature Parent Capacity

Decision to Purchase Parent Chicks and Time to Make Purchasing Decision

How much time is involved in making decisions on chicks purchasing and how does mature parent capacity ratio influence the decisions?

= (Effect of the Ratio of Mature Parent to Capacity on New Orders*Gap in Desired to Mature Parent)/Time to Make Purchasing Decision

Ratio of Mature Parent to Capacity

How the ratio of mature parent and its capacity is used for determining ultimate capacity?

= Mature Parent/Mature Parent Capacity

This will create a ratio which will be used in calculating mature parent capacity

159

In Figure 5.7, the time factor is also considered in increasing and adjusting capacity

which depends on company policy and market demand. If market demand is

consistently increasing, the industry makes the decision to increase capacity. In doing

so, finance is one of the main issues, that is, whether or not the farm is eligible to

increase its capacity. If finance is difficult to obtain from the financier, then the

company is forced to be happy with its existing capacity. If the farm has managed to

secure finance and other things needed to increase its capacity, the second immediately

significant factor is time. Poultry parent chicks must be reared for a certain time

(24 weeks at least) to produce eggs which will need another three weeks to hatch the

day-old chicks. Altogether, 27 weeks are needed to achieve production after the farm

has decided to increase its production. Before this process, the industry needs to

request the grandparent (GP) farm to supply day-old parent chicks which are not less

than four to eight weeks old. Thus, the farm needs to have good ability to forecast its

upcoming demand well in advance in order to increase its production capacity. The

time to make the purchasing decision about parent chicks is linked with the adjusted

mature parent capacity. Therefore, the relevant lead time should be minimized to in

order to achieve additional production to catch up with the market’s surplus-demand

situation. The next section discusses the profit and loss component of the model.

5.3.6.3 Profit and Loss

Profit and loss are important instruments for a business, helping an industry to grow

and face a challenging and competitive environment. The more profit gained by a

company, the more focus goes into further extension or increased production capacity.

Without profit, a firm even cannot think about to run the existing business process. In

the current model, the ‘profit and loss’ area is already identified with several associated

variables as shown in Table 5.8. Day-old broiler chicks are noted as the main business

for the case farm. The main revenue comes from selling day-old chicks to distributors

and then to farmers. In addition, aged parent meat, culled parent meat, and unhatched

and reject eggs are additional income sources of the company. The company has set its

desired profit which drives innovative decisions such as farm extension, flock addition

and further capacity building. The model simply calculates profits through deducting

costs from the sales. To do so, total costs are calculated from cost per parent and

mature chicks along with other costs. On the other hand, average chicks’ price and sold

meat price are accumulated as total sales. Costs are then deducted from sales to

160

calculate profits. Next, the eggs and chicks area of the model is discussed in the

following section.

Table 5.8: Purposes and Equations for Determining Profit and Loss

Pro

fit

and

Lo

ss

Co-Variables Purpose Equation

Total Cost, Cost

Per Mature Parent

and Other Costs

How is cost of

parent and

chicks to be

calculated?

= Cost of Parent Chicks Per Week +

Cost Per Mature Parent Per Week +

Other Costs, where, Cost = Mature

Parent * Average Cost Per Week

Total Sales,

Average Chicks’

Price, Sell Parent

as Meat

How are total

sales measured?

= (Chicks * Average Chicks Price) +

Sell Parent as Meat

Desired Profits,

Profits and Ratio

of Profits to

Desired Profits

How to set

desired profit

ratio?

= Profits/Desired Profits,

Profit is an important issue for any

business. If ratio of profit and desired

profit goes up, the industry should

think about extending its business. It

is tricky to set the desired profit of

the business.

5.3.6.4 Eggs and Chicks

Eggs and chicks are the main business for this case industry. The more eggs produced

at the farm level; the more chicks will be hatched. Moreover, the more chicks hatched,

the more profit will be earned if the market rate is above the cost level. Table 5.9 shows

the number of eggs produced based on eggs produced per parent mother per week. A

percentage of eggs is rejected or broken on the way to reaching the hatchery. In the

hatchery, eggs are prepared for putting in the incubator for 21 days to hatch the chicks.

Within this process, the standard practice is that more than 15% of eggs are not

hatched. Later, these unhatched eggs are examined for reuse for other purposes such as

unbroken eggs for bakery use and broken eggs for fish feed. For the modelling purpose,

the equation for calculating eggs per parent mother uses random uniform distribution

as it varies from 4.1 to 4.3 per week. Obviously, the distribution value may change if

most of the birds in the flock are either aged or young. Likewise, broken, reject and

unhatched eggs reduce the number of eggs ready for hatching. The following section

discusses the farmers and middlemen section of the model.

161

Table 5.9: Purposes and Equations for Determining Eggs and Chicks

Egg

s an

d H

atch

ery

Co-Variables Purpose Equation

Eggs Produced,

Eggs Per

Chicken Per

Week

To measure

number of eggs to

be produced

= Mature Parent * Eggs Per Chicken

Per Week, where eggs per chicken per

week calculated through, RANDOM

UNIFORM (4.1 , 4.3 , noise seed )

Eggs To determine eggs

stock

= Broken Eggs Rate + Eggs Produced-

Eggs to Hatchery-Broken Eggs Rate

Broken Eggs To determine the

quantity of broken

eggs

= Eggs * Broken eggs rate, where rate

is determined, RANDOM UNIFORM

(0.03, 0.04, 1212)

Chicks To measure

hatched chicks for

distributing to the

ultimate farmers

= Eggs Hatching * Hatching

Percentage, where hatching

percentage is very important for

realizing hatchery efficiency

Hatching

Percentage

To control optimum

hatching

percentage

This is a constant value for particular

hatch but needs to maintain a

standard rate between 80% to 86%

5.3.6.5 Farmers and Middlemen

The ultimate farmers are a vital part of this poultry supply chain. Farmers receive their

supply of feed and chicks through the middlemen of the agents, sub-agents and dealers.

Often, middlemen have a strong role in maintaining farming across Bangladesh,

including remote areas. They make it easier for farmers, and breeder farm and hatchery

owners. Middlemen provide an important role in disseminating information, products,

medicine, feed and processed food for farmers and retail customers. In practice,

middlemen are operated through a third party where investment belongs to individual

agents and sub-agents. From the parent stock (PS) farm perspective, they maintain

their regional offices to control agents, sub-agents, dealers and other types of

distributors. Obviously, additional costs are added to the final products of meat, eggs,

and chicks by adopting services of every middleman. Table 5.10 shows the relevant co-

variables and their purpose and equations for determining farmers and middlemen in

constructing the stock and flow model. A standard mortality rate helps farmers to

maintain sustainable farming to provide quality meat and eggs. The other variables

such as maturing time, consumption and mature broiler birds also play important roles

in maintaining effective farming. Consumption of chicken and eggs with an expected

162

price are the final objectives of poultry farming. The following section discusses poultry

wastes and by-products as shown on the model.

Table 5.10: Purposes and Equations for Determining Farmers and Middlemen

Far

mer

s an

d M

idd

lem

en

Co-Variables Purpose Equation

Farmers How many chicks are reared by the ultimate farmers?

= Farm In – Chicken Mortality Rate – Retail Rate

Chicken Mortality Rate

What is the mortality rate?

= Farmers * Fraction Mortality, where Fraction Mortality = RANDOM UNIFORM (0.03, 0.05, Noise Seed )

Time to Mature Chicken

How much time involved in maturing chicks into chicken?

= 4, the model has used 4 weeks to mature a chicken from a chick. In 4 weeks, chicken can grow up to 1.5 kg.

Chickens Maturing for Market

How much delay used to mature a chicken?

= Farmers/Time to Mature Chicken

Broiler Chicken and Consumed

What is the broiler production and consumption rate?

= Chicken Supply - Consumed, where consumed = Broiler Chicken * Consumption Rate

5.3.6.6 Poultry Litter and By-products

Poultry litter and by-products are another essential part of the current research.

Poultry litter has a robust relationship with its conversion into diverse by-products. A

huge quantity of poultry litter can be reversed towards the same industry or to a third

party to be processed into various by-products. Such by-products are valuable in terms

of the economy, resources, the environment and society. Table 5.11 reveals all the

necessary variables relating to poultry litter and its by-products. A number of by-

products can be produced from poultry litter which were discussed in the literature

review section (chapter 2). Table 5.11 also provides information about fish feed,

fertilizers and biogas and their conversion rates from poultry litter. The next section

addresses the issue of poultry feathers which are a potentially valuable waste

providing the opportunity to bring additional benefits to farms and society.

163

Table 5.11: Purposes and Equations for Determining Poultry Litter and By-

products

Po

ult

ry L

itte

r Co-Variables Purpose Equation

Poultry Litter

and Average

Litter Rate

How much poultry litter

generated from a parent

per week?

= Mature Parent*Average

Litter Rate, where Average

Litter Rate is 0.00441

tonne/parent/week

Fish Feed and

Fish Feed

Conversion Rate

How much fish feed

produced using poultry

litter per week?

= Poultry Litter * Litter for

Feed * Fish Feed Conversion

Rate

Biogas and

Biogas

Conversion Rate

How much biogas produced

using poultry litter per

week?

= Poultry Litter*Litter for

Biogas * Biogas Conversion

Rate

Fertilizer and

Fertilizer

Conversion Rate

How much fertilizer

produced using poultry

litter per week?

= Poultry Litter * Litter for

Fertilizer * Fertilizer

Conversion Rate

5.3.6.7 Poultry Feathers

Poultry feathers are used to generate artificial plastic, pillows, beds, sofas, etc.

Unfortunately, the case industry is not using this waste for processing further by-

products. The study learnt that a small proportion of poultry feathers is taken by third

party processors who use it to make by-products. The case industry plans to reuse this

valuable waste in the near future. Table 5.12 shows the important variables associated

with collecting poultry feathers from the case industry. Feather collection time, total

feather collection, total feather dumped rate, parent feather and broiler feather

information are provided in the above table. Employment generation from different

supply chain processes is discussed in the following section.

Table 5.12: Purposes and Equations for Determining Poultry Feathers

Po

ult

ry F

eath

ers

Co-Variables Purpose Equation

Feathers and Time to Collect Feathers

How much feather collected in a certain time?

= Feather Collection-Feather Dumped: collection time used was 4 and 26 for Broiler and Parent respectively

Feather Collection

What quantities of feather remain in the stock?

= Broiler Feather + Parent Feather

Feathers How much feather dumped = Feather * Feather Dumped

164

Dumped in a certain time? Rate

Broiler Feathers and Collection Rate

How much feather collected from a broiler bird?

= (Broiler Chicken * Broiler Feather Collection Rate)/Time to Collect

Parent Feathers and Collection Rate

How much feather collected from a parent bird?

= (Mature Parent * Parent Feather Collection Rate)/Time to Collect Feather

5.3.6.8 Employment

Employment was one of the major concerns of this study in observing the social

benefits gained from poultry rearing. Every step of a poultry supply chain generates

employment opportunities. The most employment is generated from farming parent

chicks, mature parents and broiler chicks. The standard employment required is

around 1,000 birds per person. Millions of birds are reared in this poultry chain which

is a prime source of providing employment. Table 5.13 shows the important variables

associated with the total employment. It was also found from observation that the

reverse supply chain of processing and reuse of poultry wastes creates significant

opportunities for more employment. The purpose and equation formation of bakery

items is discussed in the next section.

Table 5.13: Purposes and Equations for Determining Employment

To

tal

Em

plo

ymen

t

Co-Variables Purpose Equation

Total Employment

How much employment is created over a particular time?

= Farmers Empl + Biogas Empl + Middlemen Empl + Fertilizer Empl+ Fish Feed Empl + Hatchery Empl + Mature Parent Empl + Parent Chicks Empl+ Chicks Dist Empl

Mature Parent Employment

How much employment can be created by rearing mature parents?

= Mature Parent * MPER, where MPER stands for Mature Parent Employment Rate

Parent Chicks Employment

How much employment can be created by rearing parent chicks?

= Parent Chicks * PCER, where PCER stands for Parent Chicks Employment Rate

Farmers Employment

How much employment can be created by rearing broiler chicks?

= Farmers * FER, where FER stands for Farmers Employment Rate

165

5.3.6.9 Bakery Items

Although bakery items are not part of the poultry industry, they make a valuable

contribution in this poultry supply chain. If eggs do not pass the standard quality test to

transfer to the hatchery, they are called reject eggs. If eggs have a minor scratch or

crack, they are called broken eggs. These two types of eggs along with unhatched eggs

are accumulated so they can be supplied to produce bakery items. Broken eggs and

unhatched eggs are determined using random uniform distribution in the simulation

model. In probability distribution under statistics, a random variable represents the

continuous changes of values (variable’s) due to chance (i.e. randomness) (Yates,

Moore, and Starnes 2002). It is justified to measure such parameters through random

uniform distribution as there is no fixed rate that can be applicable due to variation in

the real data. In random uniform distribution, this research use lower and upper values

along with noise seed to determine the ultimate rate in a simulation run. For instance,

broken and unhatched eggs rates vary on efficiency of eggs handling and hatchery

incubator machine respectively. In both the cases, the rates are unpredictable. To

control this unpredictability in the simulation model, this research used lower and

upper values (taken from case industry data) to determine random changes of values

over time. All the appropriate variables and their equations are presented in Table

5.14. Sometimes, market demand for chicks is less, and hatchery management needs to

make a decision to drain out a proportion of eggs for production of bakery items. This

action will cause extra loss for the industry and hatchery. An unused waste in the case

industry is poultry intestines which are discussed in the following section.

Table 5.14: Purposes and Equations for Determining Bakery Items

Bak

ery

Item

s

Co-Variables Purpose Equation

Eggs Supply to Bakery

How many eggs are supplied to bakery?

= Broken Eggs + Unhatched Eggs + Eggs Drain Out due to Low Demand

Broken Eggs What percentage of eggs is treated as broken based on real data?

= Eggs * Broken Rate, where broken eggs rate is RANDOM UNIFORM (0.03, 0.04, Noise Seed)

Unhatched Eggs

What percentage of eggs is treated as unhatched based on real data?

= 0.15 or RANDOM UNIFORM (0.15, 0.16, noise seed)

166

Eggs Drain Out due to Low Demand

How ‘Drain Out’ eggs are measured due to low demand?

= Fraction Drain Out * Eggs Drain Out Rate * Hatchery, model used zero (0) for eggs drain out but policy test may use a different value

5.3.6.10 Poultry Intestines

Poultry intestines are now used to produce fish feed although the case industry

previously dumped them in the trash or on low-lying land. Other things can be done

using poultry intestines which were discussed in the literature review (chapter 2).

Table 5.15 presents the relevant variables and their equations to understand the

quantity of intestines that is unused rather than taking the opportunity for it to be

productively reused.

Table 5.15: Purposes and Equations for Determining Poultry Intestines

Po

ult

ry I

nte

stin

es

Co-Variables Purpose Equation

Intestines How much intestines are in the stock?

= Intestines Collected–Intestines Dumped

Intestines/Broiler and Intestines/Parent

At what rates are intestines collected from broilers and parents?

0.062 kg/Broiler Intestines and

0.088 kg/Parent Intestines

Intestines Collect How much intestines are collected from broilers and parents?

= Broiler Intestines + Parent Intestines

Intestines Dumped

At what rate are intestines dumped?

= Intestines * Intestines Dumped Rate

5.4 SUMMARY

This chapter has described how the causal loop diagram was developed by following a

system dynamics (SD) approach based on the case poultry industry. The causal loop

diagram helped the reader to understand the relationship between one variable and

another. The stock and flow model was later developed from the causal loop diagram.

Importantly, all the necessary formulae, equations, values, information and data flows

were incorporated with the relevant variables to make this model workable.

Furthermore, the model was segmented into 10 different parts to assist with

understanding and explanation. The next chapter will run the simulation and discuss

the simulation outputs as per the research objectives and questions.

167

CHAPTER 6:

RESULTS OF SIMULATION

6.1 INTRODUCTION

This chapter presents the analysis for the integrated poultry supply chain simulation

model using Vensim – a simulation-based software package (www.vensim.com). It was

necessary to build a simulation model with appropriate equations, formulae and

connectivity to replicate the real-life operation and outcome in a simulation

environment. Extension of a system or process is needed to increase production,

capacity, investment and profits. At this point, the big concern was whether the case

industry would proceed to an extension or not? Most of the modellers wants to

experiments with the extensions over their built model to see the impacts and

consequences with the various outputs (Stephan et al. 2007). This research is not

exception from it as it is always time-consuming and expensive to find this answer

(regarding extension) from the real world. As such, experiments are risky in all aspects.

After that, it would be wise to do experiments on the virtual worlds rather doing it in

the practice first. This is the main reason for using simulation in a system dynamics

(SD) research study in order to estimate possible changes in business trends. A positive

trend will make it easier to make a decision to change or expand the business. Previous

chapter (see chapter 5) has already discussed qualitative and quantitative models

clearly defining how the two models were constructed along with mentioning the

variables used in following system dynamics (SD) methodology. This chapter will now

attempt to visualize the model behaviour though graphical presentation. In addition,

comparisons between variables are also discussed to gain insight into the various facts.

The results of the model analysis through simulation provide clear answers for the

research questions. The SD model was also developed based on the concept of decision

support systems so that decision makers would be able to use it as a learning tool to

perform their strategic policy analysis (Swaminathan, Smith, and Sadeh 1998). They

may improve their decision-making processes through sensitivity analyses, virtually

understanding the impacts of decisions, perceiving possible policy results, finding

effective policies and possible scenario analyses (Intrapairot 2000).

168

This chapter is organized as follows. The first part presents results on the integrated

poultry supply chain model and aggregate behaviour of variables. Forward and reverse

supply chain simulation results are used to show social, economic and environmental

benefits in the second and third part of this section. Reliability and validity issues are

discussed to establish that the model is absolute, reliable and valid. Scenario analyses

are then used with decision support system (DSS) techniques to understand how policy

change affects the model output. Sensitivity analysis was then undertaken to observe

the impacts on dominant variables. Sensitivity analysis helps in perceiving the

validation of the model. The next section discusses the ways in which data were

collected for calculating values for each auxiliary variable.

6.2 METHODS OF DATA COLLECTION FOR VARIABLES

This study deployed four different data collection methods, namely, observations, in-

depth interviews, focus group discussion, and industry documents and records. Details

of the data collection procedures were explained in chapter 4 under methodology: the

data collection process for different levels of the supply chain was described in

Tables 5.1 and 5.2. These two tables reveal the ways in which data and information

were collected from different levels. This chapter provides additional information

about the data collection methods used for different parts of the integrated poultry

supply chain model shown in Figure 5.8 in Chapter 5.

Details of data collection in different areas of the model and their associated variables

are presented in Table 6.1. Later sections explain more details about each area to

understand how values were calculated. Quantifying a relationship between two

variables is all about how they related with each other’s (cause and effect). At the same

time, the purposes for collecting information on different variables are listed in the

same table. The main objectives of the information presented on Table 6.1 were to find

out appropriate inflow and outflow rates to build exact real-life relationships between

the variables. Appropriate data and information helped to compute and assign an

accurate value for the different variables, especially for constants and auxiliary

variables.

169

Table 6.1: Data Collection Methods and Purposes

SL Areas Variables Method Used Purpose

1

Par

ent

Sto

ck

Parent Capacity, Parent

Chicks Order Rate, Parent

Maturing Rate

In-depth

Interviews,

Focus Group

Information regarding

parent stock, different

inflow and outflow

rates, influences from

policy matters, various

impact factors, etc.

Deaths, Culled Parent, Aged

Parent

Documents and

Records

Aggregate Policy Impact,

Effect of Policy Variable

In-depth

Interviews,

Focus Group

2

Cap

acit

y D

ecis

ion

Mature Parent Capacity,

Desired Mature Parent,

Initial Mature Parent, Time

to Make Purchasing

Decision

In-depth

Interviews,

Documents and

Records

Information regarding

mature parent, timing

factors, seasonality and

desired goal.

Ratio of Mature Parent to

Capacity, Initial Gap in

Mature Parent Capacity to

Desired Parent Capacity

Adjustment, Time for

Mature Parent Capacity,

Documents and

Records, In-

depth

Interviews,

Focus Group

Information regarding

various ratios between

capacity and desired

capacity and timing

factors to be considered.

Decision to Purchase Parent

Chicks, Ratio of Mature

Parent to Capacity on New

Orders

In-depth

Interviews,

Focus Group

Information regarding

purchase decision and

relationship between

parent chicks’ order and

mature parent capacity.

3

Pro

fit

and

Lo

ss

Desired Profits, Cost Per

Mature Parent, Profits Ratio

on Capacity

In-depth

Interviews

Information regarding

profit, desired profit,

and impact by profit

ratio over capacity.

Total Sales, Total Cost,

Other Costs, Profits

Documents and

Records

Information regarding

cost, sales and profit.

Average Meat Price,

Average Chicks’ Price

In-depth

Interviews,

Documents and

Records

Market price of chicken

meat and day-old chicks’

price.

Ratio of Profits to Desired

Profits and Loss

Relationship between

market price and profit

ratio.

4

Egg

s an

d

Hat

cher

y Eggs Stock, Eggs Produced,

Eggs Per Chicken, Broken

Eggs, Eggs to Hatchery

Documents and

Records,

Observations

Information concerning

eggs stock, inflow and

outflow rate of hatchery

unit, chicks’ outflow to

distributors. Unhatched

Hatching Percentage, Time

for Eggs to Hatch

In-depth

Interviews

170

Chicks Produced,

Unhatched Eggs

Documents and

Records

rate and hatching

percentage.

5

Far

mer

s an

d M

idd

lem

en Broiler Farm Capacity,

Chicken Mortality Rate,

Time to Mature Chicken,

Chickens Maturing for

Market, Retail Rate

Documents and

Records, In-

depth

Interviews,

Observations

Information regarding

broiler farm capacity,

timing to grow and sell

the chicken and chicks,

middlemen

responsibilities and

process, retailing

process and rate,

farming method.

Farmers, Broiler Chicken,

Middlemen, Chicken Supply,

Time Middlemen Hold

Chickens

In-depth

Interviews,

Focus Group,

Observations

6

Po

ult

ry L

itte

r

Poultry Litter, Average

Litter Rate

Documents and

Records,

Observations,

Focus Group

Data for total poultry

litter, litter production

rate based on mature

birds, by-product

procurement process

and its inflow and

outflow frequency with

conversion rate.

Biogas, Fish Feed and

Fertilizer Conversion Rate

Documents and

Records

7

Po

ult

ry F

eath

ers

Feather Stock, Feathers

Dumped, Feathers

Collection

Documents and

Records, In-

depth

Interviews

Information regarding

feather stock and its

inflow and outflow

rates, collection time,

usage of feathers,

difference between

parent and broiler

feathers and their

potentiality.

Parent Feathers, Parent

Feather Collection Rate,

Time to Collect Feathers

In-depth

Interviews

Broiler Feather Collection

Rate, Broiler Feathers

In-depth

Interviews

8

Em

plo

ymen

t

Total Employment and

Minimum Employment

In-depth

Interviews

Observation on creating

employment from

different supply chain

operation, perceived

knowledge on social and

economic impacts over

farm employees,

opportunities of more

employment creation,

minimum employment

required.

Mature Parent Empl,

Hatchery Empl, Biogas

Empl, Fertilizer Empl, Fish

Feed Empl, Parent Chicks

Empl

In-depth

Interviews,

Observations,

Documents and

Records

Farmers, Middlemen, and

Chicks’ Distribution

Employment

Focus Group

9

Bak

ery

Item

s

Eggs Supply to Bakery, Eggs

Drain Out due to Low

Demand, Eggs Drain Out

Rate, Broken Rate

In-depth

Interviews,

Observations,

Documents and

Records

Information regarding

broken, unhatched and

reject eggs rate, quantity

of eggs supplied to

bakery and bakery

operation.

171

10

Po

ult

ry

Inte

stin

es Intestine Stock, Intestines

Dumped and Collection

Rate, Intestines Per Broiler

Bird, Intestines Per Parent

Bird

In-depth

Interviews,

Documents and

Records

Information regarding

intestine collection from

parent and broiler birds,

possible usage, inflow

and outflow rates.

Table 6.1 clearly shows that different methods were applied for collecting information

for variables. Stocks and various inflow and outflow rates were mostly collected from

in-depth interviews and industry records. Some of the information is critical to

measure, such as poultry litter, biogas, fertilizer, fish feed, etc. In this case, the

researcher identified usage of such items for a particular time and then measured the

quantity based on their usage as raw materials. Several tactics were employed to gather

relevant information to compute the input values for the variables. A few variables (e.g.

parent mortality, hatching rate, broken eggs) indicated very inconsistent data. In this

circumstance, data were reprocessed using a trend graph then an average value was

chosen. If the data series for a particular variable showed inconsistencies and

oscillation, then a value was input as a random uniform distribution by computing

minimum and maximum values using a noise seed. Such random uniform distribution

influenced the connected variables randomly based upon minimum and maximum

values given. On these few occasions, the model used random normal distribution

where mean and standard deviations were considered on top of minimum and

maximum values. In this way, each of the model values was computed so it could be

deployed for an effective simulation run. In addition, some variables were set logically

using a different arrangement such as an average, random uniform, random normal,

etc. In these ways, all variables were finally set with individual values as in real

practice. The simulation model was therefore ready to run and analyse. The following

sections discuss the results for the variables associated with the forward supply chain.

6.3 RESULTS OF POULTRY FORWARD SUPPLY CHAIN

Figure 6.1 presents the stock and flow model for the poultry forward supply chain

which is a part of the integrated poultry supply chain model. The figure is involved

main variables for forward supply chain. This section specifically discusses the forward

supply chain and its related variables. In this forward supply chain model, seven stocks

(level) variables are available which comprise over 70% of the total level variables in

the aggregate model. The forward chain consists of a long supply chain network which

starts from ‘parent chicks’ through to final ‘broiler chicken’ consumption. Moreover, the

172

model is run for 312 weeks (six years) including the previous two years for the sake of

examining the similarity with real-life information. The next five sections present the

key variables of the forward supply chain and their simulated behaviour. At the same

time, comparisons between real and simulated data are presented to perceive how the

simulation model works in generating behaviour as similar as possible to real

behaviour for the supply chain process variables.

Figure 6.1: Stock and Flow Model for Poultry Forward Supply Chain

6.3.1 Parent Chicks and Mature Parent and their Rates

‘Parent chicks’ and ‘mature parent’ are the supreme variables in this research model

which belong under the forward supply chain. Most of the outputs and behaviours over

time depend on these two objects. The more parent chicks are given as input in the

system, the more production would be expected. In Figure 6.2, ‘parent chicks’, ‘mature

parent’ and their rates are considered to portray simulated behaviour for 312 weeks

(six years). The numbers and colours indicate graph lines with simulated behaviour.

Four different graph lines show very inconsistent behaviour rather than following

sustainable growth due to seasonal variability, calamities and policy barriers. In

173

addition, system delay was also a cause of this uneven behaviour. Notably, an uneven

variable does not mean an inconsistent operation for the poultry industry as one

particular parent flock stays in the farm for a maximum of 70 weeks with 40-44 weeks

of active production. Therefore, 44 weeks’ production is almost similar to 85% of a

calendar year. If parent chicks are consistently given as input in the system, the farm

will produce additional chicks which cannot be sold due to low market demand. This is

why farms maintain their input based on the calculation of the parent's life cycle.

Normally, the case industry receives input of parent chicks two to three times in a year

so that they can maintain their desired production.

Essentially, the case industry is maintaining its desired production based on financial

capability, market demand and farm capacity. Desired production fluctuates several

times a year due to different causes such as seasons, natural disaster, market demand,

disease, religious festivals. For instance, Bangladesh is mainly a Muslim country, with

Muslims having an animal sacrificing occasion named ‘Eid-ul-Azha’. This occasion

usually happens once a year as per the Arabic calendar. At that time, the demand for

chicken meat and eggs is drastically reduced from the normal situation. Farmers are

thus forced to reduce their chicken meat and egg production to cope with the market

situation.

Figure 6.2: Simulated Behaviour for Parent Chicks and Mature Parent

174

In Figure 6.2, lines 1 and 2 represent mature parent and parent chicks while lines

3 and 4represent the parent chicks’ rate and mature parent rate. There are some points

in the graph where lines have gone sharply upward or downward which indicates a

sudden rise or fall in demand and production. Maintaining the expected demand is a

complex decision as parent chicks grow up in a flock and take 24 weeks to become

mature. The mature parent will be sustained for another 42 weeks producing eggs at

different rates based on their age. The mature parent provides maximum production

between 30-50 weeks of age. It is also visible from figure 6.2 that mature parent graph

line (1) is relatively consistent than other graph lines. Again, parent chicks rate (3) and

parent maturing rates (4) are showing inconsistent behaviour due to repetitive

adjustment with the market situation. The most important is to maintain a consistent

graph line for the mature parents than other graphs as it determines ultimate

production of day-old chicks. The reason behind of showing oscillated behaviour from

parent chicks and mature parent chicks rate is continuous adjustments with the

existing circumstances. On the other hand, parent chicks (2) are showing relatively less

fluctuation as they exist in the system for around 20-24 weeks to grown-up. A number

of parent chicks’ flock with different ages can help the farmers to adjust with the

necessity. Therefore, a parent breeder farm has to maintain several flocks of different

ages to maintain optimum production for the whole year.

6.3.1.1 Parent Chicks: Comparison with Reality

One of the prerequisites for a system dynamics (SD) model to check reliability and

validity. The literature on reliability and validity has been discussed in the

methodology section (chapter 4). According to the relevant literature, comparison

between simulated and real-life data should be done to realize the model structure.

Simulation model results are expected to follow real-life operations and behaviour so

that the model can be treated as reliable and structurally sound. Figure 6.3 depicts a

comparison between the simulated and real-life data set for the ‘parent chicks’ variable

which is an influential object of this model. The production of eggs, chicks and wastes

completely relies on ‘parent chicks’ input. This input also varies in relation to market

demand and other factors. The graph consists of two lines; line 1 represents model

output while line 2 represents the real-life data set. It is noticeable that the two lines

are identical and adjacent to each other yet have slight gaps. Such a close result

between simulated results and real-life data provides evidence of the satisfactory

structure of the current model.

175

Figure 6.3: Comparison between Simulated and Real-life Parent Chicks

6.3.1.2 Mature Parent: Comparison with Reality

The topmost variable of concern in this model is ‘mature parent’. The main business of

the case farm is to sell day-old chicks to the ultimate broiler farms. To do so, they need

to receive hatchable eggs from mature parent mothers so that eggs can be hatched to

produce day-old chicks. Figure 6.4 represents a good match (between line 1 and line 2)

with simulated and real data for the ‘mature parent’ variable. Here, line 1 represents

model output while line 2 denotes real data.

Figure 6.4: Comparison between Simulated and Real-life Mature Parent

176

6.3.2 Simulated Behaviour for Eggs, Hatchery Stock and Chicks

Eggs, hatchery and chick production has a strong relationship to maintaining steady

production. Figure 6.5 represents simulated behaviour of these variables. Graph line 1

(chicks) shows slight variation as it sloping down then going up to hold the optimum

productions. Other two graphs for eggs and hatchery output also following the same

fluctuation. Although, the graph lines look like similar, they have their own measures

which are displayed on the left side of the graph. For example, the maximum stock of

eggs is around 600,000 to 700,000, whereas hatchery stock maintains more than one

million eggs per week, and chicks’ production is maintained at around 300,000 to

400,000 per week. The hatchery and egg production lines match closely with each

other as the hatchery supply depends on the eggs collected. It is also clearly visible

from figure 6.5 that around 400,000 chicks are finally hatched from more than a million

eggs collected from the farm level. It does not mean that rest of the eggs are treated as

unused rather 35-50% eggs are queued for next hatch and rest are come out as

unhatched from the hatchery units. Obviously, around 4-5% are being damaged and

broken on the way to reach to the hatchery incubators. Again, more eggs can hatch

subject to availability of additional incubators and increasing chicks demand at the root

level.

Figure 6.5: Simulated Behaviour for Eggs, Hatchery Stock and Chicks

6.3.2.1 Eggs Production: Comparison with Reality

It is important to maintain desired egg production in all circumstances. Desired egg

production depends on the quantity of the mature parents reared in the parent stock

177

farm. The main business of the case farm is to sell day-old chicks to the ultimate broiler

farms. To do so, they need to receive hatchable eggs from mature parent mothers so

that eggs can be hatched to produce day-old chicks Figure 6.6 portrays simulated and

real data for the ‘eggs’ variable. It is clearly visible that the two lines are close enough to

demonstrate the accuracy of the model.

Figure 6.6: Comparison between Simulated and Real-life Egg Production

6.3.2.2 Chicks Production: Comparison with Reality

Figure 6.7 demonstrates a respectable match between simulated and real-life data for

the day-old broiler ‘chicks’ variable. The behaviour of this part of the model is nearly

consistent due to the behaviour of the number of eggs accumulated steering the

following variables. Contrary, real data shows that graph line (2) reached the pick

demand at the 45th to 50th week while it is going down at the 70th week. Later, it

behaved nearly consistent with little vicissitudes. Chicks’ selling is the main business of

the case industry. Therefore, it is the main contributor for the industry in making the

desired profits. Normally, the hatchery maintains two to three times the amount of egg

stock in comparison with final chicks hatched. The reason behind maintaining such an

amount of stock is to regulate the situation. In a normal demand situation, the industry

maintains a modest production of around 300,000 to 400,000 chicks per week.

However, they will decrease their hatching eggs if changes occur in the market demand

situation. Furthermore, production must be hampered when natural disaster hits either

these farm areas or the farm areas of the ultimate farmers who buy the chicks from

178

parent farmers. In addition, eggs take 21 days (i.e. three weeks) to hatch. To maintain

weekly production, the hatchery unit needs to set up a roster so that desired chicks can

be hatched on a weekly basis.

Figure 6.7: Comparison between Simulated and Real-life Chick Production

6.3.3 Chicks, Middlemen, Farmers and Broiler Chicken

Broiler chicken is the ultimate product which grown up from day-old chicks with a

certain period of rearing in a standard environment. Produced chicks are delivered to

the farmers via middlemen. So, ‘chicks’, ‘middlemen’, ‘farmers’ and ‘broiler chicken’ are

closely related with each other. Once chicks have been graded and scientifically

packaged, they start flowing towards distributors located all over the country.

Distributors are located region-wide so that they can cover every part of Bangladesh.

Company sales offices are established in almost all major divisions and regions. The

sub-agent (i.e. commission agent) then covers sub-regional and remote areas. In this

way, the company maintains a strong supply chain network to supply day-old chicks to

the ultimate farmers. When chicks reach to the ultimate farms, farmers rear them for 4-

5 weeks to grow to mature birds. Mature birds are then supplied to final customers

through middlemen. Figure 6.8 represents the simulated behaviour of these variables.

In the end, the graph lines appear identical and follow each other as the variables are

related to the outflow of the preceding variable. The figure is showing the consistent

match with the graph lines of chicks, middlemen, farmers and broiler chicken.

However, the graph lines are matched with each other but they are producing different

numbers of output based on the requirements. For example, chicks' production per

179

week is around 400,000 while farmers have more chicken in the queue to sell it to the

market. Because, all the birds are not maturing at the same time rather maintaining a

standard time for gaining certain weight. All depends on market situation, whether

they will sell the mature chicken at the weight of 1.2 kilogram or more than that. If they

expect more weight, then they may need to wait for additional time to grow them up.

The model behaviour only replicates the standard practices and found good match with

a real system behaviour.

Figure 6.8: Simulated Results for Chicks, Farmers, Middlemen and Broiler

Chicken

6.3.4 Mature Parent Capacity and Gap

A well-regarded company always wants to maintain optimum production with

sustainable growth. They seek out new market expansion and production growth

simultaneously. Supply–demand and capacity–gap are dynamic issues for the company

and often change due to circumstances such as seasons, demand, disease, calamities

and policy. Figure 6.9 depicts a graph which shows simulated behaviour for mature

parent capacity and the desired gap condition. This graph consists of ‘desired mature

parent’, ‘decision to purchase parent chicks’, ‘gap in desired to mature parent’, ‘parent

chicks’ and ‘ratio of mature parent capacity’ variables. These are the significant

variables for considering gap analysis and minimized capacity of the desired

production. Graph line 1 represents the decision to purchase a new parent chick flock

for the industry. Purchase decision-making time is one of the key policies for the

industry which helps them to produce day-old chicks in the right time frame to meet

180

the demand. Obviously, the number of parent chicks later determines the number of

mature parents flowing through the system followed by eggs and day-old broiler

chicks. It is observed that decision to purchase new chicks is varying based on demand

situation exists in the market.

Figure 6.9: Simulated Results for Mature Parent Capacity and Gap

Graph line 2 (desired mature parent) is showing consistent straight line as it meets the

target. In fact, additional mature parents forced to drain out from the system to adjust

with the existing requirement. Again, graph line 3 (gap in desired to mature parent)

shows inconsistent behaviour due to ‘desired mature parent’ requirement is not same

all the time as it depends on practical circumstances. The more gap exists; the more

supply need and graph line will reach high. On the other hand, graph line 4 (mature

parent capacity) remain consistent on 200,000 per week. Parent chicks behaviour have

been discussed in the previous section (see section 6.3.1.1). Finally; a ratio of the

mature parents to its capacity shows the oscillated behaviour due to frequent changes

of desired capacity and mature parent supply from parent stock farm. Therefore, above

graph lines (figure 6.9) from different variables are shown the complex system

behaviour of the poultry supply chain model. The value of the variables can be adjusted

if it is required for the farmers by manipulating time, values, inputs and outputs.

6.3.5 Forward Supply Chain and Employment

One of the key objectives of this research is to realize the poultry supply chain’s

contribution to society. The forward supply chain of the poultry industry has to

181

maintain a number of operations such as parent farming, hatchery, feed mills,

distributors, broiler farm and middlemen. These operations obviously create

employment opportunities at every level of the process. Figure 6.10 presents the

employment creation from each of these operations. Parent farming creates the

maximum number of employment as it needs two employees for every 1,000 birds

while the broiler farm needs one. The case industry maintains more than 150 agents

having a minimum of four to five employees for each of them. Moreover, the main

positive social impacts occur in the rural areas where young unemployed people grow

up seeing all the facilities in a poultry supply chain. They intend to join the chain as

middlemen, sub-agents, farmers, feed sellers and by-products processors. This is how

the poultry forward supply chain brings positive impact to farms, society and the

economy in terms of employment. The next few sections address the variables

connected with the reverse supply chain for poultry wastes.

Figure 6.10: Simulated Behaviour for Forward Supply Chain and Employment

Above figure, 6.10 is represented the opportunities for creating employment through

forward supply chain activities. The activities are listed as distribution, farming,

hatchery unit, parent farm, various middlemen and breeder (parent) chicks farm. These

are the leading areas of activities where employments can be generated based on the

number of bird transacted. All the graph lines are following the behaviour of main

activities. Because, the employment will be generated based on main variables

behaviour. For example, 1000 birds create one employment in a farm, and then 20,000

will make 200 employments. Therefore, it depends on the original behaviour of the

182

main variable which will ultimately guide the number of employments' opportunities in

the system.

6.4 RESULTS OF POULTRY REVERSE SUPPLY CHAIN

Industry includes ‘reduce, reuse, recycle’ concepts along with its existing supply chain

to manage cost and decrease inefficiencies, with this called the reverse supply chain

(Partridge 2010). In the poultry industry, the concept of recycle, reduce and reuse is

used for poultry wastes. Poultry litter wastes can produce biogas with other wastes

producing fertilizers. In this way, the poultry supply chain can extend to a downward

chain where various poultry wastes can be accumulated for reuse and recycling. The

reverse supply chain has been clarified by detailed explanations in the literature review

(chapter 2). Figure 6.11 is a shortened layout of an integrated poultry supply chain.

Poultry waste creation, sources, processing and by-product creation are shown in the

same figure. At the same time, significant numbers of employment are created through

by-product processing which has also been exposed in the model.

The various poultry wastes include litter, feathers, unhatched and broken eggs, and

intestines from mature parent and broiler bird rearing. Litter, feathers and intestines

can be collected from mature parent and broiler farms while broken and unhatched

eggs originate from the hatchery. The figure clearly demonstrates which way wastes

are redirected to produce by-products using the arrowhead. Concurrently, processed

by-products can be used as raw materials for small and medium industries (SMEs)

which can empower and employ additional people. This part of the model is extended

based on scattered practices and possibility of integrating these operations with the

main supply chain. The model building process has given effort of integrating such

operations into the mainstream operation to add more economic, social and

environmental values. Additional sustainable benefits can be achieved through these

processes. Again, the model is also considered farmers, middlemen and broiler chicks

to quantify them over time to compare with the existing demand and supply situation.

Moreover, poultry feather and intestine are yet to be recycling for further by-products,

whether they have tremendous opportunities to utilize them as raw materials for other

industries like bed and pillow and fish industry. Overall, these processes make a

noteworthy contribution to Bangladesh society.

183

Figure 6.11: Stock and Flow Model for Poultry Reverse Supply Chain

184

6.4.1 Poultry Litter and By-products

Economically valuable by-products can be made from poultry litter. Figure 6.12

portrays simulated behaviour of biogas (graph line 1), fertilizer (graph line 2), fish feed

(graph line 3) and poultry litter (graph line 4). As shown on the graph, quantities of

poultry litter come from mature parent and broiler farms over time. All the graphs are

showing nearly same behaviour having sharp increase and decrease after certain time.

Less production will be creating less poultry litter which is the main cause of decreased

behaviour. Alternatively, more production will create more opportunities to make

additional by-products. However, the graph lines are showing same trend but they own

individual values and measurement which are not similar to one another. For instance,

biogas measures as the cubic metre while other by-products as tonnes. Such analysis

can predict the assumption of generating poultry litter and its by-products over a time.

Figure 6.12: Simulated Behaviour for Litter, Biogas, Fish Feed and Fertilizers

Moreover, about 600 to 700 tonnes of litter per week are generated from both sources

as depicted by line 4. The poultry litter graph line shows oscillating behaviour as

accumulation of litter depends on the number of mature parent and broiler birds

reared. After its accumulation, 70% of litter is prepared for biogas processing while

15% is used for both fish feed and fertilizers. It is noted that the case industry uses

biogas to generate heat through the gas brooder to brood the day-old parent chicks.

Plans are to convert this biogas to electricity which will help them to save a significant

amount of cost. Fertilizer is used for Napier grass for the dairy project in the same

company and fish feed is used for pond areas where they do commercial fish culture.

185

All these by-products can be commercialized if a different supply chain network is built

towards another segment of customers.

6.4.2 Real and Simulated Behaviour of Poultry Litter and By-products

Figure 6.13 shows the comparison between real and model behaviour for by-products.

Real data were collected for the last two year which is equivalent to 104 weeks. Three

different miniature graphs are shown on the same figure comparing fertilizer, poultry

litter and biogas output. For fertilizer and biogas, real data and model output are shown

as a good match (line 1 and 2). In this figure, graph 1 is treated as simulated output

while graph 2 is given input from reality. However, poultry litter behaviour shows

more fluctuations than the real-life data. The researcher carefully investigated data and

simulation output several times to ascertain the real facts. The outcome of this

thorough investigation acknowledged that poultry litter collection depends on factors,

including humidity, climate, season, feed and water consumption by poultry birds. Due

to these factors, the quantity of litter collection fluctuates extravagantly in comparison

to the standard expectation. This tool is useful to do projection of generating total

quantity of poultry litter and later distribute it to the different by-product processing

centre. Ultimately, the quantity of various by-products can be also assumed before

they start to reprocess the wastes. If it does not find profitability, then processor can

think otherwise to utilize this resource.

6.4.3 Poultry Birds and Feather Production

Figure 6.14 shows that more than 10,000 kilogram feather can be collected from

matured chicken. Graph line 1 (chicken) and line 2 (broiler chicken feather) are

showing same trend as feather quantity is depended on the number of chicken exists in

the farm. Again, parent feather (graph line 3) is showing its production behaviour over

time based on the number of mature parent (graph line 5). These graphs are

maintained steady behaviour with significant variations. In addition, graph line 4

displays total number of feather collection over time which has minor variation in

compare to other associated variables. In some stage, graph lines are drastically fallen

due to significant decrease of a parent bird reared in the farm. In practice, total

collected feather is not reusing for making further by-products rather using a small

percentage to reuse it for the non-commercial reasons. However, there is an immense

scope of making valued by-products which will be a valuable and additional earning

source for the industry.

186

Figure 6.13: Comparison between Simulated and Real-life By-products

187

Figure 6.14: Simulated Behaviour for Poultry Birds and Feather Production

In addition, poultry feathers are a valuable resource which can be converted into

products like pillows, mattresses, cushions, pads, plastic keratin, etc. Unfortunately, the

case industry is still struggling to reuse this waste although they receive substantial

offers from third parties seeking supplies of feathers as raw material. The collection

time is different for parents and broiler birds. Feathers can be collected from broiler

birds at the age of 4-5 weeks when the birds are slaughtered for final consumption. On

the other hand, parent feathers can be collected at 26 weeks’ age in a prescribed form.

Furthermore, one parent mother can produce 0.145 kg of feathers which is collected

once in a lifetime. After death or slaughter of the aged bird, the rest of the feathers can

be collected. In contrast, feathers are usually collected from a broiler bird when they

are slaughtered for final consumption. The life cycle of a broiler bird is between 4-6

weeks maximum. They produce approximately 0.102 kg of feather once in their

lifetime. This calculation is based on real-life observation and measurements. The

quantities of collected broiler and parent feathers and the behaviour of broiler and

parent birds and feather stocks are shown in Figure 6.14.

6.4.4 Bakery Items, Broken and Unhatched Eggs

A large number of eggs are treated as excluded in the parent industry along with eggs

that are drained out at the hatchery unit. Such excluded eggs are called reject eggs at

the farm level, unhatched eggs in the hatchery unit. There is another chance of

collecting more excluded eggs which are named as drain out eggs. Drain out is needed

when there is low demand for broiler meat in the final market. In that situation, they

188

hatch a minimum number of eggs and send the rest of the eggs to the other unit. Thus,

all the eggs are used to supply the bakery so it can make bakery items of biscuits, cakes,

and pastries. Figure 6.15 depicts the simulated behaviour for broken, unhatched eggs

and bakery stock. Broken eggs (graph line 1) and un hatched eggs (graph line 3) are

combined together to supply to the bakery (graph line 2). The graphs are shown their

behaviour over time which seems minor variation based on different rates for eggs

flowing out. The model did not drain out a significant number of eggs as there was no

evidence that this had been done in the last two years. The unused eggs, whatever their

number, are collected and transferred to the bakery. Unhatched eggs comprise the

larger volume of these eggs ahead of the other sources as more than 15% of eggs

remain unhatched in the hatchery unit. These eggs are sold to the bakery at a wholesale

price similar to the way in which regular eggs are consumed by final consumers.

Figure 6.15: Simulated Behaviour for Broken, Unhatched Eggs and Bakery Items

Figure 6.16 illustrates the comparison between real-life and model output of bakery

eggs. ‘Eggs supply to bakery’ (graph line 1) and ‘real bakery eggs’ (graph line 2) are

showing a decent match with one another. Normally, unhatched eggs and broken eggs

are examined whether it is suitable for human consumption or not? After having

scientific investigation over unused eggs, then they are transferred into the bakery

house for further process. If the eggs fail to pass the test, afterwards they are directly

flown to process them for fish feed. Therefore, two graph lines express the reasonable

indication of structural accuracy of the model.

189

Figure 6.16: Comparison between Simulated and Real-life Bakery Eggs

6.4.5 Poultry Birds and Intestine Collection

Poultry intestine is valuable wastes that are reprocessed to make fish products and also

help to grow ‘Campylobacter’ for fish (Kubena et al. 1976; Lee and Newell 2006).

Unfortunately, a huge quantity of intestines is simply thrown out as trash without it

even being used. A few small fish farmers are using raw intestines for their Cobbler fish

which is not scientifically sound as blood mixes with the pond water to make it toxic

(Rahman 2013b). Even so, scientific usage of poultry intestines can contribute more

than is currently occurring.

Figure 6.17: Simulated Behaviour for Poultry Birds and Intestines

190

Figure 6.17 shows the simulated behaviour of poultry intestine stock, and broiler and

mature parent intestine quantity based on the number of birds slaughtered. Line 4

indicates that more than 6,000 kg of intestines are collected per week from the poultry

case industry. If this could be processed scientifically, it might achieve significant

economic benefits. At the same time, this reuse can also protect the environment.

6.4.6 Reverse Supply Chain and Employment

As with the forward supply chain, the reverse supply chain of the poultry industry is

also creating significant employment opportunities. The reverse supply chain is mostly

concerned with reusing poultry wastes to procure by-products. Figure 6.18 depicts the

cumulative employment created through the reverse supply chain. The line numbers

indicate the quantity of employment created from the various ways of processing

poultry wastes. These opportunities would be widened if the case industry

commercialized their by-products to the relevant consumer segments. The graph also

indicates that employment of more than 3,500 jobs was created through by-product

processing. Notably, the model can predict futuristic employment creation based on

given input. As was previously mentioned, the model was run for 312 weeks (six years),

of which 208 weeks (four years) output was treated as forecasted.

Figure 6.18: Simulated Behaviour for Reverse Chain and Employment

191

6.5 SIMULATION OF INTEGRATED POULTRY SUPPLY CHAIN MODEL

The model developed and depicted in Figures 5.7 and 5.8 (chapter 5) is the complete

stock and flow model for the poultry supply chain within the research boundary.

Simulation model building is done by a systematic procedure which considers a few

key variables. Once the major variables interact with each other flawlessly, the model is

then extended by associating more variables. Within this process, the results in every

experiment should be checked even if it is only a minor value change of a variable. A

similar process needs to be followed for other types of experiments such as adding or

deducting variables, connecting a new loop with a current loop, etc. This is how

perfection is finally derived after having so much trial and error. One of the objectives

of this research was to perceive whether or not the simulated model worked similarly

to the real-life poultry operation. If the model worked similarly to the real-life poultry

operation, then the model would be used to integrate forward and reverse supply chain

operations under the integrated model. The integrated model when run would provide

combined results showing the total impact at the same time. The next section discusses

the analysis of some relevant results of the integrated model.

6.5.1 Simulation Analysis for Integrated Model

The integrated model denotes the combined model in which the forward and reverse

supply chains are linked together. The reverse supply chain is apparently dependent on

the forward supply chain operation. In this research, the reverse chain depends mostly

on reversing poultry wastes to the main operation with these wastes generated from

poultry rearing and distribution in the forward chain. The few analyses are described in

the following sections.

6.5.2 SyntheSim Mode of Integrated Model

SyntheSim is a technique in Vensim used to simulate models with considerable

interactivity where changes are made to the model instantly (Eberlein 2003; Vensim

1999). SyntheSim can be run placing equations in all variables once a model is

constructed, defined and complete. In addition, all constant-valued auxiliary variables

turn into slider bars so that immediate effect can be seen for value changes. In addition,

all stock (level) variables turn into small graphs of that variable over time. This facility

helps to understand the behaviour of the changes over a particular given time.

192

Figure 6.19: SyntheSim Mode for Integrated Poultry Supply Chain Model

193

Figure 6.19 is the complete picture of the SyntheSim mode (simulated) of the

integrated poultry supply chain model. This figure shows the simulated behaviour of

the model variables, including constants with the slide bar. This slide bar can be used

for perceiving instant changes in the whole model due to altered value(s) for

particular(s) variable. For example, the value for the ‘initial parent chicks’ variable is

given as 120,000. When SyntheSim mode is active, then a slide bar will be available

under the variable name. The slide bar will show the given value. If policy makers or

farmers want to change the value to 150,000, at that point, associated variables will

immediately show the behavioural changes. The SyntheSim mode works in this way on

the model to do instant experiments until reaching the desired outcome or behaviour of

the model variables.

Vensim’s Synthesim mode provides an enormous facility where one can observe the

whole model’s behaviour. As is well-known, stock behaviour is the key for the system

dynamics (SD) model to realize the trends. This model contains nine stock (level)

variables which can be seen on Figure 6.19. Interestingly, miniature graphs for all stock

variables appear to show similar behaviour. One can argue and question why this is so.

The reason is very simple and can also be answered elaborately. Simply stated, a live

business like poultry is completely dependent on production of eggs and chicks which

guides the whole supply chain except for when disaster and calamities hit the chain

(Rahman 2013a). Therefore, the poultry production process without calamities and

disaster will behave consistently. For instance, 100 parents produce 70 eggs per day

which will be forwarded to the hatchery after deducting damaged eggs. The rest of the

eggs minus the unhatched eggs will then hatch in the hatchery.

Finally, chicks are delivered to the distributor to distribute to the ultimate farmers. If

any disaster hits after accumulating the eggs, the policy maker may make the decision

to hatch a certain proportion of eggs rather to hatch all of them. This decision may

create behavioural oscillation rather than following the certain line. Figure 6.1 is an

integrated model which consists of forward and reverse supply chains of the poultry

industry. It is possible to view an instant result (behaviour) for both the supply chains

based on the input value given to the ‘parent chicks’ and ‘mature parent’ variables and

their capacity. If the input value exceeds the capacity value of these two variables, the

model will not allow such values to be processed but instead will process the maximum

value of capacity provided in the model. Therefore, integrated model is nothing but a

194

combination of forward and reverse poultry supply chain for better productivity and

efficiency. This chapter next discusses the reliability and validity of the simulation

model.

6.6 RELIABILITY AND VALIDITY OF THE MODEL

Reliability and validity are an integral part of any kind of research and system

dynamics (SD) research is no exception. The comparison between behaviour in the

simulation and real-life data is important to justify the reliability and structure of the

model. Most of the comparisons for key variables have been discussed above. All results

were satisfactory as they closely matched each other. The next two sections discuss

reliability and validity issues for the research model shown on Figure 5.8 in chapter 5.

6.6.1 Model Reliability

Model reliability is an iterative process to test policy (Sterman 2000). The refinement

process continues until the model is able to satisfy requirements concerning its reality

and robustness and reproduce the historical pattern (Jørgensen 2004; Forrester and

Senge 1980; Homer and Oliva 2001). To test the reliability of the current model, the

following matters were considered:

Match the model-generated behaviour with real-life data;

Observe model output by repeatedly changing over noise seed;

Conduct multiple runs and observe results' similarity;

Match between model behaviour and the real-life trend for different variables.

The model has accomplished above tests and found the results in favour of declaring

the model as reliable. For instance, figure 6.3, 6.4, 6.6 and 6.7 tested the same.

6.6.2 Model Validity

According to Forrester (1980), Sterman (2000) and Barlas (1996), there is no unique

way to claim model validity except by comparative views of real-life and model output,

the extreme condition test, and dimensional and structural perfection of the model.

Most SD scholars have agreed that model validation is only possible by those who know

the real system accurately as an expert. Those experts are able to compare both the

system dynamics (SD) model and real-life practice. If the simulation model reflects the

reality, most experts express the opinion that ‘half of the job is done’ (McDoland 2013).

Therefore, model outputs for key variables were compared with real-life outputs in the

195

above section along with the key variables. Real-life and model data showed in

comparison that they almost matched each other which assisted in comprehending the

authentic structure and reliability of the model. Moreover, the model was tested by

changing seed values for auxiliary variables and normal and expected behaviours were

found. According to Peterson and Eberlein (1994), the following tests can be helpful to

validate the model.

Realistic behaviour under extreme or limiting conditions – consistency with

actual data

Conformance to thought experiments

Plausible sensitivity to parameter changes over wide ranges

Apart from the key literature on SD model validation as discussed above, Qudrat-Ullah

and Seong (2010) have exemplified six different validation tests based on Forrester and

Senge (1980). Those tests can be done for structural validation of a system dynamics

model. This validation tests are known as boundary adequacy, structure verification,

dimensional consistency, parameter verification, extreme conditions and structurally

oriented behavioural investigation (see 4.4.2.6). To build maximum confidence on

current SD model, majorities of the above-mentioned tests were conducted to confirm

the model validity. The following sections are describe the validation tests.

6.6.2.1 Boundary Adequacy

In boundary adequacy test, the model needs to elucidate whether the main influencing

concepts and structures for addressing the policy matters are endogenous to the model

(Qudrat-Ullah and Seong 2010; Forrester and Senge 1980). Figure 6.20 represents the

exogenous and endogenous variables for the current poultry supply chain model. It is

perceived that ‘government policy’, ‘market demand’ and ‘competitors action’ are the

exogenous variables for the model. The case industry experts opined that market

demand and competitors action can be driven from internal industry through

implementing a visionary policy. A pragmatic policy implication will be followed by the

competitors and consequently, market demand can be adjusted over the time. The

model used standard and unchanged situation for exogenous variables. Those variables

are deployed in the model to provide the facilities to experiments with the exogenous if

needed.

196

Government PolicyMarket Demand

Competitors Action

FinanceProduction of Chicks, Eggs and By-Products

Capacity Utilization and Adjustment

Supply Chain Members (Controlled by the Case

Industry)

Waste Management

Costs, Prices and Profits

Demand Adjustments

Employment Generations

Resources Utilization

EXOGENOUS

ENDOGENOUS

Figure 6.20: Summary of Integrated Poultry Supply Chain Model

On the other hand, finance, resources utilization, production, supply chain activities,

waste management, demand adjustments, costs, prices and profits, and capital

utilization are used as the endogenous variable in the model. These variables are

suitable to measure and control by the respective industry and the researcher.

Therefore, this model adopts adequate boundary to deal with poultry supply chain for a

case industry.

6.6.2.2 Structure Verification

In structure verification test, the consistency of the model with relevant descriptive

knowledge of the system is examined to validate its behaviour (Forrester and Senge

1980; Qudrat-Ullah and Seong 2010). Qudrat-Ullah (2005) has verified MDESRAP

model using a case knowledge (where available knowledge about the real system) and

constructed sub-model from the existing model domain for structural validation.

Likewise, the current model constructed based on a real poultry industry where

relevant information was crosschecked with the model equations and outputs. Figure

5.5 of chapter 5 presents a causal model on a real poultry supply chain industry. The

causal relationship between the variables discussed under section 5.2. For example,

parent chicks and mature parent dynamic structure in the causal model (figure 5.5). In

this dynamic relationship, when parent chicks increase, mature parent will be

increased with egg production. Consequently, parent chicks reduces and need to be

filled with the day-old chicks to become mature parent in near future. It is a loop

197

between these two variables with positive and negative feedback loop. Therefore, the

causal relationships developed in the supply chain simulation model is validated based

on real life knowledge in a poultry production system. Such kind of empirical structure

validation (Zebda 2002) via real life knowledge can build confidence for the SD model.

This model can be divided into forward, reverse and mainstream sub model from

existing integrated model which will also serve as a ‘theoretical’ structural validation

(Forrester and Senge 1980).

6.6.2.3 Dimensional Consistency

Dimensional consistency needs to test mathematical equation used in the model

variables whether relevant equations are dimensionally resembled to the existent

system (Forrester and Senge 1980; Qudrat-Ullah and Seong 2010). The present

research has checked all the equations for constant, auxiliary and level variables to

validate the model. For instance, the following equation represents one of the key

variables (Decision to Purchase Parent Chicks) of the current model (figure 5.8, chapter

5):

Decision to Purchase Parent Chicks (Variable) = (Effect of the Ratio of Mature Parent to

Capacity on New Orders*Gap in Desired to Mature Parent)/Time to Make Purchasing

Decision, where,

Effect of the Ratio of Mature Parent to Capacity on New Orders = Ratio of

Mature Parent to Capacity [Dimensionless] of ([(0,0)-

(1.25,2)],(0,1),(0.25,1),(0.5,1.1),(0.75,1.2), 0.85,1.1),(0.95,1.05),(1,1),(1.2,0.85))

Gap in Desired to Mature Parent = [Desired Mature Parent-(Mature Parent),

[Parent] and

Time to Make Purchasing Decision = 8 weeks

So, Parent/Week = (Dimensionless*Parent)/Week=Parent/Week

However, different variables (with different dimensions) are involved with the

respective variables to make this dimension as ‘parent per week’. Notably, the time unit

for the current model is week (the input and output calculated in a weekly basis).

Therefore, ‘time to make purchase decision’, ‘mature parent capacity’ and ‘effect ratio’

are not only carried from the real life knowledge but also equation is dimensionally

consistent in the simulation model.

198

6.6.2.4 Parameter Verification

Academicians suggest to parameter verification to check the consistent parameter uses

based on appropriate descriptive and numerical familiarity of the system (Forrester

and Senge 1980; Qudrat-Ullah and Seong 2010). The current model (figure 5.8)

deployed 145 variables of all kind and appendix C lists all of them with equations and

units. Appendix C also provides parameters used in the model for each variable along

with equation. Obviously, the knowledge of concern parameters has been obtained

from real life practices.

6.6.2.5 Extreme Condition Tests

Academics and experts indicate that the model should be tested in extreme conditions

so that it can be assessed as structurally valid for all circumstances. The extreme

condition (indirect) test can be done by placing extreme values on the selected

variables to comprehend the model-generated behaviour in order to detect the possible

behaviour of the real system under similar circumstances (Balci 1994; Barlas 1996). It

is necessary to test extreme condition using extreme values to ensure the logical

behaviour in that unusual situation. A few circumstances were analysed below to test

the current model in extreme conditions.

Extreme Condition for Parent Chicks

As shown in Table 6.2, extreme values were assigned to the associated variables of

‘parent chicks’ to comprehend the model behaviour. In reality, the case industry

maintains approximately 120,000 initial parents with capacity for 200,000 mature

parents. If a capacity gap arises, management is accustomed to spending eight weeks to

make a decision to fill the capacity gap.

Table 6.2: Extreme and Normal Values for Parent Chicks

Variables Normal Situation (Line 2)

Extreme Condition (Line 1)

Initial Parent Chicks 120,000 0

Policy Impact 0.15 0.3

Time to Make Purchasing Decisions

8 15

Initial Mature Parent Capacity 200,000 100,000

199

The purchase should have a visionary calculation to maintain optimum production. In

addition, around 15% of the business is hampered due to policy barriers, sudden

changes in the market situation, the government’s uncooperative actions, etc. In an

extreme condition situation, the value of ‘initial parent’ and ‘mature parent’ variables

are provided as zero (0) and capacity of 100,000, respectively. In addition, policy had

an assumed impact of 30% business losses, and the decision for purchasing new chicks

was planned for 15 weeks’ time. The model run with extreme values generated the

simulated behaviour for parent chicks as shown in Figure 6.21. Line 1 on the graph

revealed the behaviour over time for this particular variable in an extreme situation.

The researcher later discussed the results with poultry experts and industry

management to ensure the authenticity of the model behaviour in this extreme

condition in which zero initial parent chicks was given as input. Logically, parent chicks

will stream after 15 weeks after a 15 weeks’ delayed purchase decision when there is a

maximum capacity of 100,000.

Figure 6.21: Extreme Condition Test for Parent Chicks

Extreme Condition for Mature Parent

As shown in Table 6.3, an extreme value was assigned to the connected variable of

‘mature parent’ to predict the possible simulated trend in comparison with reality. In

normal practice, the case industry maintains a maximum capacity of 200,000 parents

with 150,000 initial parents. At the same time, 10% deaths is treated as the normal

situation with birds having the capability of remaining productive for 42 weeks. To set

extreme values, the researcher considered a capacity of only 10,000 birds with 50,000

initial parents indicating quite abnormal thinking and circumstances. Realistically, the

200

‘mature parent’ variable should provide orders based on capacity but sometimes,

mismanagement and the inability to forecast create such an uneven situation. In this

case, the farmer would be forced to sell the parent birds to other parent firms and not

have to cull these additional parents as poultry meat. In addition, death rates were

considered to be 15% with a 25-week production life cycle both of which were also

unusual. The model produced 312 weeks of behaviour but only two years of the

variable’s behaviour were chosen for Figure 6.21 to make the presentation more

precise and clear.

Table 6.3: Extreme and Normal Values for Mature Parent

Variables Normal Situation

(Line 2)

Extreme Condition

(Line 1)

Initial Mature Parent

Capacity

200,000 10,000

Initial Mature Parent 150,000 50,000

Death Rate 10% 15%

Average Productive Life 42 25

It was indeed unusual for the case industry to maintain capacity of only 10,000 birds

with 50,000 initial parent chicks. The graph in Figure 6.21 reflects the expected

behaviour as it started from 50,000 but later reduced to less than 10,000 due to the

maximum capacity barriers. The extreme value also considered the death rate as 15%

and a production life cycle of 25 weeks, which are irregular occurrences in the real

world except when strong calamities hit the industry. In Figure 6.22, line 1 reveals the

behaviour over time for this particular variable in an extreme condition. Plausibly, the

‘mature parent’ variable behaved as anticipated compared to its input which was given

extreme values.

201

Figure 6.22: Extreme Condition Test for Mature Parents

Extreme Condition for Biogas

Biogas is a valuable by-product for the poultry industry as the case farm uses this in the

gas brooder for baby chicks. Up to 70% of poultry waste (litter) is used to produce

biogas in the case industry. The surplus production of biogas could be used in

converting electricity. Normally, one tonne of poultry litter generates 71 cubic metres

of biogas. In the extreme condition, 50% was used instead of 70% of total poultry litter

and 40 cubic metres per ton was used instead of 71 cubic metres. Subsequently, the

simulated model produced the desired result (as shown in Figure 6.23) for biogas

production that had drastically fallen due to lower conversion and less litter collection

compared to the normal situation.

Figure 6.23: Extreme Condition Test for Biogas

202

Zero Capacities

As has been discussed, several key variables and their simulated behaviour were

matched closely with the real-world data. The model was later verified in several

extreme condition tests which also provided satisfactory results. At this point, the

model was tested based on zero capacities. Zero capacities mean that all production

stops: sometimes, models fail to pass this test. There are some other options such as

one reality check being able to conduct this test for particular variables. However, a

broader view of the model can provide wider visibility for the most important key

variables and their instant impacts. As shown in Figure 6.24, the initial mature parent

capacity used zero (0) instead of providing its normal capacity to test the impact on the

whole model. Logically and as presumed, the model stopped at the first step as this

model had no capacity to rear the chicks. This means that the model is working

perfectly without having any structural errors. The relevant graph also shows yellow

shading on all stock and rate variables that were represented in the zero process over

time.

6.6.2.6 Sensitivity Analysis (Structurally Oriented Behavioural Test)

Sensitivity analysis is used to assist the modeller to understand the robustness and

correctness of the model (Pannell 1997) as discussed in the methodology chapter

(chapter 4). In addition, the behavioural sensitivity of SD model can be examined using

a bounded values for a particular(s) variables to observe the behaviour over time

(Qudrat-Ullah and Seong 2010). In fact, a range of numerical value is given as input for

constant variables to see what can happen in the real system. Is this behaving logically?

Positively, a numerical sensitivity analysis in line with projected estimated over time

for a real system under the similar situations. Such kind of test can give more

confidence on model structure to validate the system (Qudrat-Ullah and Seong 2010).

This section describes the sensitivity test which was prepared based on five crucial

variables. The sensitivity simulation analysis setup is shown in Table 6.4 and in the

screenshot of the Vensim package. Five key variables were selected for the sensitivity

analyses: initial parent chicks, initial mature parent chicks, time to make the purchase

decisions, hatching percentage and policy impact over the system. The table also

mentioned the type of distribution and the ranges used to analyse sensitivity.

Importantly, the sensitivity simulation was run 200 times using 777 random noise seed

to obtain rigorous test results. Figure 6.25 shows the sensitivity set-up window of the

Vensim software package to acknowledge the way in which the analysis was conducted.

203

Figure 6.24: Zero Mature Parent Capacity

204

Table 6.4: Sensitivity Set-up

Variables Distribution Range

Initial Parent Chicks Random Uniform 100,000 to 150,000

Initial Mature Parent Chicks Random Uniform 120,000 to 200,000

Time to Make Purchase Decision Random Normal 4 to 10 Week

Hatching Percentage Random Uniform 0.78 to 0.87

Policy Impact Random Uniform 0.05 to 0.20

Number of Simulation Runs 200, means that sensitivity analysis was run

200 times to check the model

Noise Seed Used 777, Noise Seed Used 777 for Simulation Run

Figure 6.25: Sensitivity Set-up Window

(a) Sensitivity Analysis for Mature Parent

Figure 6.25 depicts the sensitivity results for the ‘mature parent’ variable which is the

main variable of this model. The rest of this model’s output depends on the ‘mature

parent’ variable and its quantity. As shown in Figure 6.26, the result demonstrates its

robustness and accuracy based on given input. The analysis was calculated with the

confidence boundary used being 50% to 100%: confidence boundaries are indicated as

shaded colour. The results are satisfactory as graph lines for 200 simulation runs are

positioned within the confidence boundary.

205

Figure 6.26: Sensitivity Results for ‘Mature Parent’ Variable

(b) Sensitivity Analysis for Chicks (Day-old Broiler)

Day-old broiler chicks are the main income-generating sources for the case industry.

The sensitivity analysis for this particular variable also obtained satisfactory results in

all confidence boundaries. The same criterion of the ‘mature parent’ variable was

applicable for this analysis. Figure 6.27 depicting the sensitivity trends for 200

simulation runs did not expose any inconsistent or problematic behaviour over time.

Figure 6.27: Sensitivity Results for ‘Chicks’ Variable

206

(c) )Sensitivity Analysis for Biogas Production

Of the by-products, biogas is the most valuable. The case industry has massive plans to

effectively reuse biogas in the near future. They are expanding their production and

farm units which will help them to achieve doubled production of chicks and poultry

wastes. Now, they are planning to convert this biogas for the sake of reducing their

deficiency in electricity which incurs significant economic losses due to the need to

maintain 24-hour standby diesel generators. New technological adaptation will help

them to use biogas instead of costly diesel to run the generators. The sensitivity

analysis for this particular variable provided reasonable outcomes in all confidence

boundaries. Figure 6.28 represents the sensitivity graph for 200 simulation runs which

maintained the confidence boundaries and perceived consistent behaviour over time.

Figure 6.28: Sensitivity Results for ‘Biogas’ Variable

Above discussions analyse and explain sensitivity tests for the current model. Several

individual sensitivity results are shown in the above sub-sections under the section 6.7.

The objective of conducting such tests is to check model robustness and correctness in

light of significant value changes for variables. The changes made over various

distributions were mentioned in table 6.4 and figure 6.24. The sensitivity results are

within the respectable range which suggests that the current model is working

accurately even ranges of changes have been made.

Therefore, the discussions were made based on reliability and validity of the simulation

model. First, the model tested reliability issues based on the criteria set in the section

207

6.6.1 based on literature. The model has passed all the relevant tests to declare it as a

reliable model. It is noted that model generated behaviour is decently matched with the

real data, model has given expected results having random changes of noise seed,

gained expected output in multiple runs and find almost similar results between model

and real data for different key variables. Second, the model has conducted several tests

for validity as well. Several validity tests like boundary adequacy, structure, parameter,

dimensional consistency, extreme condition, sensitivity tests were examined. The

examined validity tests found the model as valid and workable in compare to real

practice. Some of the scenario analyses discusses in the later section of 6.7.

6.7 SCENARIO ANALYSIS

When modellers confirm model reliability, authenticity, behaviour, structure,

dimensions and extreme condition impacts, they usually do some policy tests to see

how the current model structure functions (Postma and Liebl 2005; Hsia et al. 1994).

To test this, an in-depth interview was undertaken with this case industry’s owner to

learn about their deliberate aims and if they will have scope to implement them. The

owner indicated that he wanted to see his industry double mature parent capacity,

increase parent chicks’ capacity, increase hatching percentage, reduce disaster and

calamity losses, reduce decision time, increase hatching capacity, etc. The main

problem for the Bangladesh parent breeder industry is that the day-old broiler chicks

do not obtain the desired price in comparison to costs in all seasons. The price

fluctuates too frequently, and it is beyond the farmers’ control to hold the minimum

profit and avoid financial losses. The current model is unsuitable for testing the pricing

issue as this depends on the nature of the market and seasonality. In fact, market price

fluctuation was not included in the model except for showing its impacts through

policy. The study tested three different scenarios which are as follows.

6.7.1 Scenario One: Increased Parent Chicks and Mature Parent Capacity with

Reduced Decision Time

If parent stock industry wants to increase their initial parent significantly with the

double increment of mature parent capacity and desire to reduce death rate and

decision time into half than standard practice then what changes will be achieved? The

inspiration of this test is to see the additional benefits through mentioned changes with

208

various consequences. It was mentioned before that the ‘mature parent’ is the most

considered variable with the highest influence in the current model. The model shows

an immediate reflection on most variables if ‘initial mature parent capacity” increases

or decreases. The more parent chicks are reared, the more egg and chick production

will flow towards the forward supply chain. At the same time, more poultry birds

generate more poultry wastes which can be converted into additional by-products. In

scenario one, the poultry owner wants to see his industry double mature parent

capacity, increase parent chicks’ capacity from 120,000 to 200,000, manage to reduce

the death rate from 10% to 5% and reduce 'purchasing parent chicks’ decision' from

eight weeks to four weeks. Table 6.5 shows the possible changes for scenario one when

four variables were considered in the policy test. These four variables are located on

the top left side of the integrated model (Figure 5.8, chapter 5).

Table 6.5: Changes for Scenario One

Variable Name Normal Value Expected Value for

Scenario One

Initial Mature Parent

Capacity

200,000 400,000

Initial Parent Chicks 120,000 200,000

Death Rate 10% 5%

Time to Make

Purchase Decisions

8 Weeks 4 Weeks

Values were given to the input to see the changes that eventuated in comparison with

the real-life situation of the model. The model ran under a different name as scenario

one and results were compared with the standard output for the same model. After the

run, the model with changed values was given different output than what was expected.

The model was later tested by increasing the capacity to double as the case industry

maintains capacity of 200,000 mature parent birds. The value of 400,000 mature chicks

was given as input for the initial mature parent which started flowing to the forward

and reverse supply chains of the model. Figure 6.29 shows the comparison between the

real-life and standard model behaviour based on changed values for four different

variables. The figure clearly shows that the model graphs are positioned at almost

double production in the individual graph of the model variables. The graph is a

shortened presentation of three key variables in comparison to the massive integrated

209

model. The production will be almost double if the capacity can be set at double as in

Figure 6.29. The graph considered the three key variables of ‘parent chicks’, ‘mature

parent’ and ‘day-old chicks’. The graph is also revealed that the death rate has been

reduced which helped to increase the total number of ‘mature parent’ birds for a

certain time. In contrast, the time taken for the parent chicks’ purchase decision did not

increase parent chicks to the same extent due to full capacity. Once capacity is full, new

parent chicks cannot enter the system.

Figure 6.29: Simulated Behaviour of Parent Chicks and Mature Parent under

Scenario One Test

The behaviour of poultry wastes under scenario one is revealed in Figure 6.30. The

behaviour of various poultry wastes is shown on the same graph. As shown, production

increased substantially more than the normal circumstances. The relevant graphs show

the simulated behaviour for poultry litter, feathers and intestines. The lines are

numbered in order to recognize and understand the changes in comparison to standard

practices in real life. It is understandable that more capacity will lead to the production

of more wastes to recycle and reuse. This recycling will obviously increase the

opportunities to generate more by-products. More by-products will create the prospect

of commercializing them to new market niches to gain supplementary financial

benefits. Moreover, the further processing of wastes can employ additional employees,

210

and establish family businesses and small and medium industries (SMEs) to handle

such operations. The poultry industry can thus achieve maximum benefits if they are

able to implement such policies in the near future.

Figure 6.30: Simulated Behaviour of Wastes under Scenario One Test

6.7.2 Scenario Two: Consider Less Mortality and Maturing Time, Less Unhatched

and Broken Eggs, Increased Hatching Percentage along with Doubled Rise in

Hatchery Capacity

In scenario two, policy makers and the owner want to reduce mortality which is one of

the major concerns of Bangladesh poultry. They also want to increase the hatching

percentage and hatchery capacity in order to increase chicks’ production. At the same

time, they want to reduce the maturing time which would means that the mature

chicken would go to market a little earlier to flow more chicken to the market. The

changes made in the scenario two tests are shown on Table 6.6. As can be seen, the time

for hatching eggs changed from three weeks to 1.5 weeks. Scientifically, it is not

possible to hatch an egg in less time than three weeks or 21 days. Here, the time of 1.5

weeks denotes the doubled hatchery capacity so that the ultimate chick production will

be twice the capacity in real-life practice. The maturing time for the chicken was 3.5

weeks instead of four weeks which means that the mature chicken would be ready to

consume at a lower weight than in normal practice. For this, the poultry shed would be

211

cleaned out four days earlier which may help them to rear three additional flocks a

year. Therefore, the mobility and supply of chicken will be increased to a higher level

than the real-life practice.

In addition, the chicken mortality rate was considered at 2% in comparison to the real-

life practice of 4%, the hatching percentage was increased to 88% from 84%, the

unhatched rate was reduced to 12% from 16% and, finally, broken eggs were

courageously considered to be 1% compared to 3.5% in reality. The values were next

given as input to perceive the deviations that were instigated in comparison with the

standard values of the model. The model ran under the different name of scenario two

and was compared with the standard output of the same model.

Table 6.6: Changes for Scenario Two

Variable Name Normal Value Expected Value

for Scenario Two

Time for Eggs Hatching 3 Weeks 1.5 weeks x 2

(Double Capacity)

Time for Mature Chicken 4 Weeks 3.5 Weeks

Mortality Rate for Farmers 4% 2%

Hatchery Percentage 84% 88%

Unhatched Rate 16% 12%

Broken Eggs 3.5% 1%

Figure 6.31 displays the perceived changed model behaviour due to the changed values

which created scenario two for specific variables. Simulated behaviour for broken,

unhatched and hatching eggs is shown in the same figure to realize the expected

positive changes for broken and unhatched eggs. One positive change was the

increased number of hatching eggs which would guide a little more chick production

within the limits. Increased hatching percentage helped to achieve more production

than in the real-life scenario.

212

Figure 6.31: Simulated Behaviour of Reject and Hatching Eggs under

Scenario Two Test

Simulated behaviour for farmers, chick production and mortality is shown in Figure

6.32. The graph lines demonstrate the comparison between real-life practice and the

policy test. The graph lines reveal that mortality has been drastically controlled which

helps the farmers to achieve more production. Clearly, chick production almost

doubled as capacity increased. Thus, scenario two would be best applied by farmers, for

chick production (hatchery) and to reduce chick mortality rates (by farmers) to achieve

more sustainable benefits.

Figure 6.32: Simulated Behaviour of Farmers, Chicks and Mortality under

Scenario Two Test

213

6.7.3 Scenario Three: Consider Reduced Cost per Parent and Other Costs,

Increased Chicks’ Price and Increased Biogas Production

In scenario three, policy makers and the owner want to increase profitability by

reducing costs and expecting a better price for their day-old chicks. At the same time,

they want to increase biogas production by increasing poultry litter input to the

processing. Biogas is more profitable than the other types of by-products. The changes

made for the scenario three tests are presented in Table 6.7. Higher costs are hindering

the achievement of maximum profitability for Bangladesh poultry. At the same time,

the industry is thinking of generating electricity from biogas which would be very

useful and a cost saving method for them. In making this change, the average cost per

parent per week would reduce to A$0.90 from $A1.10. Other costs per week would

reduce to A$0.15 from A$0.25. The industry assumed that the sales price of day-old

chicks would increase to A$0.75 from A$0.55. Figure 6.33 presents the changed

simulation behaviour for costs, sales and profits over time. Importantly, profit would

increase significantly which is the utmost desire of the policy makers. The per bird cost

and other costs were given input values of A$0.20 and A$0.10 less respectively. As a

consequence, profit was maximized in the simulated behaviour for the scenario three

test. The final test was done for by-products manufactured from poultry wastes.

Figure 6.33: Simulated Behaviour of Costs, Sales and Profits

Figure 6.34 shows the simulated behaviour for the production of biogas, fertilizer and

fish feed with real-life production. The graph also reveals that fertilizer and fish feed

production were reduced due to the reduction of raw materials (poultry litter). Biogas

214

production increases as expected due to 90% of total collected poultry litter being used

instead of 70% of litter. Therefore, the scenario three tests were also more significant

than the tests for the other scenarios for maximizing profits and utilizing poultry litter

to produce economically viable by-products.

Table 6.7: Changes for Scenario Three

Variable Name Normal Value Expected Value for Scenario Three

Cost Per Parent Per Week A$1.10 A$0.90

Other Costs Per Week A$0.25 A$0.15

Average Chicks Price A$0.55 A$0.75

Litter for Biogas 70% 90%

Litter for Fertilizer 15% 5%

Litter for Fish Feed 15% 5%

Figure 6.34: Simulated Behaviour of By-products

Above scenarios are focused, predicted and analysed based on three different situation

of the poultry production process in Bangladesh. These scenarios are designed to

demonstrate that the simulation model works perfectly grounded on requirements. In

215

scenario one, the model dealt with double production of parent and mature chicks with

reduced decision time which meet the efficient poultry production system for achieving

sustainability. In scenario two, the model measured double hatchery capacity by

reducing mortality, unhatched and broken eggs rate and standard chicks maturity time.

By doing this test, the model controls recyclable wastes and can maintain double

hatchery capacity to deal with more eggs flow from the parent farms. In scenario three,

the model considered reduced costs and increased price for final products and better

biogas production rate. Better price with the significant amount of by-products creation

can be handled through scenario three. Aggregately, efficient productions with proper

wastes handling can save the industry to manage to make more profits. At the same

time, competent and sustainable process can bring more social, economic and

environmental benefits which need to be examined to justify the research problem. It is

now inevitably proven that the simulation model can predict the changed situation

which can be applied in real-life situation.

6.8 SUMMARY

This chapter has discussed the findings based on the simulation results. The

interpretations of the tables and graphs were carried out to show the opportunities

that exist for integrating the poultry forward and reverse supply chains for the sake of

better utility. The above discussions and presentations were based on the simulated

output of the poultry supply chain model. The discussions were organized in light of the

forward and reverse supply chains and the integration of the poultry supply chain for

the case industry in particular and for Bangladesh in general. Each section exposed and

discussed the simulated behaviour over time and undertook a comparison between

simulated and real-life data. Structural validity, extreme conditions and statistical

analysis for the main variables were later illustrated and thoroughly interpreted.

216

CHAPTER 7:

DISCUSSION OF RESULTS

7.1 INTRODUCTION

This chapter discusses the results analysed from the simulation model developed in

this study. All of the results along with the tests of reliability and validity of the

simulation model were shown in the previous chapter (see chapter 6). This particular

chapter links the discussion of simulation results with the research objectives and

questions. In support of this connection, additional tables and figures are presented.

This chapter is structured as follows. The next section describes the appropriateness of

a sustainable poultry process in light of the economic, social and environmental aspects

which also addresses the first research question. This section includes subsections

which specifically discuss the sustainable poultry production process followed by

discussion on the specific economic, social and environmental benefits achieved from

the poultry process. In response to the second research question, the following section

discusses the forward supply chain and its consequences for societal changes such as

creating employment and reducing poverty. The next section explores the reverse

supply chain process for recycling poultry wastes in a profitable way. This section

includes discussion on possible contributions gained through the reverse supply chain

which includes answers to the third research question. In conclusion, a chapter

summary is presented as well as an outline of the next chapter.

7.2 RESEARCH QUESTION ONE: WHAT IS THE MOST APPROPRIATE SUSTAINABLE

POULTRY PRODUCTION PROCESS WITHIN THE BANGLADESH POULTRY

INDUSTRY IN LIGHT OF THE ECONOMIC, SOCIAL AND ENVIRONMENTAL ISSUES?

The current study has focused on developing and designing an appropriate sustainable

poultry production process for the parent stock (PS) industry which can be maintained

for the aggregate and individual economy, society and environment. To do so, the study

explored the forward and reverse supply chain operations of a specific poultry parent

stock (PS) industry. Previous chapters have presented a number of tables and graphs to

reveal the real facts of the sustainable poultry process and three aspects of benefits.

This current section particularly addresses research question one which explored the

217

sustainable benefits that can be achieved from the poultry supply chain process. The

following discussion presents details of sustainable poultry production process

followed by sustainable benefits from poultry activities that can bring economic, social

and environmental benefits through an industry operation. Later, the literature in

support of these activities will be presented, which claim the appropriateness of a

sustainable process along with sustainable outcomes.

7.2.1 Sustainable Poultry Production

The main objective of this study was to develop a composite poultry supply chain

model so that sustainability would be maintained. In reality, most of the poultry

processes are existed in a scattered way. The current research put an effort to combine

all fragmented processes under a single umbrella with minor extensions to develop an

effective sustainable poultry production process. In the literature review (see chapter

2), sustainability and related terms were described with social, economic and

environmental aspects having the highest priority. In fact, without this stability, the

company cannot achieve sustainability. As previously mentioned, the Bangladesh

poultry sector makes a significant contribution to society. Thousands of businesses and

millions of workers are involved with this industry. Now, following discussion presents

how the current poultry process can be achieved substantial sustainable outcomes in

terms of economic, social and environmental sustainability perspectives.

Figure 7.1 is a simplified framework for a sustainable poultry supply chain process

which has already been shown in a more complex form (see Figure 5.8 in Chapter 5).

Moreover, Figure 3.8 in chapter 3 depicted the input and output of the poultry process

supply chain for a parent stock (PS) company. With this Figure 7.1, it is clearly

comprehended that forward and reverse supply chain integrates together to achieve

more benefits. Better input can help to gain quality output. At the same time, it (Figure

7.1) shows poultry wastes can be collected through third party small-medium industry

to reprocess them to make valuable by-products. The main purpose of this study was to

develop smooth forward and reverse supply chains and then integrating them to

achieve sustainable benefits (outcome) for the company and society. The model (Figure

5.8 of Chapter 5) was developed based on a case industry which is already operating

and implementing many scientific processes to achieve sustainability. The case

218

industry is a parent stock (PS) company in addition to which they maintain a hatchery,

feed mill; day-old chicks supply chain network and by-product processing unit.

Notably, the supply chain length depends on the scope of the poultry business

operation as there are so many varieties of operation that can be adopted. The

operations may include grandparent, parent, ultimate farming, feed processor, feed

supplier, chicks and chicken supplier, chicken processor and all the intermediary

businesses. Poultry is a business which is completely dependent on input and a given

input will drive the following supply chain operations for a particular period of time.

There is no other way to increase the production or operation as it depends on the

number of chicks or eggs available in the process. The possibility of decreased

production can happen at any time due to calamities and disasters. Therefore, the main

output (chicks and eggs) of the poultry operation is dependent on given input and, at

the same time, the wastes generated are based on existing flock sizes.

Poultry Operation

Wastes

InputOutput:

Chicks and Eggs

Collected Wastes

By-Products

Small Industries

Figure 7.1: Sustainable Poultry Process

Usefulness of Poultry By-products

In addition, wastes are a foremost concern nowadays and scientists are putting their

best efforts to finding ways to reuse or recycle wastes in a valuable way. Figure 7.1 also

219

explains how poultry wastes can be reversed to the main operation to generate by-

products. Alternatively, such wastes can be redirected to small and medium industries

(SMEs) for further processing. In this way, SMEs will be established to process the

economically viable by-products. These by-products can be consumed by different

segments of customers and, perhaps, by the same industry. For example, biogas can be

used for cooking burners, heating burners and generating electricity. The case industry

uses biogas for warming the day-old chicks (brooding stage) and cooking for the large

number of employees (cooking burners). The case industry has a minimum of 1,500

employees, and the industry canteen cooks for all of them. After using this quantity of

biogas, a significant amount of gas remains as surplus. The surplus gas can be used for

converting electricity as the power supply from the government authority is not

enough for daily use. The case industry has already signed a contract with a foreign

company to implement this strategy. Electricity scarcity is common in Bangladesh

where it is expensive to buy from private and government power generating agencies.

Moreover, the power supplying agencies are unable to provide continuous electricity to

clients as supply is significantly less than the demand. Every day, the industry has to

accept load shedding for at least six to eight hours (Rahman 2013b). As a result, they

have to use a standby fuel generator to cover the gap which increases the chicks’ cost.

In a situation like this, they can use biogas as fuel for generating electricity which will

benefit them financially. Therefore, most of the by-products are useful in Bangladesh

context which will help the poultry industry to attain sustainability.

7.2.2 Sustainable Benefits (Economic, Social, and Environmental) from Poultry

Activities

According to reports from the Global Reporting Initiative (GRI), Dow Jones and

Association of Institution of Chemical Engineers (AICHE), sustainability has a number

of indicators which they consider when making their reports to institutions.

Considering these indicators, as shown on Figure 7.1, the poultry operational activities

are disclosed which support the acquisition of sustainable benefits under sustainability

theory. In the literature review (see Figure 2.8 in Chapter 2), a sustainable supply chain

diagram was shown in order to understand the facts behind managing three-factor

benefits. It was also disclosed that addressing any two of the three factors could be

good for the industry supply chain operation. For example, better social and economic

activities was called ‘better’, improved social and environmental or economic and

environmental activities was ‘good’ and maintaining all three factors was ‘best’. Table

220

7.1 describes all major poultry activities and the sustainable benefits that originate

from them. The 15 main activities of the poultry operation were identified in the in-

depth interviews and focus group discussion.

Eleven (11) of the fifteen (15) activities socially and economically benefit the industry

and society, which was called ‘better sustainability’ by Carter and Rogers (2008).

Rearing parent chicks and mature parents is of benefit to the society and economy. In

terms of economic benefits, these two operations are seen to create employment, new

ventures and earn financial returns while for social benefits they are observed to fulfil

individual and industry needs, create value, reduce poverty and create entrepreneurs.

In this way, the hatchery operation, chick production, chick supply for middlemen,

agent and sub-agent activities, rearing broiler birds, supply to the distributor and profit

making directly benefit Bangladesh society and the economy. Doubt may be expressed

about profit itself being treated as a social benefit. The logic behind calling profit a

social benefit is that society will be the beneficiary if an industry makes profit. The

industry will spend some of their slice of profit for the sake of social and employee

development (Friedman 2007).

Table 7.1: Benefits from Poultry Activities (Rahman 2013c, 2013b)

No. Main Activity Sustainable Benefits

1 Rearing Parent Chicks Social and Economic

2 Rearing Mature Parent Social and Economic

3 Hatchery Operation Social and Economic

4 Producing Chicks Social and Economic

5 Distributing Chicks Social and Economic

6 Middlemen Operation Social and Economic

7 Employ Agent and Sub-agent Social and Economic

8 Creating Ultimate Broiler Farmers Social and Economic

9 Selling Chicken to Middlemen Social and Economic

10 Extend Farming Operation Social and Economic

11 Making Profit Social and Economic

12 Proper Dumping of Poultry Wastes Social and Environmental

13 Using By-Products Social, Economic and Environmental

14 By-Product Processing Social, Economic and Environmental

15 Bakery Production Social, Economic and Environmental

221

If social and environmental benefits can be achieved together, this is referred to as

‘good’ by Carter and Rogers (2008). The activity of appropriate dumping of wastes

found in the poultry operation falls into this category. The poultry wastes generated

from a poultry operation were discussed in chapters 3 and 5. Referring to the literature,

it was revealed that some wastes were yet to be appropriately recycled and reused to

generate extensive economic benefits for farmers. For instance, poultry feathers and

intestines mostly remained unused for the case industry. They were selling poultry

feathers for a lump sum price to third party companies for further processing (Chowan

2013; Rahman 2013a). However, the case industry personnel did not know the specific

processes carried out by the feather processors. Some poultry intestines were supplied

to fish farmers (Cobbler fish and catfish) and the remainder were dumped in an

appropriate way. Some poultry processors are dumping these wastes in river and canal

water which is suicidal for society, farmers and the surrounding community. This was

why the case industry followed the appropriate environmentally friendly way of

dumping such hazardous waste.

Three of the poultry activities in this study were directly achieving benefits for all three

factors: social, economic and environmental. This triple bottom line success is

recognized as achieving sustainability for a particular supply chain (Savitz and Weber

2006; Lee 2004; Carter and Rogers 2008). For example, processing by-products such as

biogas, fertilizers and fish feed made from poultry wastes can achieve social, economic

and environmental benefits. Recycling poultry wastes can keep the environment free

from pollution, create small industries to process it and gain additional financial

benefits by selling by-products. Even if the waste processors are using the by-products

for their own consumption rather than selling them to the market, they are also saving

money which is a direct economic benefit for them.

The earlier discussion on poultry activities and sustainability has revealed that

sustainability theory and its components were covered by the activities operated by the

case industry. Nevertheless, a particular point of concern was that some of the

operations managed by third party companies were undertaken in an unorganized and

unscientific way. The industry would be able to achieve all three aspects of

sustainability if these operations or processes could function within an integrated

model (see Figure 5.8 in Chapter 5).

222

7.2.3 Economic Activities in Poultry Farming

Economic gain is the main factor of concern in achieving sustainability. The company is

always striving to reach its optimum targeted profit to accomplish other

responsibilities such as social and environmental care. Three economic activities (table

7.2) were observed in the poultry industry in Bangladesh which are discussed in the

following sections.

Table 7.2: Economic Activities in Poultry Farming

Indicators: Economic Factors Poultry Activities

Financial Profitability (Dees 1998) Making Optimum Profit

Value Addition (Ahmad and Seymour 2008; Acs and Armington 2004; Cobb et al. 2009)

Producing By-products and Chicken Processed Food

Sales and Cost of Goods (Cobb et al. 2009; GRI 2009)

Maximum Sales and Reducing Cost

7.2.3.1 Financial Profitability

The main inspiration for operating a business is to make a profit even it is a social

business for eradicating poverty (Seelos and Mair 2007; Dees 1998). Without profit

making, no business can be sustained to achieve its short- and long-term objectives: the

poultry business is no exception to this motivation. The main product of the case

industry is day-old chicks. Chicks’ price in the current market determines their ultimate

profit. Although the chicks' market is vulnerable in nature, the company can manage to

earn an attractive profit at the end of the year. Figure 7.2 shows the inconsistency of

the profit curve but that the company still manages to retain the expected average level

of profit.

7.2.3.2 Value Addition

Value addition offers more resources and activities than a main product alone in order

to provide additional facilities to customers (Cobb et al. 2009; Grönroos 1997). In this

poultry process, by-products are generated in addition to the main product of day-old

chicks. Poultry meat processing units produce many varieties of value-added products

such as chicken nuggets, samosas, etc. which are beyond the research boundary. In the

223

input–output poultry model (see Figure 3.8, Chapter 3), value-added chicken foods and

by-products from wastes have been shown in order to comprehend the level at which

these can be processed.

Figure 7.2: Simulated Behaviour of Costs, Sales and Profits

7.2.3.3 Sales and Cost of Goods

Sales and cost of goods are important indicators for assessing the presence of

sustainability in a company (Cobb et al. 2009; GRI 2009). Sales are the heart of a

business while cost of goods always influences sales and profit. For instance, the case

industry produces chicks a certain amount of which needs to be sold in the market,

otherwise they cannot minimize the cost of goods and manage optimum profits. At the

same time, minimizing cost is the burning issue for the company as it helps to achieve

additional profit. The case industry has taken many relevant steps to reduce their cost

of goods by utilizing indigenous raw materials from its own sources. For example, the

industry is using biogas to generate heat for brooding the chicks and is also using

bamboo slats instead of costly imported plastic slats. This is how the industry is saving

costs in its aim to make extra profit to cover all the necessary expansions and

incentives for its employees and society.

7.2.4 Social Activities in Poultry Farming

Social benefits are one of the components for sustainability which are mostly a concern

for society and community. Social indicators in sustainability concepts are listed in the

various reports of GRI, AICHE and Dow Jones. A number of direct and indirect social

benefits can be gained through a sustainable poultry supply chain process. Table 7.3

224

shows the social indicators that match the real-life poultry supply chain operation.

Some direct social gains from the poultry processes are discussed below.

Table 7.3: Social Activities in Poultry Farming

Indicators: Social Factors Poultry Activities

Employment Creation (Reynolds et al. 2001; GRI

2009; Cobb et al. 2009; Knoepfel 2001)

Parent Stock Farming, Hatchery,

Middlemen, Ultimate (Broiler)

Farming

Poverty Reduction (Yunus 2007; Krantz 2001;

Coulthard, Johnson, and McGregor 2011; Rhyne

1998)

Farming, Working, Participating

as Supply Chain Member

Create Self-employed Young Entrepreneurs

(Wagner 2003; Freytag and Thurik 2010; Lazear

2003; Åstebro and Thompson 2011; Lynch

2004; GRI 2009; Cobb et al. 2009; Knoepfel

2001)

Farming, Distributor, Agent, Sub-

agent, Supplier of Raw Materials,

Middlemen (Chicks and Chicken

Sellers), By-Products Processor,

Ultimate Farmers

Creating New Ventures and Family Business

Creation (Stock and Watson 2003; Dyer and Chu

2003; Heck and Stafford 2001)

Small and Medium-scale

Farming, By-Products Processor,

Sub-agent

Social Welfare and Care (Seelos and Mair 2005a;

Hall, Daneke, and Lenox 2010; Sundin 2011)

Gaining Profit, Recycle and Reuse

of Poultry Wastes

7.2.4.1 Employment Creation

Employment creation is one of the main concerns for research question one as it

explores whether or not the forward supply chain of a poultry process creates

employment. Employment generation is a major indicator of the social aspects of

sustainability (Reynolds et al. 2001; GRI 2009; Cobb et al. 2009; Knoepfel 2001). The

more employment generated, the more social contribution can be made by an industry.

An employment opportunity denotes the capability of a person to steer one's family.

Therefore, it has a tremendous positive impact over a society in acknowledging an

industry for its contributions. For example, parent farming and broiler farming

contribute the most in terms of creating employment opportunities. Notably, the

employment of one person is required to rear 500 parents while broiler farming needs

one person per 1,000 birds. In addition, the hatchery unit and role of the middlemen

also create significant employment. Importantly, as more and more poultry birds are

reared in a farm unit, more opportunities for employment will be created.

225

7.2.4.2 Poverty Reduction

Poverty reduction is an immense anxiety for the Bangladesh economy as more than

40% of its people are living under the poverty level (BBS 2010; Yunus 2007). Most

businesses do not even know how they can contribute to eradicating poverty (Hancock

1992; Yunus 2007). It is not considered necessary for an industry to track how it

contributes to addressing social issues. However, this can be assessed easily by the

government or non-government agencies based on product turnover, people

involvement, supply chain networks, etc. The poultry sector contributes significantly to

the rural and urban economy. People are involved with the supply chain network of the

case industry participating as a worker, agent and middleman, etc. For instance,

workers of the participating farms eliminate their poverty by doing their jobs at a

standard level of performance. Moreover, significant numbers of people are involved as

workers for supply chain members. The case industry maintains its supply chain

networks for distributing day-old chicks covering 70% of the country. Such a network

creates better scope for eliminating poverty especially for the significant number of

people living in the rural area.

7.2.4.3 Create Self-employed Young Entrepreneurs

Creating self-employed young entrepreneurs is stimulating for a society as it provides

the opportunity for young people to be self-employed: sustainability performance can

be judged based on how many entrepreneurs are involved within a business network

(Wagner 2003; Freytag and Thurik 2010; Lazear 2003; Åstebro and Thompson 2011;

Lynch 2004; GRI 2009; Cobb et al. 2009; Knoepfel 2001). There are many young

unemployed people in the rural and peri-urban areas in Bangladesh. They are

searching for suitable employment and small businesses so they can maintain their

livelihoods. The prospect of tempting young entrepreneurs is relatively high within the

poultry supply chain network. For instance, ultimate (broiler) farming is an

opportunity for young entrepreneurs to become involved due to the low capital and

space required. According to the poultry owner, one young entrepreneur can start

rearing 1,000 day-old chicks with an investment of approximately A$3000 which is

remarkably low in terms of investments required for other businesses. If they are

maintaining 1,000 birds efficiently, it is expected that they can maintain their livelihood

along with that of their family. Obviously, they have to consider various types of

calamities, disasters and market fluctuations in maintaining their self-employed small

226

poultry farming business. Similar opportunities for creating self-employment are

available at the levels of distributor, agent, sub-agent, supplier (raw materials),

middlemen (chicks and chicken sellers) and by-products processor.

7.2.4.4 Creating New Ventures and Family Business Creation

Creating new ventures is vital for a society as it expands the opportunities to involve

more people and entrepreneurs (Stock and Watson 2003; Dyer and Chu 2003; Heck

and Stafford 2001). At the same time, new ventures can be formed within a family. Even

the case industry initiated their business in 1986 as a small farmer under the family

business. They later expanded their business and converted it to a joint-stock company.

They are continuing to operate their business under a family umbrella of three

members. The case industry is a role model farm for the surrounded community due to

their tremendous success in the past two decades. The difference between family

businesses and other types of business is that it can be operated by family members

with or without help of additional workers. For example, one person can maintain a

2,000-bird capacity in a small farm with assistance of other family members. Similarly,

poultry by-product processing and sub-agents of day-old chicks' supply can be

maintained within a family boundary. These initiatives can form more and more new

ventures with so many opportunities to involve other people from within a society.

7.2.4.5 Social Welfare and Care

Social welfare and care are an ultimate responsibility for the company that makes

substantial profits from an economy (Seelos and Mair 2005a; Hall, Daneke, and Lenox

2010; Sundin 2011). Social benefits are a kind of indirect ‘payback’ to society by the

industry concerned. For instance, the case industry was established a primary school

and a mosque and provides charity for disadvantaged people in the surrounding

community.

7.2.5 Environmental Activities in Poultry Farming

Environmental management within the supply chain domain has been gradually

building but remains scarce (Vachon and Klassen 2008). Environmental activities have

become important for manufacturers as they face intense pressure from supply chain

members (Henriques and Sadorsky 1999). The poultry industry is no exception as it

generates a number of wastes which need to be appropriately dealt with. Otherwise,

227

they will damage the environment in many ways. Table 7.4 presents the environmental

indicators along with poultry activities in Bangladesh. The following sections discuss

some direct environmental issues that the poultry industry needs to consider and is

addressing.

7.2.5.1 Waste Recycled or Reused

Poultry wastes are no longer considered as something worthless to dump without

recycling or reusing as they can be converted into valuable by-products (Sikdar 2007;

Gertsakis and Lewis 2003; Tipnis 1993; Edwards and Daniel 1992). In the literature

review section (chapter 2), the usage of various poultry wastes to make different by-

products was discussed. This study has specifically focused on poultry waste

management which relates to the reverse supply chain process of poultry operation.

‘Recycle’ and ‘reuse’ are separate terms with different meanings. Recycling is a

procedure to convert waste into new products to prevent the potential harmfulness of

waste (Elfasakhany et al. 2001; Murphy, Mueller, and Gowda 1993). For example,

poultry litter (excreta) is converted into valuable by-products of biogas, fish feed and

fertilizer. The case industry follows particular procedures to convert its poultry wastes

into such valuable products. On the other hand, reuse means that something is used

again after it has already been used (www.recycling-guide.org.uk). In a poultry

operation, the products are perishable and cannot be stored for long time. Moreover,

there is almost nothing to get back from customers after they have consumed the

products. On the other hand, poultry litter is converted to biogas. After producing

biogas, a certain percentage of wastes need to drain out which can then be used for

making fertilizers. This is how the reuse concept is used in a poultry operation.

Table 7.4: Environmental Activities in Poultry Farming

Indicators: Environmental Factors Poultry Activities

Waste Recycling or Reuse (Sikdar 2007; Gertsakis and Lewis 2003; Tipnis 1993; Edwards and Daniel 1992)

Reuse and Recycle Poultry Wastes

Reducing Environmental Degradation (Dean and McMullen 2007)

Reuse and Recycle Poultry Wastes, Using Biodegradable Chicks’ Packaging

Biofuel (Biogas) (Hill et al. 2006) Producing Biogas and Artificial Firesticks

228

Environmental Certification (GRI 2009) Maintain Environmental Certification under Department of Environment, Bangladesh Government

7.2.5.2 Reducing Environmental Degradation

Environmental degradation is the decline of the environment through diminution of

resources (air, water and soil), ecosystem and wildlife (Johnson et al. 1997). Nowadays,

any kind of disturbance to the environment is not acceptable and it should be

controlled from the source (Dean and McMullen 2007). The poultry industry generates

a number of wastes which may cause biodegradation. Moreover, the poultry operation

as a whole uses many raw materials to procure its feed and products which can cause

the same degradation. For example, 40-50 day-old chicks are packaged in a box which

can be made from plastic material which is hazardous to the environment. To protect

against such damage, the case industry is making their chicks’ packaging from

cardboard and bamboo materials rather than using plastic or synthetic components. In

fact, the farm needs to watchful over its whole operation to find out the risks of

environment degradation and should take appropriate measures to control it. The

poultry operation needs to track its wastes flow towards particular destinations such

as canals, rivers and ponds and then address the potential consequences before they

occur. For instance, the hatchery unit of the poultry operation uses highly corrosive

cleaning materials to clean their incubators after hatching a batch of chicks. The case

industry is specifically using a pond area into which corrosive water flows where it is

contained: thus, the industry does not allow it to flow to another destination. This is

how the industry can protect against environmental biodegradation to safeguard

people and wildlife.

7.2.5.3 Biofuel (Biogas)

Biogas is an environmentally friendly renewable energy as are solar and wind energy

that is produced from recycled wastes (Picken and Strub 1983; Deublein and

Steinhauser 2011). Environment damage can be prevented through converting wastes

into biofuel and biogas with this process aiming to reuse the wastes for a different

purpose (Hill et al. 2006). As discussed earlier, poultry litter waste is converted to

biogas which can be used for operating electric generators, heaters, burners, etc. The

229

case industry is even considering converting biogas into electricity through a high-tech

converter. For example, the case industry is currently using 70% of its poultry litter for

converting into biogas. If they did not process such a quantity of waste to produce

biogas, they would potentially dump it on vacant land, or into canals and rivers. By

converting the wastes, they are saving the environment to a great extent.

7.2.5.4 Environmental Certification

Environmental certification is required for a company to be considered as having an

eco-friendly operation (GRI 2009). In Australia, planning and environmental conditions

are designed for poultry growers which are regulated by the government authority

(GOWA 2004). Similarly in Bangladesh, the environmental agency under the concerned

ministry provides environmental certification by observing the poultry operations and

the surrounded atmosphere. The research case industry has retained this certification

since the regulation was imposed on poultry farmers. This means that they are

maintaining their operation in an environmentally friendly way.

Figure 7.3 depicts a sustainability diagram based on the research model shown on

Figure 5.8 (Chapter 5). Using arrows, it clearly marks the benefits flowing from stock

variables to sustainability indicators. This figure also points out the number of bakery

items that can be produced from the unhatched eggs that flow from the hatchery and

farms. At the same time, the number of employment opportunities is also measured

through this model. The same effect has been shown in number nine (bakery items) on

Figure 5.8. In addition, Figure 7.3 reveals the number of entrepreneurs that can be

created at the distribution level which was also shown in number eight on Figure 5.8.

Workers (additional employment) need to operate the small businesses of sub-agent

and bakery unit which is also shown on the model.

As shown on Figure 7.2, mature parent, chicks, bakery items, biogas, fertilizer,

intestines, fish feed and feathers are providing economic benefits. Mature parent,

chicks, employment, middlemen, bakery and biogas processes are benefiting society.

Notably, fish feed, intestines and feathers can also provide social benefits subject to

small businesses being involved by the third party company. Lastly, environmental

benefits can be achieved from profit and processing of bakery items, biogas, fertilizer,

fish feed, intestines and feathers. Profit can also help to maintain the contribution to the

environment. For instance; if the company made additional profit above the expected

230

level, it will spend some proportion of profit to restore the environment or prevent

environmental degradation for the sake of the surrounding community.

Figure 7.3: Poultry Process and Sustainability

The above discussion provided details about sustainability and its components in the

supply chain of the case poultry industry. The discussion was based on economic, social

and environmental aspects of sustainability. The case industry supply chain operation

was found to bring economic, social and environmental benefits for the country. The

impacts of such components are influential contributing to Bangladesh society to a

great extent. Thus, the above-mentioned process can be regarded as an appropriately

sustainable poultry production process that meets the purpose of achieving

sustainability. The above sections therefore reviewed the first research question.

7.2.6 Summary

The motive of first research question is to quest the most appropriate sustainable

poultry production process in light of triple bottom line of sustainability. Above

discussions (see section 7.2) is tried best to defend the first research question. To

support this question, above sections elucidates sustainable poultry production process

(section 7.2.1) followed by sustainable benefits (economic, social, and environmental)

231

from poultry activities. Later, economic, social, and environmental activities within the

poultry process have been discussed to support this model as sustainable in nature.

7.3 RESEARCH QUESTION TWO: IN WHAT WAYS CAN THE POULTRY FORWARD

SUPPLY CHAIN (FSC) BRING SOCIAL CHANGES LEADING TO EMPLOYMENT

GENERATION AND, THEREBY, REDUCING POVERTY?

The second research question investigated the forward supply chain (FSC) process and

its role in bringing positive social changes. The forward supply chain is a process which

initiates from the raw material and progresses through to the ultimate consumption of

a product (Bowersox 2011; Rogers et al. 2002; Poirier and Reiter 1996). The poultry

forward supply chain is an extensive network starting from the pure line breed through

to the final consumption of meat and eggs. However, this study has limited its research

boundary to parent stock farming through to broiler meat consumption. This study has

only considered broilers bred for meat supply and consumption. Within the research

boundary, parent stock rearing, hatchery operation, chicks’ distributors, agents and

sub-agents under distributors, broiler farmers and middlemen selling mature chickens

are involved. Therefore, a long supply chain exists within the forward channel which

can contribute to social changes. The following sections deals with various social

changes through poultry forward supply chains.

7.3.1 Forward Supply Chain and Various Social Involvements

Table 7.1, as described in subsection 7.2.1, lists the kinds of activities involved in the

forward supply chain. Table 7.1 also shows that the first 11 activities involve

sustainable social and economic benefits. Figure 5.5 and Table 5.5 (see chapter 5)

previously mentioned the main areas (as a number) of the integrated model

highlighting the number and title in a box. There were 10 different main areas

identified and discussed in chapter 5. Within these areas, number one (parent stock),

four (eggs and hatchery) and five (farmers and middlemen) are directly involved with

the forward supply chain. In addition, capacity decision (area two) and profit and loss

(area three) are also related to the forward supply chain but do not contribute social

benefits instead computing and managing desired parents for future flocks and profits

and costs.

232

Figure 3.9 (see Chapter 3) presented the forward supply chain process starting from

the pure line poultry mother breed and finishing with customers. The case industry

starts their operation from parent stock and maintains the rest of the processes in their

forward supply chain. Operationally, parent stock day-old chicks initially come to the

breeder farm and are reared for 22-24 week to become mature and are then named as

mature parent. The mature parent is then reared for 42 weeks for hatcheable eggs

collection. The hatchery unit starts by preserving eggs in scientific cold storage for a

certain period. This unit again tests and examines hatchable eggs before setting eggs

into hatching incubators. The eggs stay in hatching incubators for 18 days and are then

transferred to the hatcher machine for the remaining three days. Finally, the chicks are

ready to travel to the distributor for delivery to the final broiler farmers. The hatchery

must establish the grade for their chicks with this recorded and acknowledged on the

chicks’ box. Normally, four grades are available in Bangladesh poultry, named as A, B,

B+ and C. B+ and C grade chicks are not sold by the case farm to maintain goodwill. The

healthy chicks are then distributed to the ultimate farmers through distributors, agents

and sub-agents. Farmers rear these chicks for around four weeks to the maximum six

weeks. Within four weeks, broiler chickens can be sold at weights of 1.2-1.5 kg while

six-week-old chickens are expected to be more than 2.2 kg. Then, farmers sell their

mature chicken to the middlemen at the different levels of wholesalers, retailers and

chicken food processors of value-added product. Finally, consumers consume fresh and

delicious chicken meat from open markets and processors.

Above involvements helps to create employments, involves the poor workers, invites

young entrepreneurs to deal with fragmented business operation, includes various

agents and sub-agents for supplying and distributing poultry feed and chicks. Every

step of the poultry processes are somehow involved with the society in terms of

accommodating people. Accommodating people as business owner, entrepreneur,

worker and some other means is ultimately creating social gains. In this way, poultry

forward operations are keeping tremendous contribution to the society in various

ways.

7.3.2 New Ventures (SME) and Employments

Above discussions is spoken the story of social involvements with the poultry industry

in Bangladesh. Now, table 7.5 revealed the numerical figure (from simulation results) of

233

the number of bakery (new venture), distributing house (new ventures), employments,

ultimate farmers and ground level workers. Young entrepreneurs can establish a small

new venture based on participating in a poultry supply chain operation For instance; a

small bakery can utilize unused eggs where 8-10 thousands of eggs flows from the farm

as raw material for making bakery products. Each bakery can accommodate around 3-6

employees. Yet again, 2000-5000 chicks per week can be distributed through an agent

(middlemen). A sub-dealer can survive by distributing even less than 1500 chicks per

week. In fact, dealers and sub-dealers are also involved with feed selling to the farmers

and act as middlemen of final product of chicken and eggs. This is how; they introduced

themselves as a small business owner with accommodating around ten employees. Like

this, the ultimate farmers' rear day-old chicks as the table 7.5 shows more than four

hundreds farmers can accommodate with such productions. Ultimate farmers are

involving the additional workers if they are rear greater than 2000 birds in a flock.

Practically, small farmers (who rear around 2000 birds) manage their farming by their

own with the help of other family members. If they failed to get help from family

members then they need to involve permanent or part-time workers to manage daily

farming works. Furthermore, more than 1400 workers can be involved throughout this

poultry process while total employment is over two thousands. All of them can

maintain their families by involving with these activities. Therefore, the social impact is

huge in considering managing individual livelihood.

Table 7.5: Social Impacts through Poultry Rearing

Time (Week) 50 100 150 200 250 300

Number of Bakery 62 57 61 60 60 62

Young Entrepreneur 89 84 88 85 86 89

Total Employments 2,489 2,328 2,440 2,407 2,398 2,475

Ultimate Farmer 416 380 407 403 400 414

Worker 1,465 1,349 1,433 1,409 1,408 1,456

The above section describes the forward supply chain process and reveals the

significant parties involved with this chain. The forward supply chain starts from

234

parent stock farming and finishes with chicken consumption. This network maintains

its contribution to society while it processes the product as it flows towards its final

destination. The social gains are specifically concerned with poverty eradication,

employment generation, and entrepreneurship development. Poverty eradication is

accomplished by providing suitable jobs to the poor people. Again, Figure 7.4 presents

the sources of employment generation at various levels of the forward supply chain. As

shown, the levels of parent chicks and mature parent farm, hatchery unit, chicks’

distribution units, broiler farms and middlemen create most of the employment.

Figure 6.10 in chapter 6 also illustrated the simulated behaviour of employment

generation from different sources. The number of bird transactions determines the

ultimate amount of employment creation in the forward supply chain of the poultry

process. Section 7.2.4.1 discusses how employment can be generated from the different

processes of the supply chain. In addition, Figure 7.3 supports a similar understanding

of the mechanism of employment generation. Thus, poultry forward supply chain

process is helping to establish small ventures with thousands of employment

opportunity.

7.3.3 Poverty Alleviation

Poverty is defined as being without capability to possess the basic human needs

including food, water, sanitation, clothing, shelter, health care and education (Uchitelle

2001; INE 2009; Cowell 1995). One of the major goals from research question two was

to detect how poverty could be eradicated through participation in a poultry supply

chain network. Section 7.3.3.2 discusses poverty reduction at different levels of the

poultry supply chain. It was acknowledged in the in-depth interviews that skilled

poultry workers are in tremendous demand much more so than unskilled workers. In

Bangladesh, a daily worker (casual) is paid from BDT 150 to BDT 250 (equivalent to

A$2.15 to A$3.60) per day (Rahman 2013c). A casual poultry worker is paid more than

BDT 350 (A$5) per day which is moderate for a poor worker. Moreover, a full-time

worker is paid on a monthly basis: the minimum monthly payment is around BDT

10,000 with free housing facilities. Permanent workers also enjoy annual and sick leave

on a pro rata basis. Notably, the more experience a poultry worker gains, the more

payment they earn. The case industry has many experienced good workers who receive

lump sum payments of around BDT 30,000 (A$428) per month. The wages paid to the

workers seems like nominal in compare to developed country wages. However, such

235

amount is sufficient enough for them as living expenditure is reasonable in contrast of

advanced countries. In practice, it is possible to accommodate more than fourteen

hundreds people as the skilled, semi-skilled and unskilled workers to maintain their

family with modest lifestyle.

Figure 7.4: Employment from Forward Supply Chain

7.3.4 Summary

Sections 7.2.4.3 and 7.2.4.4 discussed the creation of self-employment and family

ventures. The poultry sector has tremendous scope to expand its operations and

production as per capita chicken and egg consumption is remarkably lower than the

standard level in nearby countries. The protein deficiency in Bangladesh is significantly

greater than expected which has been discussed in chapters 2 and 3. Every new

venture, including self-employment and family businesses, helps to mitigate the

poverty of individuals and groups such as families. This is how; the poultry forward

supply chain is helping to change society in terms of providing social benefits. Social

benefits include eradicating poverty, and creating employment and new entrepreneurs

and ventures which appropriately responds to research question two.

7.4 RESEARCH QUESTION THREE: HOW CAN THE PRINCIPLES OF THE REVERSE

SUPPLY CHAIN (RSC) BE USED TO RECYCLE POULTRY WASTES EFFECTIVELY?

The third research question examined the reverse supply chain (RSC) processes that

recycle poultry wastes thus creating additional by-products for further use. The reverse

Total Employments

Mature Parent Empl Farmers Empl

Hatchery Empl

Middlemen EmplParent Chicks Empl

Chicks Dist Empl

Hatchery

FarmersMature Parent

Parent Chicks

Chicks

Middlemen

236

supply chain is a modern concept which includes the activities of retrieval, utilization of

used or unused products, appropriate disposal, reuse and recycling (Guide and Van

2002; Nagurney 2005; Dowlatshahi 2005, 2000; Kopicki, Berg, and Legg 1993). Most

reverse logistics studies have highlighted reprocessing materials that come back from

customers after a certain period of usage. However, recycling can be a part of the

reverse supply chain (Dowlatshahi 2000, 2005; Tibben-Lembke 2002; Tibben-Lembke

and Rogers 2002; Kopicki, Berg, and Legg 1993; Nagurney 2005; Hoek 1999). All of

these studies have mentioned that recycling work can flow along the reverse chain of a

process. Most of these studies also mentioned recycling after product use. In this study,

the poultry industry has been taken as the case study which involves a live bird and is

therefore a perishable business. It would be difficult to find similarities to product

return after use with chicken products. The logic behind considering the reverse supply

chain is that it can recycle its wastes to convert them into valuable goods. In a sense,

poultry feed is used as intake and wastes come out as output which can also be

compared to the reuse concept. At the same time, wastes from by-product processing

can be used to make other types of products such as fertilizers and firesticks for rural

household usage. Such uses can be compared with typical reverse supply chain theory

of product return and reuse. Obviously, the study claims here that these processes

comprise the poultry reverse supply chain. The next few sections discuss the

effectiveness of usage of poultry wastes in accordance with reverse supply chain (RSC)

principles.

7.4.1 Poultry Litter

The literature on poultry litter has been covered under the section on poultry waste

management in the literature review discussion (see chapter 2). Table 5.11 (see

chapter 5) presented the purpose and calculation of poultry litter from the poultry

process. Chapter 6 (see Figure 6.11) described the simulation model behaviour of

poultry litter and its by-products. Later, section 7.2.5 discussed poultry by-products

and their economic benefits under the sustainability domain. These discussions and

presentations focused on poultry litter and its by-products in order to understand its

value and impact on the farm and society. Figure 7.5 displays the reverse supply chain

process of poultry wastes in which poultry litter makes a significant contribution in

terms of value addition. In this figure, poultry litter processing can be tracked in the

upper-left corner of the split presentation of the integrated poultry supply chain model

(see Figure 5.8 of chapter 5). In the integrated poultry model, poultry litter inflow

237

comes from the maiden source of the mature parent. Broiler farms can be an additional

source of poultry litter as they produce thousands of tonnes of litter. Unfortunately, the

Bangladesh poultry industry still lacks of coordination between the different members

of the supply chain. Such a relational gap hinders the achievement of overall

sustainability. This study suggests forming collaboration between broiler and parent

stock farms so that benefits can be maximized.

Figure 7.5: Poultry Wastes Usage under Reverse Supply Chain Process

7.4.2 Hatchery and Eggs

The hatchery unit deals with hatchable eggs from the parent mother from which day-

old chicks are hatched. Significant numbers of eggs remain unhatched and are rejected

at different stages of the hatching unit process. Chapter 5 (see Table 5.14) described

the purpose and quantifying techniques of unused eggs from the poultry process.

Chapter 6 (see Figure 6.15) depicted the simulation and real behaviour of waste eggs

supplied to bakeries. This particular waste (unused eggs) is shown in Figure 7.4

(positioned in the bottom of the split model). As shown on Figure 7.4, there are three

different sources from where waste eggs flow to bakeries. These three sources are,

Poultry LitterFish Feed Fertilizer

Biogas

Litter for Feed

Litter for Biogas

Litter for Fertilizer

Fish Feed

Conversion

Rate

Biogas Conversion Rate

Fertilizer Conversion Rate

Average Litter Rate

Parent Feather

Parent FeatherCollection Rate

FeatherFeatherCollection

FeatherDumped

Broiler FeatherCollection Rate

<BroilerChicken>

BroilerFeather

Feather Dumpedrate

Time to CollectFeather

Time toCollect<Mature

Parent>

Eggs Per ChickenPer Week

Hatchery

Eggs Hatching

Broken Rate

Unhatched Eggs

Eggs

Supply to

Bakery

Eggs toHatchery

Broken Eggs

Time for Eggs toHatch

Unhatched EggsRate

UnhatchedRate

EggsEggs Produced

Broken Eggs Rate

Hatchery InRate

Eggs Drain out dueto Low Demand

Eggs DrainOut

Eggs DrainRate Fraction Drain

Out

238

namely, broken eggs, unhatched eggs and drained out eggs. Absolutely broken eggs are

supplied to fish farms rather than bakeries due to the hygiene issue. This portion of the

model is an extended version developed by observing real-life practice. The objective of

forming an integrated model was to maximize the benefits from its own sources. In

practice, eggs are supplied to bakeries but the poultry processor never thought to

incorporate such a unit within their operation. This study has highlighted the benefits

that could come from this particular source which needs to be part and parcel of the

poultry supply chain.

Table 7.6: Unused Eggs

Time (Week)

50 100 150 200 250 300

Broken Eggs 24,869 22,985 24,791 24,433 24,142 25,295

Eggs Supply to Bakery

244,731 227,619 242,481 236,779 236,971 247,772

Unhatched Eggs

219,862 204,634 217,690 212,345 212,829 222,476

7.4.3 Poultry Feathers

Poultry feathers are one of the wastes from which valuable by-products can be made.

Unfortunately, a significant quantity of feathers remains unused. Chapter 5 (see Table

5.12) described the purpose and measuring methods for poultry feathers within the

poultry process. Figure 6.13 of chapter 6 showed the simulation and real-life behaviour

of poultry feathers flowing to the third party industry of making beds and pillows.

Poultry feathers are shown in Figure 7.4 above in the top-right side of the split model.

As shown on Figure 6.14 (see chapter 6), a significant quantity of poultry feathers can

be collected from mature parent and broiler birds. This part of the model is also an

extension from real-life practice where a proportion of the total collected feathers is

supplied to bed and pillow producers. Nevertheless, a noteworthy percentage of

feathers is yet to be collected and recycled or reused to receive maximum utility from

it. The bed and pillow industry requires a certain amount of feathers based on their

demand. The case industry collects that amount of feathers and rest remain unplucked

from the poultry birds.

239

Table 7.7: Feather Production

Time (Week) 50 100 150 200 250 300

Feather (KGs) 10,060 9,477 9,874 9,492 9,702 10,002

The integrated model (Figure 5.8) modelled feather collection, the dumped rate and

stock. The result (on Figure 6.13) showed approximately the amount of feathers that

could be collected and used for further processing. Policy makers and poultry owners

can now receive help from this research model which acknowledges the possible

benefits of feather collection. They could establish additional businesses that process

feathers which would bring economic benefits. At the same time, dumping poultry

feathers is hazardous for the environment which could be protected by reusing

feathers. Thus, the current integrated simulation model could assist farmers to quantify

the total collection of feathers so that they can plan to obtain maximum benefits from it

themselves.

7.4.4 Poultry Intestines

Poultry intestines are an almost untouched waste during the poultry process in

Bangladesh. There is a little usage by fish farmers and the rest is dumped into the

environment. In such a way, the environment is being polluted and poultry and human

diseases are carried to the surrounding communities. Figure 6.16 from chapter 6

presented the simulated behaviour of intestine collection from broiler and aged parent

birds. In real practice, above 90% of the intestines are dumped on low-lying land, and

in canals and rivers which is injurious to humans and wildlife (Rahman 2013a). The

integrated poultry supply chain model has extended this object to investigate the

quantity of intestines that could be collected from the poultry operation. By using this

model, policy makers and poultry owners can consider reusing and reprocessing this

valuable waste. If they could use such a large quantity of poultry intestines, farms and

society could benefit in various aspects. At the same time, they could benefit

economically increasing their profitability.

240

Table 7.8: Intestine Production

Time (Week) 50 100 150 200 250 300

Intestine (KGs) 6,200 5,837 6,085 5,853 5,979 6,164

Above discussion of the reverse supply chain and poultry waste management, deep

insight into and an acknowledgment of the opportunities in poultry waste recycling,

reuse and reprocessing have been achieved. Research question three is thus

appropriately answered by the above discussions. In addition, discussions in previous

chapters have also supported the research objectives of the study. Specifically, the

present status of the poultry industry in Bangladesh was discussed in chapter 3. Later,

a sustainable poultry supply chain model was developed in chapter 5. Discussion of this

model covered the qualitative and quantitative aspects of system dynamics (SD). At the

same time, discussions addressed environmental matters within the poultry

production processes in order to manage poultry wastes. The reverse supply chain

along with the environmental issues was reviewed in chapters 2, 3, 6 and 7. The model

was effectively designed as ‘know-how’ and a guideline for poultry waste management

for the sake of protection of the nearby environment while retrieving valuable by-

products for further benefits. Finally, chapters 2, 6 and 7 discussed how to gain

maximum social benefits through structuring the poultry forward chain.

7.4.5 Summary

The main purpose of research question three is to identify the recycle and reuse of

poultry wastes effectively. At the same time, the research looked at the possibility of

creating additional economic and environmental values from the wastes through

making valuable by-products. Section 7.4.1 discussed about poultry litter which is the

most important concern for the poultry farmers. The research model (figure 5.8 of

chapter 5) was shown the opportunities to convert the poultry wastes into valuable

products which can be used in the same industry or to the surrounded farmers and

community. Again, unused farm and hatchery eggs can be established small bakery

industry with further employment opportunity (according to section 7.4.2). At the same

time, wastes procuring are keeping social contribution through establishing small

business with new employment opportunities. Once more, the extended model is

considered poultry feather and intestine that can be used for making valuable by-

241

products of synthetic plastics and fish feed respectively. Last but not the least; poultry

waste management can keep surrounded environment clean and hygiene that is

expected to the farmers for disease management. Therefore, above discussions are

attempted to defend research question three by showing the opportunities to manage

poultry waste management for the sake of availing sustainable benefits.

7.5 SUMMARY

This chapter has provided a discussion on the findings based on the combination of

literature review, simulated behaviour analysis and the integrated poultry supply chain

model. The clarification of the findings has been carried out to support the research

questions. It is acknowledged from the discussion that the real-life poultry supply chain

could achieve sustainability if supply chain members follow the integrated simulation

model (chapter 5). The model can be used to observe the consequences of expansion,

increased and decreased production, calamities and disaster situations, etc.

Importantly, the model could be used to measure the quantity of wastes, by-products

and unused wastes. This information will help the relevant authorities to take

appropriate action on changes needed in their existing supply chain operation. Thus,

this chapter has provided some essential lessons and strategies for the poultry supply

chain in the Bangladesh context. The following chapter provides concluding remarks

and future directions arising from the current research.

242

CHAPTER 8:

CONCLUSIONS AND FUTURE RESEARCH DIRECTIONS

8.1 INTRODUCTION

System dynamics (SD) and the application of simulation modelling techniques are not

easy-going methods for the poultry executives and policy makers of Bangladesh.

System dynamics (SD) has made it possible to model a typical business supply chain

process along with its diverse members and interactions between many key players in

a useful and realistic manner (Maliapen 2003). Once a practical model is developed in a

simulation environment, it is then easy to experiment with various inputs, rates and

scenarios. By observing different scenarios, policy makers can adopt the best changes

into their real business operation. The creation of the poultry simulation model in the

supply chain context has provided insights for decision makers and managers about

far-reaching goals. The first part of this chapter identifies whether the poultry case

industry could use a structured simulation model with SD methodology to implement a

visionary plan, for competitive advantage and for achieving sustainability in light of the

economic, social and environmental benefits. Subsequently, the chapter summarizes

the entire research and highlights the key findings from previous chapters. Relevant

issues revealed during the study, including study limitations and implications for future

research, are identified and recommendations suggested.

8.2 SUMMARY OF THE RESEARCH

The Bangladesh poultry industry has not received much attention from academics and

Bangladesh government policy makers in the years since 1990. Until now, few studies

have been conducted on the basic components of the poultry industry in Bangladesh. In

the earlier literature, discussions were confined to the poultry production system (Das

et al. 2008a, 2008b; Bessei 1993), scavenging backyard farming (Nielsen, Roos, and

Thilsted 2003; Askov H. Jensen 1996), economic and social issues of rural poultry

farming (Guèye 2002; Danish Ministry of Foreign Affairs 2003; Jabbar and Seré 2004;

Fattah 2000) and small poultry model (Dolberg, Mallorie, and Brett 2002; Islam and

Jabbar 2005; Ahmed 2000). In the last two decades, the poultry industry has developed

significantly in terms of its systematic (scientific) production process within a

commercial environment. The poultry industry then started to contribute significantly

243

towards the country’s GDP, directly and indirectly creating increased employment

through millions of jobs, providing social and economic contributions, etc. This was

discussed in chapters 2 and 3. Sustainable poultry production along with structured

supply chain networks has recently been addressed in the contemporary literature.

This particular study is a continuation of the current research trend which intends to

fill the research gap. This study is unique in terms of its development of an integrated

process in which forward and reverse supply chains function together. It was assumed

that such integration would create more opportunities to benefit the economy, society

and environment. This current research has proved the assumptions made at the

beginning of the research in its research questions. The final summary of the existing

research is discussed in the following sections.

Chapter 1 expressed the intention and uniqueness of conducting the present research

based on its importance and the research gap in the current literature and practice. The

focus and scope of the research were discussed in order to understand the boundary of

the present research. Research objectives and questions were stated in the same

section to understand the reasons for the direction of this research. The complete

outline of the thesis, including key terms, was provided to add depth to the discussions.

This particular chapter worked as a guideline for conducting the rest of the research as

well as outlining the construction of the thesis. The relevant literature was next

reviewed in chapter 2 to identify the appropriate research gap. At the same time, the

worthiness and suitability of the current research was discussed in light of the research

gap and future prospects. Continuing this discussion on the literature, chapter 3

described two aspects: the Bangladesh poultry operation and the case industry

operation. To find the answer for the first objective, the discussion was compiled based

on the Bangladesh poultry operation, including products, middlemen, supply chain

networks, contribution to the rural and national economy, typical poultry rearing

systems, calamities and disaster faced by the farmers, etc. In the latter section of this

chapter, the case industry was described in light of its mission, vision, production,

products, supply chains, strategies at times of calamities, and other aspects. This

description introduced the Bangladesh poultry operation and case industry operation

to this thesis. chapter 3 was the foundation for understanding the existing process of

the Bangladesh poultry industry thus making it easier to identify the possible areas that

need to be developed.

244

A rigorous research process was designed to undertake the current research.

Consequently, chapter 4 discussed the research design and process for the current

study. Notably, the current research followed design science methodology under the

positivist paradigm. At the same time, this research employed a system dynamics (SD)-

based quantitative approach to construct and analyse the poultry supply chain model.

The system dynamics (SD) approach combined qualitative (causal loop diagramming)

and quantitative modelling. In qualitative modelling, the causal loop diagram was

developed based on real-life relationships among the variables. Later, the causal

diagram was converted into the quantitative model by adding the necessary stocks

(levels), rates (flows) and auxiliary variables. Complete methodological flowcharts

were discussed in this chapter, which also addressed the issues of reliability and

validity. A research process with such rigorous methodology had not previously

investigated the poultry supply chain in the Bangladesh context.

To answer research question one, the causal loop diagram (qualitative) was developed

in chapter 5. Key variables were identified to build the complete causal model. Later,

the stock and flow model was developed based on the causal diagram model.

Consequently, appropriate rates, formulae and equations were used to run the model in

the virtual world of the simulation environment. In addition, the model was extended

into the field of waste reversal to compare this with real-life poultry supply chain

practice. This is an area to which the study given much emphasis when exploring how

to combine supply chains and achieve sustainable benefits. In addition, the model’s

cause (cause–effect) trees were shown and discussed to perceive the internal

relationship between and among the variables. The term ‘multi-effect condition’ was

used to describe the relationship in which more than one variable was influenced by

and from other variables. The model contained many complex relationships which

involved more than 20 loops and each loop consisted of a number of variables which

influenced one another. Chapter 5 focused on 10 major areas which were discussed one

after another with related equations and formulae. The plotted areas in the model were

discussed which indicated the purposes for their involvement in the model and how

and why they work in real life.

Research is normally tested through results and outcomes from analyses and the

current research is no exception. Most of the simulation-based analyses and results

were presented in chapter 6. In this connection, simulation analysis was used which is a

245

form of analysis mainly focused on behaviour over time for a particular(s) variable(s).

The results were analysed in the aspects of forward, reverse and integrated supply

chains. Key variables were considered to present the behaviour over time for a period

of six years (312 weeks). Within these six years, the first two years’ outputs were

considered in comparison with reality and remaining four years involved projecting

future outputs. To check for structural accuracy, the model was compared with real-life

behaviour for the first two years with real-world data collected from the case industry

to match with model (simulated) data. At the same time, results were examined again

and again for consistency and accuracy to verify the reliability of the model in

comparison with real-life practices. The validity issue was then discussed to prove that

the model was valid in comparison with the real-life process. In addition, the model

was checked under all possible extreme conditions to find the optimum and desired

outputs. The model results responded very well in the context of proving that it was a

valid model. At the same time, sensitivity analyses were conducted to cross-check the

validity and reliability of the model which is important to the modeller. In addition,

sensitivity analysis took place to confirm model robustness and all tests were passed

successfully. To that end, three scenario analyses (see section 6.8) were conducted

based on the goals of policy makers and farmers. All the tests were given expected

outcomes in a situation which was in line with their goals.

The discussion of the results in chapter 7 was based on analyses of all results in the

study and their impact on decision making. Decision making can influence the future

behaviour of the industry. Any logical and substantial changes might be welcomed by

the industry personnel comprised of decision makers and policy makers. The research

questions were responded to in this particular chapter by referring to the main

components of the research model. It was also evident from this discussion about the

kind of positive changes that could be achieved if the model were to be adopted. The

forward supply chain in terms of social changes and the reverse supply chain in terms

of waste management were later discussed. Both these discussions were confined to

the achievement of more economic, social and environmental benefits, which was

named as sustainability. The current research model and its outcomes can be used in

the real supply chain to attain a sustainable poultry production process with

sustainable benefits.

246

8.3 CONTRIBUTIONS OF THE RESEARCH

The findings from this study reveal that this research has made a valuable contribution

to both theoretical and practical points of view. The study has also provided an insight

into the sustainable supply chain process of the Bangladesh poultry industry.

Specifically, the study has successfully integrated both the forward and reverse supply

chains in order to achieve sustainable benefits. The following sections discuss both

contributions.

8.3.1 Theoretical Contributions

The leading theoretical contribution of this study was to develop a system dynamics

(SD)-based integrated supply chain model in the Bangladesh poultry industry. No

evidence to date was found of research conducted on this issue which had considered

both the aspects of forward and reverse supply chains along with the use of DSR and SD

methodology. The model is an extended version of real-life practice which involves

sustainable benefits for the farmers, society and the environment. This extension

incorporated scattered processes into one framework for the sake of better

productivity.

Secondly, the study also contributed by revealing the positive social benefits that could

be achieved through a specific forward supply chain. The forward supply chain consists

of a number of trading partners involved in processing the poultry products of eggs,

day-old chicks and mature chicken. The trade journey between the poultry parent farm

and consumer is associated with various processes of parent farming, hatchery

operation, middlemen activities, broiler farming and distributing mature chicken to

consumers. Within the process, a number of social contributions can be made such as

employment generation, entrepreneur development, poverty reduction and

environmental care for human hygiene and health. This massive interaction between

the poultry process and social benefits had not been dealt with by the previous

research. This specific contribution enriches the relevant theory of the Bangladesh

poultry supply chain.

Thirdly, the study profoundly considered environmental and waste management issues

based on various wastes created from the poultry operation. Bangladesh is a small

country having hundreds of million people living amidst a number of environmental

hazards. The poultry industry is escalating such hazards in various ways by

247

inappropriate dumping of wastes on vacant land and in canals and rivers. This research

has developed a model in which poultry waste management has been considered not

only as a way to reduce environmental degradation but also for economic and social

gains. There are a very few previous research studies that have mentioned waste

processing but no study to date has shown the benefits that can be derived. Obviously,

this particular aspect of the study fills the existing literature gap on the environment,

poultry wastes and sustainability.

Finally, the decision support system (DSS) in a system dynamics (SD)-based simulation

model is an exclusive model that has been developed in order to consider the future

behaviour of the poultry supply chain and its model behaviour. At the same time, a

qualitative system dynamics (SD) model was developed to understand the linkage

between variables for the poultry supply chain. This important diagram can handle

future assumptions regarding facing various calamities and disaster. This model also

explicitly considers calamities and disaster which is an integral part of the poultry

process in Bangladesh. This kind of dynamic model development can track possible

disasters in time to prepare to face them. By doing so, the poultry industry can prevent

economic losses and acquire knowledge on upcoming market trends. Thus, the DSS

based model was examined to enrich the theoretical gap about the ‘things to do’ in an

unpredictable situation.

8.3.2 Practical Contributions

The case parent stock (PS) farm is planning to implement and put into practice the

outcomes of the study. The following sections discuss the study’s specific contributions

for the real-life practice for the poultry industry in Bangladesh.

Firstly, the integrated supply chain model has become the highest priority for the case

industry to implement in their supply chain network. The simulation model is a useful

tool to analyse and track the supply chain variables to measure their performance.

Before putting the model into practice, the industry needs to amend the model based

on its own operational boundaries. In this situation, they may need to hire an expert

with the required knowledge on modelling to operate the simulation model. The

industry can track the possible time-based behaviour of the main products of eggs and

day-old chicks by implementing the research model. Such a facility will help the

industry to achieve sustainable growth.

248

Secondly, the model can be practised in the forward supply chain of the poultry

operation. There are a number of processors involved in the forward chain who make

social contributions in terms of employment, poverty reduction, etc. The model and

study outcomes will help entrepreneurs to develop possible changes in the forward

supply chain which will increase the economic and social contribution to the industry

and society respectively.

Thirdly, implementation based on the research output will help to reduce and reuse

poultry wastes by recycling them to produce valuable by-products. This particular

practice could bring sustainable benefits to farmers, society and the environment.

Previously, the industry was not too concerned about recycling their poultry wastes

with a few exceptions. With this study, they are clear about the recycling processes

under the reverse supply chain which will support them to attain multi-faceted

sustainable benefits.

Fourthly, the industry would be able to practise the standard management of

employment, hatching, distribution and farming through implementing the research

output. The study revealed the standard process units for every processing level which

will assist them to measure the actual requirement. Importantly, appropriate

management will save them costs and time to implement timely and targeted

production.

Finally, the research model can generate production behaviour over time for as many

years as the industry wants to foresee. The decision making will be smooth once the

model is applied in practice. Thus, futuristic assumptions can assist them to prepare for

high and low demand and supply from and to the market, respectively. For example,

the industry can track the high demand and times of disaster so that they can regulate

their production to adjust to the market which is important for the poultry operation.

Most of the time, Bangladeshi poultry farms are victimized due to fluctuations of supply

and demand. More supply at times of low demand will be disastrous for the company.

From this day forwards, the industry can protect against such uncertainties by using

the predicted model behaviour over time for that particular variable.

249

8.4 IMPLICATIONS FOR POULTRY INDUSTRY AND POLICY MAKERS

The implications are derived from the integrated poultry model being adopted to

create a sustainable production process with effective supply chains. The integrated

poultry supply chain can bring more sustainable benefits than what would be achieved

by participating as a fragment of a whole operation. The implications for the case

industry are as follows.

8.4.1 Using Simulation as a Decision-making Tool

The proposed model, which is simulation-based analysis, demonstrated an easy

procedure to select the best alternatives from various conflicting criteria. Using the

simulation tool supported with software applications such as Vensim may help poultry

management to evaluate their decisions more efficiently and effectively as compared to

the traditional method. Simulation is the most updated application to experiment the

real-life case over a computer screen which is very effective. Industry personnel can

simulate their process changing possible values for what they want to implement. The

results will help them to ensure whether or not their goals are acceptable. Outcomes

from the simulation analysis can be compared with the experience of decision makers

providing insight into the differences. Finally, they can conduct sensitivity analysis to

test for different scenarios and the conditions of various problems.

8.4.2 Using System Dynamics as a Decision-making Tool

System dynamics (SD) is challenging tool but is useful in terms of being more

applicable in solving various problems and in more closely reflecting reality. Using

system dynamics as a decision-making tool for problem solving helps the relevant

farms to perceive holistic and dynamic aspects of a problem rather than a static

snapshot. Decision makers and policy makers are able to accommodate more variables,

provide interrelationships among variables, and minimize time delays in problem

solving. Using a structured model simulating key variables can test policies that may be

used as a warning sign to detect unintended outcomes and generally improve system

behaviour.

8.4.3 Decisions Relating to Business Expansion

The simulation model for integrating the poultry supply chain can also assist to

calculate the economic returns. Such economic benefits rely upon the number of birds

that are transacted in a supply chain. The more birds that are transacted in a system,

250

the more chances there are of gaining profits: the risk of losses is higher as well. Profits

and losses depend on successful production and optimum market prices of ultimate

products. The case industry has the vision of increasing their production capacity and

market extension in terms of chicks’ production. Now, they can utilize the model to

perceive alternative tests of increased capacity with fluctuating prices to consider

whether or not expansion will gain addition profits. If it is not profitable, then they

should not reconsider the initiative for expansion: otherwise, expansion should

proceed.

8.4.4 Improvements on Existing Situation

The simulation study can suggest the possible changes needed within an unchanged

situation. This can improve existing process management to achieve better efficiency

with no changes of finance and resources. Sometimes, a company cannot make changes

and undertake expansion even it is worthwhile to do so due to financial inability. In

such circumstances, the company can use a simulation tool to conduct experiments on

existing resources to find out ways to achieve better productivity. For example, the

following things could be addressed:

Managing existing resources for better efficiency and productivity;

Restructuring the relationship between the supply chain members and

stakeholders to gain maximum benefits;

Managing existing risk (calamities and disaster situation) by taking appropriate

measures;

Extending markets through effective relationships with supply chain members;

Forecasting the future market trends through simulated behaviour over time so

that they can prepare themselves for upcoming rises or falls in the market

situation;

Ensuring sustainable benefits in society in terms of creating entrepreneurs,

employment, poverty reduction, social care, etc.;

Maintaining a hygienic environment through timely poultry waste

management;

Measuring the production of economically feasible by-products from poultry

wastes to create economic, social and environmental benefits.

8.5 RESEARCH LIMITATIONS

The limitations of this research comprised constraints in the following matters:

251

Firstly, the simulation model is suitable for the process from the parent stock (PS) farm

through to the broiler chicken consumer. The study did not consider the preceding

breeds of grandparent (GP), great grandparent (GGP) and pure line (pedigree). Thus, it

is sometimes difficult to predict the quantity from the initial parent breeder as there

should be a strong relationship between the number of GGPs and GPs. The number of

GPs will measure the appropriate number of PS. The research considered the parent

breeder as the initial breeder for the model with no link to the preceding breeder other

than assumptions based on the in-depth interviews. Therefore, the model may not

provide accurate forecasting because of the potential dissimilarity in the provision of

input parent chicks.

Secondly, the model was developed according to the available information derived

from in-depth interviews, focus group discussion and observation. Any misleading

information may lead to results that are dissimilar from what they should be. The

standard production guideline from the mother breed company does not match the

Bangladesh perspective due to the involvement of several calamities and disasters. The

current research has taken only a case farm to simulate the model which is slightly

unreliable in authentication of the whole scenario. If it was possible to cross-check with

few companies, then this would potentially be treated as more accurate. However, the

current research has been cross-checked through the observation technique to validate

the information that came from in-depth interviews and focus group discussion.

Thirdly, the research has taken the Bangladesh poultry industry as its field rather than

considering other countries. The model may not work from the perspective of a

different country. For example, the calamities and disasters considered in this model

occur in the Bangladesh context but may have no similarity with other environments.

Lastly, if the poultry industry needs meticulous prediction, accurate information

between the model analyst and stakeholders is a mandatory requirement. Nonetheless,

the current research model and its analyses are useful as straightforward strategies

and policies. They provide knowledge and understanding to support poultry executives

to test models based on input, rates, influenced objects, assumptions, etc. which they

feel fit the proposed industry.

252

8.6 FUTURE DIRECTIONS

The knowledge gained from conducting this research relating to sustainability, supply

chain; simulation and the Bangladesh poultry industry can be further expanded to

address various prospects.

When a simulation model is developed in a specific type of industry for a particular

country, it may not be appropriate for the same operation in another country. However,

the study has taken the first step using a specific environment which can be extended

through incorporating different environments. In disseminating the outcomes of the

current study, more countries might show their interest in incorporating the present

research knowledge into their operation. To do so, the research model needs to be

adjusted based on the prospective supply chain operation to work appropriately. At the

same time, the current research model can be experimented with and utilized by a

similar kind of industry in Bangladesh. To do so, no changes would be incorporated as

the client would have the same pattern of operations as the existing research’s case

industry.

This is the first instance of carrying out this kind of study on Bangladesh and its poultry

parent stock (PS) farms. It would be stimulating to carry out longitudinal research

because long-term research could reveal the true necessity of system dynamics (SD)

applications and whether or not they contribute to the success of policy and decision

making in the same type of industry. Practical benefits through simulation-verified

policy would inspire farmers and policy makers to undertake more research. More

research efforts will definitely help farmers to achieve better productivity while

ensuring maximum sustainable benefits.

The current research is mainly centred on a case parent stock (PS) farm and its supply

chain network. Future research could be directed to each individual supply chain

member on their distinctive operations. If research on distinctive operations could be

conducted for each supply chain member, then every single party of the supply chain

network would be assisted to structure their operation, including ensuring and

forecasting benefits that would arise from their operations.

253

REFERENCES

AAFC. 2012. "Broiler and Hatching Egg Segment of the Industry." In Poultry Marketplace Profile of the Canadian Chicken Industry Canada: Agriculture and Agri-Food Canada.

Abdel-Hamid, Tarek K. 1984. "The Dynamics of Software Development Project Management: An Integrative System Dynamics Perspective." Massachusetts Institute of Technology.

Achilladelis, Basil, and Nicholas Antonakis. 2001. "The Dynamics of Technological Innovation: The Case of the Pharmaceutical Industry." Research Policy 30 (4): 535-588.

ACMF. 2005. Chicken Meat Industry. Australia Government. Accessed 07 September, http://www.chicken.org.au/page.php.

———. 2013. Breeding the Day-Old Meat Chicken. Australian Chicken Meat Federation Inc. Accessed September 05, http://www.chicken.org.au/page.php?id=5#Quarantine.

Acs, Zoltan, and Catherine Armington. 2004. "Employment Growth and Entrepreneurial Activity in Cities." Regional Studies 38 (8): 911-927.

Aghalaya, Sushmita Narayana, Arun A. Elias, and Rupesh K. Pati. 2012. "Analysing Reverse Logistics in the Indian Pharmaceuticals Industry: A Systems Approach." In 26th Australian and New Zealand Academy of Management (ANZAM) Conference 2012 Perth, 1-19.

Ahmad, Nadim, and Richard Seymour. 2008. "Defining Entrepreneurial Activity: Definitions Supporting Frameworks for Data Collection." OECD Statistics Working Paper. http://ssrn.com/abstract=1090372 or http://dx.doi.org/10.2139/ssrn.1090372.

Ahmed, N A. 2000. "The Smallholder Poultry Model in Bangladesh" Network for Smallholder Poultry Development, Copenhagen: http://www.poultry.kvl.dk/.

Akkermans, Henk, Paul Bogerd, and Bart Vos. 1999. "Virtuous and Vicious Cycles on the Road Towards International Supply Chain Management." International Journal of Operations & Production Management 19 (5/6): 565-582.

Akter, Shaheen, and John Farrington. 2007. Sustainability of an Innovation for Poverty Alleviation: The Case of Bangladesh Poultry Model. London.

———. 2008. "Poverty Transition through Targeted Programme: The Case of Bangladesh Poultry Model" 82nd Annual Conference of the Agricultural Economics Society. Royal Agricultural College. UK. http://ageconsearch. umn. edu/bitstream/36765/2/Akter_farrington. pdf (July 8, 2008),

———. 2009. "What Makes Exit from Poverty: Investigation of Smallholder Women Livestock Farmers in Bangladesh." In 2009 Conference organized by International Association of Agricultural Economists, Beijing, China.

Alahari, Karteek, Pushmeet Kohli, and Philip H.S. Torr. 2008. "Reduce, Reuse & Recycle: Efficiently Solving Multi-Label Mrfs" IEEE Conference on Computer Vision and Pattern Recognition (CVPR) IEEE.

Alam, Gazi Mahabubul, Kazi Enamul Hoque, Md Taher Billal Khalifa, Saedah Binti Siraj, and Muhammad Faizal Bin A. Ghani. 2009. "The Role of Agriculture Education

254

and Training on Agriculture Economics and National Development of Bangladesh." Afr. J. Agric. Res 4 (12): 1334-1350.

Alam, J., I. Koike, M. Giasuddin, and M.M. Rahman. 2003. "Seroprevalence of Poultry Diseases in Native Chickens in Bangladesh" 9th Annual Scientific Conference of the Bangladesh Society for Veterinary Education and Research,

Ali, Anwar. 1999. "Climate Change Impacts and Adaptation Assessment in Bangladesh." Climate Research 12 (2-3): 109-116.

Ali, Muhammad Mahboob, and Md. Moulude Hossain. 2012. "Problems and Prospects of Poultry Industry in Bangladesh: An Analysis." Office of research an dpublication. Americal Internation University Bangladesh (AIUB). Dhaka Bangladesh.

Andersen, David F., George P. Richardson, and Jac A.M. Vennix. 1997. "Group Model Building: Adding More Science to the Craft." System Dynamics Review 13 (2): 187-201.

Angerhofer, Bernhard J., and Marios C. Angelides. 2000. "System Dynamics Modelling in Supply Chain Management: Research Review" Simulation Conference, 2000. Proceedings. Winter: IEEE.

Arbab, Mehran, Russell C. Criss, and Larry A. Miller. 1998. "Coated Articles." Google Patents.

Arndt, M. 2005. "Cat Sink Its Claws into Services." Business Week 56-59

Asaduzzaman, M. 2000. "Livestock Sector, Economic Development and Poverty Alleviation in Bangladesh." Changing rural economy of Bangladesh. Bangladesh Economic Association, Dhaka, Bangladesh: 42-53.

Askov H. Jensen. 1996. "Semi-Scavenging Model for Rural Poultry Holding" XX World Poultry Congress, New Delhi

Åstebro, Thomas, and Peter Thompson. 2011. "Entrepreneurs, Jacks of All Trades or Hobos?" Research Policy 40 (5): 637-649.

Avlicino, Aldo Anthony. 2007. Bird Flu: What We Need to Know: Heritage House Publishing Co.

Ayer, Alfred Jules. 1952. Language, Truth & Logic. Vol. 20010: Courier Dover Publications.

Ayres, R. U. 1995. "Life Cycle Analysis: A Critique." Resources, Conservation and Recycling 14: 199-223.

Bader, Pascal. 2008. Sustainability – from Principle to Practice , . Goethe-Institut.

Bailey, Kenneth. 2008. Methods of Social Research: SimonandSchuster. com.

Bakshi, Bhavik R, and Joseph Fiksel. 2003. "The Quest for Sustainability: Challenges for Process Systems Engineering." AIChE Journal 49 (6): 1350-1358.

Balci, Osman. 1994. "Validation, Verification, and Testing Techniques Throughout the Life Cycle of a Simulation Study." Annals of operations research 53 (1): 121-173.

Barlas, Yaman. 1996. "Formal Aspects of Model Validity and Validation in System Dynamics." System Dynamics Review 12 (3): 183-210.

———. 2007. "System Dynamics: Systemic Feedback Modeling for Policy Analysis." SYSTEM 1: 59.

255

Barlas, Yaman, and Ayse Aksogan. 1997. "Product Diversification and Quick Response Order Strategies in Supply Chain Management" International System Dynamics Conference,

Barnett, Michael L. 2007. "Stakeholder Influence Capacity and the Variability of Financial Returns to Corporate Social Responsibility." Academy of Management Review 32 (3): 794-816.

Barratt, Mark. 2004. "Understanding the Meaning of Collaboration in the Supply Chain." Supply Chain Management: An International Journal 9 (1): 30-42.

Barrera-Roldán, Adrián, and Américo Saldıvar-Valdés. 2002. "Proposal and Application of a Sustainable Development Index." Ecological Indicators 2 (3): 251-256.

Bayles, Deborah L., and Hamir Bhatia. 2000. E-Commerce Logistics & Fulfillment: Delivering the Goods: Prentice Hall PTR.

BBS. 2008. "Statistical Yearbook of Bangladesh." Government of Bangladesh.

———. 2009. Statistical Year Book Bangladesh 2009. Dhaka, Bangladesh. www.bbs.gov.bd.

———. 2010. Rural Povery Portal. Accessed 29/03/2012, http://www.ruralpovertyportal.org/web/guest/country/statistics/tags/bangladesh.

Beamon, Benita M. 1999. "Measuring Supply Chain Performance." International Journal of Operations & Production Management 19 (3): 275-292.

Begum, Ismat Ara. 2005. "An Assessment of Vertically Integrated Contract Poultry Farming: A Case Study in Bangladesh." International Journal of Poultry Science 4 (3): 167-176.

Belisle, Peter T. 2011. "Sustainability/Climate Change." Strategic Planning for Energy and the Environment 30 (4): 71-78.

Bernard, H. Russell. 2012. Social Research Methods: Qualitative and Quantitative Approaches: Sage Publications, Incorporated.

Bessei, W. 1993. Lessons from Field Experience on the Development of Poultry Production. FAO Animal Production and Health Paper,

Bhuyian, M.F.A. 2007. Environment-Friendly Poultry Waste Management: Prospect of Organic Fertilizer. Farm House: A monthly Agribusiness Magazine, 35-36.

Biederman, D. 2006. Planning for Happy Returns. Traffic World, 18-21.

Bjerke, Björn. 2007. Understanding Entrepreneurship: Elgar.

Blackburn, Joseph, Daniel V.R. Guide, Luk N.V. Wassenhove, and Gilvan C. Souza. 2004. "Reverse Supply Chains for Commercial Returns." California Management Review 46 (2): 1-20.

Blackburn, William RR. 2012. The Sustainability Handbook:" The Complete Management Guide to Achieving Social, Economic and Environmental Responsibility": Routledge.

Bloomberg, D.J., S. LeMay, and J.B. Hanna. 2002. Logistics. Upper Saddle River, NJ: Prentice-Hall.

Boddington, Michael. 2007. Bangladesh Poultry Sub- Sector Report. Dhaka Bangladesh. www.bangladesh.ideorg.org/images/pdf/sub_sector_report.pdf.

256

Boer, J. De. 2003. "Sustainability Labelling Schemes: The Logic of Their Claims and Their Functions for Stakeholders." Business Strategy and the Environment 12: 254-64.

Bonabeau, Eric. 2002. "Agent-Based Modeling: Methods and Techniques for Simulating Human Systems." Proceedings of the National Academy of Sciences of the United States of America 99 (Suppl 3): 7280-7287.

Bonoma, Thomas V. 1985. "Case Research in Marketing: Opportunities, Problems, and a Process." Journal of marketing research: 199-208.

Bouwer, Anders, Vania Bessa Machado, and Bert Bredeweg. 2002. "Interactive Model Building Environments." The role of communication in learning to model: 155-182.

Bowersox, Donald J. 2011. Supply Chain Logistics Management: Tata McGraw-Hill Education.

Boyazoglu, J. 2002. "Livestock Research and Environmental Sustainability with Special Reference to the Mediterranean Basin." Small Ruminant Research 45: 193-200.

Brito, M.P. De, and Rommert Dekker. 2004. A Framework for Reverse Logistics. Rotterdam, The Netherlands: Springer.

Brodin, M H, and H Anderson. 1998. "Reverse Supply Chains - a New System or Just Reversed Fows: A Discussion Based on a Case Study of Recycled Paper." In Seventh International IPSERA Conference, London, 69-79.

BTI. 2012. Bangladesh Country Report. www.bti-project.de/.../reports/2012/.../BTI%202012%20Bangladesh.

Burak Aksoy, Harry T. Cullinan, Norman E. Sammons Jr, and Mario R. Edenb. 2008. "Poultry Litter Biorefinery Location in Alabama through Minimization of Feedstock Transportation Cost." Environmental Progress 27 (4).

Burns, P. Robert, and R. Robert Stickney. 1980. "Growth of Tilapia Aurea in Ponds Receiving Poultry Wastes." Aquaculture 20 (2): 117-121.

Bushnell, Kristen, Amy Harpster, Sarah Simchuk, Jen Manckia, and Cathy Stevens. 2011. "Reduce, Reuse, Recycle." Utah, USA.

Butler, C.D. 2000. "Global Change Hum." Health 1 156

Büyüközkan, Gülçin, and Çiğdem Berkol. 2011. "Designing a Sustainable Supply Chain Using an Integrated Analytic Network Process and Goal Programming Approach in Quality Function Deployment." Expert Systems with Applications 38 (11): 13731-13748.

Canan, Kocabasoglu, Prahinski Carol, and D. Klassen Robert. 2007. "Linking Forward and Reverse Supply Chain Investments: The Role of Business Uncertainty." Journal of Operations Management 25: 1141-1160.

Carbone, Valentina, and Marcella De Martino. 2003. "The Changing Role of Ports in Supply-Chain Management: An Empirical Analysis." Maritime Policy & Management 30 (4): 305-320.

Carlsson, Bo, Staffan Jacobsson, Magnus Holmén, and Annika Rickne. 2002. "Innovation Systems: Analytical and Methodological Issues." Research policy 31 (2): 233-245.

257

Carson, II, and S. John. 2004. "Introduction to Modeling and Simulation" Proceedings of the 36th conference on Winter simulation: Winter Simulation Conference.

Carter, C.R. 2000a. "Ethical Issues in International Buyer-Supplier Relationships: A Dyadic Examination." Journal of Operations Management 18 (2): 191-208.

———. 2000b. "Precursors of Unethical Behavior in Global Supplier Management." The Journal of Supply Chain Management 36 (1): 45-56

———. 2004. "Purchasing and Social Responsibility: A Replication and Extension." The Journal of Supply Chain Management 40 (4): 4-16

———. 2005. "Purchasing Social Responsibility and Firm Performance: The Key Mediating Roles of Organizational Learning and Supplier Performance." International Journal of Physical Distribution & Logistics Management 35 (3): 177-94.

Carter, C.R., and L.M. Ellram. 1998. "Reverse Logistics: A Review of Literature and Framework for Future Investigation." Journal of Business Logistics 19 (1): 85-102.

Carter, C.R., and M.M. Jennings. 2002a. "Logistics Social Responsibility - an Integrative Framework." Journal of Business Logistics 23 (1): 145-80.

———. 2002b. "Social Responsibility and Supply Chain Relationships." Transportation Research Part E: Logistics and Transportation Review 2002 38 (1): 37-52.

———. 2004. "The Role of Purchasing in Corporate Social Responsibility: A Structural Equation Analysis." Journal of Business Logistics 25 (1): 145-86.

Carter, Craig R., and Dale S. Rogers. 2008. "A Framework of Sustainable Supply Chain Management: Moving toward New Theory." International Journal of Physical Distribution & LogisticsManagement 38 (5): 360-387.

Carter, J.R., B.G. Ferrin, and C.R. Carter. 1995. "The Effect of Less-Than-Truckload Rates on the Purchase Order Lot Size Decision." Transportation Journal 34 (3): 35-44.

Cellier, François E. 1991. "System Dynamics." In Continuous System Modeling, 455-506. Springer.

Chaerul, Mochammad, Masaru Tanaka, and Ashok V Shekdar. 2008. "A System Dynamics Approach for Hospital Waste Management." Waste Management 28 (2): 442-449.

Chambers, D, R Glasgow, and K Stange. 2013. "The Dynamic Sustainability Framework: Addressing the Paradox of Sustainment Amid Ongoing Change." Implement Sci 8 (1): 117.

Chandra, Charu, and Sameer Kumar. 2001. "Enterprise Architectural Framework for Supply-Chain Integration." Industrial Management & Data Systems 101 (6): 290-304.

Chang, Y., and H. Makatsoris. 2001. "Supply Chain Modelling Using Simulation." International Journal of Simulation 2 (1): 24-30.

Charmaz, Kathy. 2006. Constructing Grounded Theory: A Practical Guide through Qualitative Analysis: Pine Forge Press.

Checkland, Peter. 1995. "Soft Systems Methodology and Its Relevance to the Development of Information Systems." In Information Systems Provision: The Contribution of Soft Systems Methodology, 1-17. McGraw-Hill.

258

Chen, Cheng-Nan, Lun-Chung Tzeng, Wei-Ming Ou, and Kai-Ti Chang. 2007. "The Relationship among Social Capital, Entrepreneurial Orientation, Organizational Resources and Entrepreneurial Performance for New Ventures." Contemporary management research 3 (3).

Chen, Injazz J., and Antony Paulraj. 2004. "Towards a Theory of Supply Chain Management: The Constructs and Measurements." Journal of Operations Management 22 119-150.

Chen, Jie, James S. Thorp, and Ian Dobson. 2005. "Cascading Dynamics and Mitigation Assessment in Power System Disturbances Via a Hidden Failure Model." International Journal of Electrical Power & Energy Systems 27 (4): 318-326.

Childerhouse, P., J. Aitken, and D. Towill. 2002. "Analysis and Design of Focused Supply Chain." Journal of Operations Management 20 (6): 675-89.

Chowan, Monoj. 2013. Operation, Production, Process and Hatchery Management of Nahar Agro Complex Limited, February 01, Operation of Nahar Agro Complex Limited, Chittagong, Bangladesh.

Chowdhury, S.D. 2011. "Destablization in the Poultry Industry: Ways to Overcome the Problem." In Discussion on Great Crisis in Poultry Industry and Ways to Overcome the Problem, Dhaka, Bangladesh. Monthly Khamar Bichitra and Bangladesh Poultry Industry Coordination Committee.

Christopher, M.G. 1998. Logistics and Supply Chain Management Strategies for Reducing Costs and Improving Services. London: Pitman Publishing.

Citymayors. 2013. The 150 Richest Cities in the World by Gdp in 2020. Accessed June 12, 2013, http://www.citymayors.com/statistics/richest-cities-2020.html.

Clift, Roland. 1995. "Clean Technology—an Introduction." Journal of Chemical Technology and Biotechnology 62 (4): 321-326.

Cobb, Calvin, Darlene Schuster, Beth Beloff, and Dicksen Tanzil. 2009. "The Aiche Sustainability Index: The Factors in Detail." Chemical Engineering Progress 105 (1): 60.

Cohen, Louis, Lawrence Manion, and Keith Morrison. 2011. Research Methods in Education: Routledge.

Colletti, Joe, Steven Hoff, Janette Thompson, and John Tyndall. 2006. "Vegetative Environmental Buffers to Mitigate Odor and Aerosol Pollutants Emitted from Poultry Production Sites" Proceedings of The Workshop on Agricultural Air Quality: State of Science, Potomac, MD,

Confalonieri, Roberto, and Stefano Bocchi. 2005. "Evaluation of Cropsyst for Simulating the Yield of Flooded Rice in Northern Italy." European Journal of Agronomy 23 (4): 315-326.

Connelly, J. Thomas, and Piman Limpaphayom. 2007. "Environmental Reporting and Firm Performance: Evidence from Thailand." Available at SSRN 955953.

Constance, Douglas H, Francisco Martinez-Gomez, Gilberto Aboites-Manrique, and Alessandro Bonanno. 2013. "The Problems with Poultry Production and Processing." In The Ethics and Economics of Agrifood Competition, 155-175. Springer.

259

Cooper, C.M., M.D. Lambert, and D.J. Pagh. 1997. "Supply Chain Management: More Than a New Name for Logistics." International Journal of Logistics Management 8 (1): 1-9.

Cooper, J., M. Browne, and M. Peters. 1991. European Logistics: Markets, Management and Strategy. Oxford: Blackwell Publishers.

Corbett, C.J., and P.R. Kleindorfer. 2003. "Environmental Management and Operations Management: Introduction to the Third Special Issue." Production and Operations Management 12 (3): 287–289.

Coulthard, Sarah, Derek Johnson, and J. Allister McGregor. 2011. "Poverty, Sustainability and Human Wellbeing: A Social Wellbeing Approach to the Global Fisheries Crisis." Global Environmental Change 21 (2): 453-463.

Council, Supply-Chain. 1999. Supply-Chain Council: The Council.

Courtney, James F. 2001. "Decision Making and Knowledge Management in Inquiring Organizations: Toward a New Decision-Making Paradigm for Dss." Decision Support Systems 31 (1): 17-38.

Cowell, Frank Alan. 1995. Measuring Inequality. Vol. 22: Prentice Hall/Harvester Wheatsheaf London.

Cox, J.F., J.H. Blackstone, and M.S. Spencer. 1995. "Apics Dictionary (8th Ed.)." Falls Church, VA: American Production and Inventory Control Society.

Coyle, R. Geoffrey. 1985. "The Use of Optimization Methods for Policy Design in a System Dynamics Model." System Dynamics Review 1 (1): 81-91.

———. 1996. System Dynamics Modelling: A Practical Approach. Vol. 1: Chapman & Hall/CRC.

———. 2000. "Qualitative and Quantitative Modelling in System Dynamics: Some Research Questions." System Dynamics Review 16 (3): 225-244.

Crane, A. 2000. "Marketing and the Natural Environment: What Role for Morality?" Journal of Macro Marketing 20 (2): 144-54.

Crawford, Roy D. 1990. Poultry Breeding and Genetics: Elsevier.

Cresswell, J.W. 2003. Research Design: Quantitative, Qualitative & Mixed Method Approaches. United States: Sage publication.

Croom, S. 2000. "Supply Chain Management: An Analytical Framework for Critical Literature Review." European journal of purchasing & supply management 6 (1): 67.

Croom, Simon, Pietro Romano, and Mihalis Giannakis. 2000. "Supply Chain Management: An Analytical Framework for Critical Literature Review." European journal of purchasing & supply management 6 (1): 67-83.

Daily, B.F., and S. Huang. 2001. "Achieving Sustainability through Attention to Human Resource Factors in Environmental Management." International journal of operations & production Management 21 (12): 1539-52.

Daily, Gretchen C., and Paul R. Ehrlich. 1992. "Population, Sustainability, and Earth's Carrying Capacity." BioScience 42 (10): 761-771.

Dailystar. 2012. "Chittagong- a Port City of Bangladesh." The Daily Star, January 25. http://www.thedailystar.net/newDesign/latest_news.php?nid=26161.

260

Daly, H.E. 1994. For the Common Good. Boston: Beacon Press.

Daniel, Stavros E., Costas P. Pappis, and Theodore G. Voutsinas. 2003. "Applying Life Cycle Inventory to Reverse Supply Chains: A Case Study of Lead Recovery from Batteries." Resources, conservation and recycling 37 (4): 251-281.

Danish Ministry of Foreign Affairs. 2003. "Empowerment of Farmers through the Agricultural Sector Programme Support with Specific Reference to the Village Poultry Production in Bangladesh." In Technical Seminar at Hotel Frederiksdal, Denmark. Policy and Planning Support Unit Ministry of Fisheries and Livestock, Dhaka, Bangladesh.

Das, S.C., S.D. Chowdhury, M.A. Khatun, M. Nishibori, N. Isobe, and Y. Yoshimura. 2008a. "Poultry Production Profile and Expected Future Projection in Bangladesh." World's Poultry Science Journal 64 (01): 99-118. doi: doi:10.1017/S0043933907001754.

———. 2008b. "Small-Scale Family Poultry Production." World's Poultry Science Journal 64: 99-118.

Daugherty, P. J., C. W. Autry, and A. E. Ellinger. 2001. "Reverse Logistics: The Relationship between Resource Commitment and Program Performance." Journal of Business Logistics 22 (1): 107- 123.

Daugherty, Patricia J., Matthew B. Myers, and R. Glenn Richey. 2002. "Information Support for Reverse Logistics: The Influence of Relationship Commitment." Journal of Business Logistics 23 (1): 85-106.

Daugherty, Patricia J., R. Glenn Richey, Stefan E. Genchev, and Haozhe Chen. 2005. "Reverse Logistics: Superior Performance through Focused Resource Commitments to Information Technology." Transportation Research Part E: Logistics and Transportation Review 41 (2): 77-92.

Davis, Justin L, R Greg Bell, G Tyge Payne, and Patrick M Kreiser. 2010. "Entrepreneurial Orientation and Firm Performance: The Moderating Role of Managerial Power." American Journal of Business 25 (2): 41-54.

Davis, Kingsley. 1990. "Population and Resources: Fact and Interpretation." Population and Development Review 16: 1-21.

Dean, Thomas J., and Jeffery S. McMullen. 2007. "Toward a Theory of Sustainable Entrepreneurship: Reducing Environmental Degradation through Entrepreneurial Action." Journal of Business Venturing 22 (1): 50-76.

Deaton, Michael L., and James J. Winebrake. 2000. Dynamic Modeling of Environmental Systems: Springer Verlag.

Dees, J. Gregory. 1998. "The Meaning of Social Entrepreneurship." Comments and suggestions contributed from the Social Entrepreneurship Funders Working Group, 6pp.

Defee, C. Clifford, Terry Esper, and Diane Mollenkopf. 2009. "Leveraging Closed-Loop Orientation and Leadership for Environmental Sustainability." Supply Chain Management: An International Journal 14 (2): 87-98.

Dekker, R., M. Fleischmann, K. Inderfurth, and L.N. Van Wassenhove. 2004. Revere Logistics: Quantitative Models for Closed-Loop Supply Chains. Berlin: Springer.

Dennis, M.J., and A. Kambil. 2003. "Service Management: Building Profits after the Sale." Supply Chain Management Review January/February: 42-48.

261

Denzin, Norman K., and Yvonna S. Lincoln. 2011. The Sage Handbook of Qualitative Research: SAGE Publications, Incorporated.

DEPI. 2013. Structure of Victoria’s Chicken Meat Industry. Department of Environment and Primary Industries, Victoria, Australia. Accessed November 2, 2013, http://www.dpi.vic.gov.au/agriculture/animals-and-livestock/Poultry/poultry-management/chicken-meat-industry.

Deublein, Dieter, and Angelika Steinhauser. 2011. Biogas from Waste and Renewable Resources: An Introduction: Wiley. com.

Dewick, P., C. Foster, and K. Green. 2007. "Technological Change and the Environmental Impacts of Food Production and Consumption: The Case of the Uk Yogurt Industry." Journal of Industrial Ecology 11: 133-146.

Diesendorf, Mark. 2000. "Sustainability and Sustainable Development." Sustainability: The corporate challenge of the 21st century: 19-37.

Dill, M. 1997. "Capital Investment Cycles: A System Dynamics Modelling Approach to Social Theory Development" 15th International System Dynamics Conference:" Systems Approach to Learning and Education into the 21st Century", Istanbul, Turkey,

Disney, Stephen M., and Denis R. Towill. 2003. "The Effect of Vendor Managed Inventory (Vmi) Dynamics on the Bullwhip Effect in Supply Chains." International journal of production economics 85 (2): 199-215.

Dolberg, Frands. 2001. "A Livestock Development Approach That Contributes to Poverty Alleviation and Widespread Improvement of Nutrition among the Poor." Livestock Research for Rural Development 13 (5).

———. 2004. Review of Household Poultry Production as a Tool in Poverty Reduction with Focus on Bangladesh and India. Edited by Vinod Ahuja, Livestock and Livelihoods: Challenges and Opportunities for Asia in the Emerging Market Environment, , and Pro-Poor Livestock Policy Facility (South Asia Hub) of Fao. India: National Dairy Development Board.

———. 2008. Bangladesh Poultry Sector Country Review. Rome, Italy: FAO Animal Prodcution and Health Division.

Dolberg, Frands, Edward Mallorie, and Nigel Brett. 2002. "Evolution of the Poultry Model - a Pathway out of Poverty" People Fight Poverty with Poultry. Learning from the Bangladesh Experience, Bangladesh: IFAD publications.

Dowlatshahi, S. 2000. "Developing a Theory of Reverse Logistics." Interfaces 30 (3): 143.

———. 2005. "A Strategic Framework for the Design and Implementation of Remanufacturing Operations in Reverse Logistics." International journal of production research 43 (16): 3455.

Doyle, James K., and David N. Ford. 1998. "Mental Models Concepts for System Dynamics Research." System dynamics review 14 (1): 3-29.

Drumwright, M.E. 1994. "Socially Responsible Organizational Buying: Environmental Concern as a Noneconomic Buying Criterion." Journal of Marketing 58 (3): 1-19.

Dwivedi, YK. 2007. Consumer Adoption and Usage of Broadband. NY: IRM Press.

Dyckhoff, H. 2004. Supply Chain Management and Reverse Logistics. Berlin: Springer.

262

Dyer, Jeffrey H., and Wujin Chu. 2003. "The Role of Trustworthiness in Reducing Transaction Costs and Improving Performance: Empirical Evidence from the United States, Japan, and Korea." Organization science 14 (1): 57-68.

Dyllick, Thomas, and Kai Hockerts. 2002. "Beyond the Business Case for Corporate Sustainability." Business strategy and the environment 11 (2): 130-141.

Eberlein, Robert. 2003. "Vensim 5.1 Reference Manual." Ventana Systems.

Eberlein, Robert L., and David W. Peterson. 1992. "Understanding Models with Vensim™." European journal of operational research 59 (1): 216-219.

EC. 2006. Environmental Impact of Products (Eipro): Analysis of the Life Cycle Environmental Impacts Related to the Final Consumption of the Eu-25. Seville.

———. 2011. Pilot Reference Document on Best Environmental Management Practice in the Retail Trade Sector. Seville Spain. http://susproc.jrc.ec.europa.eu/activities/emas/documents/Final_Draft_Merged_21_June_2011.pdf.

Eden, Colin. 1994. "Cognitive Mapping and Problem Structuring for System Dynamics Model Building." System Dynamics Review 10 (2‐3): 257-276.

Edwards, D.R., and T.C. Daniel. 1992. "Environmental Impacts of on-Farm Poultry Waste Disposal-a Review." Bioresource Technology 41 (1): 9-33.

EFeedlink. 2011. Bangladesh's Local Poultry Farms Face Uneven Competitions. eFeedlink. Accessed August 21, 2013, http://www.efeedlink.com/contents/12-27-2011/d7b329ca-3a0a-4fdd-b2d1-b21432497679-a181.html.

Effedlink. 2012. Bangladesh Day Old Chicks (Doc) Production Significantly Drops. efeedlink. Accessed January 28, 2013, http://www.efeedlink.com/contents/10-26-2012/b50a09dd-ddbd-4d8a-9c25-8a241ff39d03-d182.html.

Eisenhardt, Kathleen M, and Jeffrey A Martin. 2000. "Dynamic Capabilities: What Are They?" Strategic management journal 21 (10-11): 1105-1121.

El-Boushy, Adel RY, and AFB Poel. 1994. Poultry Feed from Waste: Processing and Use: Chapman & Hall Ltd.

Elfasakhany, A., A. Arrieta, D.M. Ramírez, and F. Rodríguez. 2001. "Design and Development of an Autonomous Trash Sorting System, in, 'Pm's Advisor Hails Recycling as Climate Change Action'. Letsrecycle.Com. 2006-11-08. Retrieved 2010_06-19." GJ P&A Sc and Tech. 01i2: 56-64.

Elias, Arun Abraham. 2010. "Environmental Conflicts, Stakeholders and a Shared Mental Model." In System Dynamics Conference, USA. System Dynamics. http://www.systemdynamics.org/conferences/2006/proceed/papers/ELIAS131.pdf.

Elkington, John. 1994. "Towards the Sustainable Corporation: Win-Win-Win Business Strategies for Sustainable Development." California Managemnet Review 36 (2): 90-100.

———. 1998. Cannibals with Forks: The Triple Bottom Line of the 21st Century Business. Vol. Reprint 2002. Stoney Creek, CT.: New Society Publishers.

———. 2004a. "Enter the Triple Bottom Line." The triple bottom line: Does it all add up: 1-16.

263

———. 2004b. "Enter the Triple Bottom Line in Henriques, A. And Richardson, J. (Eds); the Triple Bottom Line: Does It All Add Up?" Earthscan: 1-16.

Ellram, L., and M. Cooper. 1993. "Characteristics of Supply Chain Management and the Implications for Purchasing and Logistics Strategy." International Journal of Logistics Management 4 (2): 1-10.

Elshorbagy, Amin, A. Jutla, and J. Kells. 2007. "Simulation of the Hydrological Processes on Reconstructed Watersheds Using System Dynamics." Hydrological Sciences Journal 52 (3): 538-562.

Epstein, Marc J. 2008. Making Sustainability Work: Best Practices in Managing and Measuring Corporate Social, Environmental, and Economic Impacts: Berrett-Koehler Store.

Erickson, Frederick. 1985. Qualitative Methods in Research on Teaching: Institute for Research on Teaching.

Erkoc, Murat, Eleftherios T. Iakovou, and Andre E. Spaulding. 2005. "Multi-Stage Onboard Inventory Management Policies for Food and Beverage Items in Cruise Liner Operations." Journal of Food Engineering 70 (3): 269-279.

Erlich, P.R., and A.H. Erlich. 1991. The Population Explosion. New York, NY: Touchstone.

Erol, Ismail, Meltem Nurtanis Velioglu, Funda Sivrikaya Serifoglu, Duzce University Duzce, Gulcin Buyukozkan, Necati Aras, Nigar Demircan Cakar, and Aybek Korugan. 2010. "Exploring Reverse Supply Chain Management Practices in Turkey." Supply Chain Management: An International Journal 15 (1): 43-54.

Fabbe-Costes, Nathalie, Christine Roussat, and Jacques Colin. 2011. "Future Sustainable Supply Chains: What Should Companies Scan?" International Journal of Physical Distribution & Logistics Management 41 (3): 228-252.

Fairclough, Norman. 2003. Analysing Discourse: Textual Analysis for Social Research: Routledge.

Falconer, K., and I. Hodge. 2001. "Pesticide Taxation and Multi-Objective Policy-Making: Farm Modelling to Evaluate Profit/Environment Trade-Offs." Ecological Economics 36: 263-279.

Fattah, Kazi Abdul. 2000. " “Poultry as a Tool in Poverty Eradication and Promotion of Gender Equality” In: F Dolberg and P H Petersen (Eds) Poultry as a Tool in Poverty Eradication and Promotion of Gender Equality." In Proceedings of a workshop, Landboskole, Denmark.

Fawcett, Stanley E., Gregory M. Magnan, and Matthew W. McCarter. 2008. "Benefits, Barriers, and Bridges to Effective Supply Chain Management." Supply Chain Management: An International Journal 13 (1): 35-48.

Ferguson, Mark W.J., and Ted Joanen. 1982. "Temperature of Egg Incubation Determines Sex in Alligator Mississippiensis."

Ferrer, Geraldo, and D Clay Whybark. 2000. "From Garbage to Goods: Successful Remanufacturing Systems and Skills." Business Horizons 43 (6): 55-64.

Ferrer, Geraldo, and D Clay Whybark. 2001. "The Economics of Remanufacturing. Business Aspects of Closed-Loop Supply-Chains: Exploring the Issues" Proceedings of the Carnegie Bosch Institute International Conference on Closed-Loop Supply-Chains,

Fiala, Petr. 2005. "Information Sharing in Supply Chains." Omega 33 (5): 419-423.

264

Field, Joy M., and Robert P. Sroufe. 2007. "The Use of Recycled Materials in Manufacturing: Implications for Supply Chain Management and Operations Strategy." International Journal of Production Research 45 (18/19): 4439-4463. doi: 10.1080/00207540701440287.

Fleischmann, M. 2000. "Quantitative Models for Reverse Logistics." Erasmus University, Netherlands.

Fleischmann, M., P. Beullens, J.M. Bloemhof-Ruwaard, and L.N. Van Wassenhove. 2001. "The Impact of Product Recovery on Logistics Network Design." Production and Operations Management 10 (2): 156-173.

Fleischmann, Moritz, Jacqueline M Bloemhof-Ruwaard, Rommert Dekker, Erwin Van Der Laan, Jo AEE Van Nunen, and Luk N Van Wassenhove. 1997. "Quantitative Models for Reverse Logistics: A Review." European journal of operational research 103 (1): 1-17.

Fleischmann, Moritz, Jo Van Nunen, Ben Gräve, and Rainer Gapp. 2005. Reverse Logistics: A Capturing Value in the Extended Supply Chain, Supply Chain Management on Demand. Berlin Heidelberg: Springer.

Fleischmann, Mortiz, Hans Ronald Krikke, Rommert Dekker, and Simme Douwe P. Flapper. 2000. "A Characterisation of Logistics Networks for Product Recovery." Omega 28 (6): 653-666.

Folch-Lyon, Evelyn, and John F. Trost. 1981. "Conducting Focus Group Sessions." Studies in family planning: 443-449.

Ford, A., and H.W. Lorber. 1977. "Methodology for the Analysis of the Impacts of Electric Power Production in the West." NASA STI/Recon Technical Report N 77: 31428.

Forrester, Jay W. 1987. "Lessons from System Dynamics Modeling." System Dynamics Review 3 (2): 136-149.

———. 1994a. "Learning through System Dynamics as Preparation for the 21st Century" Keynote Address for Systems Thinking and Dynamic Modelling Conference for K-12 Education,

Forrester, Jay W. 1958. "Industrial Dynamics: A Major Breakthrough for Decision Makers." Harvard Business Review 36 (4): 37-66.

———. 1961. Industrial Dynamics. Cambridge (MA): The MIT Press.

———. 1968. "Principle of System, Ma." Wright Allen Press.

———. 1969. Urban Dynamics. USA.

———. 1971a. "Counterintuitive Behavior of Social Systems." Theory and Decision 2 (2): 109-140.

———. 1971b. World Dynamics, Wright, Ln, Cambridge.

———. 1980. "Information Sources for Modeling the National Economy." Journal of the American Statistical Association 75 (371): 555-566.

———. 1994b. "System Dynamics, Systems Thinking, and Soft Or." System Dynamics Review 10 (2).

Forrester, Jay W., A. Graham, P. M. Senge, and J. D. Sterman. 1983. "An Integrated Approach to the Economic Long Wave" Position Papers for Conference on Long Waves. Depression and Innovation,

265

Forrester, Jay W., and P.M. Senge. 1980. "Tests for Building Confidence in System Dynamics Models." TIMS Studies in Management Sciences 14: 209-228.

France, Robert, and Bernhard Rumpe. 2007. "Model-Driven Development of Complex Software: A Research Roadmap" 2007 Future of Software Engineering: IEEE Computer Society.

Freytag, Andreas, and Roy Thurik. 2010. Entrepreneurship and Its Determinants in a Cross-Country Setting: Springer.

Friedman, Milton. 2007. The Social Responsibility of Business Is to Increase Its Profits: Springer.

Frosch, R.A., and N.E. Gallopoulos. 1989. "Strategies for Manufacturing." Scientific American 261 (3): 94–102.

Fuente, M Victoria de la, Lorenzo Ros, and Angel Ortiz. 2010. "Enterprise Modelling Methodology for Forward and Reverse Supply Chain Flows Integration." Computers in Industry 61 (7): 702-710.

Fuente, M Victoria de la, Lorenzo Rosa, and Manuel Cardos. 2008. "Integrating Forward and Reverse Supply Chains: Application to a Metal-Mechanic Company." International Journal of Production Economics 111: 782-792.

Gadde, Syam, Michael Rabinovich, and Jeff Chase. 1997. "Reduce, Reuse, Recycle: An Approach to Building Large Internet Caches" Operating Systems, 1997., The Sixth Workshop on Hot Topics in: IEEE.

Galliers, RD. 1993. "Research Issues in Information Systems." Journal of Information Technology 8 (2): 92-98.

Galliers, Robert D. 1992. "Choosing Appropriate Information Systems Research Approaches: A Revised Taxonomy."

Georgiadis, Patroklos, and Maria Besiou. 2008. "Sustainability in Electrical and Electronic Equipment Closed-Loop Supply Chains: A System Dynamics Approach." Journal of Cleaner Production 16 (15): 1665-1678.

Georgiadis, Patroklos, Dimitrios Vlachos, and Eleftherios Iakovou. 2005. "A System Dynamics Modeling Framework for the Strategic Supply Chain Management of Food Chains." Journal of Food Engineering 70: 351-364.

Gerbens-Leenes, PW, S Nonhebel, and MS Krol. 2010. "Food Consumption Patterns and Economic Growth. Increasing Affluence and the Use of Natural Resources." Appetite 55 (3): 597-608.

Gerring, John. 2007. Case Study Research: Principles and Practices: Cambridge University Press Cambridge.

Gertsakis, John, and Helen Lewis. 2003. "Sustainability and the Waste Management Hierarchy." Retrieved on January 30: 2008.

Giasuddin, M., BK Sil, J. Alam, I. Koike, M.R. Islam, and M.M. Rahman. 2002. "Prevalence of Poultry Diseases in Bangladesh." Journal of Biological Sciences 2 (4): 212-213.

Gibson, L. , R. Kingwell, and G. Doole. 2008. "The Role and Value of Eastern Star Clover in Managing Herbicide-Resistant Crop Weeds: A Wholefarm Analysis." Agricultural Systems 98: 199-207.

Gillespie, James R., and Frank Bennie Flanders. 2010. Modern Livestock and Poultry Production: CengageBrain. com.

266

Ginter, P.M., and J.M. Starling. 1978. "Reverse Distribution Channels for Recycling." California Management Review 20 (3): 72-82.

Giudini, R. 1996. "An Introduction to Reverse Logistics for Environmental Management: A New System to Support Sustainability and Profitability." Total Quality Environmental Management 5 (3): 81-87.

Gladwin, T.N., J.J. Kennelly, and T. Krause. 1995. "Shifting Paradigms for Sustainable Development: Implications for Management Theory and Research." Academy of Management Review 20 (4): 874-907.

Go´ncz, E., U. Skirke, H. Kleizen, and M. Barber. 2007. "Increasing the Rate of Sustainable Change: A Call for a Redefinition of the Concept and the Model for Its Implementation." Journal of Cleaner Production 15 (6): 525-37.

GOB, Government of the People’s Republic of Bangladesh. 2007. National Livestock Development Policy. Dhaka, Bangladesh. http://www.mofl.gov.bd/pdf/Livestock_%20Policy_Final.pdf.

———. 2009. Ministry of Commerce Report. Dhaka, Bangladesh. http://www.mincom.gov.bd/index.php?page_id=272.

Göl, Hakan, and Bülent Çatay. 2007. "Third-Party Logistics Provider Selection: Insights from a Turkish Automotive Company." Supply Chain Management: An International Journal 12 (6): 379-384.

Goodland, Robert, and Herman Daly. 1996. "Environmental Sustainability: Universal and Non-Negotiable." Ecological Applications: 1002-1017.

GOWA, Government of Western Australia. 2004. Environmental Code of Practice for Poultry Farms in Western Australia. Perth, WA, Australia. http://www.water.wa.gov.au/PublicationStore/first/47509.pdf.

Graham, Alan K. 1980. "Parameter Estimation in System Dynamics Modeling." Elements of the system dynamics method: 143-161.

Greenland, Sander. 1987. "Quantitative Methods in the Review of Epidemiologic Literature." Epidemiologic reviews 9 (1): 1-30.

Greenland, Sander, and William D. Finkle. 1995. "A Critical Look at Methods for Handling Missing Covariates in Epidemiologic Regression Analyses." American journal of epidemiology 142 (12): 1255-1264.

GRI, Global Reporting Initiative. 2009. "What Is Sustainability Reporting." Retrieved August 14: 2009.

Grönroos, Christian. 1997. "Value‐Driven Relational Marketing: From Products to Resources and Competencies." Journal of marketing management 13 (5): 407-419.

Guèye, E.F. 2002. "Employment and Income Generation through Family Poultry in Low-Income Food-Deficit Countries." World's poultry science journal 58 (4): 541.

Guide, V. Daniel R. 2006. "Time Value of Commercial Product Returns." Management Science 52 (8): 1200.

Guide, V. Daniel R., and L.N. Wassenhove Van. 2002. "The Reverse Supply Chain." Harvard Business Review 80 (2): 25-26.

267

Guide, V. Daniel R., and L.N. Van Wassenhove. 2006. "Closed-Loop Supply Chains: An Introduction to the Feature Issue (Part 1)." Production and Operations Management 15 (3): 345-350.

Guide, V. Daniel R., and Luk N. Van Wassenhove. 2003. Business Aspects of Close-Loop Supply Chains. Pittsburgh: Carnegie-Bosch Institute.

Guide, V. Daniel R., and Luk N.V. Wassenhove. 2001. "Managing Product Returns for Remanufacturing." Production and Operations Management 10 (2): 142-155.

Guion, Lisa A., David C. Diehl, and Debra McDonald. 2011. Conducting an in-Depth Interview.

Gunasekaran, Angappa, C Patel, and Ronald E McGaughey. 2004. "A Framework for Supply Chain Performance Measurement." International journal of production economics 87 (3): 333-347.

Gwin, Lauren, Arion Thiboumery, and Richard Stillman. 2013. Local Meat and Poultry Processing. http://www.ers.usda.gov/media/1131316/err-150.pdf.

Hacking, Theo, and Peter Guthrie. 2008. "A Framework for Clarifying the Meaning of Triple Bottom-Line, Integrated, and Sustainability Assessment." Environmental Impact Assessment Review 28 (2): 73-89.

Hall, Jeremy K., Gregory A. Daneke, and Michael J. Lenox. 2010. "Sustainable Development and Entrepreneurship: Past Contributions and Future Directions." Journal of Business Venturing 25 (5): 439-448.

Hancock, Graham. 1992. Lords of Poverty: The Power, Prestige, and Corruption of the International Aid Business: Atlantic Monthly Press.

Handfield, R B. 1999. Introduction to Supply Chain Management.

Hansen, Jan E., and Peter Bie. 1987. "Distribution of Body Fluids, Plasma Protein, and Sodium in Dogs: A System Dynamics Model." System dynamics review 3 (2): 116-135.

Harris, Chris. 2013. Importance of Sustainability Growing for Food Industry. The Poultry Site.

Hart, S.L. 1995. "A Natural-Resource-Based View of the Firm." Academy of Management Review 20 (4): 986-1014.

Hart, Stuart L. 2008. "Beyond Greening." Environmental Management: Readings and Cases: 1.

Hasan, H. 2003. "Information Systems Development as a Research Method." Australian Journal of Information Systems 11 (1): 4-12.

Hawks, Karen. 2006. "Vp Supply Chain Practice, Navesink." In Reverse Logistics Magazine.

Heck, Ramona K.Z., and Kathryn Stafford. 2001. "The Vital Institution of Family Business: Economic Benefits Hidden in Plain Sight." Destroying myths and creating value in family business: 9-17.

Heijungs, Reinout, Gjalt Huppes, and Jeroen B Guinée. 2010. "Life Cycle Assessment and Sustainability Analysis of Products, Materials and Technologies. Toward a Scientific Framework for Sustainability Life Cycle Analysis." Polymer Degradation and Stability 95 (3): 422-428.

268

Henriques, A., and J. Richardson. 2004. The Triple Bottom Line: Does It All Add Up? London: Earthscan.

Henriques, Irene, and Perry Sadorsky. 1999. "The Relationship between Environmental Commitment and Managerial Perceptions of Stakeholder Importance." Academy of management Journal 42 (1): 87-99.

Hertel, Thomas W. 1999. Global Trade Analysis: Modeling and Applications: Cambridge university press.

Hevner, A., S. March, J. Park, and S Ram. 2004. "Design Science in Information Systems Research." MIS Quarterly 28: 75-105.

Hevner, Alan, and Samir Chatterjee. 2010. Design Science Research in Information Systems. Vol. 22, Integrated Series in Information Systems,: 2010, Volume 22, 9-22, DOI:.

Higuchi, Toru, and Marvin D. Troutt. 2004. "Dynamic Simulation of the Supply Chain for a Short Life Cycle Product—Lessons from the Tamagotchi Case." Computers & Operations Research 31 (7): 1097-1114.

Hill, Jason, Erik Nelson, David Tilman, Stephen Polasky, and Douglas Tiffany. 2006. "Environmental, Economic, and Energetic Costs and Benefits of Biodiesel and Ethanol Biofuels." Proceedings of the National Academy of Sciences 103 (30): 11206-11210.

Hill, M.R. 2001. "Sustainability, Greenhouse Gas Emissions, and International Operations Management." International Journal of Operations & Production Management, 21 (12): 1503-20.

Hinrichs, C Clare, and Rick Welsh. 2003. "The Effects of the Industrialization of Us Livestock Agriculture on Promoting Sustainable Production Practices." Agriculture and Human Values 20 (2): 125-141.

Hjorth, Peder, and Ali Bagheri. 2006. "Navigating Towards Sustainable Development: A System Dynamics Approach." Futures 38 (1): 74-92.

Hocking, P. 2009. Biology of Breeding Poultry. Wallingford: CAB International. http://CURTIN.eblib.com.au/patron/FullRecord.aspx?p=435010.

Hoek, R. Van, and P. Chapman. 2006. "From Tinkering around the Edge to Enhancing Revenue Growth: Supply Chain-New Product Development." Supply Chain Management: An International Journal 11 (5): 385-9.

———. 2007. "How to Move Supply Chain Beyond Cleaning up after New Product Development." Supply Chain Management: An International Journal 12 (4): 239-44.

Hoek, R.I. Van. 1999. "From Reversed Logistics to Green Supply Chains." Supply Chain Management 4 (3): 129.

Hoffman, A.J. 2000. Competitive Environmental Management: A Guide to the Changing Business Landscape. Washington DC: Island Press.

Homer, Jack B. 1996. "Why We Iterate: Scientific Modeling in Theory and Practice." System Dynamics Review 12 (1).

Homer, Jack B., and Christian L St Clair. 1991. "A Model of Hiv Transmission through Needle Sharing." Interfaces 21 (3): 26-49.

269

Homer, Jack, and Rogelio Oliva. 2001. "Maps and Models in System Dynamics: A Response to Coyle." System Dynamics Review 17 (4): 347-355.

Honig, Benson. 1998. "What Determines Success? Examining the Human, Financial, and Social Capital of Jamaican Microentrepreneurs." Journal of Business Venturing 13 (5): 371-394.

Hovelaque, Vincent, Sabine Duvaleix-Tréguer, and Jean Cordier. 2009. "Effects of Constrained Supply and Price Contracts on Agricultural Cooperatives." European journal of operational research 199 (3): 769-780.

Hsia, Pei, Jayarajan Samuel, Jerry Gao, David Kung, Yasufumi Toyoshima, and Cris Chen. 1994. "Formal Approach to Scenario Analysis." Software, IEEE 11 (2): 33-41.

Hunton, Peter. 2001. "Poultry Production in Bangladesh." World Poultry-Elsevier 17 (7).

Indianexpress. 2011. "Opening Up." Indian express http://www.indianexpress.com/news/opening-up/822197/.

INE, Instituto Nacional de Estadistica. 2009. Poverty and Its Measurement-the Presentation of a Range of Methods to Obtain Measures of Poverty.

Intrapairot, Arunee. 2000. "A Study on the Adoption and Diffusion of Information and Communication Technologies in the Banking Industry in Thailand Using a Multiple-Criteria Based System Dynamics Approach." Graduate School of Business (GSB), Curtin University, Perth, Australia. http://link.library.curtin.edu.au/p?cur_digitool_dc10367

IRIN. 2013. Bangladesh: Poultry Industry Still Reeling from Bird Flu. http://www.irinnews.org/report/96056/bangladesh-poultry-industry-still-reeling-from-bird-flu.

Islam, M.R., B.C. Das, K. Hossain, N.S. Lucky, and M.G. Mostafa. 2003. "A Study on the Occurrence of Poultry Diseases in Sylhet Region of Bangladesh." International Journal of Poultry Science 2 (5): 354-356.

Islam, Nabiul. 2003. Demand Projections for Poultry Products and Poultry Feeds in Bangladesh. Washington D.C. www.ifpri.org/sites/default/files/publications/mssdp54.pdf.

Islam, S M Fakhrul, and M A Jabbar. 2005. "Smallholder Poultry Model for Poverty Alleviation in Bangladesh: A Review of Evidence on Impact." Livestock Research for Rural Development 17 (10).

Ittersum, M.K. Van, and R. Rabbinge. 1997. "Concepts in Production Ecology for Analysis and Quantification of Agricultural Input-Output Combinations." Field Crops Research 52: 197-208.

Jabbar, M.A., S.M.E. Islam, C. Delgado, S. Ehui, and M.A. Akanda. 2005. Policy and Scale Factors Influencing Efficiency in Dairy and Poultry Producers in Bangladesh. Joint working paper by ILRI/SLP/BSMRAU. Accessed December 2009, available at http://mahider.ilri.org/bitstream/10568/1782/1/2005DairyPoultryBangladesh_1.pdf.

Jabbar, Mohammad A., and Carlos Seré. 2004. "Family Poultry Production: The Potential Contribution of International Research." In World Poultry Congress, Istanbul, Turkey. FAO.

Jabbar, Mohammad Abdul. 2005. Policy and Scale Factors Influencing Efficiency in Dairy and Poultry Production in Bangladesh: ILRI (aka ILCA and ILRAD).

270

Jain, Vipul, S Wadhwa, and SG Deshmukh. 2009. "Select Supplier-Related Issues in Modelling a Dynamic Supply Chain: Potential, Challenges and Direction for Future Research." International Journal of Production Research 47 (11): 3013-3039.

Janssen, Sander, Kamel Louhichi, Argyris Kanellopoulos, Peter Zander, Guillermo Flichman, Huib Hengsdijk, Eelco Meuter et al. 2010. "A Generic Bio-Economic Farm Model for Environmental and Economic Assessment of Agricultural Systems." Environmental Management 46: 862-877. doi: 10.1007/s00267-010-9588-x.

Jennings, P.D., and P.A. Zandbergen. 1995. "Ecologically Sustainable Organizations: An Institutional Approach." The Academy of Management review 20 (4): 1015-1052.

Jensen, Hans Askov, and Frands Dolberg. 2003. "A Conceptual Framework for Using Poultry as a Tool in Poverty Alleviation." Livestock Research for Rural Development 15 (5).

Johnson, D.L., S.H. Ambrose, T.J. Bassett, M.L. Bowen, D.E. Crummey, J.S. Isaacson, D.N. Johnson, P. Lamb, M. Saul, and A.E. Winter-Nelson. 1997. "Meanings of Environmental Terms." Journal of Environmental Quality 26 (3): 581-589.

Johnson, M.R., and M.H. Wang. 2002. "Evaluation Policies and Automotive Recovery Options According to the European Union Direction on End-of-Life Vehicles (Elv)." Journal of Automobile Engineering, also in; Proceedings of Institute of Mechanical Engineering 216 (Part D): 723-739.

Johnson, P.F. 1998. "Managing Value in Reverse Logistics Systems." Transportation Research: Part E. Logistics and Transportation Review 34 (3): 217-227.

Johnson, R. Burke, and Anthony J. Onwuegbuzie. 2004. "Mixed Methods Research: A Research Paradigm Whose Time Has Come." Educational Researcher 33 (7): 14-26.

Johnson, Scott D. 1988. "Cognitive Analysis of Expert and Novice Troubleshooting Performance." Performance Improvement Quarterly 1 (3): 38-54.

Jones, T.C., and D.W. Riley. 1985. "Using Inventory for Competitive Advantage through Supply Chain Management." International Journal of Physical Distribution & Materials Management 15 (5): 16-26.

Jørgensen, Håvard D. 2004. "Interactive Process Models." Norwegian University of Science and Technology.

Jutla, Antarpreet Singh, Amin Elshorbagy, and Jim Kells. 2006. Simulation of the Hydrological Processes on Reconstructed Watersheds Using System Dynamics Saskatoon, SK, CANADA.

Kabir, Kaiser. 2013. "Helping Bangladesh Achieve the (Millenium Development Goals) Mdgs: The Role of the Poultry Industry" 8th International Poultry Show and Seminar, Bangabondhu International Conference Centre , Dhaka , Bangladesh,

Kachele, H., and S. Dabbert. 2002. "An Economic Approach for a Better Understanding of Conflicts between Farmers and Nature Conservationists-an Application of the Decision Support System Modam to the Lower Odra Valley National Park." Agricultural Systems 74: 241-255.

Kaihara, Toshiya. 2003. "Multi-Agent Based Supply Chain Modelling with Dynamic Environment." International Journal of Production Economics 85 (2): 263-269.

271

Kalk, B. Berna Celebi. 2012. "A Critical Analysis of E-Waste Policies." Department of IE&IS, University of Technology.

Kandel, William, and Emilio A Parrado. 2005. "Restructuring of the Us Meat Processing Industry and New Hispanic Migrant Destinations." Population and Development Review 31 (3): 447-471.

Karakayali, Ibrahim, Hulya Emir-Farinas, and Elif Akcali. 2007. "An Analysis of Decentralized Collection and Processing of End-of-Life Products." Journal of Operations Management 25: 1161-1183.

Karlsson, S. 1999. "Closing the Technospheric Flows of Toxic Metals: Modelling Lead Losses from a Lead-Acid Battery System for Sweden." Journal of Industrial Ecology 3 (1): 23-40.

Karna, A. , and E. Heiskanen. 1998. "The Challenge of ‘Product Chain’ Thinking for Product Development and Design: The Example of Electrical and Electronics Products. ." Journal of Sustainable Product Design 4 (1): 26–36.

Karnopp, Dean, Ronald Rosenberg, and Alan S. Perelson. 1976. "System Dynamics: A Unified Approach." Systems, Man and Cybernetics, IEEE Transactions on (10): 724-724.

Keloharju, R., and E.F. Wolstenholme. 1988. "The Basic Concepts of System Dynamics Optimization." Systems practice 1 (1): 65-86.

Kemp, R. 1994. "Technology and the Transition to Environmental Sustainability." Futures 26 (10): 1023–1046.

Ketchen Jr, David J, and G Tomas M Hult. 2007. "Bridging Organization Theory and Supply Chain Management: The Case of Best Value Supply Chains." Journal of Operations Management 25 (2): 573-580.

King, Andrew A., and Michael J. Lenox. 2001. "Lean and Green? An Empirical Examination of the Relationship between Lean Production and Environmental Performance." Production and Operations Management 10 (3): 244-256.

King, Andrew M, Stuart C Burgess, Winnie Ijomah, and Chris A McMahon. 2006. "Reducing Waste: Repair, Recondition, Remanufacture or Recycle?" Sustainable Development 14 (4): 257-267.

Kingwell, R.S., A.K.A. Ghadim, S.D. Robinson, and J.M. Young. 1995. "Introducing Awassi Sheep to Australia: An Application of Farming System Models." Agricultural Systems 47: 451-471.

Kingwell, R.S., and D.J. Pannell. 1987. "Midas: A Bioeconomic Model of a Dryland Farm System. Pudoc." Wageningen: 207.

Kleijnen, Jack P.C. 1995. "Verification and Validation of Simulation Models." European Journal of Operational Research 82 (1): 145-162.

Kleindorfer, P.R., K. Singhal, and L.N. Van Wassenhove. 2005. "Sustainable Operations Management." Production and Operations Management 14 (4): 482-492.

Kliebenstein, James. 1998. Economic and Associated Social and Environmental Issues with Large-Scale Livestock Production Systems. https://www.researchgate.net/publication/254424998_Economic_and_Associated_Social_and_Environmental_Issues_with_Large-Scale_Livestock_Production_Systems.

272

Klimoski, Richard, and Susan Mohammed. 1994. "Team Mental Model: Construct or Metaphor?" Journal of management 20 (2): 403-437.

Knoepfel, Ivo. 2001. "Dow Jones Sustainability Group Index: A Global Benchmark for Corporate Sustainability." Corporate Environmental Strategy 8 (1): 6-15.

Kocabasoglu, Canan, Carol Prahinski, and Robert D. Klassen. 2007. "Linking Forward and Reverse Supply Chain Investments: The Role of Business Uncertainty." Journal of Operations Management 25: 1141-1160.

Kopicki, Ronald, Michael J. Berg, and Leslie Legg. 1993. Reuse and Recycling-Reverse Logistics Opportunities.

Kopke, E., J.M. Young, and R. Kingwell. 2008. "He Relative Profitability and Environmental Impacts of Different Sheep Systems in a Mediterranean Environment." Agricultural systems 96: 85-94.

Kornbluh, Marvin, and Dennis Little. 1976. "The Nature of a Computer Simulation Model." Technological forecasting and social change 9 (1): 3-26.

Krantz, Lasse. 2001. "The Sustainable Livelihood Approach to Poverty Reduction." An Introduction. SIDA.

Krasner, Stephen D. 1984. "Approaches to the State: Alternative Conceptions and Historical Dynamics." JSTOR.

Kreiser, Patrick M, and Justin Davis. 2010. "Entrepreneurial Orientation and Firm Performance: The Unique Impact of Innovativeness, Proactiveness, and Risk-Taking." Journal of Small Business & Entrepreneurship 23 (1): 39-51.

Kruchten, Tom. 2002. "U.S Broiler Industry Structure". .. ." edited by Agricultural Statistics Board National Agricultural Statistics Service (NASS), USA: U.S. Department of Agriculture.

Kubena, L.F., C.R. Sadler, R.L. Haynes, T.H. Vardaman, and J.W. Deaton. 1976. "Effect of Fish and Poultry Byproduct Meal on the Small Intestine and Gizzard of Broilers." Poultry Science 55 (1): 30-33.

Labus, Michael, and Merlin Stone. 2010. "The Crm Behaviour Theory–Managing Corporate Customer Relationships in Service Industries." Journal of Database Marketing & Customer Strategy Management 17 (3): 155-173.

Laforet, Sylvie. 2011. "A Framework of Organisational Innovation and Outcomes in Smes." International Journal of Entrepreneurial Behaviour & Research 17 (4): 380-408.

Lal, R. 1991. "Soil Structure and Sustainability." Journal of Sustainable Agriculture 1 (4): 67-91.

Lal, R., D.O. Hansen, N. Uphoff, and S.A. Slack. 2002. Food Security and Environmental Quality in the Developing World. Boca Raton, FL.: CRC Press.

Lambert, D.M., M.C. Cooper, and J.D. Pagh. 1998. "Supply Chain Management: Implementation Issues and Research Opportunities." International Journal of Logistics Management 9 (2): 1-19.

Lambert, D.M., K.L. Croxton, S.J. Garcı´a-Dastugue, M. Knemeyer, and D.S. Rogers. 2006. Supply Chain Management Processes, Partnerships, Performance. Vol. 2nd ed. Jacksonville, FL.: Hartley Press Inc.

273

Lambert, Douglas M., and Martha C. Cooper. 2000. "Issues in Supply Chain Management." Industrial marketing management 29 (1): 65. http://sfx.lis.curtin.edu.au/sfx_local?sid=google&auinit=DM&aulast=Lambert&atitle=Issues%20in%20supply%20chain%20management&title=Industrial%20marketing%20management&volume=29&issue=1&date=2000&spage=65&issn=0019-8501.

Lambert, Douglas M., James R. Stock, and Lisa M. Ellram. 1998. Fundamentals of Logistics Management: Irwin/McGraw-Hill Chicago, IL.

Lane, David C., and Rogelio Oliva. 1998. "The Greater Whole: Towards a Synthesis of System Dynamics and Soft Systems Methodology." European Journal of Operational Research 107 (1): 214-235.

Larraâin, Jorge. 1979. The Concept of Ideology: University of Georgia Press (Athens).

Larson, Andrea. 2008. "Framing Sustainability Innovation and Entrepreneurship." In Sustainability, Innovation, and Entrepreneurship. Virginia, USA.

Laughlin, Ken, and CBiol MIBiol. 2007. "" The Evolution of Genetics, Breeding and Production." Temperton Fellowship Report 15.

Lazear, E.P. 2003. "Entrepreneurship, Iza Disc." Paper.

Lee, H., and C.S. Tang. 1997a. "Modeling the Costs and Benefits of Delayed Product Differentiation." Management Science 43 (1): 40-53.

———. 1997b. "Modelling the Costs and Benefits of Delayed Product Differentiation." Management Science 43 (1): 40-53.

Lee, Hau L. 2004. "The Triple-a Supply Chain." In The 21st-Century Supply Chain, 102-112. Harvard Business Review.

Lee, J.H., and C.O. Kim. 2008. "Multi-Agent Systems Applications in Manufacturing Systems and Supply Chain Management: A Review Paper." International Journal of Production Research 46 (1): 233-265.

Lee, J.J., P. O’Callaghan, and D. Alien. 1995. "Critical Review of Life Cycle Analysis and Assessment Techniques and Their Application to Commercial Activities." Resources, Conservation and Recycling 13 (37-56).

Lee, Margie D., and Diane G. Newell. 2006. "Campylobacter in Poultry: Filling an Ecological Niche." Avian diseases 50 (1): 1-9.

Lee, Su-Yol. 2008. "Drivers for the Participation of Small and Medium-Sized Suppliers in Green Supply Chain Initiatives." Supply Chain Management: An International Journal 13 (3): 185-198.

Leenders, Michiel R., and David L. Blenkhorn. 1988. Reverse Marketing: The New Buyer-Supplier Relationship: Free Press New York.

Leeson, Steven, and John D. Summers. 2010. Broiler Breeder Production: Nottingham University Press.

Legard, Robin, Jill Keegan, and Kit Ward. 2003. "In-Depth Interviews." Qualitative research practice: A guide for social science students and researchers: 138-169.

Li, Xiaoming, and Festus Olorunniwo. 2008. "An Exploration of Reverse Logistics Practices in Three Companies." Supply Chain Management: An International Journal 13 (5): 381-386.

274

Linton, J.D., and V. Jayaraman. 2005. "A Framework for Identifying Differences and Similarities in the Managerial Competencies Associated with Different Modes of Product Life Extension." International journal of production research 43 (9): 1807-1829.

Linton, Jonathan D., and David A. Johnston. 2000. "A Decision Support System for Planning Remanufacturing at Nortel Networks." Interfaces 30 (6): 17-31.

Linton, Jonathan D., Robert Klassen, and Vaidyanathan Jayaraman. 2007. "Sustainable Supply Chains: An Introduction." Journal of Operations Management 25 (6): 1075–1082.

Lippman, S. 1999. "Supply Chain Environmental Management: Elements for Success." Corporate Environmental Strategy 6 (2): 175-82.

Lister, Stephen. 2010. Biology of Breeding Poultry: Taylor & Francis.

Liverman, Diana M., Mark E. Hanson, Becky J. Brown, and Robert W. Merideth. 1988. "Global Sustainability: Toward Measurement." Environmental Management 12 (2): 133-143.

Lo, Shih‐Fang. 2010. "Performance Evaluation for Sustainable Business: A Profitability and Marketability Framework." Corporate Social Responsibility and Environmental Management 17 (6): 311-319.

Lu, J., U. Idris, B. Harmon, C. Hofacre, J.J. Maurer, and M.D. Lee. 2003. "Diversity and Succession of the Intestinal Bacterial Community of the Maturing Broiler Chicken." Applied and environmental microbiology 69 (11): 6816-6824.

Lummus, R. R., and K.L. Alber. 1997. Supply Chain Management: Balancing the Supply Chain with Customer Demand. Alexandria,VA.: APICS Educational and Research Foundation, Inc.,.

Lummus, Rhonda R., and Robert J. Vokurka. 1999. "Defining Supply Chain Management: A Historical Perspective and Practical Guidelines." Industrial Management & Data Systems 99 (1): 11-17.

Lund, Robert T., and Banco Mundial. 1984. Remanufacturing: The Experience of the United States and Implications for Developing Countries. Vol. 31: World Bank.

Lund, Robert T., F. Doyle Skeels, GR Heaton Jr, R. Grand, D.L. Beardsley, and T.A. Gonzalez. 1982. Engineering Feasibility Study of Remanufacture of Chain Saws: Massachusetts Inst. of Tech., Cambridge (USA). Center for Policy Alternatives.

Lynch, Robert G. 2004. Economic, Fiscal, and Social Benefits of Investment in Early Childhood Development: Washington, DC: Economic Policy Institute.

Lyneis, James M. 1980. Corporate Planning and Policy Design: A System Dynamics Approach: MIT Press Cambridge, MA.

———. 1998. "System Dynamics in Business Forecasting: A Case Study of the Commercial Jet Aircraft Industry" CD-ROM Proceedings of the 1998 System Dynamics Conference,

———. 2000. "System Dynamics for Market Forecasting and Structural Analysis." System Dynamics Review 16 (1): 3-25.

Lyneis, James M., Kenneth G. Cooper, and Sharon A. Els. 2001. "Strategic Management of Complex Projects: A Case Study Using System Dynamics." System Dynamics Review 17 (3): 237-260.

275

Lyneis, James M., and David N. Ford. 2007. "System Dynamics Applied to Project Management: A Survey, Assessment, and Directions for Future Research." System Dynamics Review 23 (2‐3): 157-189.

Maani, K.E., and R.Y. Cavana. 2007. Systems Thinking, System Dynamics: Managing Change and Complexity. Vol. 2nd. Auckland: Pearson Education (NZ) and Prentice Hall.

Mack, S., D. Hoffmann, and J. Otte. 2005. "The Contribution of Poultry to Rural Development." World's Poultry Science Journal 61 (1): 7.

Maldonado, George, and Sander Greenland. 1993. "Simulation Study of Confounder-Selection Strategies." American journal of epidemiology 138 (11): 923-936.

———. 1997. "The Importance of Critically Interpreting Simulation Studies." Epidemiology 8 (4): 453-456.

———. 1998. "Factoring Vs Linear Modeling in Rate Estimation: A Simulation Study of Relative Accuracy." Epidemiology: 432-435.

Malechek, J.C., and A.Z. Scottsdale. 1982. "Grazing Management of Goats in Extensive Rangeland Production Systems. Proceedings" International Conference on Goat Production and Disease. Tucson, AZ (EUA). 10-15 Ene 1982.: Dairy Goat Journal Publishing Co.

Maliapen, Mahendran. 2003. "System Dynamics Based Visual Interactive Models: Understanding Strategic Healthcare and Clinical Behavior through the Development of Simulation Models." Graduate School of Business (GSB), Curtin University, Perth, Australia.

Mannan, Abdul. 2013. Bird Feather, Biogas and Fertilizer Procustion in Nahar Agro Complex Limited, February 01, Bird Feather, biogas and fertilizer procustion in Nahar Agro Complex Limited, Chittagong, Bangladesh.

March, S.T., and G. Smith. 1995. "Design and Natural Science Research on Information Technology." Decision Support Systems 15 (4): 251-266.

Marshall, DR. 1977. "The Advantages and Hazards of Genetic Homogeneity." Annals of the New York Academy of Sciences 287 (1): 1-20.

Mass, N. 1980. "Stock and Flow Variables and the Dynamics of Supply and Demand." In Elements of the System Dynamics Method, ed. J. Randers. Waltham, MA: Pegasus Communications.

Maxwell, D., and R. van der Vorst. 2003. "Developing Sustainable Products and Services." Journal of Cleaner Production 11 883-895.

Mbuligwe, Stephen E, and Mengiseny E Kaseva. 2006. "Assessment of Industrial Solid Waste Management and Resource Recovery Practices in Tanzania." Resources, conservation and recycling 47 (3): 260-276.

McDaniel, Carl. 1979. "Focus Groups-Their Role in the Marketing Research Process." Acron Business and Economic Review 10: 14-19.

McDoland, Rod. 2013. System Dynamics Validity, 25 July, Personal interview on system dynamics validity,

McIvor, Ronan. 2000. "A Practical Framework for Understanding the Outsourcing Process." Supply Chain Management: An International Journal 5 (1): 22-36.

276

McKay, J.C. 2008. "The Genetics of Modern Commercial Poultry" 23rd World’s Poultry Congress, Brisbane, Australia,

McMichael, Anthony J., Colin D. Butler, and Carl Folke. 2003. "New Visions for Addressing Sustainability." Science 302 (5652): 1919-1920.

McRae, T., C.A.S. Smith, and L.J. Gregorich. 2000. "Environmental Sustainability of Canadian Agriculture." Report of the Agri-Environmental Indicator Project, Agriculture and Agri-Food Canada: 1-25.

Meade, L. 2002. "A Conceptual Model for Selecting and Evaluating Third-Party Reverse Logistics Providers." Supply Chain Management 7 (5): 283.

Meadows, D, and J Randers. 1992. Beyond the Limits: Global Collapse or a Sustainable Future. Post Mills, VT: Chelsea Green.

Meadows, D.H., D.L. Meadows, J. Randers, and W.W. Behrens. 1972. The Limits to Growth. New York: Universe.

Meadows, D.L. 1980. "Elements of the System Dynamics Method." Chapter The Unavoidable A Priori.

Meadows, Donella H. 1989. "System Dynamics Meets the Press." System Dynamics Review 5 (1): 69-80.

Mentzer, J.T., W. Dewitt, J.S. Keebler, S. Min, N.W. Nix, C.D. Smith, and Z.G. Zacharia. 2002. "Defining Supply Chain Management." Journal of Business Logistics 22 (2): 1-25.

Meredith, Jack. 1998. "Building Operations Management Theory through Case and Field Research." Journal of operations management 16 (4): 441-454.

Meyer-Aurich, A., P. Zander, A. Werner, and R. Roth. 1998. "Developing Agricultural Land Use Strategies Appropriate to Nature Conservation Goals and Environmental Protection." Landscape and Urban Planning 41: 119-127.

Meystre, Stéphane M, Guergana K Savova, Karin C Kipper-Schuler, and John F Hurdle. 2008. "Extracting Information from Textual Documents in the Electronic Health Record: A Review of Recent Research." Yearb Med Inform 35: 128-44.

Michaelis, Michael, and Joseph F. Coates. 1994. "Creating Integrated Performance Systems: The Business of the Future." Technology Analysis and Strategic Management 6 (2): 245-250.

Min, H., and W.P. Galle. 1997. "Green Purchasing Strategies: Trends and Implications." Journal of Supply Chain Management 33 (3): 10-17.

Min, Hokey, and Gengui Zhou. 2002. "Supply Chain Modeling: Past, Present and Future." Computers & Industrial Engineering 43 (1): 231-249.

Min, S., and J.T. Mentzer. 2000. "The Role of Marketing in Supply Chain Management." International Journal of Physical Distribution & Logistics Management 30 (9): 765-87.

Mingers, John. 2001. "Combining Is Research Methods: Towards a Pluralist Methodology." Information Systems Research 12 (3): 240–259.

———. 2003. "The Paucity of Multimethod Research: A Review of the Information Systems Literature." Information Systems Journal 13 (3): 233-249.

Monczka, Robert M., and Jim Morgan. 1997. "What’s Wrong with Supply Chain Management." Purchasing 122 (1): 69-73.

277

Mont, Oksana, Carl Dalhammar, and Nicholas Jacobsson. 2006. "A New Business Model for Baby Prams Based on Leasing and Product Remanufacturing." Journal of Cleaner Production 14 1509-1518.

Moore, Samuel B, and Susan L Manring. 2009. "Strategy Development in Small and Medium Sized Enterprises for Sustainability and Increased Value Creation." Journal of cleaner production 17 (2): 276-282.

Morecroft, John D.W. 1985. "Rationality in the Analysis of Behavioral Simulation Models." Management Science 31 (7): 900-916.

———. 1988a. "System Dynamics and Microworlds for Policymakers." European Journal of Operational Research 35 (3): 301-320.

Morecroft, John DW. 1988b. "System Dynamics and Microworlds for Policymakers." European Journal of Operational Research 35 (3): 301-320.

Morrison, D.A., R.S. Kingwell, D.J. Pannell, and M.A. Ewing. 1986. "A Mathematical Programming Model of a Crop-Livestock Farm System." Agricultural Systems 20: 243-268.

Mosekilde, Eric, Eric Larsen, and John D. Sterman. 1991. "Coping with Complexity: Deterministic Chaos in Human Decisionmaking Behavior." Beyond belief: Randomness, prediction, and explanation in science: 199-229.

Moser, C.A., and G. Kalton. 1986. "Survey Methods in Social Investigation." Survey Methods in Social Investigation.

Mottershead, JE, and MI Friswell. 1993. "Model Updating in Structural Dynamics: A Survey." Journal of sound and vibration 167 (2): 347-375.

Mudgal, Rakesh K., Ravi Shankar, Parvaiz Talib, and Tilak Raj. 2010. "Modelling the Barriers of Green Supply Chain Practices: An Indian Perspective." International Journal of Logistics Systems and Management 7 (1): 81-107.

Muir, William M., Gane Ka-Shu Wong, Yong Zhang, Jun Wang, Martien A.M. Groenen, Richard P.M.A. Crooijmans, Hendrik-Jan Megens, Huanmin Zhang, Ron Okimoto, and Addie Vereijken. 2008. "Genome-Wide Assessment of Worldwide Chicken Snp Genetic Diversity Indicates Significant Absence of Rare Alleles in Commercial Breeds." Proceedings of the National Academy of Sciences 105 (45): 17312-17317.

Müller, Mark, and Dietmar Pfahl. 2008. "Simulation Methods." In Guide to Advanced Empirical Software Engineering, 117-152. Springer.

Mundi. 2011. World Poultry Ranking. Mundi. Accessed September 05, 2013, http://www.indexmundi.com/agriculture/?commodity=broiler-meat&graph=production.

Munro, David A., and Martin W. Holdgate. 1991. Caring for the Earth: A Strategy for Sustainable Living: International Union for the Conservation of Nature and Natural Resources.

Murphy, Pamela, Christine R Mueller, and Mamatha Gowda. 1993. The Garbage Primer: Lyons & Burford New York.

Murphy, Paul R., and Richard F. Poist. 2003. "Green Perspectives and Practices: A “Comparative Logistics” Study." Supply Chain Management: An International Journal 8 (2): 122-131.

278

Myers, M. 1997. "Qualitative Research in Information Systems." MIS Quarterly 21 (2): 241-242.

Nagurney, A. 2005. "Reverse Supply Chain Management and Electronic Waste Recycling: A Multitiered Network Equilibrium Framework for E-Cycling." Transportation research. Part E, Logistics and transportation review 41 (1): 1.

Narahari, D, R Asha Rajini, G Srinivasan, and N Ramamurthy. 2000. "Methods to Improve the Hatchability of Checked Chicken Eggs." British Poultry Science 41 (2): 178-181.

Narver, John C., and Stanley F. Slater. 1990. "The Effect of a Market Orientation on Business Profitability." The Journal of Marketing: 20-35.

National-Chicken-Council. 2012. Animal Welfare for Broiler Chickens. National Chicken Council. JUne 21 Accessed 13/06, http://www.nationalchickencouncil.org/industry-issues/animal-welfare-for-broiler-chickens/.

NCC. 2012. Vertical Integration: What It Is - and Why It’s Good for the Chicken Industry and You. The National Chicken Council Accessed November 2, 2013, http://www.nationalchickencouncil.org/industry-issues/vertical-integration/.

Neuman, William Lawrence. 2005. Social Research Methods: Quantitative and Qualitative Approaches: Allyn and Bacon.

New, S.J. 1997. "The Scope of Supply Chain Management Research." Supply Chain Management: An International Journal 2 (1): 15-22.

New, S.J., and P. Payne. 1995. " Research Frameworks in Logistics: Three Models, Seven Dinners and a Survey." International Journal of Physical Distribution and Logistics Management 25 (10): 60-77.

Nielsen, Hanne. 2007. Socio-Economic Impact of the Smallholder Livestock Development Project in Bangladesh: Results of the Second Impact Survey. Stamholmen, Denmark.

Nielsen, Hanne, Nanna Roos, and Shakuntala H. Thilsted. 2003. "The Impact of Semi-Scavenging Poultry Production on the Consumption of Animal Source Foods by Women and Girls in Bangladesh." The Journal of nutrition 133 (11): 4027S-4030S.

Norman, Wayne, and Chris MacDonald. 2004. "Getting to the Bottom of" Triple Bottom Line"." Business Ethics Quarterly: 243-262.

Novack, R A, and S W Simco. 1991. "The Industrial Procurement Process: A Supply Chain Perspective." Journal of Business Logistics 12 (1): 145-67.

Nunamaker, Jay F., and Minder Chen. 1990. "Systems Development in Information Systems Research" System Sciences, 1990., Proceedings of the Twenty-Third Annual Hawaii International Conference on: IEEE.

Nurse, Paul. 2008. "Life, Logic and Information." Nature 454 (7203): 424-426.

Oglethorpe, D.R., and R.A. Sanderson. 1999. "An Ecological-Economic Model for Agri-Environmental Policy Analysis." Ecological Economics 28: 245-266.

Oliver, R.K., and M.D. Webber. 1982. "Supply-Chain Management: Logistics Catches up with Strategy." In Logistics: The Strategic Issues. Chapman & Hall, London.

279

Onwuegbuzie, Anthony J., and Nancy L. Leech. 2007. "A Call for Qualitative Power Analyses." Quality and Quantity 41 (1): 105-121.

Oreskes, Naomi, Kristin Shrader-Frechette, and Kenneth Belitz. 1994. "Verification, Validation, and Confirmation of Numerical Models in the Earth Sciences." Science 263 (5147): 641-646.

Orlikowski, Wanda J., and Jack J. Baroudi. 1991. "Studying Information Technology in Organizations: Research Approaches and Assumptions." Information Systems Research 2 (1): 1-28.

Ostrom, Elinor. 2002. The Drama of the Commons: National Academies Press.

Pala, M., C.O. Stockle, and H.C. Harris. 1996. "Simulation of Durum Wheat (Triticum Turgidum Ssp Durum) Growth under Different Water and Nitrogen Regimes in a Mediterranean Environment Using Crop Syst." Agricultural systems 51 (2): 147-163.

Pannell, David J. 1997. "Sensitivity Analysis of Normative Economic Models: Theoretical Framework and Practical Strategies." Agricultural economics 16 (2): 139-152.

Papageorgiou, Lazaros G. 2009. "Supply Chain Optimisation for the Process Industries: Advances and Opportunities." Computers & Chemical Engineering 33 (12): 1931-1938.

Partridge, Amy Roach. 2010. Green Reverse Logistics Brings Many Happy Returns. Keith G. Biondo, Thomas Publishing Company. Accessed September 10, http://www.inboundlogistics.com/cms/article/green-reverse-logistics-brings-many-happy-returns/.

Pathak, Surya D., Jamison M. Day, Anand Nair, William J. Sawaya, and M Murat. Kristal. 2007. "Complexity and Adaptivity in Supply Networks: Building Supply Network Theory Using a Complex Adaptive Systems Perspective*." Decision Sciences 38 (4): 547-580.

Patton, Michael Quinn. 1987. How to Use Qualitative Methods in Evaluation. Vol. 4: Sage.

Peacocka, C., and D.M. Shermanb. 2010. "Sustainable Goat Production: Some Global Perspectives." Small Ruminant Research (89): 70-80.

Peattie, K. 1995. Environmental Marketing Management: Meeting the Green Challenge, . Pitman, London.

Peffers, Ken , Tuure Tuunanen, E. Charles Gengler, Matti Rossi, Wendy Hui, Ville Virtanen, and Johanna Bragge. 2007. "A Design Science Research Methodology for Information Systems Research." Journal of management information systems 24 (3): 45-47.

Peffers, Ken , Tuure Tuunanen, A. Marcus Rothenberger, and Samir Chatterjee. 2008. "A Design Science Research Methodology for Information Systems Research." Journal of Management Information Systems 24 (3): 45-77.

Penev, K.D., and A.J. de RON. 1996. "Determination of a Disassembly Strategy." International Journal of Production Research 34 (2): 495-506.

Peredo, Ana Maria, and James J Chrisman. 2006. "Toward a Theory of Community-Based Enterprise." Academy of Management Review 31 (2): 309-328.

Permin, A., G. Pedersen, and J.C. Riise. 2001. "Poultry as a Tool for Poverty Alleviation: Opportunities and Problems Related to Poultry Production at Village Level." 143-147. www.aciar.gov.au/files/node/2131/pr103chapter29.pdf.

280

Pero, Margherita, Nizar Abdelkafi, Andrea Sianesi, and Thorsten Blecker. 2010. "A Framework for the Alignment of New Product Development and Supply Chains." Supply Chain Management: An International Journal 15 (2): 115-128.

Pervan, Graham P. 1994. "Case for More Case Study Research in Group Support Systems." IFIP TRANS A COMPUT SCI TECHNOL: 469-479.

Peterson, David W., and Robert L. Eberlein. 1994. "Reality Check: A Bridge between Systems Thinking and System Dynamics." System Dynamics Review 10 (2‐3): 159-174.

Peterson, Steve. 1992. "Software for Model-Building and Simulation: An Illustration of Design Philosophy." European journal of operational research 59 (1): 197-202.

Pfahl, Dietmar, and Karl Lebsanft. 2000. "Using Simulation to Analyse the Impact of Software Requirement Volatility on Project Performance." Information and Software Technology 42 (14): 1001-1008.

Picken, D.J., and A. Strub. 1983. "Biogas in Engines" Energy from biomass. Proceedings, 2nd EC Conference, Berlin, Federal Republic of Germany, 20-23 September 1982: Applied Science Publishers.

Poirier, Charles C., and Stephen E. Reiter. 1996. Supply Chain Optimization: Building the Strongest Total Business Network: Berrett-Koehler Store.

Ponomarov, Serhiy Y, and Mary C Holcomb. 2009. "Understanding the Concept of Supply Chain Resilience." International Journal of Logistics Management, The 20 (1): 124-143.

Porter, M.E. 1985. Competitive Advantage. New York, NY.: The Free Press, .

Porter, M.E., and M.R. Kramer. 2002. "The Competitive Advantage of Corporate Philanthropy." Harvard Business Review 80 (12): 56-68.

Porter, Michael E., and Mark R. Kramer. 2011. "Creating Shared Value." Harvard business review January-February 2011: 1-17. http://hbr.org/2011/01/the-big-idea-creating-shared-value.

Postma, Theo JBM, and Franz Liebl. 2005. "How to Improve Scenario Analysis as a Strategic Management Tool?" Technological Forecasting and Social Change 72 (2): 161-173.

Poultryhub. 2013. Meat Chicken Farm Sequence. CRC Australia. Accessed February 01, 2013,

Prahinski, C., and C. Kocabasoglu. 2006a. "Empirical Research Opportunities in Reverse Supply Chains." OMEGA 34: 519-532.

Prahinski, Carol, and Canan Kocabasoglu. 2006b. "Empirical Research Opportunities in Reverse Supply Chains." Omega: The International Journal of Management Science 34 (6): 519-532.

PVE. 2010. Livestock, Meat and Eggs in the Netherlands 2010. Zoetermeer.

Pym, Robert. n.d. Poultry Genetics and Breeding in Developing Countries -Commercial Selection for Meat and Egg Production.

Quaddus, M.A., and M.A.B. Siddique. 2004. "Modelling and Decision Support in Sustainable Development Planning: A Review and Analysis." In Handbook of Sustainable Development Planning. Cheltenham, Edward Elgar Publishing Limited.

281

Quaddus, MA, and Muhammed Abu B Siddique. 2011. Handbook of Corporate Sustainability: Frameworks, Strategies and Tools: Edward Elgar Publishing.

Quariguasi Frota Neto, J., Grit Walther, Jacqueline Bloemhof, JAEE Van Nunen, and T. Spengler. 2010. "From Closed-Loop to Sustainable Supply Chains: The Weee Case." International Journal of Production Research 48 (15): 4463-4481.

Qudrat-Ullah, Hassan. 2005. "Mdesrap: A Model for Understanding the Dynamics of Electricity Supply, Resources and Pollution." International Journal of Global Energy Issues 23 (1): 1-14.

Qudrat-Ullah, Hassan, and Baek Seo Seong. 2010. "How to Do Structural Validity of a System Dynamics Type Simulation Model: The Case of an Energy Policy Model." Energy Policy 38 (5): 2216-2224.

Quinn, F.J. 1997. "“What’s the Buzz?”." Logistics Management 36 (2): 43-7.

Radzicki, Michael J., and R. Taylor. 2008. "Origin of System Dynamics: Jay W. Forrester and the History of System Dynamics." US Department of Energy’s Introduction to System Dynamics. Retrieved 23.

Rahman, M. Rakibur. 2013a. Calamities and Disaster in Poultry, September 09, Operation of Nahar Agro Complex Limited, Chittagong, Bangladesh.

———. 2013b. Modern Poultry Operation, September 15, Operation of Nahar Agro Complex Limited, Chittagong, Bangladesh.

———. 2013c. Operation of Nahar Agro Complex Limited, February 01, Operation of Nahar Agro Complex Limited, Chittagong, Bangladesh.

Rahman, M.A. 2007. "Development of Convenient Composting Method Using Broiler Litter." Dept. of Animal Science, Bangladesh Agricultural University, Mymensingh.

Rahman, M.M. 2003. "Growth of Poultry Industry in Bangladesh Poverty Alleviation and Employment Opportunity." In 3rd International Poultry Show and Seminar, Bangladesh China Friendship Conference Centre (BCFCC), Sher-e-Bangla Nagar, Dhaka, Bangladesh, 1-7.

Rahman, M.M., A.S.M. Bari, M. Giasuddin, M.R. Islam, J. Alam, G.C. Sil, and M.M. Rahman. 2002. "Evaluation of Maternal and Humoral Immunity against Newcastle Disease Virus in Chicken." Int. J. Poult. Sci 1 (5): 161-163.

Rahman, Sajjadur. 2012. "Poultry Litter Can Ease Energy Crisis." The Daily Star, January 25. http://www.thepoultrysite.com/poultrynews/24658/poultry-litter-can-ease-energy-crisis, http://archive.thedailystar.net/newDesign/news-details.php?nid=219726.

Raihan, Selim, and Nahid Mahmud. 2008. Trade and Poverty Linkages: A Case Study of the Poultry Industry in Bangladesh. CUTS International. http://www.cuts-citee.org/pdf/rreport08-08.pdf.

Randers, Jørgen. 1980. Elements of the System Dynamics Method: MIT Press Cambridge.

Rauch, Wolfgang, Mogens Henze, L. Koncsos, P. Reichert, P. Shanahan, L. Somlyódy, and Peter Vanrolleghem. 1998. "River Water Quality Modelling: I. State of the Art." Water Science & Technology 38 (11): 237-244.

Read, Stephen. 2012. "Proof-Theoretic Validity." In Foundations of Logical Consequence, London: Arts and Humanities Research Council, UK.

282

Rebitzer, Gerald, Tomas Ekvall, R. Frischknecht, Daniel Hunkeler, G. Norris, T. Rydberg, W.P. Schmidt, Sangwon Suh, B.P. Weidema, and D.W. Pennington. 2004. "Life Cycle Assessment: Part 1: Framework, Goal and Scope Definition, Inventory Analysis, and Applications." Environment international 30 (5): 701-720.

RecyclingTodayOnline. 2004. Auto Dismantler Inks: Deal with Bmw. May 11 Accessed March 11, 2013, http://www.recyclingtoday.com/news/news.asp?ID=5806&SubCatID=110&CatID=28.

Reinhardt, F.L. 1999. "Bringing the Environment Down to the Earth." Harvard Business Review: 149-57.

Reinhardt, Forest. 2000. Down to Earth: Applying Business Principles to Environmental Management: Harvard Business Press.

Reneta. 2005. Reneta Statistical Yearbook of Bangladesh. Vol. 21.

Repenning, Nelson P. 2002. "A Simulation-Based Approach to Understanding the Dynamics of Innovation Implementation." Organization Science 13 (2): 109-127.

Repenning, Nelson P., and John D. Sterman. 2002. "Capability Traps and Self-Confirming Attribution Errors in the Dynamics of Process Improvement." Administrative Science Quarterly 47 (2): 265-295.

Reynolds, PD, WD Bygrave, E. Autio, and LW Cox. 2001. "M. Hay, 2002." Global Entrepreneurship Monitor, 2002 Executive Report.

Rhyne, Elisabeth. 1998. "The Yin and Yang of Microfinance: Reaching the Poor and Sustainability." MicroBanking Bulletin 2 (1): 6-8.

Richardson, George P. 1986. "Problems with Causal-Loop Diagrams." System Dynamics Review 2 (2): 158-170.

Richardson, George P., and Alexander I. Pugh III. 1981. Introduction to System Dynamics Modeling with Dynamo: Productivity Press Inc.

Richey, R. Glenn. 2005. "Developing Effective Reverse Logistics Programs." Industrial marketing management 34 (8): 830.

Richey, R. Glenn, Stefan E. Genchev, and Patricia J. Daugherty. 2005. "The Role of Resource Commitment and Innovation in Reverse Logistics Performance." International Journal of Physical Distribution & Logistics Management 35 (4): 233-257.

Richey, R.C., and J.D. Klein. 2007. Design and Development Research. . Mahwah, NJ: Lawrence Erlbaum Associates, Publishers.

Riddalls, C., S. Bennett, and N. Tipi. 2000. "Modelling the Dynamics of Supply Chains." International Journal of Systems Science 31 (8): 969-76.

Ritchie, Jane, and Jane Lewis. 2003. Qualitative Research Practice: A Guide for Social Science Students and Researchers: SAGE Publications Limited.

Ritchie, L., B. Burnes, P. Whittle, and R. Hey. 2000. "The Benefits of Reverse Logistics: The Case of the Manchester Royal Infirmary Pharmacy." Supply Chain Management 5 (5): 226-233.

Rivera-Cruz, Marı´a del Carmen, Antonio Trujillo Narcı´a, Georgina Co´rdova Ballona, Josef Kohler, Fuensanta Caravaca, and Antonio Rolda´n. 2008. "Poultry Manure and Banana Waste Are Effective Biofertilizer Carriers for Promoting Plant

283

Growth and Soil Sustainability in Banana Crops." Soil Biology & Biochemistry 40 3092-3095.

RLEC, Reverse Logistics Executive Council. 2007. What Is Reverse Logistics? Accessed February 24, 2013, www.rlec.org/glossary.html.

Robert, Goodland. 1997. "Environmental Sustainability in Agriculture: Diet Matters." Ecological economics 23 (3): 189-200. doi: 10.1016/s0921-8009(97)00579-x.

Roberts, Edward B. 1976. "On Modelling." Technological Forecasting and Social Change 9 (1): 231-238.

Robinson, Stewart. 2006. "Conceptual Modeling for Simulation: Issues and Research Requirements" Proceedings of the 38th conference on Winter simulation: Winter Simulation Conference.

Robson, Colin. 2011. Real World Research: A Resource for Users of Social Research Methods in Applied Settings: Wiley Chichester.

Rodríguez, Juan M., José L. Fernández, Domingo Beato, Ramón Iturbe, Julio Usaola, Pablo Ledesma, and José R. Wilhelmi. 2002. "Incidence on Power System Dynamics of High Penetration of Fixed Speed and Doubly Fed Wind Energy Systems: Study of the Spanish Case." Power Systems, IEEE Transactions on 17 (4): 1089-1095.

Rogers, D.S., and R. Tibben-Lembke. 1999. Going Backwards: Reverse Logistics Trend and Practices. Pittsburgh, P A: RLEC Press.

———. 2001. "An Examination of Reverse Logistics Practices." Journal of Business Logistics 22 (2): 129-148.

Rogers, Dale S., Douglas M. Lambert, Keely L. Croxton, and Sebastián J. García-Dastugue. 2002. "The Returns Management Process." International Journal of Logistics Management, The 13 (2): 1-18.

Rosenau, W.V., D.Twede, M.A. Mazzeo, and S.P. Singh. 1996. "Returnable/Reusable Logistical Packaging: A Capital Budgeting Investment Decision Framework." Journal of Business Logistics 17 (2): 139-165.

Rubio, S. 2008. "Characteristics of the Research on Reverse Logistics (1995-2005)." International journal of production research 46 (4): 1099.

Rudberg, Martin, and Jan Olhager. 2003. "Manufacturing Networks and Supply Chains: An Operations Strategy Perspective." Omega 31 (1): 29-39.

Rushton, Alan, Phil Croucher, and Peter Baker. 2010. The Handbook of Logistics and Distribution Management: Kogan Page.

Sahay, B.S., Jatinder N.D. Gupta, and Ramneesh Mohan. 2006. "Managing Supply Chains for Competitiveness: The Indian Scenario." Supply Chain Management: An International Journal 11 (1): 15-24.

Saleque, M.A. 2009. Poultry Industry in Bangladesh: Current Status and Its Challenges and Opportunity. Emerging Market Environment. Poultry Business Directory 2009.

———. 2013. Bangladesh Poultry and Its Future, 12/06, Dhaka, Bangladesh.

Saleque, M.A., and S. Mustafa. 1997. "Landless Women and Poultry: The Brac Model in Bangladesh." In Human Development. Proceedings of a Workshop,, Denmark,

284

edited by F. Dolberg and Poul Henning Petersen (eds.), pp. 37-55.: Tune Landboskole.

Sands, Gary R., and Terence H. Podmorea. 2000. "A Generalized Environmental Sustainability Index for Agricultural Systems." Agriculture, Ecosystems and Environment 79: 29-41.

Sargent, Robert G. 2005. "Verification and Validation of Simulation Models" Proceedings of the 37th conference on Winter simulation: Winter Simulation Conference.

Sarkis, J. 2001. "Manufacturing’s Role in Corporate Environmental Sustainability." International Journal of Operations & Production Management 5 (6): 666-86.

Savitz, Andrew W. 2006. The Triple Bottom Line: How Today's Best-Run Companies Are Achieving Economic, Social and Environmental Success--and How You Can Too: Wiley. com.

Savitz, Andrew W., and K. Weber. 2006. The Triple Bottom Line. San Francisco, CA.: Jossey-Bass.

Sazzad, M.H. 1992. "Comparative Study on Egg Production and Feed Efficiency of Different Breeds of Poultry under Intensive and Rural Conditions in Bangladesh." Livestock Research for Rural Development 4 (3): 65-69.

Schaffernicht, Martin. 2007. "Causality and Diagrams for System Dynamics" Actas de la 50th International Conference of the System Dynamics Society, Boston,

Scheuring, J., B. Bras, and K.M. Lee. 1994. "Significance of Design for Disassembly in Integrated Disassembly and Assembly Processes." International Journal of Environmentally Conscious Design and Manufacturing 3 (2): 21-33.

Schuler, J., and H. Kachele. 2003. "Modelling on-Farm Costs of Soil Conservation Policies with Modam." Environmental science & Policy Sciences 6: 51-55.

Schwandt, T.A. 1994. "Constructivist, Interpretivist Approaches to Human Inquiry. Handbook of Qualitative Research." In Handbook of Qualitative Research, eds Norman K. Denzin and Yvonna S. Lincoln. U.S.: Sage Publications, Inc.

Schwartz, Marvin. 1991. Tyson: From Farm to Market. Vol. 2: University of Arkansas Press.

Scott, C., and R. Westbrook. 1991. "New Strategic Tools for Supply Chain Management." International Journal of Physical Distribution and Logistics 21 (1): 23-33.

Seelos, Christian, and Johanna Mair. 2005a. "Social Entrepreneurship: Creating New Business Models to Serve the Poor." Business Horizons 48 (3): 247-252. http://www.sciencedirect.com/science/article/B6W45-4F1H05G-2/2/e93e21012bd26ad0991e15b0e5de05cc.

———. 2007. "Profitable Business Models and Market Creation in the Context of Deep Poverty: A Strategic View." The academy of management perspectives 21 (4): 49-63.

Sein, Maung, Ola Henfridsson, Sandeep Purao, Matti Rossi, and Rikard Lindgren. 2011. "Action Design Research." MIS Quarterly 35 (1): 37-56.

Senanayake, R., and J. Sustain. 1991. "Sustainable Agriculture: Definitions and Parameters for Measurement." Journal of Sustainable Agriculture 1 (4): 7-28.

285

Senge, Peter M, and John D Sterman. 1992. "Systems Thinking and Organizational Learning: Acting Locally and Thinking Globally in the Organization of the Future." European journal of operational research 59 (1): 137-150.

Seuring, Stefan. 2004. "Emerging Issues in Life-Cycle Management." Greener Management International (45): 3-8. http://search.ebscohost.com/login.aspx?direct=true&db=buh&AN=20449327&site=ehost-live.

Seuring, Stefan, and Martin Muller. 2008a. "Core Issues in Sustainable Supply Chain Management-a Delphi Study." Business Strategy and the Environment 17 (8): 455-466. doi: 10.1002/bse.

———. 2008b. "From a Literature Review to a Conceptual Framework for Sustainable Supply Chain Management." Journal of cleaner production 16 (15): 1699-1710.

Shafie, Shahidan, and Md Nor Othman. 2006. "Halal Certification: An International Marketing Issues and Challenges" Proceeding at the International IFSAM VIIIth World Congress,

Shamsuddoha, Mohammad, and Mir Hossain Sohel. 2004. "Problems and Prospects of Poultry Industry of Bangladesh: A Study on Some Selected Areas." The Chittagong University Journal of Business Administration 19: 273-286.

———. 2008. "Poultry Rearing - an Alternative Income Generating Activity for Rural Women Development of Bangladesh." The Chittagong University Journal of Business Administration, Bangladesh 20 (1): 119-132.

Sharma, Sanjay, and Sanjaysingh Vijaysingh Patil. 2011. "Development of Holistic Framework Incorporating Collaboration, Supply-Demand Synchronization, Traceability and Vertical Integration in Agri-Food Supply Chain." International Journal of Information Systems and Supply Chain Management 4 (4): 18-45.

Sheth, J.N., and A. Parvatiyar. 1995. "Ecological Imperatives and the Role of Marketing " In Environmental Marketing: Strategies, Practice, Theory and Research. Polonsky, M.J. and New York, NY: Haworth Press.

Shih, J.C.H. 1993. "Recent Development in Poultry Waste Digestion and Feather Utilization: A Review." Poultry science 72 (9): 1617-1620.

Shoushtari, Kowsar Darivandi, Hossein Ghasemi, and Mansooreh Zarezadeh. 2011. "Analyzing and Improving Chicken Meat Supply Chain Using Beer's Vsm, Scor Model and Ackoff's Circular Organization." In 55th Annual Meeting of the International Society for the Systems Sciences (ISSS), Hull, UK. University of Hull Business School.

Shrader, Rod, and Donald S Siegel. 2007. "Assessing the Relationship between Human Capital and Firm Performance: Evidence from Technology‐Based New Ventures." Entrepreneurship Theory and Practice 31 (6): 893-908.

Shrivastava, P. 1995. "The Role of Corporations in Achieving Ecological Sustainability " Academy of Management Review 20 (4): 936-60.

Siddique, MAB, and MA Quaddus. 2011. "Sustainable Development and Corporate Sustainability: Basic Issues." Handbook of Corporate Sustainability: Frameworks, Strategies and Tools: 1-8.

Sikdar, Subhas K. 2003a. "Sustainable Development and Sustainability Metrics." AIChE journal 49 (8): 1928-1932.

286

Sikdar, Subhas K. 2003b. "Sustainable Development and Sustainability Metrics." AIChE journal 49 (8): 1928.

———. 2007. "Sustainability and Recycle–Reuse in Process Systems." Clean Technologies and Environmental Policy 9 (3): 167-174.

Simon, H. 1969. The Sciences of the Artificial. Cambridge: MIT Press.

Simon, Herbert A. 1979. "Rational Decision Making in Business Organizations." The American economic review 69 (4): 493-513.

Simon, Herbert Alexander. 1982. Models of Bounded Rationality: Empirically Grounded Economic Reason. Vol. 3: MIT press.

Smith, G.C. 2001. "Increasing Value in the Supply Chain" 81st Annual Conference of the Canadian Meat Council Vancouver, British Columbia,

Son, Young-Jun, and Jayendran Venkateswaran. 2007. "Hierarchical Supply Chain Planning Architecture for Integrated Analysis of Stability and Performance." International Journal of Simulation and Process Modelling 3 (3): 153-169.

Sonaiya, E.B. 2007. "Family Poultry, Food Security and the Impact of Hpai." World's Poultry Science Journal 63 (1): 132-138.

Spengler, T., and M. Schröter. 2003. "Strategic Management of Spare Parts in Closed-Loop Supply Chains - a System Dynamics Approach." Interfaces 33 (6): 7-17.

Srinivas, Hari. 2007. The 3r Concept and Waste Minimization. Accessed 10/02/2011, http://www.gdrc.org/uem/waste/3r-minimization.html.

Starik, M., and G.P. Rands. 1995. "Weaving an Integrated Web: Multilevel and Multisystem Perspectives of Ecologically Sustainable Organizations." Academy of Management Review 20 (4): 908-35.

Starkowsky, Joan M., Richard M. Spicer, and Randy Riddell. 2009. "Reverse Logistics Process." Google Patents.

Stephan, Klaas E, Lee M Harrison, Stefan J Kiebel, Olivier David, Will D Penny, and Karl J Friston. 2007. "Dynamic Causal Models of Neural System Dynamics: Current State and Future Extensions." Journal of biosciences 32 (1): 129-144.

Sterman, John D. 1989. "Modeling Managerial Behavior: Misperceptions of Feedback in a Dynamic Decision Making Experiment." Management Science 35 (3): 321-339.

———. 2000. Business Dynamics: Systems Thinking and Modeling for a Complex World. Boston: Irwin McGraw-Hill.

———. 2001. "System Dynamics Modeling." California management review 43 (4): 8-25.

———. 2006. Operational and Behavioural Causes of Supply Chain Instability. Edited by O. Carranza and F. Villegas, The Bullwhip Effect in Supply Chain. New York, NY: Palgrave Macmillan.

Sterman, John D., John D.W. Morecroft, Diane Asay, Peter Senge, Jay Forrester, Norman Bodek, and Arie P. Foreword By-de Geus. 1994. Modeling for Learning Organizations. New York, USA: Productivity Press.

Stevenson, Mark, and Martin Spring. 2007. "Flexibility from a Supply Chain Perspective: Definition and Review." International Journal of Operations & Production Management 27 (7): 685-713.

287

Stevenson, Richard. 1994. "Strategic Business Process Engineering: A Systems Thinking Approach Using I Think" Software assistance for business re-engineering: John Wiley and Sons Ltd.

Stewart, David W, Prem N Shamdasani, and Dennis W Rook. 2007. Focus Groups: Theory and Practice. Vol. 20: Sage.

Stock, J., T. Speh, and H. Shear. 2002. "Many Happy (Product) Returns." Harvard Business Review 80 (7): 16-17.

Stock, J.R. 1998. "Development and Implementation of Reverse Logistics Programs" Council of Logistics Management, Lombard, IL.,

Stock, James H., and Mark W. Watson. 2003. "Has the Business Cycle Changed and Why?" In Nber Macroeconomics Annual 2002, Volume 17, 159-230. MIT press.

Stockle, Claudio O., Steve A. Martin, and Gaylon S. Campbell. 1994. "Cropsyst, a Cropping Systems Simulation Model: Water/Nitrogen Budgets and Crop Yield." Agricultural systems 46 (3): 335-359.

Storey, M.A.D., F. David Fracchia, and Hausi A. Müller. 1999. "Cognitive Design Elements to Support the Construction of a Mental Model During Software Exploration." Journal of Systems and Software 44 (3): 171-185.

Straub, Detmar, Marie-Claude Boudreau, and David Gefen. 2004. "Validation Guidelines for Is Positivist Research." Communications of the Association for Information Systems 13 (24): 380-427.

Sundin, Elisabeth. 2011. "Entrepreneurship and Social and Community Care." Journal of Enterprising Communities: People and Places in the Global Economy 5 (3): 212-222.

Svensson, G. 2007. "Aspects of Sustainable Supply Chain Management (Sscm): Conceptual Framework and Empirical Example." Supply Chain Management 12 (4): 262-266.

Swaminathan, Jayashankar M, Stephen F Smith, and Norman M Sadeh. 1998. "Modeling Supply Chain Dynamics: A Multiagent Approach*." Decision sciences 29 (3): 607-632.

Sweeney, Linda Booth, and John D. Sterman. 2000. "Bathtub Dynamics: Initial Results of a Systems Thinking Inventory." System Dynamics Review 16 (4): 249-286.

Syahruddin, Normansyah. 2013. "Sustainable Supply Chain Management: A Case Study of Indonesia's Cocoa Industry." Bulletin of Indonesian Economic Studies 49 (1): 114-115.

Tan, Keah Choon. 2001. "A Framework of Supply Chain Management Literature." European Journal of Purchasing & Supply Management 7: 39-48.

———. 2002. "Supply Chain Management: Practices, Concerns, and Performance Issues." Journal of Supply Chain Management 38 (1): 42-53.

Taylor, Beverley Joan, Stephen Kermode, and Kathryn Louise Roberts. 2006. Research in Nursing and Health Care: Evidence for Practice: Cengage Learning Australia.

Teece, David J. 2010. "Business Models, Business Strategy and Innovation." Long range planning 43 (2): 172-194.

288

Thomas, Duncan C. 1995. "Re: “When Will Non-Differential Misclassification of an Exposure Preserve the Direction of a Trend?’." American journal of epidemiology 142 (7): 782-783.

Tibben-Lembke, R.S. 2002. "Life after Death: Reverse Logistics and the Product Life Cycle." International Journal of Physical Distribution & Logistics Management 32 (3): 223-244.

Tibben-Lembke, R.S., and D.S. Rogers. 2002. "Differences between Forward and Reverse Logistics in a Retail Environment." Supply Chain Management 7 (5): 271.

Tilman, David, Kenneth G. Cassman, Pamela A. Matson, Rosamond Naylor, and Stephen Polasky. 2002. "Agricultural Sustainability and Intensive Production Practices." Nature 418 (6898): 671-677.

Tilman, David, Joseph Fargione, Brian Wolff, Carla D'Antonio, Andrew Dobson, Robert Howarth, David Schindler, William H. Schlesinger, Daniel Simberloff, and Deborah Swackhamer. 2001. "Forecasting Agriculturally Driven Global Environmental Change." Science 292 (5515): 281-284.

Tilman, David, David Wedin, and Johannes Knops. 1996. "Productivity and Sustainability Influenced by Biodiversity in Grassland Ecosystems."

Tipnis, Vijay A. 1993. "Evolving Issues in Product Life Cycle Design:(How to Design Products That Are Environmentally Safe to Manufacture/Assemble, Distribute, Use, Service/Repair, Discard/Collect, Disassemble, Recycle/Recover, and Dispose?)." CIRP Annals-Manufacturing Technology 42 (1): 169-173.

Toffel, M.W. 2003. "The Growing Strategic Importance of End-of-Life Product Management." California Management Review 45 (3): 102-129.

Towill, Denis R. 1996. "Industrial Dynamics Modelling of Supply Chains." Logistics Information Management 9 (4): 43-56.

Tress, Bärbel, Gunther Tress, and Gary Fry. 2006. "Defining Concepts and the Process of Knowledge Production in Integrative Research." From landscape research to landscape planning: 13-26.

Tsoulfas, Giannis T., and Costas P. Pappis. 2006. "Environmental Principles Applicable to Supply Chains Design and Operation." Journal of Cleaner Production 14: 1593-1602.

Uchitelle, Louis. 2001. "How to Define Poverty? Let Us Count the Ways." New York Times 26.

Uthes, S., C. Sattler, F.J. Reinhardt, A. Piorr, P. Zander, K. Happe, M. Damgaard, and A. Osuch. 2008. "Ecological Effects of Payment Decoupling in a Case Study Region in Germany." Journal of Farm Management (13): 219-230.

Vachon, Stephan, and Robert D. Klassen. 2008. "Environmental Management and Manufacturing Performance: The Role of Collaboration in the Supply Chain." International Journal of Production Economics 111 (2): 299-315.

Vachon, Stephan, and Z. Mao. 2008. "Linking Supply Chain Strength to Sustainable Development: A Country-Level Analysis." Journal of Cleaner Production 16: 1552e1560.

Van de Vorst, J.G.A.J., A.J.M. Beulens, and P. Van Beek. 2000. "Modelling and Simulating Multi-Echelon Food Systems." European Journal of Operational Research 122 (2): 354-66.

289

Van der Aalst, Wil M.P., Joyce Nakatumba, Anne Rozinat, and Nick Russell. 2010. "Business Process Simulation." In Handbook on Business Process Management 1, 313-338. Springer.

Vazquez, Margarita, Manuel Liz, and Javier Aracil. 1996. "Knowledge and Reality: Some Conceptual Issues in System Dynamics Modeling." System dynamics review 12 (1): 21-37.

Veldkamp, A., and L.O. Fresco. 1996. "Clue-Cr: An Integrated Multi-Scale Model to Simulate Land Use Change Scenarios in Costa Rica." Ecological modelling 91 (1): 231-248.

Venable, John R. 2010. "Design Science Research Post Hevner Et Al.: Criteria, Standards, Guidelines, and Expectations." In Global Perspectives on Design Science Research, 109-123. Springer.

Venable, John R. 2006a. "A Framework for Design Science Research Activities " In Information Resource Management Association Conference, Washington, DC, USA.

———. 2006b. "The Role of Theory and Theorising in Design Science Research." In 1st International Conference on Design Science (DESRIST), Claremont, California, USA, edited by A. Hevner and S. Chatterjee.

Venkataraman, Sankaran. 2002. "The Distinctive Domain of Entrepreneurship Research." Edward Elgar Press.

Vensim. 1999. "Users Manual, Ventana Systems." Inc.

Vieira, M, RS Gates, I Tinôco, DC Cassuce, BM Santos, and G Costa. 2012. "Analysis of Quality of Health of Different Broiler Litter Reused Sequentially" The Ninth International Livestock Environment Symposium (ILES IX). International Conference of Agricultural Engineering-CIGR-AgEng 2012: Agriculture and Engineering for a Healthier Life, Valencia, Spain, 8-12 July 2012.: CIGR-EurAgEng.

Villegas, F.A., and N.R. Smith. 2006. "Supply Chain Dynamics: Analysis of Inventory Vs. Order Oscillations Trade-Off." International Journal of Production Research 44 (6): 1037-1054.

Vlachos, Dimitrios, Patroklos Georgiadis, and Eleftherios Iakovou. 2007. "A System Dynamics Model for Dynamic Capacity Planning of Remanufacturing in Closed-Loop Supply Chains." Computers & Operations Research 34 (2): 367-394.

Vo, Thi Le Hoa, and Daniel Thiel. 2011. "Economic Simulation of a Poultry Supply Chain Facing a Sanitary Crisis." British Food Journal 113 (8 ): 1011 - 1030. doi: http://dx.doi.org/10.1108/00070701111153760.

Vonderembse, M.A., M. Uppal, S.H. Huang, and J.P. Dismukes. 2006. "Designing Supply Chains: Towards Theory Development." International Journal of Production Economics 100 (2): 223-38.

Vorst, Jack G.A.J. van der, Carlos A. da Silva, and Jacques H. Trienekens. 2007. Agro-Industrial Supply Chain Management: Concepts and Applications. Rome.

Vries, M. De, and I.J.M. De Boer. 2010. "Comparing Environmental Impacts for Livestock Products: A Review of Life Cycle Assessments." Livestock Science 128: 1-11.

Wagner, Joachim. 2003. "Testing Lazear's Jack-of-All-Trades View of Entrepreneurship with German Micro Data." Applied Economics Letters 10 (11): 687-689.

290

Wakeford, Jeremy J. 2012. "Socioeconomic Implications of Global Oil Depletion for South Africa: Vulnerabilities, Impacts and Transition to Sustainability." Stellenbosch: Stellenbosch University.

Wang, Fei-Yue, Kathleen M. Carley, Daniel Zeng, and Wenji Mao. 2007. "Social Computing: From Social Informatics to Social Intelligence." Intelligent Systems, IEEE 22 (2): 79-83.

Wang, Z.M., B. Zhang, X.Y. Li, K.S. Song, D.W. Liu, and S.Q. Zhang. 2006. "Using Cropsyst to Simulate Spring Wheat Growth in Black Soil Zone of Northeast China." Pedosphere 16: 354-361.

Ward, Lynette. 2002. "Environmental Policies for a Sustainable Poultry Industry in Sussex County, Delaware." Engineering Department, University of Delaware, Delaware.

Ware Jr, John E., Mark Kosinski, and Susan D. Keller. 1996. "A 12-Item Short-Form Health Survey: Construction of Scales and Preliminary Tests of Reliability and Validity." Medical care 34 (3): 220-233.

WCED. 1987. Our Common Future (the Brundtland Report), Chapter 2: Towards Sustainable Development. New York, NY.

Weaver, Kathryn, and Joanne K Olson. 2006. "Understanding Paradigms Used for Nursing Research." Journal of Advanced Nursing 53 (4): 459-469.

Welford, R. 1999. "Life Cycle Assessment." In Corporate Environmental Management 1: Systems and Strategies. London: Earthscan Publications.

Welsh, Rick, and Bryan Hubbell. 1999. "Contract Hog Production and Environmental Management in the Southern United States." Agronomy Journal 91 (6): 883-888.

Whiteman, Gail, and William H Cooper. 2000. "Ecological Embeddedness." Academy of Management Journal 43 (6): 1265-1282.

Whitten, Jeffrey, Lonnie Bentley, and Victor Barlow. 1994. "Systems Analysis and Design Methods. Burr Ridge, Il: Richard D. Irwin." Inc.

Wholey, Joseph S., Harry P. Hatry, and Kathryn E. Newcomer. 2010. Handbook of Practical Program Evaluation. Vol. 19: Jossey-Bass.

Wilkes, Gerald Alfred, and William Alwyn Krebs. 1995. Collins English Dictionary: An Extensive Coverage of Contemporary International and Australian English: HarperCollinsPublishers.

Wilkins, Marc R., Ron D. Appel, Jennifer E. Van Eyk, Maxey Chung, Angelika Görg, Michael Hecker, Lukas A. Huber, Hanno Langen, Andrew J. Link, and Young‐Ki Paik. 2006. "Guidelines for the Next 10 Years of Proteomics." Proteomics 6 (1): 4-8.

Williams, Ann W., John E. Ware Jr, and Cathy A. Donald. 1981. "A Model of Mental Health, Life Events, and Social Supports Applicable to General Populations." Journal of Health and Social Behavior: 324-336.

Williams, Bob, and Richard Hummelbrunner. 2010. Systems Concepts in Action: A Practitioner's Toolkit: Stanford Business Books.

Williams, Eric, Ramzy Kahhat, Braden Allenby, Edward Kavazanjian, Junbeum Kim, and Ming Xu. 2008. "Environmental, Social, and Economic Implications of Global Reuse and Recycling of Personal Computers." Environmental Science & Technology 42 (17): 6446-6454.

291

Williams, R.B. 1999. "A Compartmentalised Model for the Estimation of the Cost of Coccidiosis to the World's Chicken Production Industry." International Journal for Parasitology 29 (8): 1209-1229.

Winter, M.C., D.H. Brown, and P.B. Checkland. 1995. "A Role for Soft Systems Methodology in Information Systems Development." European Journal of Information Systems 4 (3): 130-142.

Wise, Richard, and Peter Baumgartner. 1999. "Go Downstream." Harvard Business Review 77 (5): 133-141.

Wisner, Benjamin. 2004. At Risk: Natural Hazards, People's Vulnerability and Disasters: Psychology Press.

Witte, John S., and Sander Greenland. 1996. "Simulation Study of Hierarchical Regression." Statistics in medicine 15 (11): 1161-1170.

Wojanowski, Rico, Vedat Verter, and Tamer Boyaci. 2007. "Retail–Collection Network Design under Deposit–Refund." Computers & operations research 34 (2): 324-345.

Wolstenholme, Eric F. 1985. "A Methodology for Qualitative System Dynamics" SYSTEM DYNAMICS 1985 INTERNATIONAL SYSTEM DYNAMICS CONFERENCE,

———. 1990. System Enquiry: A System Dynamics Approach. New York, USA: John Willey & Sons.

———. 1999. "Qualitative Vs Quantitative Modelling: The Evolving Balance." Journal of the Operational Research Society: 422-428.

Wolstenholme, Eric F., and R. Geoffrey Coyle. 1983. "The Development of System Dynamics as a Methodology for System Description and Qualitative Analysis." Journal of the Operational Research Society: 569-581.

Wossink, G.A.A., A.G.J.M Oude Lansink, and P.C. Struik. 2001. "Nonseparability and Heterogeneity in Integrated Agronomic-Economic Analysis of Nonpoint-Source Pollution." Ecological Economics 38: 345-357.

Wycherley, Ian. 1999. "Greening Supply Chains: The Case of the Body Shop International." Business Strategy and the Environment 8 (2): 120-127.

Xfinity. 2013. The Daily Beast: World’s Fastest Growing Cities. Accessed February 06, 2013, http://xfinity.comcast.net/slideshow/news-worldsfastestgrowingcities/7/.

Yang, Qingsong. 2004. "Model-Based and Data Driven Fault Diagnosis Methods with Applications to Process Monitoring." Case Western Reserve University.

Yates, Dan, David Moore, and Daren S Starnes. 2002. The Practice of Statistics: Ti-83/89 Graphing Calculator Enhanced. New York, USA: Macmillan.

Yin, Robert K. 2011. Applications of Case Study Research: Sage.

Yin, Robert K. 1994. Case Study Research: Design and Methods. Vol. 2nd ed. Newbury Park, CA: Sage.

———. 2003. Case Study Research: Design and Methods. Vol. 5th Ed.: Sage.

———. 2009. Case Study Research: Design and Methods.

Young, A., and A. Kielkiewicz-Young. 2001. "Sustainable Supply Network Management." Corporate Environmental Strategy 8 (3): 260-8.

292

Yunus, Muhammad. 2007. Creating a World without Poverty: Social Business and the Future of Capitalism: PublicAffairs Store.

Zainol, Fakhrul Anwar, and Wan Norhayate Wan Daud. 2011. "Indigenous (“Bumiputera”) Malay Entrepreneurs in Malaysia: Government Supports, Entrepreneurial Orientation and Firms Performances." International Business and Management 2 (1): 86-99.

Zander, P., and H. Ka¨chele. 1999. "Modelling Multiple Objectives of Land Use for Sustainable Development." Agricultural Systems 59 (59): 311-325.

Zavodska, Anita. 2000. "A Comparative Study on Residential Solid Waste Management in Selected Developing and Developed Countries: Guyana and United States."

Zebda, Awni. 2002. "Using Cost-Benefit Analysis for Evaluating Decision Models in Operational Research." Journal of American Academy of Business, September: 106-114.

Zeigler, Bernard P., Herbert Praehofer, and Tag Gon Kim. 2000. Theory of Modeling and Simulation: Integrating Discrete Event and Continuous Complex Dynamic Systems: Academic press.

Zhu, Qinghua, Yong Geng, and Kee‐hung Lai. 2011. "Environmental Supply Chain Cooperation and Its Effect on the Circular Economy Practice‐Performance Relationship among Chinese Manufacturers." Journal of Industrial Ecology 15 (3): 405-419.

Zhu, Qinghua, and Joseph Sarkis. 2006. "An Inter-Sectoral Comparison of Green Supply Chain Management in China: Drivers and Practices." Journal of Cleaner Production 14 (5): 472-486.

Zhu, Qinghua, Joseph Sarkis, and Kee-hung Lai. 2007. "Initiatives and Outcomes of Green Supply Chain Management Implementation by Chinese Manufacturers." Journal of Environmental Management 85 (1): 179-189.

———. 2008. "Confirmation of a Measurement Model for Green Supply Chain Management Practices Implementation." International journal of production economics 111 (2): 261-273.

Zikmund, W.G., and W.J. Stanton. 1971. "Recycling Solid Wastes: A Channels of Distribution Problem " Journal of Marketing 35: 34-9.

Zink, Klaus J. 2007. "From Total Quality Management to Corporate Sustainability Based on a Stakeholder Management." Journal of Management History 13 (4): 394-401.

Zsidisin, G.A., and S.P. Siferd. 2001. "Environmental Purchasing: A Framework for Theory Development." European Journal of Purchasing & Supply Management 7 (1): 61-73.

293

APPENDICES

Appendix A: The Bangladesh Poultry Model in SLDP (Dolberg, Mallorie, and Brett

2002)

294

Appendix B: System Dynamics Modelling Approach in “SD-based” Research

Define problem

Gather approximate knowledge

On database from Real

perspectives

Define bounds of

system

Identify key problem

variables that represent

the system

Identify which variables

can be depicted as

stocks, converters and flows

Connect the flows to stocks

and converters to flows

based on corrected

conceptual knowledge

database

Assign initial

values to stocks

Define empirical

relationships

governing the system

of stocks and flows

Connect the flows to stocks and

converters to flows based on

conceptual knowledge database

Evaluate knowledge are

acceptable

database to connect

stocks and flows

Refine empirical

relationships or

parameters governing the

system of stocks and flows

Define parameters,

run the model

Run Scenarios

Knowledge database iscorrect

Model resultsare acceptable

False

TrueFa

lse

True

Figure: System Dynamics Modelling Approach (Jutla, Elshorbagy, and Kells 2006)

295

Appendix C: List of Variables with Units and Equations Used

Level Variables

1. Broiler Chicken = INTEG (Chicken Supply-Consumed, 0), Units: Chicken

2. Eggs = INTEG (Broken Eggs Rate + Eggs Produced - Eggs to Hatchery-Broken

Eggs Rate, 0), Units: Eggs

3. Farmers = INTEG (Farm In-Chicken Mortality Rate-Retail Rate, 0), Units:

Chicken

4. Feather = INTEG (Feather Collection-Feather Dumped, 0), Units: Kg

5. Hatchery = INTEG (Eggs to Hatchery-Eggs Hatching - Eggs Drain Out-Unhatched

Eggs Rate, 0), Units: Eggs

6. Intestine = INTEG (Intestine Collected-Intestine Dumped, 0), Units: Kg

7. Mature Parent = INTEG (Parent Maturing Rate - Culled Parent Rate-Deaths -

Parent No Longer Productive, Initial Mature Parent), Units: Parent

8. Mature Parent Capacity = INTEG (New Mature Parent Capacity, Initial Mature

Parent Capacity) Units: Parent

9. Middlemen = INTEG (Retail Rate-Chicken Supply, 0), Units: Chicken

10. Parent Chicks = INTEG (Parent Chicks Rate - Aggregate Policy Impact-Parent

Maturing Rate, Initial Parent Chicks), Units: Parent

11. Total Employment = Max (1500, (Farmers Empl + Biogas Empl + Middlemen

Empl + Fertilizer Empl + Fish Feed Empl +Hatchery Empl + Mature Parent Empl

+ Parent Chicks Empl + Chicks Dist Empl)), Units: Persons/Week

Auxiliary, Constants and Data Variables

12. Adjustment Time for Mature Parent Capacity = 4, Units: Week, RANDOM

NORMAL (3, 4, 3.5, 0.1, 100)

13. Age and Culled Parent = (Aged Parent + Culled Parent) * "Intestine/Parent",

Units: Kg/Week, Intestines from Aged and Culled Birds

14. Aged Parent = Parent No Longer Productive, Units: Parent/Week

15. Aggregate Policy Rate = (Policy Variable * Policy Impact Rate/Tenure) * PULSE

TRAIN (34 , Tenure , 68, 1000), Units: 1/Week

16. Average Chicks Price = 0.75, Units: AUD/Chicks, 50 taka = 1 chicks * 7 days/70

17. Average Cost Per Week = 0.9, Units: AUD/Parent/Week, 900 taka/23 weeks +

3000/42,RANDOM UNIFORM (1, 1.2, 1000)

296

18. Average Litter Rate = 0.00441, Units: Ton/Parent/Week, Daily=0.00063,

Weekly = 0.00063 * 7 = 0.00441

19. Average Meat Price = 3.5, Units: AUD/Parent, AUD 1 equals to 70 BDT

(Approximately), RANDOM UNIFORM (3.2, 3.8, 1000)

20. Average Parent Chicks Costs Per Week = 0.325, Units: AUD/Parent/Week,

RANDOM UNIFORM (0.3, 0.35, 1000)

21. Average Productive Life = 42, Units: Week, Maximum time of laying eggs is 40

weeks, Average Productive Life of Mature Parent

22. BGER = 0.0001, Units: Person/Cubic Metre, Biogas Employment Rate

23. BICT = 4, Units: Week, Broiler Intestine Collection Time

24. Biogas = Poultry Litter * Litter for Biogas * Biogas Conversion Rate, Units: Cubic

Metre/Week

25. Biogas Conversion Rate = 71, Units: Cubic Metre/Ton

26. Biogas Empl (Employment) = Max (5, (Biogas * BGER)), Units: Person/Week

27. Broiler Chicken = INTEG (Chicken Supply-Consumed,0), Units: Chicken

28. Broiler Feather = (Broiler Chicken * Broiler Feather Collection Rate)/Time to

Collect, Units: Kg/Week

29. Broiler Feather Collection Rate = 0.102, Units: Kg/Chicken/Week

30. Broiler Intestine = (Broiler Chicken*"Intestine/Broiler")/BICT, Units: Kg/Week

31. Broken Eggs = Broken Eggs Rate, Units: Eggs/Week

32. Broken Rate = 0.035, Units: 1/Week, RANDOM UNIFORM (0.03, 0.04, 1212)

33. CDER = 0.0002, Units: Persons/Chicks, Chicks Distribution Employment Rate

34. Chickens Maturing for Market = Farmers/Time to Mature Chicken, Units:

Chicken/Week

35. Chicks = Eggs Hatching * Hatching Percentage, Units: Chicks/Week

36. Chicks Dist Empl = Chicks * CDER, Units: Person/Week

37. Chicks enter to Broiler Farms = 0.995, Units: Dmnl, RANDOM UNIFORM(

0.995,0.997, 1212 )

38. Competitor Action = 1, Units: Dmnl

39. Consumption Rate = 1, Units: 1/Week

40. Cost of Parent Chicks Per Week = Parent Chicks * Average Parent Chicks Costs

Per Week, Units: AUD/Week

41. Cost Per Mature Parent Per Week = Mature Parent * Average Cost Per Week,

Units: AUD/Week

42. Culled Parent = Culled Parent Rate, Units: Parent/Week

297

43. Culled Per Week = 0.005, Units: Dmnl/Week

44. Deaths Due to Disaster = Natural Disaster*PULSE TRAIN( 0,0,0,1000 ), Units:

Dmnl

45. Deaths Rate = 0.1, Units: Dmnl

46. Deaths Rate due to Disease = (Deaths Rate/Fraction Week)*PULSE TRAIN( 10,

Fraction Week , 80 , 1000), Units: 1/Week

47. Decision to Purchase Parent Chicks = Max(0,(Effect of the Ratio of Mature

Parent to Capacity on New Orders * Gap in Desired to Mature Parent)/Time to

Make Purchasing Decision), Units: Parent/Week (Max(0,(Effect of the Ratio of

Mature Parent to Capacity on New Orders * Gap in Desired to Mature

Parent)))/Time to Make Purchasing Decision

48. Desired Capacity = Mature Parent Capacity * Effect of Profits Ratio on Capacity,

Units: Parent

49. Desired Mature Parent = Mature Parent Capacity, Units: Parent

50. Desired Profits = 150000, Units: AUD/Week

51. Effect of Profits Ratio on Capacity= WITH LOOKUP (Ratio of Profits to Desired

Profits, ([(0,0)-(3,2)],(0,1),(1,1),(1.2,1.1),(2,1.2))), Units: Dmnl

52. Effect of the Ratio of Mature Parent to Capacity on New Orders = WITH LOOKUP

(Ratio of Mature Parent to Capacity, ([(0,0)-

(1.25,2)],(0,1),(0.25,1),(0.5,1.1),(0.75,1.2),(0.85,1.1),(0.95,1.05),(1,1),(1.2,0.85)

)), Units: Dmnl

53. Eggs Drain out due to Low Demand = Eggs Drain Out, Units: Eggs/Week

54. Eggs Drain Rate = PULSE TRAIN( 0, 0 , 0 , 1000 ), Units: Dmnl

55. Eggs Per Chicken Per Week = RANDOM UNIFORM (4.1 , 4.3 , 1212), Units:

Eggs/Parent/Week, 175 to 182 Eggs in 42 Weeks, RANDOM UNIFORM( 4.1 , 4.3

, 1212 )

56. Eggs Supply to Bakery = Broken Eggs + Unhatched Eggs + Eggs Drain out due to

Low Demand, Units: Eggs/Week

57. FAER = 0.001, Units: Persons/Chicken/Week, Farmers Employment Rate

58. Farmers Empl = Farmers*FAER, Units: Person/Week, Farmers Employment

59. Feather Dumped Rate = 1, Units: Dmnl/Week

60. FER = 0.0002, Units: Persons/Ton, Fertilizer Employment Rate

61. Fertilizer = Poultry Litter*Litter for Fertilizer*Fertilizer Conversion Rate Units:

Ton/Week

62. Fertilizer Conversion Rate = 0.015, Units: Dmnl, Fertilizer Conversion Rate

298

63. Fertilizer Empl = Max (3, (Fertilizer * FER)), Units: Person/Week

64. FFER = 0.01, Units: Persons/Ton, Fish Feed Employment Rate

65. Finance = 1, Units: Dmnl

66. Fish Feed = Poultry Litter * Litter for Feed * Fish Feed Conversion Rate Units:

Ton/Week

67. Fish Feed Conversion Rate = 0.025, Units: Dmnl

68. Fish Feed Empl = Max (2, (Fish Feed * FFER)), Units: Person/Week

69. Fraction Drain Out = 1e-007, Units: 1/Week

70. Fraction Loss = 0.005, Units: Dmnl

71. Fraction Mortality = 0.04, Units: Dmnl/Week, RANDOM UNIFORM( 0.03,0.06,

1012 )

72. Fraction Week = 10, Units: Week

73. Gap in Desired to Mature Parent = Desired Mature Parent - (Mature Parent),

Units: Parent, Max(25000,(Desired Mature Parent - (Mature Parent))) or

Desired Mature Parent - (Mature Parent)

74. Gap in Mature Parent Capacity to Desired Parent Capacity = Desired Capacity-

Mature Parent Capacity, Units: Parent

75. Govt Policy = 1, Units: Dmnl

76. Hatchery Empl = Max(100,(Hatchery * HER)), Units: Person/Week, Hatchery

Employment

77. Hatchery In Rate = 0.99, Units: Dmnl/Week

78. Hatching Percentage = 0.84, Units: Chicks/Eggs, RANDOM UNIFORM (0.84, 0.87,

1212)

79. HER = 0.00015, Units: Persons/Eggs/Week, Hatchery Employment Rate

80. Initial Mature Parent = 150000, Units: Parent

81. Initial Mature Parent Capacity = 200000, Units: Parent

82. Initial Parent Chicks = 120000, Units: Parent

83. Intestine Dumped Rate = 1, Units: 1/Week

84. "Intestine/Broiler" = 0.062, Units: Kg/Chicken

85. "Intestine/Parent" = 0.088, Units: Kg/Parent

86. Litter for Biogas = 0.9, Units: Dmnl

87. Litter for Feed = 0.05, Units: Dmnl

88. Litter for Fertilizer = 0.05, Units: Dmnl

89. Market Demand = 1, Units: Dmnl

299

90. Mature Parent Empl = Mature Parent * MPER, Units: Person/Week, Mature

Parent Employment

91. MER = 0.0002, Units: Persons/Chicken/Week, Middlemen Employment Rate

92. Middlemen Empl = Max (100,(Middlemen * MER * Staff Per Middlemen)), Units:

Person/Week, Middlemen Employment

93. MPER = 0.002, Units: Persons/Parent/Week, Mature Parent Employment Rate

94. Natural Disaster = 1, Units: Dmnl

95. Other Costs = 0.15, Units: AUD/Week

96. Parent Chicks = INTEG (Parent Chicks Rate - Aggregate Policy Impact-Parent

Maturing Rate, Initial Parent Chicks), Units: Parent

97. Parent Chicks Empl = Parent Chicks * PCER, Units: Persons/Week

98. Parent Feather = (Mature Parent * Parent Feather Collection Rate)/Time to

Collect Feather, Units: Kg/Week

99. Parent Feather Collection Rate = 0.145, Units: Kg/Parent/Week

100. Parent Intestine = ("Intestine/Parent" * (Mature Parent/PICT)) + Age and

Culled Parent, Units: Kg/Week

101. PCER = 0.001, Units: Persons/Parent/Week, Parent Chicks Employment Rate

102. PICT = 65, Units: Week, Parent Intestine Collection Time

103. Policy Impact Rate = 0.05, Units: Dmnl

104. Policy Variable = Competitor Action * Govt Policy * Market Demand * Finance,

Units: Dmnl

105. Poultry Litter = Mature Parent * Average Litter Rate, Units: Ton/Week

106. Profits = Total Sales-Total Cost, Units: AUD/Week

107. Ratio of Mature Parent to Capacity = Mature Parent/Mature Parent Capacity,

Units: Dmnl

108. Ratio of Profits to Desired Profits = Profits/Desired Profits, Units: 1

109. Sell Parent as Meat = (Aged Parent + Culled Parent) * Average Meat Price Units:

AUD/Week

110. Staff Per Middlemen = 4, Units: Dmnl, RANDOM UNIFORM (4, 10, 50)

111. Tenure = 12, Units: Week

112. Time for Eggs to Hatch = 3, Units: Week

113. Time Middlemen Hold Chickens = 1, Units: 1/Week, RANDOM UNIFORM

(0.995,0.997, 1212 )

114. Time to Collect = 4, Units: Dmnl

115. Time to Collect Feather = 26, Units: Dmnl

300

116. Time to Make Purchasing Decision = 8, Units: Week

117. Time to Mature Chicken = 4, Units: Week

118. Time to Mature Parent = 24, Units: Week, How long it takes for chicks to

become Mature Poultry

119. Total Cost = Cost of Parent Chicks Per Week + Cost Per Mature Parent Per Week

+ Other Costs, Units: AUD/Week

120. Total Parent = Mature Parent + Parent Chicks, Units: Parent

121. Total Sales = Chicks * Average Chicks Price + Sell Parent as Meat, Units:

AUD/Week

122. Unhatched Eggs = Unhatched Eggs Rate, Units: Eggs/Week

123. Unhatched Rate = 0.15, Units: 1/Week, RANDOM UNIFORM (0.15, 0.16, 12)

Rates

124. Aggregate Policy Impact = Parent Chicks * Aggregate Policy Rate, Units:

Parent/Week

125. Broken Eggs Rate = Eggs * Broken Rate, Units: Eggs/Week

126. Chicken Mortality Rate = Farmers * Fraction Mortality, Units: Chicken/Week

127. Chicken Supply = Middlemen * Time Middlemen Hold Chickens, Units:

Chicken/Week

128. Consumed = Broiler Chicken * Consumption Rate, Units: Chicken/Week

129. Culled Parent Rate = Mature Parent * Culled Per Week, Units: Parent/Week

130. Deaths = Deaths Rate due to Disease * Mature Parent * Deaths Due to Disaster,

Units: Parent/Week

131. Eggs Hatching = Hatchery/Time for Eggs to Hatch, Units: Eggs/Week

132. Eggs Produced = Mature Parent * Eggs Per Chicken Per Week, Units: Eggs/Week

133. Eggs to Hatchery = Eggs * Hatchery In Rate, Units: Eggs/Week

134. Eggs Drain Out = Fraction Drain Out * Eggs Drain Rate * Hatchery, Units:

Eggs/Week

135. Farm In = Chicks * Chicks enter to Broiler Farms, Units: Chicken/Week

136. Feather Collection = Broiler Feather + Parent Feather, Units: Kg/Week

137. Feather Dumped = Feather * Feather Dumped Rate, Units: Kg/Week

138. Intestine Collect = Broiler Intestine + Parent Intestine, Units: Kg/Week

139. Intestine Dumped = Intestine * Intestine Dumped Rate, Units: Kg/Week

301

140. New Mature Parent Capacity = Gap in Mature Parent Capacity to Desired Parent

Capacity/Adjustment Time for Mature Parent Capacity, Units: Parent/Week

141. Parent Chicks Rate = Decision to Purchase Parent Chicks, Units: Parent/Week

142. Parent Maturing Rate = Parent Chicks/Time to Mature Parent, Units:

Parent/Week

143. Parent no Longer Productive = Mature Parent/Average Productive Life Units:

Parent/Week, Number of Mature Poultry who age out, die, or are no longer

productive.

144. Retail Rate = Chickens Maturing for Market * (1-Fraction Loss), Units:

Chicken/Week

145. Unhatched Eggs Rate = Hatchery * Unhatched Rate, Units: Eggs/Week

302

Appendix D: Some Pictures from the Case Industry

Picture 1: Sign Board for Nahar Agro Group

Picture 2: Industry Main Gate with Bio-security Precaution

303

Picture 3: A snapshot of Poultry Shed from Roof Top

Picture 4: Mother Parent Stock under Scientific Control Shed

304

Picture 5: Day-old Chicks Grading before Travel to The Ultimate Farmers

Picture 6: Day-old Chicks in a Scientific Packaging System

305

Picture 7: Eggs Queued up for Hatching

Picture 8: Biogas Plant

306

Picture 9: Engineering Layout for Case Industry (Particular unit)


Recommended