1
Integrated surface water/groundwater modelling to simulate drought and climate
change impacts from the reach to the watershed scale
IAH-CNC – Waterloo 2015 P.J. Thompson, E.J. Wexler,
M.G.S. Takeda, Dirk Kassenaar
Earthfx Incorporated, Toronto, Ontario
Special thanks: Shelly Cuddy and Katie Howson
Lake Simcoe Conservation Authority
2
Lake Simcoe Restoration and Protection
► Fourth largest lake in Ontario and has history of environmental stress.
► Watershed is under pressure from increased development
► Lake Simcoe Protection Act (2008) requires that every subwatershed be studied to assess:
current water demand,
effect of future land-use change and increased water demand
response to drought
response to future climate change
► Approach: develop fully integrated GW/SW models using USGS GSFLOW code
Lake Simcoe Watershed
3
GSFLOW - Integrated GW/SW Model
► GSFLOW combines MODFLOW-NWT with the PRMS hydrologic model
PRMS code can be used as a distributed (cell-based) model
Cascade method used to route overland runoff between cells
Runoff can re-infiltrate downslope
UZF module for unsaturated flow and GW ET
Additional modules simulate GW interaction with lakes and streams
4
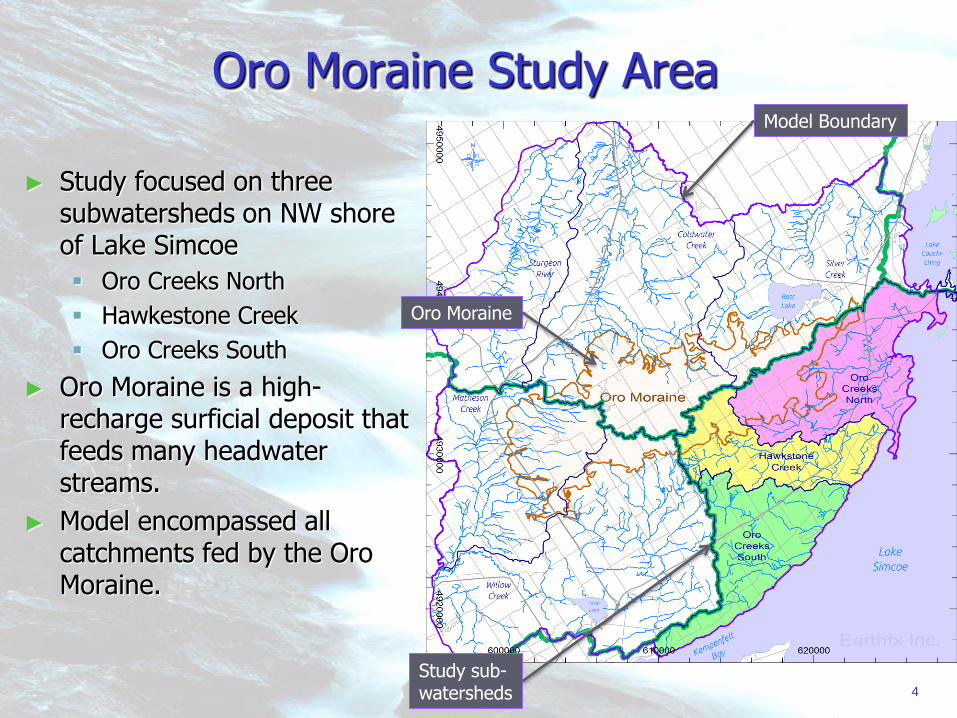
Oro Moraine Study Area
Oro Moraine
Study sub- watersheds
► Study focused on three subwatersheds on NW shore of Lake Simcoe
Oro Creeks North
Hawkestone Creek
Oro Creeks South
► Oro Moraine is a high-recharge surficial deposit that feeds many headwater streams.
► Model encompassed all catchments fed by the Oro Moraine.
Model Boundary
5
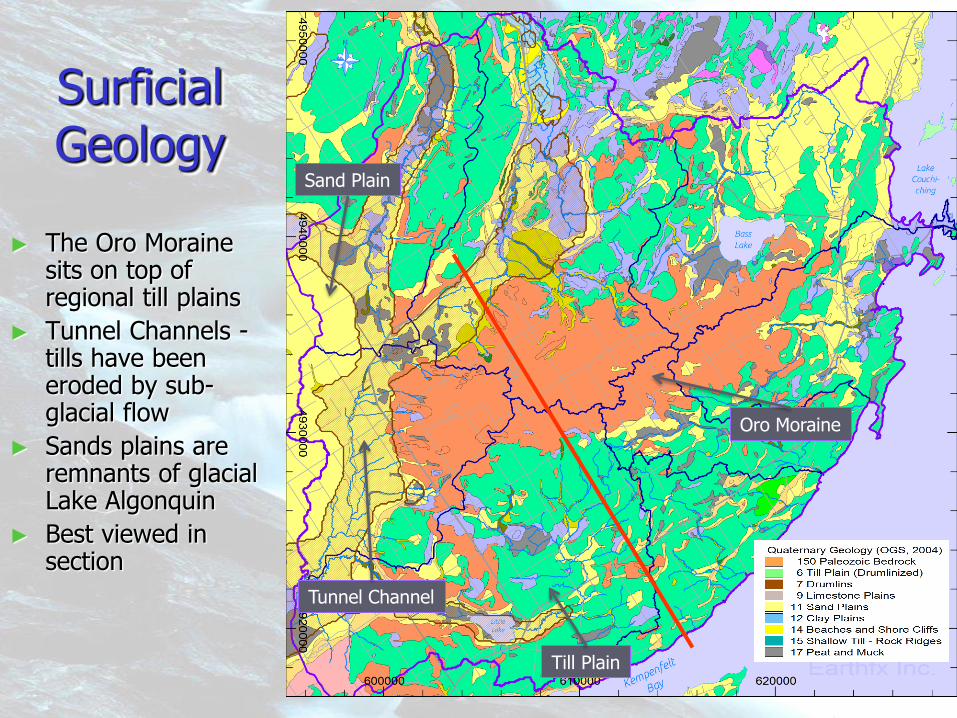
Surficial Geology
► The Oro Moraine
sits on top of regional till plains
► Tunnel Channels - tills have been eroded by sub-glacial flow
► Sands plains are remnants of glacial Lake Algonquin
► Best viewed in section
Oro Moraine
Tunnel Channel
Sand Plain
Till Plain
6
Hydrogeologic Model ► A complex 3-D geologic model was available from the OGS
► Provide very detailed mapping of shallow aquifer system
► Formed basis of the groundwater sub-model layers
► Shows the Oro Moraine, regional till plains, and infilled tunnel channels
7
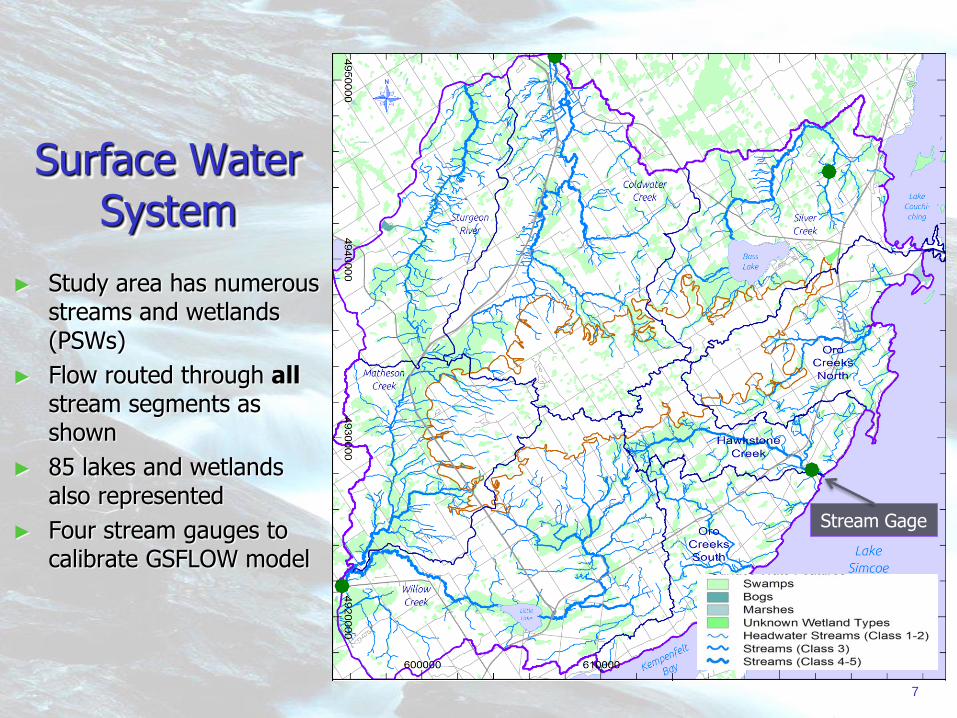
Surface Water System
► Study area has numerous streams and wetlands (PSWs)
► Flow routed through all stream segments as shown
► 85 lakes and wetlands also represented
► Four stream gauges to calibrate GSFLOW model
7
Stream Gage
8
Hydrologic Model Inputs/Outputs
► PRMS Sub-model Inputs
Daily Climate Data
► Precipitation (NEXRAD)
► Temperature
► Solar radiation
Topography
Land cover
Soil properties
► Model computes daily water budget components Snowmelt, Interception, Overland
flow, Infiltration, ET, Recharge
8
PRMS Flow Chart
9
► Results for Coldwater River (02ED007)
► Validated against historical low flow periods
9
Calibration to Daily and Monthly Flows
Observed (blue) Simulated (red)
10
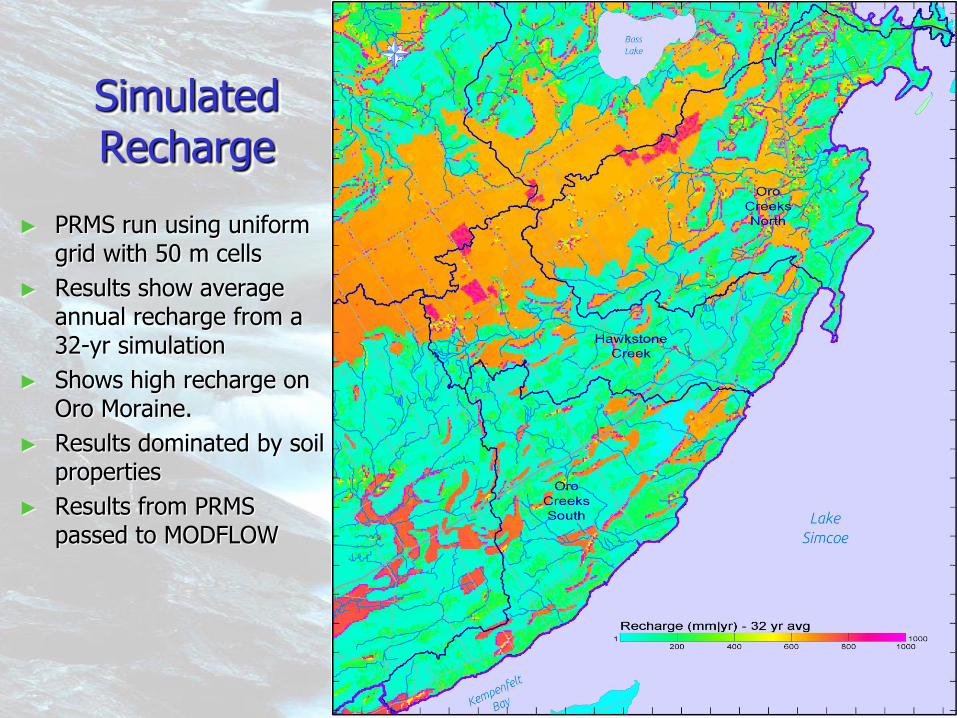
Simulated Recharge
► PRMS run using uniform grid with 50 m cells
► Results show average annual recharge from a 32-yr simulation
► Shows high recharge on Oro Moraine.
► Results dominated by soil properties
► Results from PRMS passed to MODFLOW
10
11
Simulated Groundwater Heads
11
► Shallow system show influence of topography and streams. Deeper system (below regional tills) is more subdued
DROUGHT ASSESSMENT
12
13
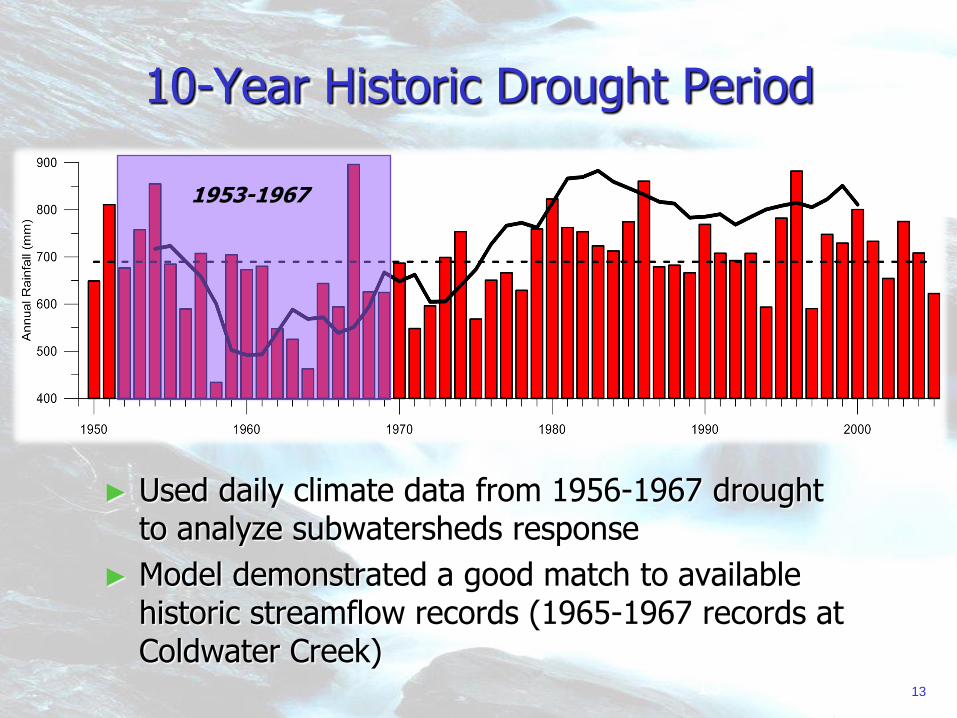
10-Year Historic Drought Period
13
1953-1967
► Used daily climate data from 1956-1967 drought to analyze subwatersheds response
► Model demonstrated a good match to available historic streamflow records (1965-1967 records at Coldwater Creek)
14
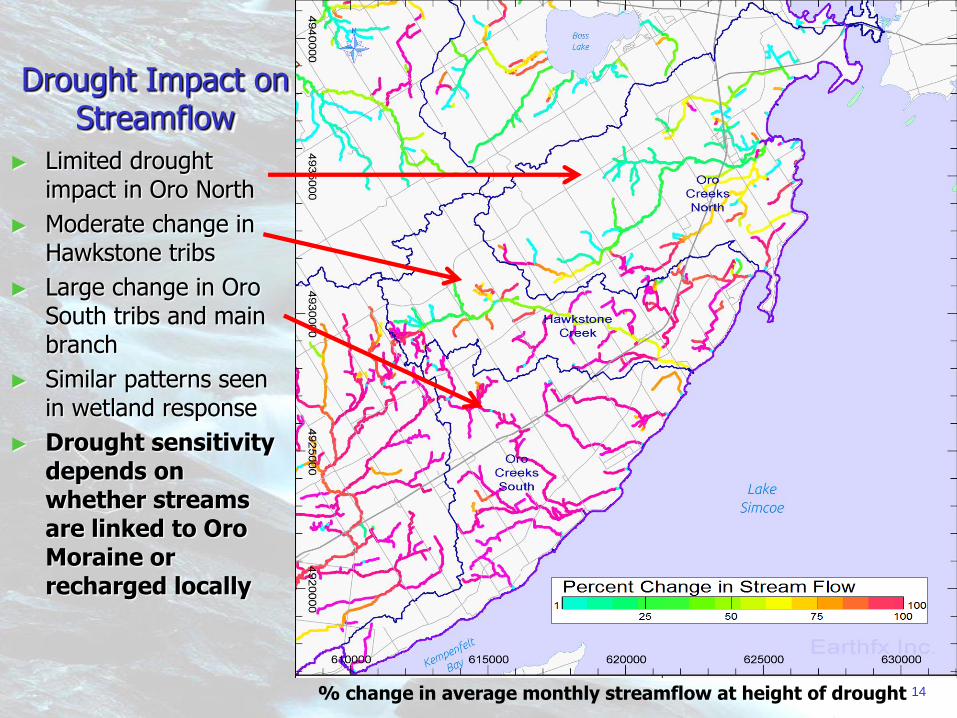
Drought Impact on Streamflow
► Limited drought impact in Oro North
► Moderate change in Hawkstone tribs
► Large change in Oro South tribs and main branch
► Similar patterns seen in wetland response
► Drought sensitivity depends on whether streams are linked to Oro Moraine or recharged locally
% change in average monthly streamflow at height of drought
15
Pathline Analysis
► Endpoints from forward tracking confirm that Oro Moraine feeds headwater streams and wetlands along flank
► Deep flow path emerge far from the Moraine in North Oro
► South Oro has little connection to Moraine compared to North Oro and Hawkestone
15
End Points
Pathlines
16
► Hawkestone Wetlands fed by the Moraine, lower reaches are not in contact
► The drought scenarios allow the role of storage to be evaluated under historical stress conditions
CLIMATE CHANGE ASSESSMENT
17
18
Global Circulation Models of Climate Change
► Predictions of annual temperature and precipitation change cover a wide range
► Most show 1.5 - 4 C increase by 2070 for Southern Ontario
► We picked a range of GCM predictions to bracket range of likely outcomes
► Recommended approach as per MNR guidelines (EBNFLO & Aquaresources, 2010)
► Data available through the Aquamapper website (climate.aquamapper.com)
Increase in Mean Annual Temperature (C)
% C
han
ge
in
Me
an
An
nu
al
Pre
cip
ita
tio
n
Selected by Percentile Method
Modelled for this Study
19
Change Field Method Example - Baseline versus CGCM3T63
Values shifted by 1 to 5 C
► Shift observed daily temperature by predicted monthly increase
20
Predicted Monthly Changes
► Ensemble of GCM runs shows monthly precipitation increases during the fall and winter
► Ensemble of GCM runs shows a clear increase in temperature over all months
21
Comparison of Low Flow Change – North vs South Oro
• CGMC3T63 scenario shows more flow in winter months. Earlier spring freshet.
• Reduction in summer flows due to lower rainfall and longer recession period.
• Summer flow change in South Oro more pronounced due to poor connection with the Moraine.
Shellswell Creek (South Oro) Drought Sensitive
Bluffs Creek (North Oro) Drought Insensitive
22 22
Simulated Change in Streamflow – Oro South
• Ensemble of models show consistent results.
• Log scale highlights significant reduction in summer flows due to lower summer rainfall and longer recession period.
• This subwatershed was predicted to be drought sensitive during the 10-drought simulation.
In poor contact with the Moraine
23
Simulated Change in Total Streamflow - Coldwater River
• Reduction in summer flows, but not as severe given contact with the GW system.
• This subwatershed was predicted to be drought resilient during the 10-drought simulation.
In good contact with the Moraine
24
Case Study #2 – Talbot Watershed
► Talbot River watershed is dominated by alvar plain.
► High recharge, low storage system.
► More pronounced response to future change, but drought resilience still a good indicator of climate change sensitivity.
25
Climate Change: Conclusions
► Climate effects in Southern Ontario:
More recharge and baseflow discharge in the winter
Spring freshet earlier due to earlier snowmelt
Drought sensitive reaches will experience increased/extended summer low flow conditions.
► Understanding the underlying geology is essential.
Shallow geology is important
Interconnection of streams to recharge feature is key factor
High groundwater storage features can mitigate the effect of low flow extremes
► Drought and climate change response are best studied on the reach to subwatershed scale.
26
Integrated Modelling: Moving Forward
► Integrated modelling is a mature, developed technology to understand watershed function and the hydrologic response to drought.
► Drought assessment based on historical information can validate the models’ ability to match extreme events.
► This can reduce uncertainty related to climate change impact assessment.
► Integrated modelling can be used to develop practical climate change policy and adaptation strategies.
27
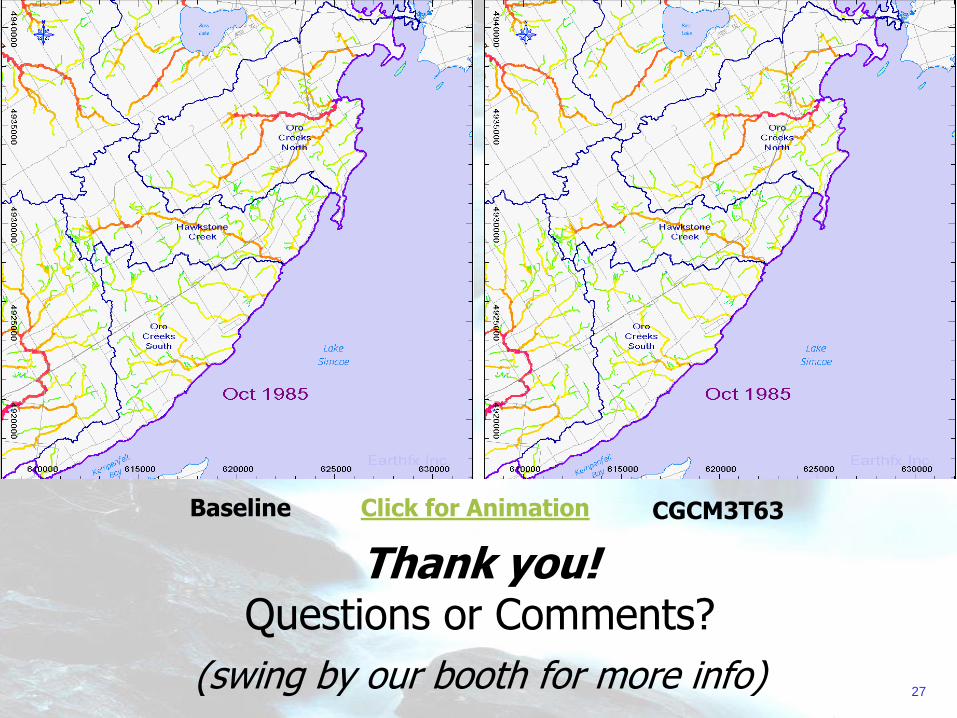
Baseline Click for Animation CGCM3T63
Thank you! Questions or Comments?
(swing by our booth for more info)