+ All Categories
Home > Documents > INTEGRATED TEACHER TRAINING FOR SECONDARY SCHOOL …

INTEGRATED TEACHER TRAINING FOR SECONDARY SCHOOL …

Date post: 05-Dec-2021
Category:
Upload: others
View: 2 times
Download: 0 times
Share this document with a friend
52
INTEGRATED TEACHER TRAINING FOR SECONDARY SCHOOL EDUCATORS (ITT) MONITORING AND EVALUATION REPORT (FOR THE PERIOD FROM MARCH, 2013 MARCH, 2015) PREPARED BY ALLEN RUGAMBWA, ERNA GRASZ, ONESMO KIVUYO, AND DENIS MBILINYI APRIL 16, 2015
Transcript

INTEGRATED TEACHER TRAINING FOR SECONDARY SCHOOL EDUCATORS

(ITT)

MONITORING AND EVALUATION REPORT

(FOR THE PERIOD FROM MARCH, 2013 – MARCH, 2015)

PREPARED BY

ALLEN RUGAMBWA, ERNA GRASZ, ONESMO KIVUYO, AND DENIS MBILINYI

APRIL 16, 2015

2

FOREWORD

This report is part of ITT’s second year’s report to MasterCard Foundation, the main sponsor of

the project. It is mainly meant to inform the foundation how the project performed in the second

year of its implementation. However, in some areas such as student learning outcomes the report

covers the two years period.

The report has been prepared and written by Allen Rugambwa, (lecturer at Mwenge Catholic

University and TIA/SBT Team Leader) and Erna Grasz, (CEO of Asante Africa Foundation).

Others who contributed greatly to the report are Mr. Onesmo Kivuyo (ITT’s M&E officer), Mr.

Denis Mbilinyi (lecturer at Mwenge Catholic University and SBT Monitor) and Theopista Seuya

(ITT Manager).

3

ACKNOWLEDGEMENTS

We are grateful to the leaders of ITT Project Partner organizations (AAF, MWECAU and

SEKOMU) for their continuous support to the project’s activities related to its implementation

and evaluation of the project. We also convey our sincere gratitude to DEOs, heads of schools,

teachers and students who participate in the project for their support in data collection process.

We are also grateful to the MoEVT for collaborative partnerships and future strategy of

integration of the ITT approach into the Teacher’s In-service Training.

4

EXECUTIVE SUMMARY

ITT PSIPSE “Bringing Child-Centered Learning into the Classroom” is a partnership project

which aims at bringing child-centered teaching to rural secondary schools in Tanzania. This

grant project focuses on taking an award-winning centralized teaching model (TIA) and

distributing it through School-Based Workshops (SBW). The project is a three year project

funded from April 2013 to March 2016.

The goal of ITT project is to scale an integrated, child-centered educational model to elevate

quality of secondary school teaching, foster the development of critical thinking skills and

improve learning outcomes for youth in secondary schools in underserved Tanzanian

communities. This program is still on course for a three-year implementation in a step-wise

manner year over year: In year one the project focused in fusing together the multi-model

elements and confirm endorsement by MoEVT; year two, tightening and improving the model,

expand training to four new districts, and explore new teaching institution partnership

relationships; and year three, expand scale through new training institutions and districts with

MoEVT to reach the project target of 120 schools, 1800 teachers, and 36,000 students. ITT

project supports the efforts of the Tanzanian Government through the Ministry of Education and

Vocational Training to improve the quality of education in the country by improving teacher’s

competencies and stakeholder’s engagements.

This evaluation report is meant to inform the partners, stakeholders and the donors (MCF) of ITT

Project about the inputs, the outputs and outcomes of the project’s activities in 2014 - 2015. It

answers the question how effective was the project in achieving its goal. The goal of the ITT

Project is to scale an integrated, child-centred educational model, to foster the development of

critical thinking skills and improve learning outcomes for Tanzanian youths.

The evaluation exercise aimed to determine the impact of ITT’s activities such as TIA, SBT, and

English Debate, in bringing about change in teaching practices and learning outcomes. It also

aimed to find out the extent to which the project facilitates sustainable support and scaling of

TIA and SBT models of training at school, institutional and national levels.

The evaluation was guided by nine learning questions. Some of these are: what impact does TIA

(in-service teacher training model) have in preparing guardian teachers in the use of

5

participatory teaching techniques and low cost resources? What impact does the school-based

training (SBT) model of child-centred teaching have on student academic performance and

cognitive development at the secondary school level? How can we observe student learning

improvement from a change in teaching pedagogy?

The findings of the evaluation exercise indicated that the project achieved almost all of its

objectives. TIA and SBT successfully trained guardian teachers and SBW participants on LCP

and the use of low-cost resources. Teachers used learner-centred teaching techniques (LCTs) to

promote conceptual understanding and critical thinking among learners. English debate program

has revived debates in schools and promoted communication skills of students. Students

participate actively in the learning process through asking and answering questions. More

importantly TIA and SBT improved learning outcomes of students as measured by national form

four examinations.

Despite these great achievement ITT project has to improve some aspects of its activities. In

additional to the frequently used learner-centred teaching techniques (LCTs), the teachers should

be encouraged to use other variety of the techniques that will engage students not only verbally

but also kinaesthetically. Schools should be prepared to take over the running of SBT in their

schools by the end ITT project. Old schools need the same amount of intervention of SBT as it is

the case for the new schools. Moreover, English Debates shouldn’t take place in a small number

of schools but in all ITT schools to benefit more teachers and students.

While all year 2 activities were completed and proven to have merit, as we move into the third

year of implementing the ITT program, we will tighten our focus and reduce the breadth of

activities to those that have distinct value in the harmonization with the MoEVT national INSET

training strategy for Tanzania’s teachers and activities that can strategically provide data for the

learning questions that were initially set forth.

6

TABLE OF CONTENTS

Foreword ................................................................................................................................................. 2

Acknowledgements ................................................................................................................................ 3

Executive Summary ............................................................................................................................... 4

List of Tables .......................................................................................................................................... 8

List of Figures ......................................................................................................................................... 9

Acronyms .............................................................................................................................................. 10

Chapter One: Introduction to ITT ..................................................................................................... 11

The historical context of ITT Project ..................................................................................................... 11

The Goal and Objectives of the Project ................................................................................................ 12

Outcomes of the Project ......................................................................................................................... 12

Activities performed in 2014-2015 ........................................................................................................ 13

Chapter Two: Background to Project Evaluation ............................................................................ 15

Purpose of Project Evaluation ................................................................................................................ 15

Objectives of ITT Project Evaluation ................................................................................................... 15

Scope of ITT Project Evaluation.......................................................................................................... 15

Project Evaluation Questions ................................................................................................................. 16

Pre-determined performance Standards (Indicators) ............................................................................. 17

Chapter Three: Evaluation Methodology .......................................................................................... 19

Sources of Data ...................................................................................................................................... 19

Sample and Sampling Techniques ......................................................................................................... 19

Data Collection Methods and Procedures .............................................................................................. 20

Data Analysis Methods .......................................................................................................................... 21

7

Chapter Four: Findings , Interpretation and Conclusions .............................................................. 22

The effectiveness of TIA Workshop in preparing SBT facilitators ....................................................... 22

The effectiveness of SBT in improving the use of LCTs and low cost resources in schools ................ 25

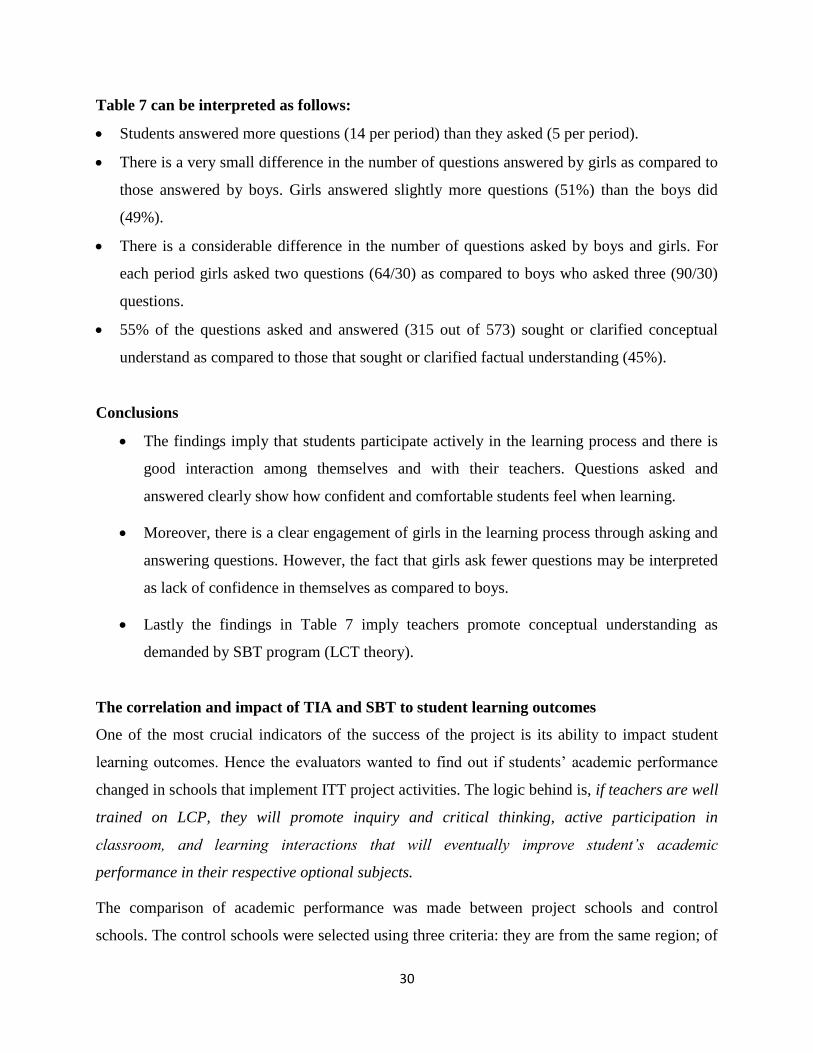
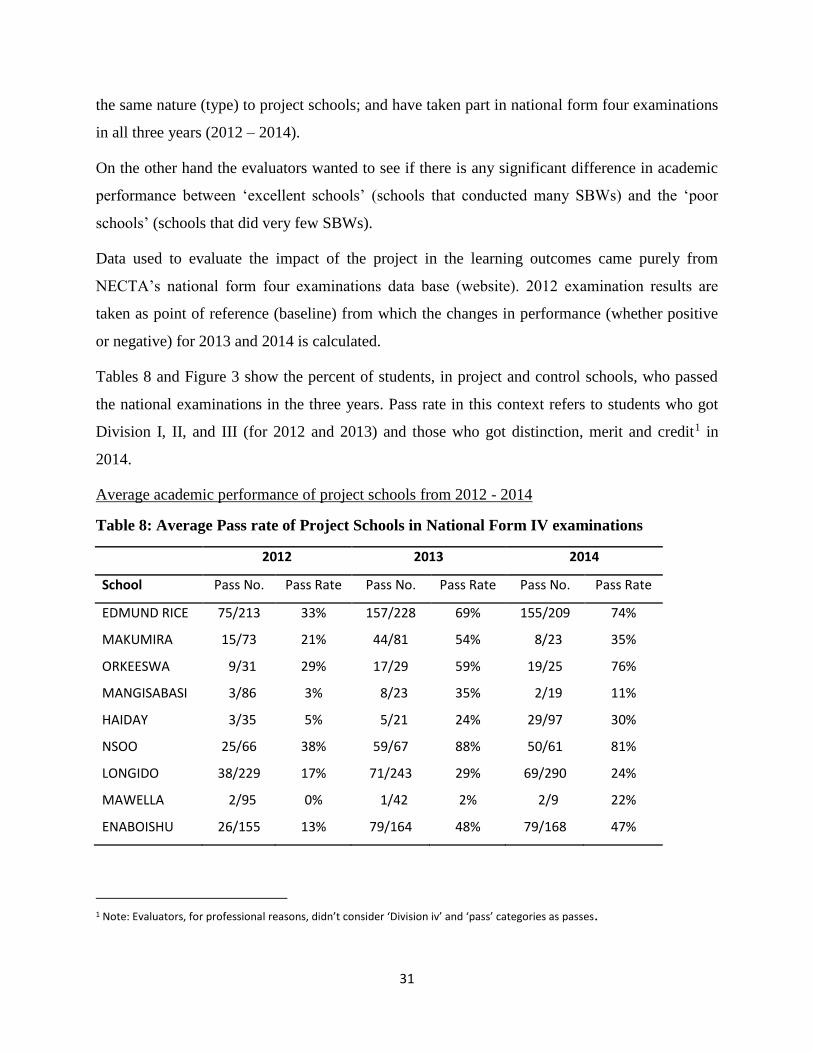
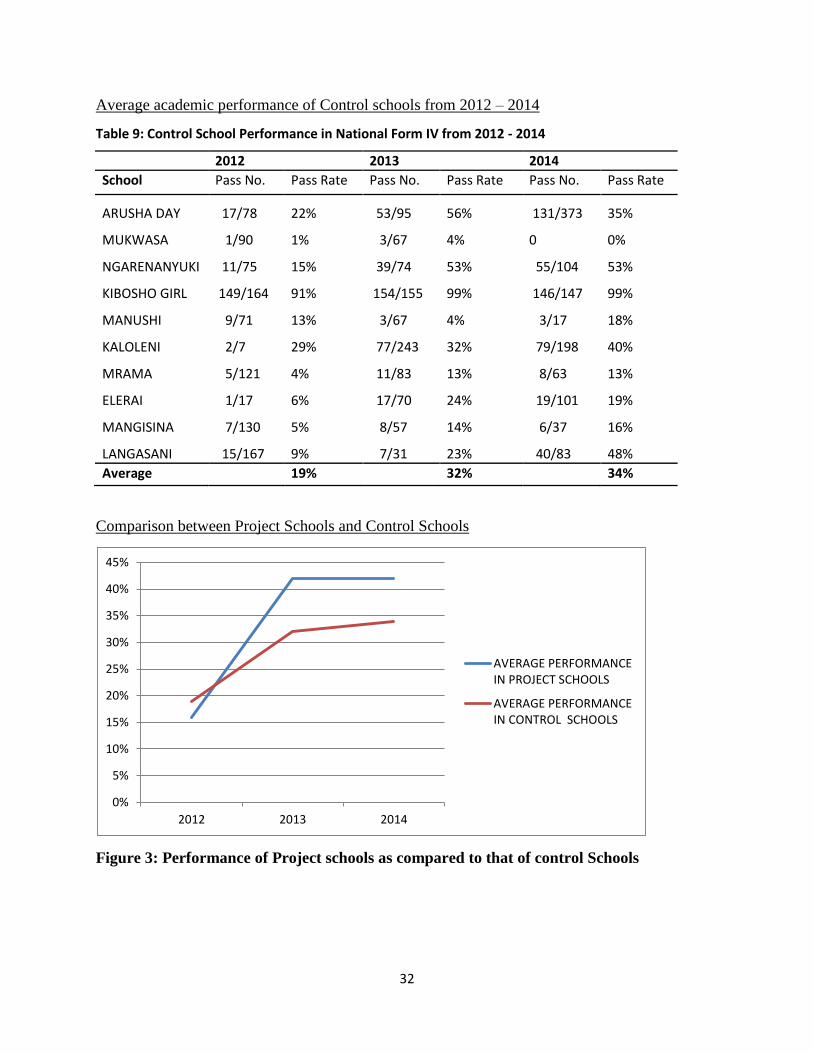
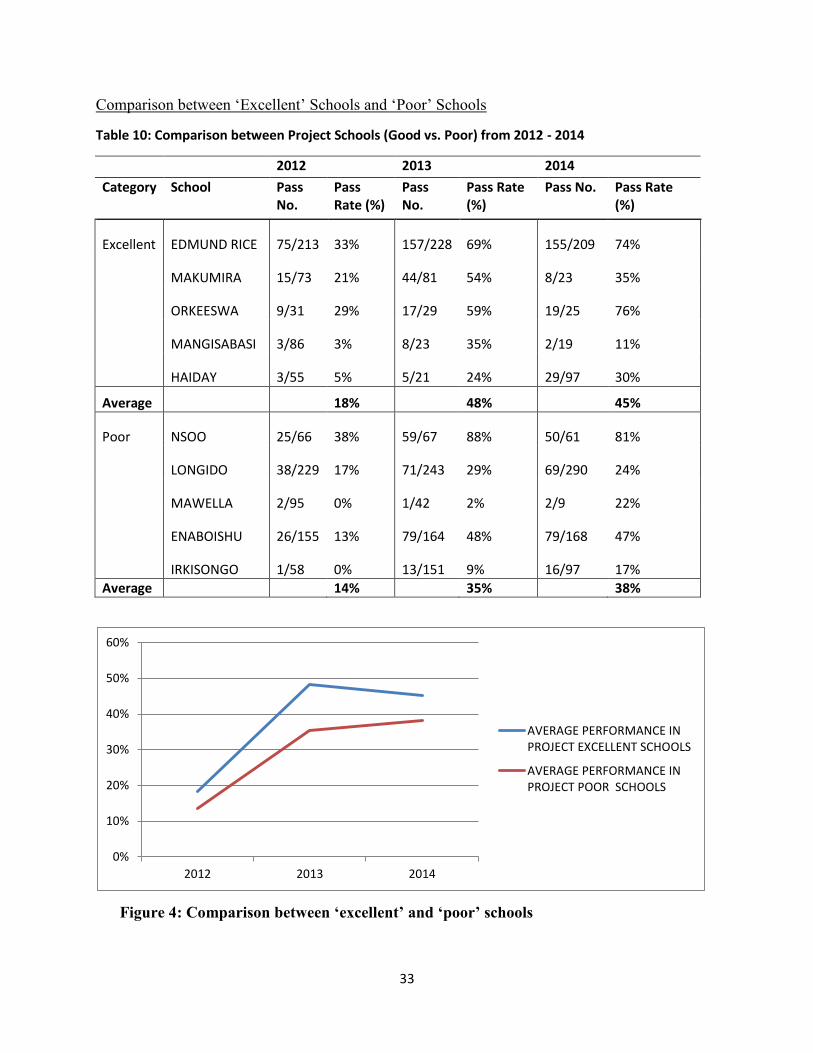
The impact of SBT to student learning outcomes .................................................................................. 29

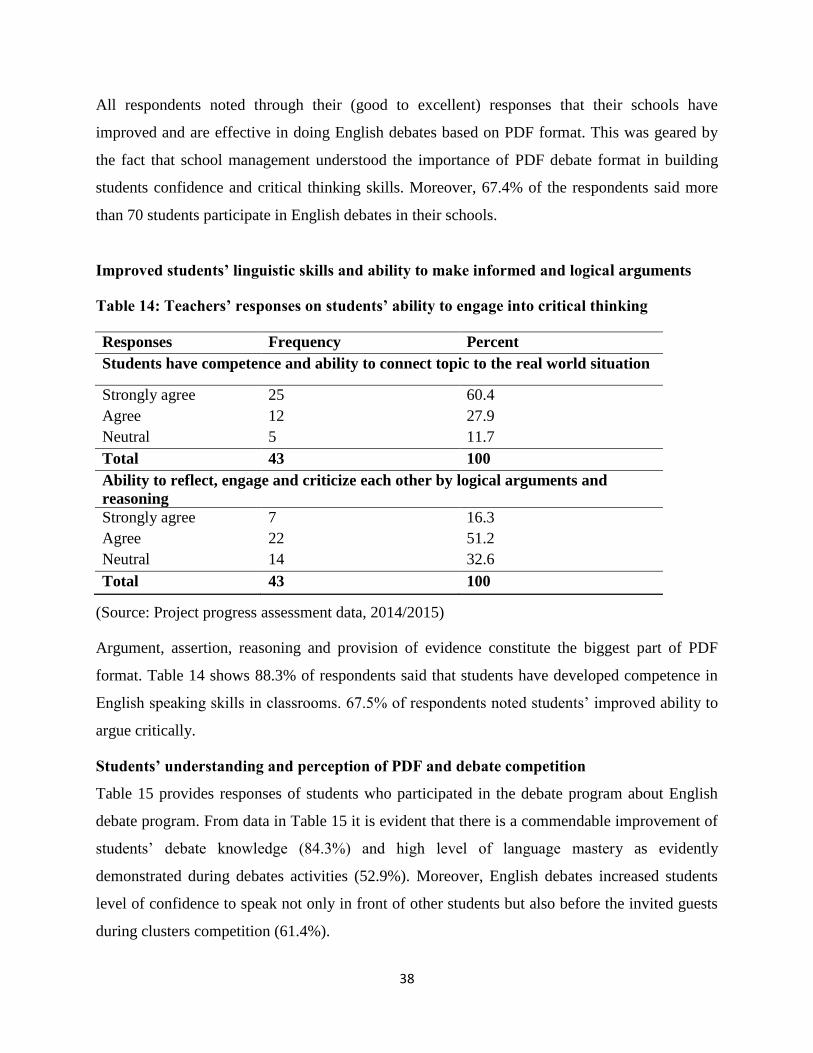
The effectiveness of TIA and PDF Program in promoting English debates in schools ........................ 36

The impact of parental support to teacher accountability and students participation ............................ 41

The influence of the project in creating support for sustainable school-based INSET ........................ 43

The impact of ITT’s advocacy for national scaling of TIA and SBT .................................................... 44

The potential for scaling of TIA to other education institutions ............................................................ 45

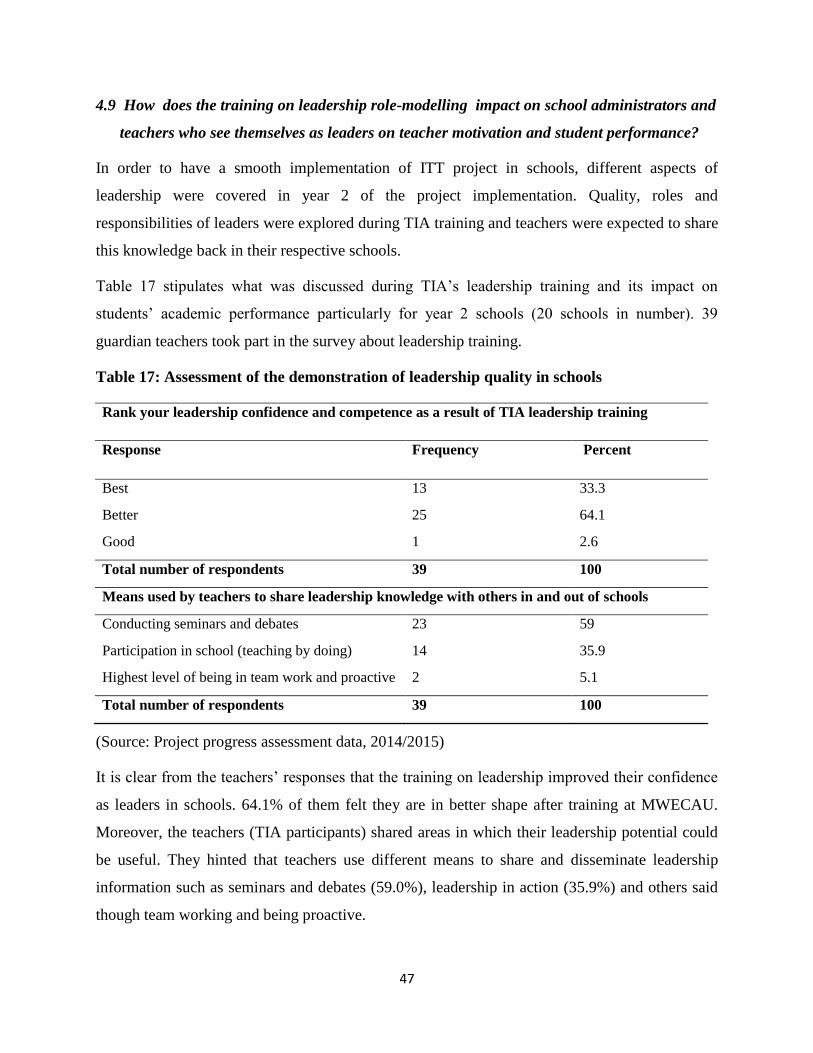
The impact of leadership role-modelling training on school administration ......................................... 47

Chapter Five: Lessons Learnt and Recommendations .................................................................... 49

Lessons Learnt ....................................................................................................................................... 49

Recommendations .................................................................................................................................. 50

References ............................................................................................................................................. 52

8

LIST OF TABLES

TABLE 1: Indicators for Project’s Positive Outcomes .......................................................................... 17

TABLE 2: Mostly used LCTs in facilitating SBWs .............................................................................. 24

TABLE 3: Number of SBWs conducted and how SBT has been integrated in school calendar .......... 24

TABLE 4: Learner-Centred Techniques used in ITT Project Schools .................................................. 26

TABLE 5: Frequency of occurrence of LCT aspects in classrooms ..................................................... 27

TABLE 6: Average Score for teachers grouped in different SBT Categories ....................................... 28

TABLE 7: Rate of asking and answering questions by students ........................................................... 29

TABLE 8: Average Pass rate of Project Schools in National Form IV examinations .......................... 31

TABLE 9: Control School Performance in National Form IV from 2012 - 2014 ................................. 32

TABLE 10: Comparison between Project Schools (Good vs. Poor) from 2012 - 2014 ........................ 33

TABLE 11: Average performance of Ten ITT schools in Sciences, Mathematics and English ........... 35

TABLE 12: The Extent to Which English Debate is part of school routine .......................................... 37

TABLE 13: English Debate improvement and effectiveness in their schools ....................................... 37

TABLE 14: Teachers’ responses on students’ ability to engage into critical thinking ......................... 38

TABLE 15: Students’ responses on their linguistic skills and knowledge about PDF program ........... 39

TABLE 16: Parents’ strategies in influencing students’ academic progress ......................................... 42

TABLE 17: Assessment of the demonstration of leadership quality in schools.................................... 47

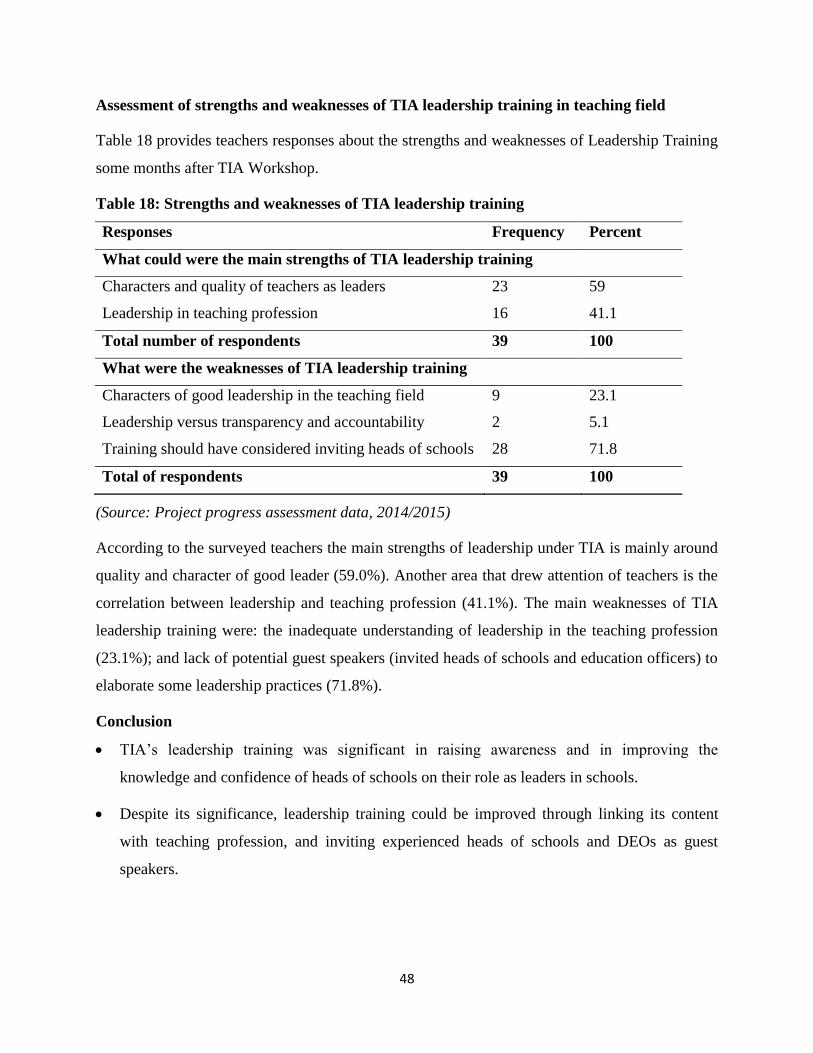
TABLE 18: Strengths and weaknesses of leadership training ............................................................... 48

9

LIST OF FIGURES

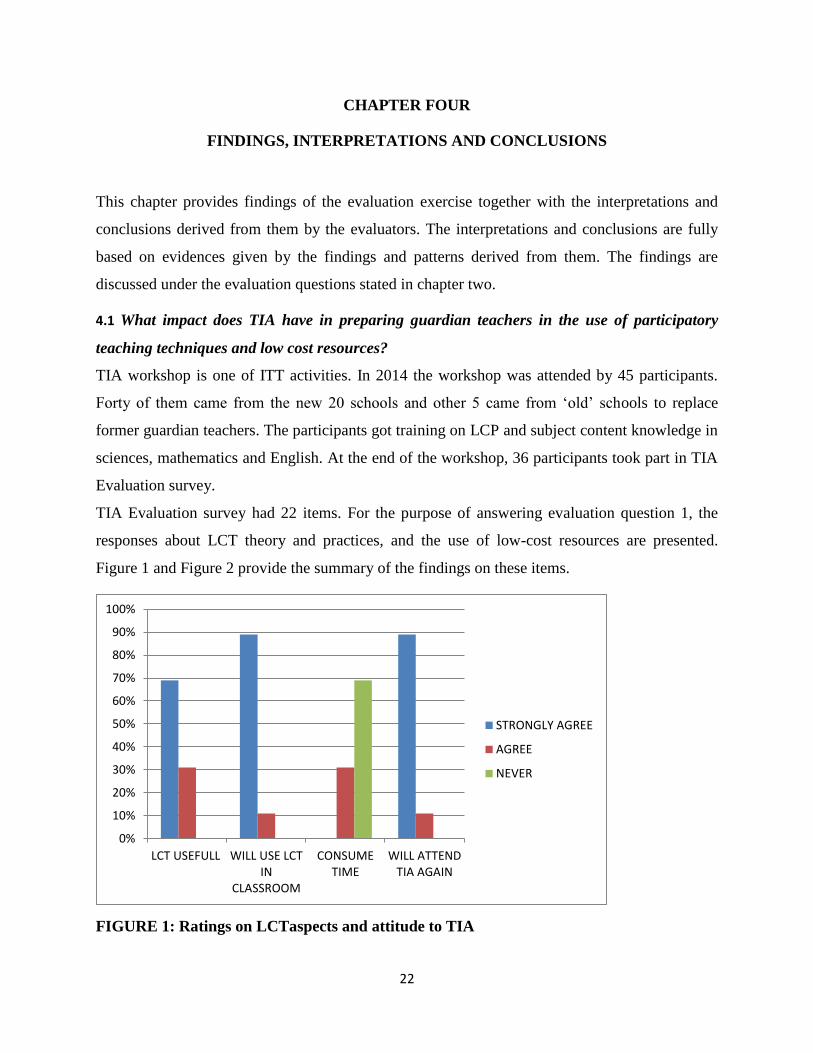
FIGURE 1: Ratings on LCTaspects and attitude to TIA ....................................................................... 22

FIGURE 2: Findings related to the use of low cost resources ............................................................... 23

FIGURE 3: Performance of Project schools as compared to that of control Schools ........................... 32

FIGURE 4: Comparison between ‘excellent’ and ‘poor’ schools ......................................................... 33

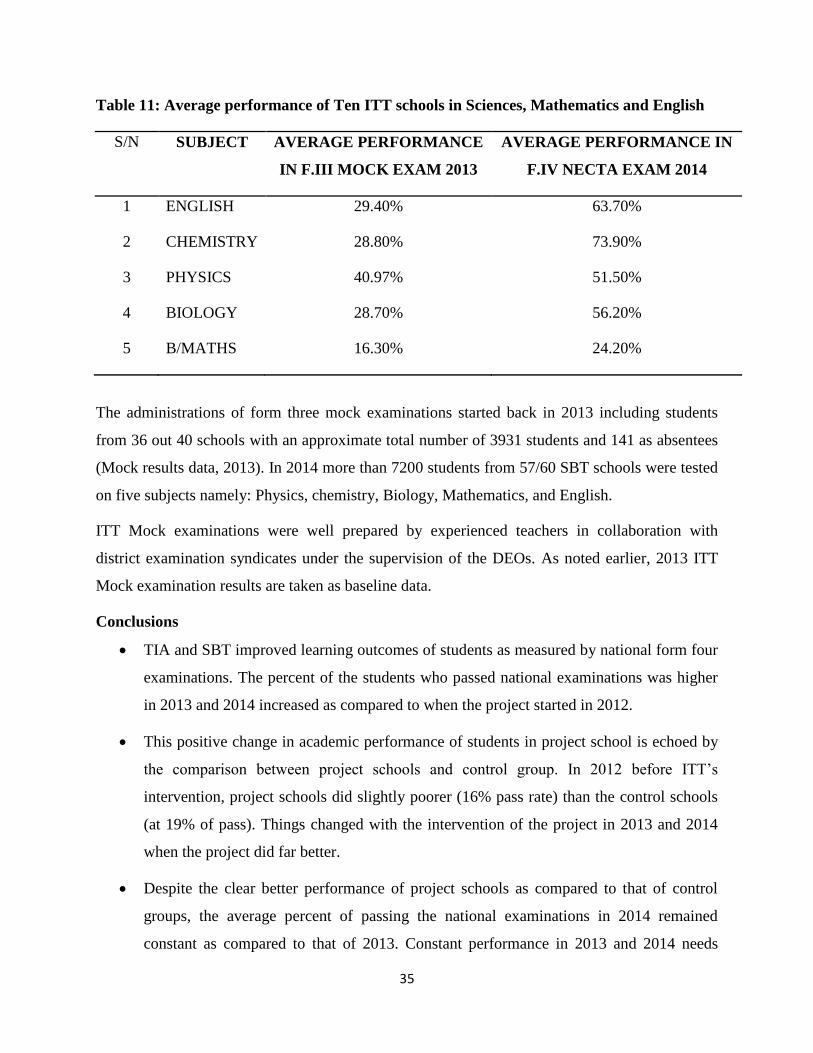
FIGURE 5: School Performance in English Examinations ................................................................... 39

10

ACRONYMS

AAF Asante Africa Foundation

DEOs District Education Officers

HoS Head(s) of Schools(s)

INSET In-Service Education and Training

ITT Integrated Teacher Training (for secondary educators)

LCP Learner-Centred Pedagogy

LCT Learner Centred Teaching

LCTs Learner Centred Teaching Techniques

MCF Mastercard Foundation

MOEVT Ministry of Education and Vocational Training

MWECAU Mwenge Catholic University

PDF Public Debate Format

PSIPSE Partnership to Strengthen Innovation and Practice in Secondary Education

SBT School-Based (In-service) Training

SBW School-based Workshop

SEKOMU Sebastian Kolowa Memorial University

TIA Teaching in Action

TOT Trainers of Trainers

WEF World Education Forum

11

CHAPTER ONE

INTRODUCTION TO ITT PROJECT

Learning is influenced by the interaction between a teacher and student. And according to

Brookings Institute, the interaction that takes place in the classroom is one of the most important

factors affecting how much children learn. However, teachers can only facilitate real learning if

they are well trained. In addition to pre-service training, INSET for teachers is inevitable.

Knowledge changes with time and teachers’ knowledge need to be maintained in order to go

hand in hand with observable changes [WFE, 2000].

ITT PSIPSE “Bringing Child-Centered Learning into the Classroom” is a partnership project

which aims at bringing Child-Centered Teaching to rural secondary schools in Tanzania. This

grant project focuses on taking an award-winning centralized teaching model (TIA) and

distributing it through School-Based Workshops (SBW).The project is a three year project

funded from April 2013 to March 2016.

The annual scaling approach initially involved implementing the program in 40 secondary

schools per year, teaching new skills to 560 teachers (and 40 school leaders, including Heads of

school) enhancing child centered teaching skills. In three years, this program anticipates

impacting at least 36,000 students, who will be able to confidently ask and answer questions in

classrooms, to think more critically, improve reasoning and better solve academic problems.

Project targets are secondary school teachers, students and their communities in rural Tanzania,

as the funded programs states.

This program is still on course for a three-year implementation in a step-wise manner year over

year: In year one the project focused in fusing together the multi-model elements and confirm

endorsement by MoEVT; year two, tightening and improving the model, expand training to four

new districts, and explore new teaching institution partnership relationships; and year three,

expand scale through new training institutions and districts with MoEVT to reach the project

target of 120 schools, 1800 teachers, and 36,000 students. ITT project supports the efforts of the

Tanzanian Government through the Ministry of Education and Vocational Training to improve

the quality of education in the country by improving teacher’s competencies and stakeholder’s

engagements.

12

Historical Context of the Project

Mwenge Catholic University initiated Teaching in Action Program in 2007 that trains secondary

school teachers in learner-centered pedagogy (LCP) and science content knowledge. However,

despite its great achievement in eight years, TIA like any other centralized in-service training

program has some weaknesses. It is both very costly and less ineffectiveness in terms of access.

Therefore, in order to make TIA program more effective with respect to coverage, impact, and

affordability, in March 2013, Mwenge Catholic University (MWECAU), Asante Africa

Foundation (AAF) and AfricAid, under the sponsorship of Mastercard Foundation (MCF),

launched a project called Integrated Teacher Training (ITT). The project extends TIA training to

school level through School-based Training (SBT) Program. Together with TIA and SBT the

project has conducted other training activities including parental engagement meetings,

leadership training for teachers and heads of schools, and English debates training and practices

in schools using Public Debate Format (PDF).

Asante Africa and other ITT partner organizations believe in the power of knowledge as a

catalyst to help young people create a future where they can live their potential. We know that

enriched minds collectively create better solutions to whatever challenges their communities

face. Through TIA-SBT model, ITT project provides the sustainable solutions to the access of

quality education.

The Goal and Objectives of ITT Project

The goal of the ITT Project is to scale an integrated, child-centred educational model to elevate

quality of secondary school teaching, foster the development of critical thinking skills and

improve learning outcomes for youth in Tanzanian secondary schools. From this goal, the project

has three objectives. These are to:

1) Build teacher competency, self-motivation and school-based support systems through

training in child-centered pedagogy and the use of low-cost, participatory teaching

techniques.

2) Improve student engagement and learning outcomes, particularly among children

vulnerable to traditional practices of nomadic and subsistence farming communities.

13

3) Influence and increase parental knowledge and student support for education in rural

communities.

Outcomes of the Project

The general expected outcomes of ITT Project are:

a) Increase in secondary school students’ critical thinking and ability to pass secondary

school exams with increased confidence in test taking.

b) Increase in the number of confident, capable and engaged teachers that utilize learner-

centred pedagogy in their teaching.

c) Testing a holistic and cost-effective model of teacher training with proven results with

the aim of getting the attention of the Ministry of Education and Vocational Training

(MoEVT) so that they allocate funding to such programs.

ITT Activities performed in 2014-2015

The detailed report of annual activities is given in the ITT Manager’s narrative report. However,

this section briefly outlines the activities to give the reader quick understanding of what activities

took place and from which the project is evaluated. The activities are:

a)TIA Training at MWECAU - This included the refresher training for TIA facilitators, the

review of TIA/SBT training material, and training for guardian teachers (ToT). New eleven TIA

facilitators were trained in TIA’s philosophy of LCP and its process of facilitation. Eight

(including leadership development) training modules were reviewed and a new one written.

Moreover, 45 guardian teachers were trained from 22 schools. These teachers went back to their

schools where they conducted School Based Workshops to their colleagues in their respective

schools while monitored by MWECAU facilitators.

b) Leadership role modelling training - Leadership Training to District Education Officers

DEOs) and Heads of schools (HOS) was also successfully conducted with 100% attendance. 10

DEOs and 60 HoS from the Yr 1 and Yr 2 schools were well equipped with leadership skills

which are helpful to the smooth running of their institutions hence create conducive teaching and

learning environment.

14

c) School-based Training – SBT took place in fifty-six out of sixty schools (Year 2 included 20

NEW schools and 40 Year 1 continuing schools) in the Arusha and Kilimanjaro Regions. An

additional 6 schools are being piloted in the Tanga Region. Each of the new schools conducted

three school-based workshops whereas every old school did two workshops in the period of

seven months as scheduled.

d) TIA and SBT were scaled to SEKOMU University - As a part of testing the national scaling

model, the ITT curriculum and training methodology was translated to another Higher learning

Institution named Sebastian Kulowa Memorial University (SEKOMU) and Lushoto secondary

school teachers. SEKOMU faculty were introduced to TIA and SBT programs, trained in LCP,

and given an opportunity to conduct pilot TIA workshop and monitor SBWs.

e) English Debates training as a participatory method - In all 20 Year 2 schools, Public

Debating Format (PDF) training was provided to 18 teachers and 360 students in addition to

conducting debate competitions from school levels to district levels were successfully done.

f) Student Learning Outcomes - As a method of assessing learning outcomes and preparing

youth for Form 4 exams, Mock exams for form three-examination was conducted for 7200

students from 57/60 TIA-SBT secondary schools with a minimal cost as the DEOs and HoS

contributed more than 50% of the activity cost.

G) Parental engagement meetings took place in 3 school districts. - Parental engagement

meetings with three hundred parents took part in educational and collaboration sessions in four

districts: Monduli, Siha, and Longido. The meetings involved different cadres of people in

school communities such as parents, teachers, and community leaders to discuss matters

regarding student learning. Parents were able to realize the importance of their roles and

contributions to the success of their children academically.

h) National Engagement by MoEVT - During TIA at MWECAU, a representative from MoEVT

attended the training to learn what ITT is offering. ITT and MOEVT had several meetings

aiming at harmonizing both INSET materials and process. One of the most important events that

occurred this year was a meeting between technical teams from both sides that reviewed in-

service training (INSET) materials and come up with a draft harmonized document.

15

CHAPTER TWO

BACKGROUND TO PROJECT EVALUATION

Purpose of Project Evaluation

This section answers the question ‘why doing evaluation?”. In any organization, control

(monitoring and evaluation) is one of the five functions of the management. Evaluation is always

needed to match the process and organizational goals. Therefore, evaluation results help in

making decisions regarding what should be done to make the program move in a right track

toward achieving its goals.

The evaluation of ITT Project process had five objectives:

a) Determining TIA clients’ level of satisfaction with regard to TIA’s training process and

curriculum, and its success rate of preparing its trainee to become competent SBT

facilitators.

b) Determining the effectiveness of SBT program in influencing learner-centred teaching

approaches that promote interaction, participation, and critical thinking among students.

c) Finding out the extent to which the teacher training (TIA/SBT) has an impact to student

engagement and learning outcomes.

d) Assessing the level of success of the project in involving school community leaders and

parents in discussing, supporting, and influencing education of their children.

e) Finding out the extent to which the project has managed to prepare the ground for

sustainable support and scaling of TIA and SBT models of training at school and national

level respectively.

Scope of the Project Evaluation

This section answers the question “what groups of people are involved in the evaluation and

why?”The evaluation process involved teachers (both SBW participants and guardian teachers)

as well as students in order to get answers about the impact of TIA and SBT in teaching and

learning process.

16

Other people involved were heads of schools, district education officers, and parents and

community leaders. These were needed to find out answers regarding sustainable support and

scaling of the project. The details of how people were selected is given in the ‘sample and

sampling techniques’ section in the methodology chapter.

Project Evaluation Questions

The learning questions that guided the project evaluation are grouped into two categories:

a) Questions derived from the three objectives of the project, and

b) Other questions regarding sustainability and scaling up of project’s activities.

Evaluation questions emanating from project’s main objectives

1. What impact does TIA have in preparing guardian teachers in the use of participatory

teaching techniques and low cost resources?

2. What impact does SBT have in influencing the use of participatory teaching techniques and

low cost resources?

3. What impact does the school-based training (SBT) model of child-centred teaching have on

student academic performance and cognitive development at the secondary school level?

4. What is the impact of TIA-SBT model for child-centred learning in promoting English skills

through PDF approach for English Debates?

5. What impact does increased levels of parental support for education have on teacher

accountability and student participation?

6. What influence does ITT have on the local sustainability of the school-based training (SBT)

model of child-centred teaching?

Evaluation questions deriving from project’s long term (sustainability-linked) goals

7. What is the impact of the ITT Project’s advocacy for integration of the guardian teacher

training (TIA) and school-based training (SBT) model into Tanzania’s national secondary

school teaching processes?

8. What is the potential for scaling the university-led guardian teacher-training model (TIA)

and its decentralized school-based training (SBT) model of child-centred teaching to other

education institutions?

9. How effective is TIA in training in preparing school administrators and teachers to become

role-model leaders who can influence teacher motivation and student academic progress?

17

Pre-determined Performance Standards (Indicators)

Table 1 matches evaluation questions and the expected performance standards (indicators)

Table 1: Indicators for Project’s Positive Outcomes

S/N Evaluation Question Indicator

1 What impact does TIA have in preparing guardian teachers in the use of participatory teaching techniques and low cost resources?

- Guardian teachers facilitating SBWs using a variety of LCTs and improvised low-cost resources.

2 What impact does SBT have in influencing the use of participatory teaching techniques and low cost resources?

- Teachers (SBW participants) apply LCP and use improvised T/Aids.

3 What impact does the school-based training (SBT) model of child-centred learning have on student academic performance and cognitive development at the secondary school level?

- Better performance in national form II and form four examinations.

- Better performance in local (school and regional) examinations.

- Students ask and answer questions - Students interact through discussions,

experimental activities and other LCTs.

4 What is the impact of TIA-SBT model for child-centred learning in promoting English skills through PDF approach?

- Schools conduct inter-class debate competitions.

- ITT conducts inter-district English debate competitions.

- Positive attitude of students and teachers towards the training (expressing satisfaction in the knowledge and skills gained).

- Better performance in English examinations

5 What impact does increased levels of parental support for education have on teacher accountability and student participation?

- Parents motivate their children to attend classes and study hard.

- Parents provide moral and financial support for education of students.

- Parents discuss and make a follow-up of educational issues of the students

6 What influence does ITT have on the local sustainability of the school-based training (SBT) model of child-centred teaching?

- Schools conduct non-sponsored SBWs - Schools are ready to share cost of SBT

implementation. - DEOs recognise and accept the program

in their districts. - Schools include SBT in their annual

calendars.

18

7 What is the impact of the ITT Project’s advocacy for integration of the guardian teacher training (TIA) and school-based training (SBT) model into Tanzania’s national secondary school teaching processes?

- Meetings between ITT and MOEVT officials regarding working together.

- INSET technical teams meet regularly to plan for the harmonization of INSET materials and curriculum for national-wide use.

8 What is the potential for scaling the university-led guardian teacher-training model (TIA) and its decentralized school-based training (SBT) model of child-centred teaching to other education institutions?

- Lecturers in the new institution demonstrate competence in LCT theory and practice.

- Lecturers in the new institution demonstrate TIA Training facilitation skills on LCT

9 How effective is TIA in training in preparing school administrators and teachers to become role-model leaders who can influence teacher motivation and student academic progress?

- Administrators motivate teachers for development of schools

- Teacher respects and guide students to better academic performance?

19

CHAPTER THREE

EVALUATION METHODOLOGY

Sources of Data

The Information (data) collected to answer the evaluation questions came from different sources

depending on the nature of the questions. The following is the list of all sources of data for the

exercise.

a) TIA Workshop evaluation survey

b) SBW Monitoring data reports

c) Classroom observation.

d) Minutes of the Stakeholders (DEOs, HOEs, and ITT officials) meetings

e) SEKOMU’s TIA facilitation Reports

f) Students and teachers Interviews data

g) ITT-MOEVT Harmonization Meeting Reports

h) TIA/SBT Quarterly and annual reports

i) National form four examination results database (from NECTA website)

j) English Debate surveys

k) Parental engagement surveys

l) Leadership Training Surveys

Sample and Sampling Techniques

The sample selected for evaluation of the project is divided in five units:

a) Forty five TIA participants: These were given questionnaires (evaluation forms) to fill.

They answered twenty two items rating different aspects of the workshop and provided

suggestions for improvement.

b) Eighteen schools selected for classroom observation exercise: These schools were

sampled using stratified sampling technique. They were grouped according to the

criterion of ‘how many SBWs they have conducted. Then the sample drawn randomly

from the groups depending on the number needed for each group.

20

The excellent schools are those that did all scheduled SBWs and conducted others

in the absence of ITT monitors.

Very good schools are those that conducted all scheduled SBWs.

Good schools missed one or two SBWs.

Poor schools are schools that did not conduct more than three SBWs in two years

time.

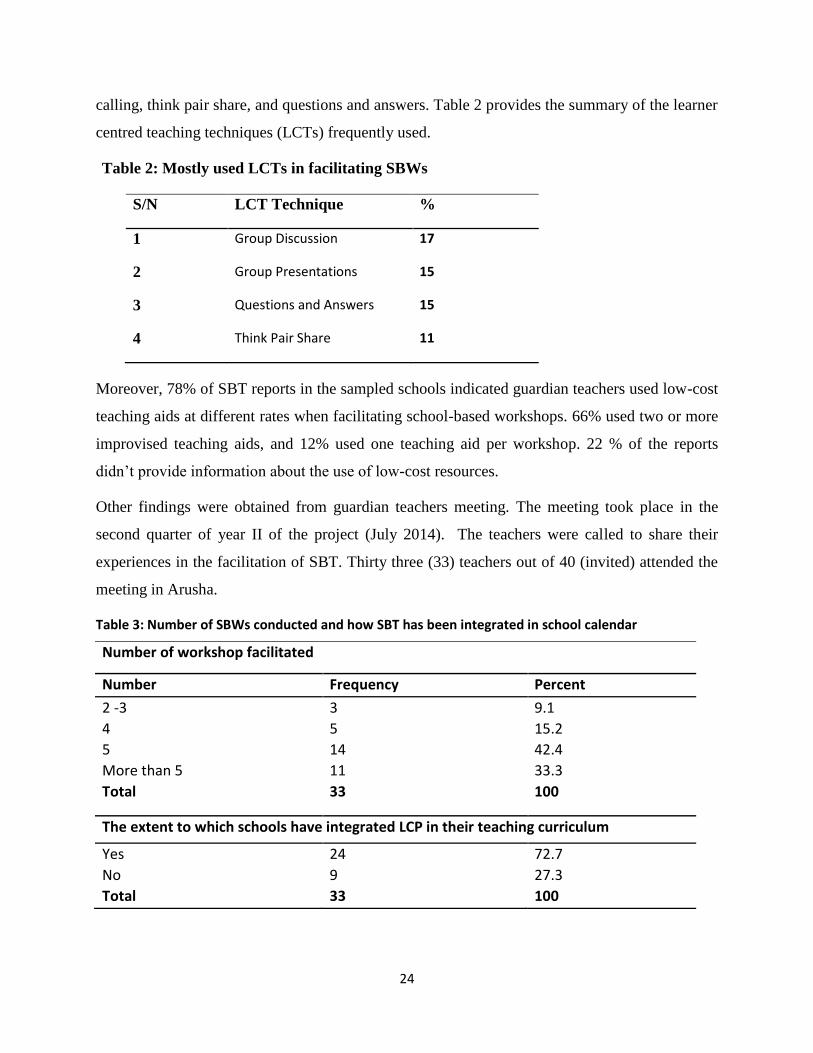
The eighteen schools also provided data for students learning outcomes and SBT

facilitation quality (using SBT monitors’ reports).

c) Eighteen English teachers: All English teachers who participated in PDF English Debates

training took part in the evaluation of the training. The teachers came from twenty

schools that take part in English Debate Program. The 20 schools came from six rural

schools in which the project operates. Each district was represented by 2-4 schools. The

districts are Karatu, Londido, Arusha, Siha, Hai and Moshi.

d) Sixty two Parental Engagement participants: These were ‘purposefully’ sampled from

fourteen villages that belong to the three most remote districts, namely Longido, Monduli

and Siha. The sample included village chairpersons, head teachers, ward councillors,

teachers, ward education officers, village development officer, etc.

e) Seventy students who took part in English Debate competitions.

f) Mock Exams were conducted to access academic and testing competence based on

teaching influences over the last two years by SBT and TIA trained teachers.

Data Collection Methods and Procedures

Three methods were used to collect data for evaluation exercise. The most used method was

survey. Questionnaires were administered to the selected sample of teachers and students seeking

responses to a number of items in the evaluation tools. The questionnaires were taken to schools

by SBT monitors (lecturers from MWECAU) or ITT officials. All questionnaires were filled and

returned the same day except those seeking demographic information such as national

examination results.

Another very significant data collection method was document analysis. Evaluators searched for

schools’ national form four examination results from NECTA website. Other documents

analysed were:

21

SBT Monitors reports about the facilitation of SBWs.

ITT Manager and Team Leaders Reports about general and individual activity reports

Minutes of the stakeholders meetings

The third method of data collection was classroom observation. Nine MWECAU lectures

observed thirty (30) classes taught by both guardian teachers and SBW participants in eighteen

sampled schools.

Data Analysis Methods

The analysis of the data from surveys and classroom observations was assisted by SPSS

program. On the other hand students’ national examination results and other documented data

were manually analyzed and presented into tables before they presented and interpreted

descriptively or into charts with an assistance of excel program.

It is worthy to note that having different sample units was influenced by two related factors. First

the activities are coordinated independently by different ITT Partner organizations. Second, ITT

partners supervised the evaluation of the activities carried under their coordination.

22

CHAPTER FOUR

FINDINGS, INTERPRETATIONS AND CONCLUSIONS

This chapter provides findings of the evaluation exercise together with the interpretations and

conclusions derived from them by the evaluators. The interpretations and conclusions are fully

based on evidences given by the findings and patterns derived from them. The findings are

discussed under the evaluation questions stated in chapter two.

4.1 What impact does TIA have in preparing guardian teachers in the use of participatory

teaching techniques and low cost resources?

TIA workshop is one of ITT activities. In 2014 the workshop was attended by 45 participants.

Forty of them came from the new 20 schools and other 5 came from ‘old’ schools to replace

former guardian teachers. The participants got training on LCP and subject content knowledge in

sciences, mathematics and English. At the end of the workshop, 36 participants took part in TIA

Evaluation survey.

TIA Evaluation survey had 22 items. For the purpose of answering evaluation question 1, the

responses about LCT theory and practices, and the use of low-cost resources are presented.

Figure 1 and Figure 2 provide the summary of the findings on these items.

FIGURE 1: Ratings on LCTaspects and attitude to TIA

0%

10%

20%

30%

40%

50%

60%

70%

80%

90%

100%

LCT USEFULL WILL USE LCTIN

CLASSROOM

CONSUMETIME

WILL ATTENDTIA AGAIN

STRONGLY AGREE

AGREE

NEVER

23

FIGURE 2: Findings related to the use of low cost resources

Figure 1 indicates that all participants ‘agreed’ (69% strongly) that the training they got

concerning LCT was useful and all promised to apply the knowledge in their schools. In addition

to that all participants valued TIA training by promising to come back, if given the chance.

However, it was clear that a small but considerable number of teachers (31%) had some doubts

on the time spent in classroom if one uses LCT approaches. They thought LCTs consume time.

It is evident in Figure 2 that all the participants felt (more than 76% strongly) that the training on

the use of low-cost resources was useful, and gave them ability to create low-cost resources from

locally available materials.

Moreover, when responding to an open question “what aspect did you like most in the

workshop?” Seventy three percent (73%) of the participants referred to the aspect of ‘LCT”.

School-based workshops

In addition to TIA evaluation survey, eighteen reports of SBT monitors from eighteen sampled

schools provide quite useful findings concerning the impact of TIA in preparing learner-centred

teachers.

SBT Monitors (university lecturers) reports showed that guardian teachers used a variety of

learner-centred teaching techniques (LCTs). The mostly used ones are group discussions, cold

76%83%

24%17%

INFORMATION WAS USEFULL HELP ME TO BE ABLE TO CREATE

STRONGLY AGREE AGREE

24

calling, think pair share, and questions and answers. Table 2 provides the summary of the learner

centred teaching techniques (LCTs) frequently used.

Table 2: Mostly used LCTs in facilitating SBWs

S/N LCT Technique %

1 Group Discussion 17

2 Group Presentations 15

3 Questions and Answers 15

4 Think Pair Share 11

Moreover, 78% of SBT reports in the sampled schools indicated guardian teachers used low-cost

teaching aids at different rates when facilitating school-based workshops. 66% used two or more

improvised teaching aids, and 12% used one teaching aid per workshop. 22 % of the reports

didn’t provide information about the use of low-cost resources.

Other findings were obtained from guardian teachers meeting. The meeting took place in the

second quarter of year II of the project (July 2014). The teachers were called to share their

experiences in the facilitation of SBT. Thirty three (33) teachers out of 40 (invited) attended the

meeting in Arusha.

Table 3: Number of SBWs conducted and how SBT has been integrated in school calendar

Number of workshop facilitated

Number Frequency Percent

2 -3 3 9.1

4 5 15.2

5 14 42.4

More than 5 11 33.3

Total 33 100

The extent to which schools have integrated LCP in their teaching curriculum

Yes 24 72.7

No 9 27.3

Total 33 100

25

Table 3 shows the number of SBWs that took place in Year 1 and the extent to which SBT has

been incorporated in school calendar. The table indicates that 76% of Yr. 1 (2013) schools

conducted at least five SBWs in 2013-2014 project year. This is different from 2014-2015 in

which the maximum number of SBW per Yr. 1 school was two (one in September 2014 and

another in March/April 2015).

Conclusions

TIA training achieved ITT goal of preparing participants on LCP and the use of low-cost

resources.

Not all LCTs taught in TIA were frequently used in facilitating SBWs. This calls for review

of TIA facilitation techniques.

At least 30 out of 40 Yr.1 schools (75%) did at least 4 SBWs in the first year as compared to

only 2 in 2014 – 2015. These findings are crucial in understanding patterns in the student

academic performance from 2012 – 2014.

4.2 What impact does SBT have in influencing the use of participatory teaching techniques

and low cost resources?

There was also the need to evaluate the effectiveness of SBT program in influencing SBW

participants (teachers) in the use of child-centred approached to teaching and low-cost resources.

After TIA Workshops, the participants qualify to be guardian teachers (ToT). Their role is to

train teachers on LCP and its application in different context, such as the use of low-cost

resources. The findings about the impact of SBT in teaching process were fully collected from

classroom observation exercise conducted in 30 classrooms from eighteen sampled schools.

Use of LCTs

The teaching techniques listed in Table 4 are those that teachers experienced and taught in TIA

Workshop and also expected to be taught in SBWs. The aim was to ‘check’ whether these

techniques are used in ITT school classrooms or not and at what rate. Table 4 presents a

summary of LCTs observed and their frequency.

The table shows that all (but two) LCTs taught in TIA and SBWs were observed in 30 classes in

the period of one-week. Debates and loop-the -loop were the only techniques not observed.

26

Table 4: Learner-Centred Techniques used in ITT Project Schools

S/N Observed Teaching Technique YES (Freq.) % NO (Freq.) %

1 Lesson Outline 19 63 11 37

2 Essential Questions 13 43 17 57

3 Do now (Head Start) 12 40 18 60

4 Interview Me 4 13 26 87

5 Ball toss 5 17 25 83

6 Interactive lecture/guided lecture 16 53 14 47

7 Hangman 4 13 26 87

8 Count down 7 23 23 77

9 Group discussion 24 80 6 20

10 Class room presentation 16 53 14 47

11 Jigsaw grouping 4 13 26 87

12 Social barometer 1 3 29 97

13 Debate 0 0 30 100

14 Think pair share 21 70 9 30

15 Cold calling 24 80 6 20

16 Question and answer 26 87 4 13

17 Learning stations/Activity circus 2 7 28 93

18 Bicycle chain 2 7 28 93

19 Visual aids (e.g. interactive posters,) 14 47 16 53

20 Take it outside 2 7 28 93

21 Everyone writes 14 47 16 53

22 Heads down, thumbs up 4 13 26 87 23 Student’s praises (e.g. clap, very good etc) 26 87 4 13

24 Exit ticket 6 20 24 80

25 Hot seat 3 10 27 90

26 Loop the loop 0 0 30 100

27 Stepping stones 1 3 29 97

28 Peer assessment 13 43 17 57

The most frequently used LCTs were: Questions and answers (87%); Group discussions (80% -

item no. 9); and think-pair-share (70%). These findings provide the similar information as that

obtained from SBT monitors reports (Table 2).

The LCTs with very low frequency were: Loop-the-Loop, and Debate, (0%); Social barometer

(3%); Stepping stones (3%); “Take it outside” (7%); Bicycle chain (7%); and Learning stations

(7% - item no. 17)

27

The fact that debates were not observed in classrooms contradicts the other findings that show

that there is an improvement in English debate competitions in schools. Considering English

debates as an approach only applicable in English classes might have caused this contradiction.

The most frequently used LCTs such as questions and answers and think-pair-share, are

‘probably’ preferred because of the nature of the classrooms. Many classrooms are congested

and large, making it difficult to have many movements. On the other hand, some of the least

frequently used LCTs such as interview me, hot seat, and ball toss are very easy to use and

promote student interest in the lesson. The fact that they are not frequently used calls for the

reinforcement of these techniques in the coming TIA Workshops.

Use of different aspects of LCT

Table 5: Frequency of occurrence (agree and strongly agree) of LCT aspects

S/N ITEM OBSERVED Freq. %

1 Lesson began by telling students where the lesson headed and why 19 63

2 Lesson began with a hook to get students' attention 17 57

3 Lesson equipped students with knowledge needed to meet learning goals 29 97

4 The lesson drew on and activated students' prior knowledge 27 90

5 Lesson addressed multiple intelligences 17 57

6 The lesson promoted conceptual understanding, not just factual learning 26 87

7 The lesson promoted critical thinking 20 67

8 Lesson was relevant, drawing connections to the real world phenomena 25 83

9 Teachers demonstrates strategies to promote gender Equity 21 70

10 The teacher used friendly means to discipline students during lesson 18 60

11 The teacher responded positively to questions asked by students 14 47

12 The teacher rewarded or praised students during lesson 26 87

13 The teacher used open-ended questions (e.g. why..., How.., etc) 21 70

14 The teacher was able to students' interests and concentration 26 87

15 The teacher was acted as a resource person, working to support, and enhance student investigation

27 90

16 The teacher was able to devise and use a variety of procedures to evaluate progress in the lesson

21 70

17 The teacher was able to use teaching aids such as models, posters, worksheets, science equipment, and cards, etc.

19 63

18 Students communicated their ideas to others through a variety of means 23 77

19 Lesson was organized to optimize learning 24 80

20 The lesson was learner-centred 25 83

28

The observers, using observation rubric, rated the teachers on how well they ‘touched’ different

aspects of LCP. In that rating, 1 meant strongly disagree, 2 – Disagree, 3 – Not sure, 2 – Agree,

and 5 – Strongly agree.

Table 5 provides only the frequencies of the classes rated ‘strongly agree’ and ‘agree’ in

different aspects of the rubric. The table shows all items except one (item no. 11) had a

frequency of 60% and above. This means each LCT aspect appeared in at least 18 lessons out of

the 30 lessons observed. This includes the most crucial aspects of LCT such as catering for

multiple intelligences, addressing gender equity, and promoting critical thinking and conceptual

understanding.

Conclusions

Only one conclusion is evident from tables 4 and 5, all teachers use learner-centred teaching

techniques to facilitate their classes:

Most used LCTs are those that involve talking and easy to apply such group discussions;

think-pair share; question and answers.

Teachers equip students with needed knowledge and skills to achieve lesson objects

Teachers promote conceptual understanding and critical thinking

Lessons connect the concepts taught and real world situations

Teachers promote gender equity

Teachers promote students’ interest and concentration to the lessons

Teachers are supportive to students

Comparison between different groups

The observed teachers were graded based on the ratings of the 20 items. Table 6 summarizes the

grades.

Table 6: Average Score for teachers grouped in different SBT Categories

S/N Category Average Rating Score Grade

1 Guardian Teachers 73 B

2 SBW Participants 78 B

3 Excellent Schools 80 A

4 Very Good Schools 74 B

5 Average Schools 72 B

6 Poor Schools 85 A

29

Table 6 indicates the difference between the grades achieved by teachers in schools rated

‘excellent’ and teachers in other schools rated ‘very good’, and ‘good’. Teachers in ‘excellent

schools’ did better than those in very good and ‘good’ schools. However, the finding that

teachers in ‘poor’ schools did better in the use of LCT aspects than those in other categories, and

SBW participants did better than guardian teachers, came as a surprise. However, variability of

observers’ rating skills and subjectivity as well as other uncontrolled factors might be the best

explanation of these findings.

4.3. What impact does the school-based training (SBT) model of child-centred teaching have

on student academic performance and cognitive development at the secondary school level?

Impact to Learning Engagement and critical thinking

Classroom observation exercise in eighteen schools was also meant to evaluate the impact of

TIA and SBT in the aspect of how students are engaged actively in the learning processes. It is

already evident in Tables 4 that students learn through group discussions, think-pair-share and

questions and answers. Table 5 also indicates how well students communicate their ideas to

fellow students ‘through a variety of means’.

Moreover, classroom observation exercise, as seen in Table 7, has shown how many times

students asked and answered questions as one of the expected impact of the use of LCT.

Table 7: Rate of asking and answering questions by students

S/N Observed Students' Participation (Asking Questions) BOYS GIRLS

No. No./Period Freq. % Freq. %

1 Questions asked by students related to conceptual understanding

100 3 62 62 38 38

2 Questions asked by students related to factual understanding

54 2 28 52 26 48

Total (questions asked) 154 5 90 58 64 42

Observed Students' Participation (Answering Questions) BOYS GIRLS

No. No./Period Freq. % Freq. %

3 Questions answered by students related to conceptual understanding

215 7 107 50 108 50

4 Questions answered by students related to factual understanding

204 7 98 48 106 52

Total (questions answered) 419 14 205 49 214 51

30

Table 7 can be interpreted as follows:

Students answered more questions (14 per period) than they asked (5 per period).

There is a very small difference in the number of questions answered by girls as compared to

those answered by boys. Girls answered slightly more questions (51%) than the boys did

(49%).

There is a considerable difference in the number of questions asked by boys and girls. For

each period girls asked two questions (64/30) as compared to boys who asked three (90/30)

questions.

55% of the questions asked and answered (315 out of 573) sought or clarified conceptual

understand as compared to those that sought or clarified factual understanding (45%).

Conclusions

The findings imply that students participate actively in the learning process and there is

good interaction among themselves and with their teachers. Questions asked and

answered clearly show how confident and comfortable students feel when learning.

Moreover, there is a clear engagement of girls in the learning process through asking and

answering questions. However, the fact that girls ask fewer questions may be interpreted

as lack of confidence in themselves as compared to boys.

Lastly the findings in Table 7 imply teachers promote conceptual understanding as

demanded by SBT program (LCT theory).

The correlation and impact of TIA and SBT to student learning outcomes

One of the most crucial indicators of the success of the project is its ability to impact student

learning outcomes. Hence the evaluators wanted to find out if students’ academic performance

changed in schools that implement ITT project activities. The logic behind is, if teachers are well

trained on LCP, they will promote inquiry and critical thinking, active participation in

classroom, and learning interactions that will eventually improve student’s academic

performance in their respective optional subjects.

The comparison of academic performance was made between project schools and control

schools. The control schools were selected using three criteria: they are from the same region; of

31

the same nature (type) to project schools; and have taken part in national form four examinations

in all three years (2012 – 2014).

On the other hand the evaluators wanted to see if there is any significant difference in academic

performance between ‘excellent schools’ (schools that conducted many SBWs) and the ‘poor

schools’ (schools that did very few SBWs).

Data used to evaluate the impact of the project in the learning outcomes came purely from

NECTA’s national form four examinations data base (website). 2012 examination results are

taken as point of reference (baseline) from which the changes in performance (whether positive

or negative) for 2013 and 2014 is calculated.

Tables 8 and Figure 3 show the percent of students, in project and control schools, who passed

the national examinations in the three years. Pass rate in this context refers to students who got

Division I, II, and III (for 2012 and 2013) and those who got distinction, merit and credit1 in

2014.

Average academic performance of project schools from 2012 - 2014

Table 8: Average Pass rate of Project Schools in National Form IV examinations

2012 2013 2014

School Pass No. Pass Rate Pass No. Pass Rate Pass No. Pass Rate

EDMUND RICE 75/213 33% 157/228 69% 155/209 74%

MAKUMIRA 15/73 21% 44/81 54% 8/23 35%

ORKEESWA 9/31 29% 17/29 59% 19/25 76%

MANGISABASI 3/86 3% 8/23 35% 2/19 11%

HAIDAY 3/35 5% 5/21 24% 29/97 30%

NSOO 25/66 38% 59/67 88% 50/61 81%

LONGIDO 38/229 17% 71/243 29% 69/290 24%

MAWELLA 2/95 0% 1/42 2% 2/9 22%

ENABOISHU 26/155 13% 79/164 48% 79/168 47%

1 Note: Evaluators, for professional reasons, didn’t consider ‘Division iv’ and ‘pass’ categories as passes.

32

Average academic performance of Control schools from 2012 – 2014

Table 9: Control School Performance in National Form IV from 2012 - 2014

2012 2013 2014

School Pass No. Pass Rate Pass No. Pass Rate Pass No. Pass Rate

ARUSHA DAY 17/78 22% 53/95 56% 131/373 35%

MUKWASA 1/90 1% 3/67 4% 0 0%

NGARENANYUKI 11/75 15% 39/74 53% 55/104 53%

KIBOSHO GIRL 149/164 91% 154/155 99% 146/147 99%

MANUSHI 9/71 13% 3/67 4% 3/17 18%

KALOLENI 2/7 29% 77/243 32% 79/198 40%

MRAMA 5/121 4% 11/83 13% 8/63 13%

ELERAI 1/17 6% 17/70 24% 19/101 19%

MANGISINA 7/130 5% 8/57 14% 6/37 16%

LANGASANI 15/167 9% 7/31 23% 40/83 48%

Average 19% 32% 34%

Comparison between Project Schools and Control Schools

Figure 3: Performance of Project schools as compared to that of control Schools

0%

5%

10%

15%

20%

25%

30%

35%

40%

45%

2012 2013 2014

AVERAGE PERFORMANCEIN PROJECT SCHOOLS

AVERAGE PERFORMANCEIN CONTROL SCHOOLS

33

Comparison between ‘Excellent’ Schools and ‘Poor’ Schools

Table 10: Comparison between Project Schools (Good vs. Poor) from 2012 - 2014

2012 2013 2014

Category School Pass No.

Pass Rate (%)

Pass No.

Pass Rate (%)

Pass No. Pass Rate (%)

Excellent EDMUND RICE 75/213 33% 157/228 69% 155/209 74%

MAKUMIRA 15/73 21% 44/81 54% 8/23 35%

ORKEESWA 9/31 29% 17/29 59% 19/25 76%

MANGISABASI 3/86 3% 8/23 35% 2/19 11%

HAIDAY 3/55 5% 5/21 24% 29/97 30%

Average 18% 48% 45%

Poor NSOO 25/66 38% 59/67 88% 50/61 81%

LONGIDO 38/229 17% 71/243 29% 69/290 24%

MAWELLA 2/95 0% 1/42 2% 2/9 22%

ENABOISHU 26/155 13% 79/164 48% 79/168 47%

IRKISONGO 1/58 0% 13/151 9% 16/97 17%

Average 14% 35%

38%

Figure 4: Comparison between ‘excellent’ and ‘poor’ schools

0%

10%

20%

30%

40%

50%

60%

2012 2013 2014

AVERAGE PERFORMANCE INPROJECT EXCELLENT SCHOOLS

AVERAGE PERFORMANCE INPROJECT POOR SCHOOLS

34

Tables 8, 9, and 10 and their related Figures 3 and 4 imply a number of things:

- The average academic performance (42%) of the project schools improved in 2013 as

compared to the percent to that of 2012 (16 %). In 2014 the average performance remained

constant (42%).

- The comparison between project schools indicated that in 2012 the performance of control

schools (19%) was higher than that of the project schools (16%). However this scenario

changed in 2013 and in 2014 where the average percent of students who passed national

form four examinations in project schools (42%) was far higher than that of the control

schools (32% and 34% respectively).

- The comparison between the performance of the ‘excellent schools’ and ‘poor schools’

indicated a small difference in the percent of pass rate in 2012. In 2013 and 2014 the

difference in the average performance of ‘excellent schools’ was clearly higher than that of

‘poor schools’. However, in 2014 while there was a small increase in the average

performance of poor schools, the performance of the ‘excellent schools’ dropped slightly.

The reason for the drop couldn’t be easily explained by the quantitative data.

Average Performance of project schools in Sciences, Mathematics and English

TIA training prepares teachers in both content and pedagogy. During evening sessions guardian

teachers divide in their respective subject groups to be trained on how to apply LCP in teaching

challenging content topics. The evaluators traced the impact of content knowledge training on

students’ performance. Table 11 shows that the average performance of ten ITT schools in these

subjects improved in 2014 NECTA examinations relative to 2013 ITT Mock examinations. The

schools are: Edmundrice, Enaboishu, Fuka, Makumila, Nanja, Engutoto, Engutoto, Lowasa, Rift

Valley, Olesokoine and Visitation.

It should be noted that an additional tool of assessing student outcomes as tied to TIA, SBT and

academic achievement included the baseline of a F3 grade level mock exam (in 2013) followed

by a F4 mid-year mock exam and the final F4 NECTA exam (in 2014). The main aim of mock

exams was to link the ITT program activities (TIA trainings, SBTS, parental meetings, Debate)

and the student’s performance.

35

Table 11: Average performance of Ten ITT schools in Sciences, Mathematics and English

S/N SUBJECT AVERAGE PERFORMANCE

IN F.III MOCK EXAM 2013

AVERAGE PERFORMANCE IN

F.IV NECTA EXAM 2014

1 ENGLISH 29.40% 63.70%

2 CHEMISTRY 28.80% 73.90%

3 PHYSICS 40.97% 51.50%

4 BIOLOGY 28.70% 56.20%

5 B/MATHS 16.30% 24.20%

The administrations of form three mock examinations started back in 2013 including students

from 36 out 40 schools with an approximate total number of 3931 students and 141 as absentees

(Mock results data, 2013). In 2014 more than 7200 students from 57/60 SBT schools were tested

on five subjects namely: Physics, chemistry, Biology, Mathematics, and English.

ITT Mock examinations were well prepared by experienced teachers in collaboration with

district examination syndicates under the supervision of the DEOs. As noted earlier, 2013 ITT

Mock examination results are taken as baseline data.

Conclusions

TIA and SBT improved learning outcomes of students as measured by national form four

examinations. The percent of the students who passed national examinations was higher

in 2013 and 2014 increased as compared to when the project started in 2012.

This positive change in academic performance of students in project school is echoed by

the comparison between project schools and control group. In 2012 before ITT’s

intervention, project schools did slightly poorer (16% pass rate) than the control schools

(at 19% of pass). Things changed with the intervention of the project in 2013 and 2014

when the project did far better.

Despite the clear better performance of project schools as compared to that of control

groups, the average percent of passing the national examinations in 2014 remained

constant as compared to that of 2013. Constant performance in 2013 and 2014 needs

36

research to know what happened. However, the best hypothesis is the intervention of

SBT for ‘old’ (2013 group) schools in 2014 was weaker than that in 2013. This might be

quite true. In 2014-2015 the focus shifted to new schools and left ‘old’ schools doing

only one SBW in September 2014 different from 2013 where 75% of the schools (as

noted earlier) did at least four SBWs per school.

The impact of project’s training programs is also evidenced by improved performance in

sciences, mathematics, and English in two years of the project’s intervention.

4.4 What is the impact of TIA-SBT model for child-centred learning in promoting English

skills through PDF approach for English Debates?

Debate is among the key component of ITT project for active student learning and engagement

in one of the foundation subject of English. Using the Award Winning, Public Debate Format

(PDF), English Debate Program was meant to improve student levels of English competence,

confidence and critical thinking skills. The project believes that there is a huge connection

between students’ English proficiency, improved learning process and the ultimate academic

performance. Through TIA training workshop 18 English guardian teachers from 20 schools

were trained on PDF format.

Under the supervision of ITT and the coordination of AAF, MWECAU English faculty

facilitated 3 cluster workshops to develop Tanzania English teachers’ skills in engaging their

students in English language development. Guardian teachers trained in English content

knowledge form school-based debate clubs in which all students participate. Teachers teach,

facilitate and instil PDF format understanding and practice to students by using particular

topics/motions.

The extent to which English debate is made part of school curriculum

Table 12 indicate findings obtained from the survey conducted to forty three (43) English

teachers. All respondents made it evident that every school they came from conducts at least one

debate per week. Moreover 40 out of 43 (93%) noted that their schools have English Debate in

the annual calendar.

37

Table 12: The Extent to Which English Debate is part of school routine

Responses Frequency Percent

Number of school based debate held per week at school

Once 38 88.4

Twice 5 11.6

More than twice 0 0

Total 43 100

Whether debates are well captured in schools calendar

Yes 40 93

No 3 7

Total 43 100

(Source: Project progress assessment data, 2014/2015)

The improvement in English Debate effectiveness and participation

Table 13: shows teachers’ opinions about the effectiveness and participation level n English

debate in their schools.

Table 13: English Debate improvement and effectiveness in their schools

Response Frequency Percent

Rating improvement, effectiveness of cooperation in school debate club facilitation

Excellent 21 48.8

Very good 13 30.2

Good 9 20.9

Total 43 100

Approximate number of students that participate in school debate

10-30 students 2 4.7

40-60 students 12 27.9

70-100 students 9 20.9

100+ 20 46.5

Total 43 100

(Source: Project progress assessment data, 2014/2015)

38

All respondents noted through their (good to excellent) responses that their schools have

improved and are effective in doing English debates based on PDF format. This was geared by

the fact that school management understood the importance of PDF debate format in building

students confidence and critical thinking skills. Moreover, 67.4% of the respondents said more

than 70 students participate in English debates in their schools.

Improved students’ linguistic skills and ability to make informed and logical arguments

Table 14: Teachers’ responses on students’ ability to engage into critical thinking

Responses Frequency Percent

Students have competence and ability to connect topic to the real world situation

Strongly agree 25 60.4

Agree 12 27.9

Neutral 5 11.7

Total 43 100

Ability to reflect, engage and criticize each other by logical arguments and

reasoning

Strongly agree 7 16.3

Agree 22 51.2

Neutral 14 32.6

Total 43 100

(Source: Project progress assessment data, 2014/2015)

Argument, assertion, reasoning and provision of evidence constitute the biggest part of PDF

format. Table 14 shows 88.3% of respondents said that students have developed competence in

English speaking skills in classrooms. 67.5% of respondents noted students’ improved ability to

argue critically.

Students’ understanding and perception of PDF and debate competition

Table 15 provides responses of students who participated in the debate program about English

debate program. From data in Table 15 it is evident that there is a commendable improvement of

students’ debate knowledge (84.3%) and high level of language mastery as evidently

demonstrated during debates activities (52.9%). Moreover, English debates increased students

level of confidence to speak not only in front of other students but also before the invited guests

during clusters competition (61.4%).

39

Table 15: Students’ responses on their linguistic skills and knowledge about PDF program

Responses Frequency Percent

Students status on the knowledge of public debate format (PDF)

Yes 59 84.3

No 11 15.7

Total 70 100

Students ability to understand, speak, write and read English

Excellent 37 52.9

Very good 26 37.1

Good 7 10

Not good at all 0 0

Total number 70 100

Level of confidence and competence to speak in front of others

Excellent 43 61.4

Moderate 26 37.1

Poor 1 1.4

Total number 70 100

(Source: Project progress assessment data, 2014/2015)

Improved Performance in English examinations

Figure 5: School Performance in English Examinations

0%

20%

40%

60%

80%

100%

120%

PERFORMANCE IN 2013 F3BASELINE ENGLISH MOCK EXAM

PERFORMANCE IN F4 2014ENGLISH NECTA EXAMS

40

Figure 5 provides an evidence of English Debate training (PDF) in schools had a significant

impact to student academic performance. In all schools the comparison between ITT F.III mock

results and NECTA examination results in English has shown a positive change (a rise in the

average performance). It is worthy to note than the two examinations were conducted to the

group of students.

Conclusions

From the findings presented in this section of PDF, it can be concluded that:

English debate competitions are now part of schools’ routines and annual calendars.

Most of the 20 schools created debate clubs and held debate twice a week (88.4%). The

English debates activities in all schools taking part in the program have increased and

many students (more than 70 per school) participate in the debates. Most of the schools

demonstrated a high level of self-initiative on debate planning and implementation;

created set schedules, club management, and selection of topics relevant to students’

academic work.

Students linguistic (reading, writing, and speaking) skills have improved; and their

competence, confidence and argument ability in public debates have improved. This was

evidenced during the inter-cluster competition (84.3% of students). The level of

confidence and competence in debates has a positive implication in students’ academic

performance as students are obliged to conduct research to enable them to refute during

debate competitions.

Debate competitions demonstrated that students have ability to use of ARES and

grammar well in comparison to the situation before the project intervention. There is a

recognizable level of students’ confidence, competence and critical thinking skills as

noted by observers.

Significant enthusiasm demonstrated by many teachers who felt challenged both from the

competition and a desire for more training to fully understand the whole concept behind

PDF model.

41

4.5 What impact does increased levels of parental support for education have on teacher

accountability and student participation?

Improvement of students’ academic performance does not result from one intervention but an

array of interventions. The nature of the project, target communities and target schools require

scaffolding which calls for stakeholders and parental engagement contributions. The government

and communities that own such schools have a central role to play for sustainability during and

after project phase out.

Parental Engagement activities in 2014-2015

In 2014-2015, under ITT Project, parental engagement meetings called 300 parents (50 invited

parents from 6 clusters – Edward Lowassa, Manyara and Rift valley (Monduli district) Longido

(Longido district), Magadini and Karansi (Siha district). 50 parents from each cluster were

trained and made champions in their clusters on educational related matters.

Parents and stakeholders invited during parental engagement meetings included: Parents, Village

chairpersons, head of schools, ward representatives, religious leaders, village and ward

executives, teachers, senior district/local government officials (education, community

development officers) and traditional leaders who are highly respected across the project target

communities/areas.

Parental Engagement activities in 2014-2015 included a number of activities. These are:

Formation of 6 strong clusters enhanced the connection between students and teacher.

Parents and other stakeholders created a voluntary task force to promote formal education

to underprivileged areas.

After training participating parents and teachers, they self-organized and created

responsibilities for themselves to support the students in learning and schools academic

performance. There are 6 clusters each with 50 champions selected to disseminate

students’ academic information across the target community.

Schools conduct up to 3 meetings per year where parents and teachers meet and discuss

issues around students’ academic work.

42

How parental engagement meetings influence student academic progress in schools

In a panel (group discussion), sixty two (62) participants of parental engagement meetings stated

the strategies they use to influence student learning progress. Table 16 summarizes the

responses:

Table 16: Parents’ strategies in influencing students’ academic progress

Means used for follow ups and monitoring of students’ academic progress

Strategy Frequency %

Traditional meetings 29 48.8

Consistent communication with school Management 18 27

Individual parents follow ups 15 24.2

Total number 62 100

Presence of parent education task force to represent others in school management action

Response Frequency %

Yes and functional 53 85.5

Not formed 9 14.5

Total number 62 100

(Source: Project progress assessment data, 2014/2015)

From the panel (Table 16) it was learnt that various initiatives have been put in place to make

sure that schools management are also responsible and answerable to parents on student

academic related matters. One of them is making a follow-up of issues during traditional

schools’ parent day. In this day, parents discuss about the general school development and

students’ academic issues.

Moreover, participants of parental engagement meetings have figured out other means of getting

into students’ academic issues such as using cell phones to communicate and discuss about

students education matters. Moreover, some parents said they feel and get satisfied when they

visit school physically and summon teachers on their children’s academic performance.

In some clusters these parents have a special task force which disseminates information to others

during village, ward and traditional meetings. This looks very effective as each one of the

schools that have opted for education task force has updated education agenda in the meeting

whenever it is held.

43

Conclusions

Parental engagement in children’s learning progress might be quite influential in

promoting accountability of schools and improving students’ learning outcomes.

Parental engagement has delivered skills to the community stakeholders.

4.6 What influence does ITT have on the local sustainability of the school-based training

(SBT) model of child-centred teaching?

This question seeks to know how the project engage schools in thinking and contributing in

making SBT program sustainable. Based on feedback from Heads of schools (HOS), District

Education officers (DEOs) and Guardian teachers in different meetings, and reports from SBT

Monitors, There are four ways by which schools have demonstrated the ownership of SBT

program.

a) All schools taking part in the project signed the MOU that demonstrated their commitment in

ensuring the program is well facilitated and given the space in the school calendar. The MOU

was signed by heads of schools in the stakeholders meeting in Arusha in June, 2014.

b) Ten schools labelled ‘excellent’ such as Boma, Edmundrice, and Orkeeswa conduct extra

number of SBWs outside the scheduled ones. These schools consider the program significant

in improving teaching practices and learning outcomes. ITT project motivates the guardian

teachers in these schools by providing facilitation stipend whenever they do one SBW in

addition to the scheduled ones. In return the teachers send workshop reports to SBT

coordinator.

c) All schools, share costs of implementing SBT program at their schools. Although the big

portion of the costs is borne by project, schools contribute some amount of money to make

SBWs possible. Some schools contribute tea and lunch; others contribute resources,

particularly the schools with a big number of teachers at which 50,000 and 30,000 provided

by the project is not enough for food and resources respectively.

d) District Education Officers have recognised and accepted project activities in their districts.

This is evidenced by signing of MOU and taking part in different project activities. The

activities include attending parental engagement sessions, being members of Mock

Examination committee, and attending stakeholders meeting. Moreover, the DEOs promised

44

to provide financial support to schools that are economically poor to help them conduct

SBWs.

Conclusion

The project is doing much in preparing the ground for the sustainability of SBT Program and

other ITT Project activities such as parental English debates and parental engagements.

Ownership of ITT by stakeholders is mandatory to the success of the project activities

4.7 What is the impact of the ITT Project’s advocacy for integration of the guardian teacher

training (TIA) and school-based training (SBT) model into Tanzania’s national secondary

school teaching processes?

The long term goal of both MWECAU’s TIA Program and ITT project is influencing National

INSET Program through TIA-SBT model of child-centred learning. It was known from the

beginning of ITT Project that this influence could only be possible through forging partnership

with the central government. ITT- MOEVT partnership efforts were scheduled for third year of

the project (2015-2016). Fortunately, through good efforts of ITT management, the talks with the

government have happened earlier than anticipated.

Late 2014, ITT Project gained Central Government’s recognition, and reception. Through

meetings between ITT management and Government Officials, harmonization of TIA’s and

National INSET Program’s training materials was initiated. Moreover, in December, 2014

technical teams from ITT’s TIA and National INSET Program met to harmonize both the content

and the process of teachers’ INSET based on two programs’ original documents.

Conclusion

There is high potential and willingness for the Ministry of Education and Vocational Training to

partner with ITT project to conduct in service teacher trainings for Science, Mathematics and

English teachers.

ITT – MOEVT talks and harmonization of training documents provide a bright future for TIA

Training in terms of sustainability and national scaling of child-centred teaching approaches.

45

4.8 What is the potential for scaling of TIA training and its decentralized school-based training

(SBT) model of child-centred teaching from MWECAU to other education institutions?

ITT Project intends to scale TIA training model to other higher education institutions in the

country. However, before that happens, it was necessary to see if that scaling is feasible.

Therefore, in 2014-2015, TIA program was extended to a new education institution, Sebastian

Kolowa Memorial University (SEKOMU). SEKOMU’s invitation to the project was meant to

assess the readiness and ability of other universities to carry out successfully TIA and SBT

Programs that have traditionally been conducted only by Mwenge Catholic University

(MWECAU) which also initiated and owns TIA.

The Process of Scaling of TIA to SEKOMU

The project management conducted TIA training at SEKOMU (pilot project) in February 2015,

this makes SEKOMU the second training institution selected in the second year of the project

implementation. SEKOMU’s selected lecturers underwent all required steps of training in

coordinating, facilitating, and monitoring TIA and SBT Programs.

The scaling of TIA to SEKOMU in 2014 – 2015 involved the training of five SEKOMU

lecturers on LCP and TIA facilitation skills. The training took place successfully in six stages:

a) One Faculty member from SEKOMU attended TIA Workshop in July 2014 at

MWECAU and took part as both an observer and a participant. This lecturer was being

prepared to be a training coordinator.

b) SEKOMU lecturers were introduced to TIA and SBT Programs at SEKOMU that took

place in September, 2014. The training was facilitated by TIA Program coordinators from

MWECAU and ITT Manager. The training was generally successful.

c) The five SEKOMU lecturers who attended TIA Training at SEKOMU went to three

different schools in Moshi, Siha and Arumeru districts to learn how SBT is facilitated by

guardian teachers and monitored by SBT Monitors from MWECAU.

d) From March 1st to 7th 2015, SEKOMU faculty conducted the Pilot TIA Workshop at

SEKOMU to twelve teachers from six schools. The training was facilitated under the

supervision of two TIA facilitators from MWECAU. Apart from the general sessions on

pedagogy, the participants got training on subject content (physics, chemistry,

46

mathematics, biology, English and ICT). The training was successful with some observed

weaknesses on the mastery of learner-centred teaching techniques (LCTs) on the sides of

the participants.

e) Following the weakness in mastery of some LCTs, SEKOMU faculty under the advice of

ITT Manager, prepared one day workshop to reinforce LCTs for both SEKOMU’s TIA

team and the guardian teachers from six schools. The workshop was a great success and

was planned and facilitated by three lecturers from MWECAU.

f) Lastly, SEKOMU Faculty, in March 2015 and under the observation of the three

MWECAU lecturers coordinated and monitored their first school-based workshops in the

selected six schools.

The general observation from the Pilot TIA training and the consequent SBT training revealed

that needs assessment should be conducted to establish the most specific subject needs of the

selected schools. Needs were identified by three TIA facilitators from SEKOMU through

administration of questionnaire.

The assessment indicated that 6 out 12 teachers (50%) preferred TIA training to concentrate on

contents rather than pedagogy, arguing that pedagogy cannot bear fruits where there is an acute

lack of contents knowledge. The rest of the teachers (50%) either preferred training on pedagogy

or on both (content and pedagogy).

Conclusions

Teaching in Action Model can be replicated at different higher learning institutions hence

impact more secondary school teachers across Tanzania.

The scaling of TIA training model to another education institution through training stages

ensures competence and skill.

Science, Mathematics and English teachers need not only pedagogical skills but also deeper

content and participatory skill development.

The competence in facilitating LCP –linked INSET program can’t be achieved over night. It

can be developed through some experiences obtained from facilitating many workshops.

47

4.9 How does the training on leadership role-modelling impact on school administrators and

teachers who see themselves as leaders on teacher motivation and student performance?

In order to have a smooth implementation of ITT project in schools, different aspects of

leadership were covered in year 2 of the project implementation. Quality, roles and

responsibilities of leaders were explored during TIA training and teachers were expected to share

this knowledge back in their respective schools.

Table 17 stipulates what was discussed during TIA’s leadership training and its impact on

students’ academic performance particularly for year 2 schools (20 schools in number). 39

guardian teachers took part in the survey about leadership training.

Table 17: Assessment of the demonstration of leadership quality in schools

Rank your leadership confidence and competence as a result of TIA leadership training

Response Frequency Percent

Best 13 33.3

Better 25 64.1

Good 1 2.6

Total number of respondents 39 100

Means used by teachers to share leadership knowledge with others in and out of schools

Conducting seminars and debates 23 59

Participation in school (teaching by doing) 14 35.9

Highest level of being in team work and proactive 2 5.1

Total number of respondents 39 100

(Source: Project progress assessment data, 2014/2015)

It is clear from the teachers’ responses that the training on leadership improved their confidence

as leaders in schools. 64.1% of them felt they are in better shape after training at MWECAU.

Moreover, the teachers (TIA participants) shared areas in which their leadership potential could

be useful. They hinted that teachers use different means to share and disseminate leadership

information such as seminars and debates (59.0%), leadership in action (35.9%) and others said

though team working and being proactive.

48

Assessment of strengths and weaknesses of TIA leadership training in teaching field

Table 18 provides teachers responses about the strengths and weaknesses of Leadership Training

some months after TIA Workshop.

Table 18: Strengths and weaknesses of TIA leadership training

Responses Frequency Percent

What could were the main strengths of TIA leadership training

Characters and quality of teachers as leaders 23 59

Leadership in teaching profession 16 41.1

Total number of respondents 39 100

What were the weaknesses of TIA leadership training

Characters of good leadership in the teaching field 9 23.1

Leadership versus transparency and accountability 2 5.1

Training should have considered inviting heads of schools 28 71.8

Total of respondents 39 100

(Source: Project progress assessment data, 2014/2015)

According to the surveyed teachers the main strengths of leadership under TIA is mainly around

quality and character of good leader (59.0%). Another area that drew attention of teachers is the

correlation between leadership and teaching profession (41.1%). The main weaknesses of TIA

leadership training were: the inadequate understanding of leadership in the teaching profession

(23.1%); and lack of potential guest speakers (invited heads of schools and education officers) to

elaborate some leadership practices (71.8%).

Conclusion

TIA’s leadership training was significant in raising awareness and in improving the

knowledge and confidence of heads of schools on their role as leaders in schools.

Despite its significance, leadership training could be improved through linking its content

with teaching profession, and inviting experienced heads of schools and DEOs as guest

speakers.

49

CHAPTER FIVE

LESSONS LEARNT AND RECOMMENDATIONS

There are a number of lessons derived from M&E exercise and its results. Some of them are

presented in this chapter together with the recommendations.

Lessons Learnt

1. It was evident from school workshop reports and classroom observations that all LCTs taught

in TIA are used in different schools. However, at individual level, guardian teachers and

other teachers (SBW participants) are selective in terms of what learner centred teaching

strategies they should use in classrooms. Mostly of them prefer verbal-auditory LCTs. These

are: Group discussions and presentations, Think-pair-share, Question and answers, and cold

calling. These are techniques that require students to listen and speak only.

2. ‘TIA works’. Classroom observations, SBWs reports and national examinations have

indicated there is a link between TIA, leaner-centred teaching practices and academic

performance. These are the facts, supported by a lot of data:

TIA and SBT have influenced application of LCTs in classrooms

Students are actively engaged in learning through groups, answering and answering

questions, etc.

3. Average performance of students in national form four examinations in project schools has

improved.

4. The higher the number of SBWs conducted by a school the higher the performance of

students. This is proved by conclusions drawn from the findings, showing that:

Average pass rate of students in Project schools was better than of control schools in

2013 and 2014.

Schools than did many SBWs (Excellent schools) did better than poor schools.

5. English Debate training and competitions (PDF) have had a quick impact in reviving debates

in the selected schools and improved opportunities of English speaking skills for students.

50

The fact that debates are mandatory and involves more than 70 participants per session, gives

hope of improved linguistic skills among children (as witnessed by students themselves and

their teachers)

6. The lesson from SEKOMU is through well-planned training for the faulty of the new

university, TIA training has the potential for scaling to other universities.

7. The government (MoEVT) has been more positive toward ITT intervention than previously

thought. Its suggestions for partnership and harmonization of INSET documents and process

is one of the greatest achievement in 2014 – 2015

8. When M&E is not well coordinated (i.e. if left to be done at activity level) sampling process

and coherence of data become difficult. Consequently the impact of the ‘integrated efforts’

(TIA, SBT, Debates, parental engagement, leadership, and Mock examinations) can’t be

easily evaluated and appreciated.

9. While the ITT project has tested Mock exams as a learning outcome tool, it is not sufficient

in testing the teacher’s skill level or the translation of that skill level to student academic

performance. Mock exams are however perceived as a excellent preparation tool by the

DEOs and Head Teachers.

Recommendations

1. SBT Monitors should help the teachers to plan a variety of LCTs that will engage students

not only verbally but also kinaesthetically. Moreover, the next TIA workshops should give

more chances for the participants to practice ‘facilitation of model lessons’.

2. Schools should be encouraged to take over in the running of SBT in their schools. TIA

Workshop needs also continue producing competent guardian teachers. In that way there will

be a change in the way our children learn.

3. English Debate PDF format has proven to stimulate and promote stronger skills. It shouldn’t

take place in a small group of schools but in all ITT schools that take part in the program.

4. Fresher TIA facilitators in facilitating LCT-linked workshop need more time, practices and

continuous mentorship. Therefore, SEKOMU faculty still needs support from experienced

facilitators in their road to competent facilitation of TIA Workshops (TIA).

51

5. Longer term support and facilitation of MOEVT and ITT programs needs to be supported by

the Program Management and its donor, MCF. Successful harmonization of the INSET

modules which aims at addressing both content and pedagogical teaching issues will surely

bring a tremendous change in teaching and learning process in Tanzania and with a quick

effect and huge coverage.

6. Monitoring and Evaluation has to be very well planned from the beginning. M&E

component, like any other project activity needs to be planned, scheduled, monitored and

evaluated also. In this way schools the impact of ‘integrated efforts’ of ITT intervention can

be easily evaluated.

52

REFERENCES

T&B Consultant (2002) Monitoring and evaluation guidelines for Private sector projects funded

by AfDB. African Development Bank.

UNDP (2009) “Annex 7: Evaluation Report Template and Quality Standards” in UNDP’s

Handbook on Planning, Monitoring and Evaluating for Development Results. New York.

A.K. Office Supplies.

WEF. (2000).Enabling teachers to enable learners. Dakar. Issues Paper Strategy 1.8

http://www.unesco.org/education/wef/en-conf/coverage_sessionI_8.shtm (24/08/2013) [3]


Recommended