135
i
i
i
Integrated Watershed Management Programme (IWMP)
Detailed Project Report (DPR) IWMP II/2012-13
Pulikkeezh Block Panchayat
Technical Support Organization
Centre for Socio-economic & Environmental Studies (CSES)
Khadi Federation Building, NH By-Pass, Padivattom, Kochi - 682 024, Kerala, India Tel: +91-484-2805107, 2805108 Email: [email protected] Url: www.csesindia.org

ii
Study Team
Jayan K.M.
Bibin Thambi
K.K. Krishnakumar
Dr. N. Ajith Kumar
Ann Paul Therroth
Rahul K.P.
Ratheesh P.B.
Feba Philip
Kavitha Chandran
Jisha S.
iii
CONTENTS
Page
LIST OF TABLES iv
ABBREVIATIONS vi
INTRODUCTION 1
THE PROJECT AREA 6
INSTITUTION BUILDING AND PROJECT MANAGEMENT 36
MICRO WATERSHEDS IN THE PROJECT AREA 38
PROBLEMS TO BE ADDRESSED 46
WATERSHED INTERVENTIONS 49
DETAILED ACTION PLAN 60
EXPECTED OUTCOME 66
WATERSHED DEVELOPMENT FUND & EXIT PROTOCOL 68
APPENDIX I - DETAILED ESTIMATE
APPENDIX II - MAP

iv
LIST OF TABLES
Page Table 1.1 Project Back Ground of IWMP II/2012-13 1 Table 1.2 Financial Allocation 2 Table 2.1 Basic project information 6 Table 2.2 Details of the selected watersheds in the project area 6 Table 2.3 Criteria and Weightage for the Selection of Watershed 13 Table 2.4 Weightage under different criteria 15 Table 2.5 Physiography, Relief and Drainage of the Project Area 15 Table 2.6 Annual Rainfall from 1997 to 2010 16 Table 2.7 Monthly Mean Temperature during 2002 - 2011(o C) 17 Table 2.8 Wind Speed 17 Table 2.9 Genesis of Geo-morphology 18 Table 2.10 Ground Water Resource of Pulikeezhu Block as on 31st December 2004 `18 Table 2.11 Depth of Ground Water Level Range in Meters Below Ground Level(mbgl) 19 Table 2.12 Number of Water Sources in the Project Area 19 Table 2.13 Water availability in private wells 20 Table 2.14 Agro-ecological situation of the project area 20 Table 2.15 Details of the population in the project area 21 Table 2.16 Age distribution of population in the project area 21 Table 2.17 Number of households in the project area 21 Table 2.18 Social Classification of Households in the Project Area and Literacy Rate 22 Table 2.19 Poverty status of households 24 Table 2.20 Main source of income of households in the project area 22 Table 2.21 Details about the landless households in the project area 23 Table 2.22 Details of Land Owned by Farmers in the Microwatersheds in the Project
Area 23
Table 2.23 Proportion of households with electric connection 24 Table 2.24 Main fuel for cooking in the households 24 Table 2.25 Toilet facility in the households in the project area 24 Table 2.26 Membership in Self Help Groups 25 Table 2.27 Main source of drinking water in the households in the project area 25
v
ABBREVIATIONS
Table 2.28 Quality of water from Pulikeezhu tube well 26 Table 2.29 Drainages in the Project Area 26 Table 2.30 Number of Perennial and Seasonal Drainages in the Project Area 27 Table: 2.31 Number of Ponds and Water Storage Capacity in Cubic Metres 28 Table: 2.32 Length of Roads (in Km) 28
Table: 2.33 Details of Cultivable Wasteland in the Project Area 29 Table 2.34 Details of livestock and poultry in the project area 29 Table 2.35 Educational Institutions in the Project Area 29 Table 2.36 Medical Facilities in the Project Area 30 Table 2.37 Infrastructure in the project area 30 Table 2.38 Present land use pattern in micro watershed 31 Table 2.39 Major ongoing and completed schemes in the project area 31 Table 2.40 SWOT Analysis 34 Table 3.1 Details of Project Implementation Agency (PIA) 36 Table 3.2 Details of Watershed Development Team (WDT) 37 Table 3.3 Dates of Neerthada Gramasabha 37 Table 3.4 Implementation phases of IWMP 38 Table 4.1 Location and extent of Watersheds 41 Table 4.2 Characteristics of Micro Watersheds coming under IWMP II / 2012-13 42 Table 4.3 Area of Land under various Crops in Micro Watersheds (ha) 42 Table 4.4 Plant species in micro watersheds 43 Table 4.5 Medicinal plants in micro watersheds 45 Table 6.1 Entry Point Activities – Location and Estimate 51 Table 7.1 Annual Action Plan – Institution and Capacity Building 60 Table 7.2 Annual Action Plan – Natural Resource Management 61 Table 7.3 Annual Action Plan – Production System & Micro-enterprises 62 Table 7.4 Financial Plan for Livelihood Activities 63 Table 7.5 Action Plan for Major Livelihood Activities 64 Table 7.6 Annual Action Plan – Livelihood (Seed Money) 64 Table 8.1 Expected Outcomes 66 Table 9.1 Project at a glance 72

vi
APL Above Poverty Line
AAP Annual Action Plan
BLCC Block Level Co-ordination Committee
BPL Below Poverty Line
BRGF Backward Regions Grant Fund
CEO Chief Executive Officer
CSES Centre for Socio-economic and Environmental Studies
DLCC District Level Co-ordination Committee
DPC District Planning Committee
DPR Detailed Project Report
EPA Entry Point Activities
FGD Focus Group Discussion
GIS Geographic Information System
GP Grama Panchayat
GW Ground Water
IEC Information, Education and Communication
IT Information Technology
IWMP Integrated Watershed Management Programme
LFA Logical Framework Analysis
LSGD Local Self Government Department
LSGI Local Self Government Institutions
LSS Livelihood Support System
MCM Million Cubic Meters
MGNREGA Mahatma Gandhi National Rural Employment Guarantee Act
MLA LAD Member of Legislative Assembly Local Area Development scheme
MoU Memorandum of Understanding
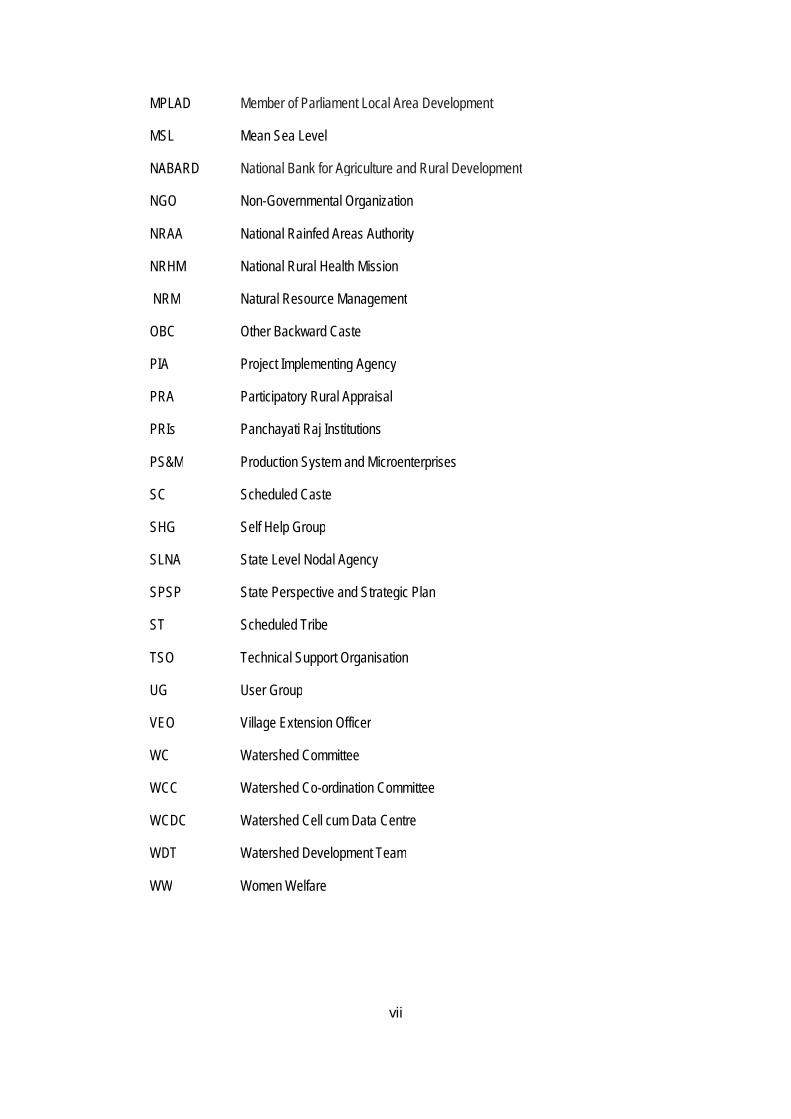
vii
MPLAD Member of Parliament Local Area Development
MSL Mean Sea Level
NABARD National Bank for Agriculture and Rural Development
NGO Non-Governmental Organization
NRAA National Rainfed Areas Authority
NRHM National Rural Health Mission
NRM Natural Resource Management
OBC Other Backward Caste
PIA Project Implementing Agency
PRA Participatory Rural Appraisal
PRIs Panchayati Raj Institutions
PS&M Production System and Microenterprises
SC Scheduled Caste
SHG Self Help Group
SLNA State Level Nodal Agency
SPSP State Perspective and Strategic Plan
ST Scheduled Tribe
TSO Technical Support Organisation
UG User Group
VEO Village Extension Officer
WC Watershed Committee
WCC Watershed Co-ordination Committee
WCDC Watershed Cell cum Data Centre
WDT Watershed Development Team
WW Women Welfare

1
CHAPTER I INTRODUCTION
The Integrated Watershed Management Programme (IWMP), initiated by the Ministry of Rural Development (MoRD), Government of India, is a unique watershed programme calling for multidisciplinary approach to natural resource management for ensuring continuous benefit on a sustainable basis. Watershed Management brings about the best possible balance between natural resources on the one side and human beings on the other. IWMP not only helps in land, water and biomass management of degraded areas but also in the conservation of the protected areas so that biodiversity and genetic resources are available for future generations. The programme is implemented through Panchayati Raj Institutions thereby ensuring people’s participation in different stages such as planning, implementation, monitoring, evaluation and post project activities. 1.1 Project Background
IWMP II/2012-13 Pulikeezhu watershed project is located in Pulikeezhu Block Panchayat of Pathanamthitta district. The project comprises of five micro-watersheds namely Ayyankonari (10P8a), Parumala (10P9a), Keecherivalkadavu (10P10a), Chathenkery Kadavu (11M19a) and Podiyadi Puthanthodu (11M20a). The project, with an area of 4838 hectares has been selected for treatment under the Integrated Watershed Management Programme (IWMP). The project area covers the grama panchayats of Kadapra, Niranam, Peringara, Nedumbram and Kuttoor. The project area comes under upper Kuttanad division and have tributaries of Pampa and Manimala rivers.
Table: 1.1: Project Back Ground of IWMP II/2012-13
Location Micro Watersheds GP Wards Total Area (in
ha)
Treatable Area (in
ha)
Project Amount (in Lakh)
WS Code No. Full Partial
State: Kerala District- Pathanamthitta Taluk: Thiruvalla Block: Pulikeezhu
Ayyankonari
10P8a
Kadapra 1,2,3,10,11,12,13,14,15
-
2366
2366
283.92 Niranam 1,2,3,4,5,6,7,8,9,10,
11,12,13 -
Parumala 10P9a Kadapra 5,6,7,8,9 - 418 418 50.16
Keecherival kadav
10P10a Kadapra 4 - 84 84 10.08
Chathenkeri-kadav
11M 19a
Peringara 13,14,15 - 839
839
100.68
Nedumbram 1,2,3,12,13 -
Podiyadi Puthenthodu
11M 20a
Peringara 2,9,10,11,12 -
1131
1131
135.72 Nedumbram 4,5,6,7,8,9,10,11 - Kuttoor 1,2 -
Total 4838 4838 580.56
2
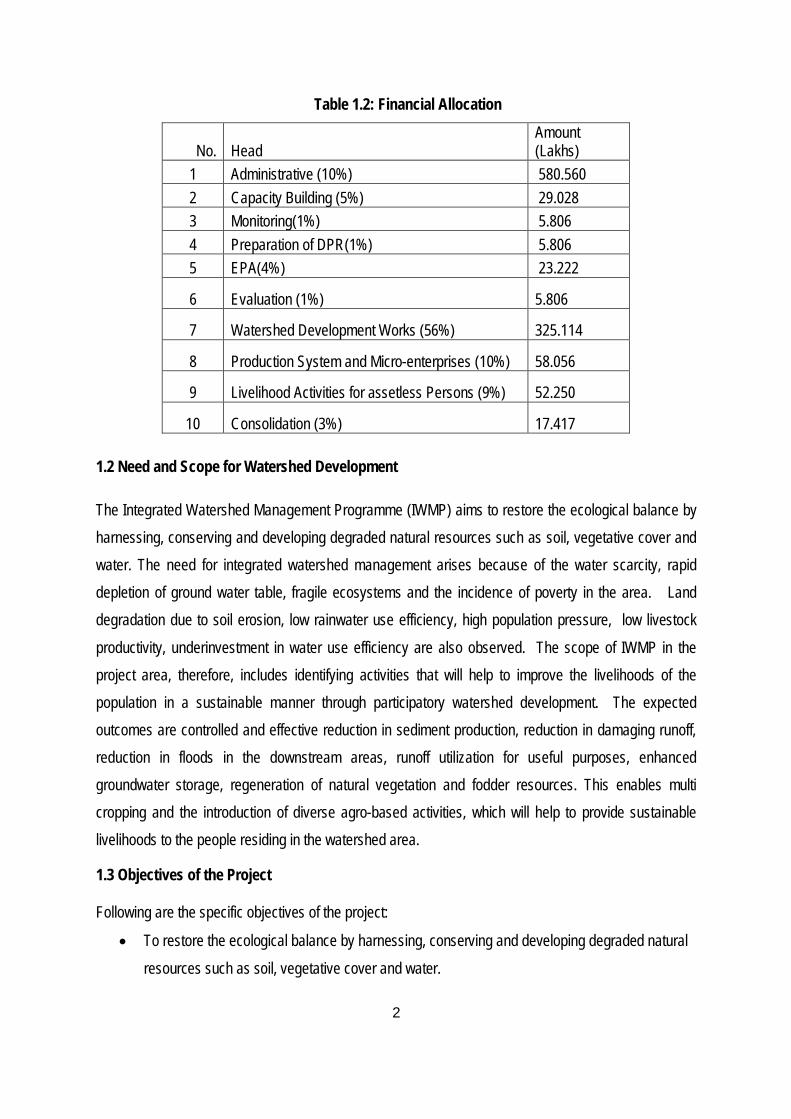
Table 1.2: Financial Allocation
No. Head Amount (Lakhs)
1 Administrative (10%) 580.560 2 Capacity Building (5%) 29.028 3 Monitoring(1%) 5.806 4 Preparation of DPR(1%) 5.806 5 EPA(4%) 23.222
6 Evaluation (1%) 5.806
7 Watershed Development Works (56%) 325.114
8 Production System and Micro-enterprises (10%) 58.056
9 Livelihood Activities for assetless Persons (9%) 52.250
10 Consolidation (3%) 17.417
1.2 Need and Scope for Watershed Development
The Integrated Watershed Management Programme (IWMP) aims to restore the ecological balance by harnessing, conserving and developing degraded natural resources such as soil, vegetative cover and water. The need for integrated watershed management arises because of the water scarcity, rapid depletion of ground water table, fragile ecosystems and the incidence of poverty in the area. Land degradation due to soil erosion, low rainwater use efficiency, high population pressure, low livestock productivity, underinvestment in water use efficiency are also observed. The scope of IWMP in the project area, therefore, includes identifying activities that will help to improve the livelihoods of the population in a sustainable manner through participatory watershed development. The expected outcomes are controlled and effective reduction in sediment production, reduction in damaging runoff, reduction in floods in the downstream areas, runoff utilization for useful purposes, enhanced groundwater storage, regeneration of natural vegetation and fodder resources. This enables multi cropping and the introduction of diverse agro-based activities, which will help to provide sustainable livelihoods to the people residing in the watershed area.
1.3 Objectives of the Project
Following are the specific objectives of the project:
To restore the ecological balance by harnessing, conserving and developing degraded natural resources such as soil, vegetative cover and water.
3
To maximise rain water harvesting and recharging of the ground water to improve water availability in the project area.
To prevent degeneration of the biodiversity in the project area and regeneration of natural vegetation.
To undertake water and soil conservation activities in a scientific manner so as to increase the production and productivity of agricultural crops.
To undertake activities to prevent soil run-off, increase the fertility of the soil and water storage capacity of the land.
To undertake activities for the revival and protection of dying water sources.
To enhance livelihood opportunities of the people dependent on natural resources.
To improve the natural resource base and employment opportunities of the project area.
To minimise the impact of natural disasters such as flood and drought.
To undertake activities to convert wasteland into cultivable land.
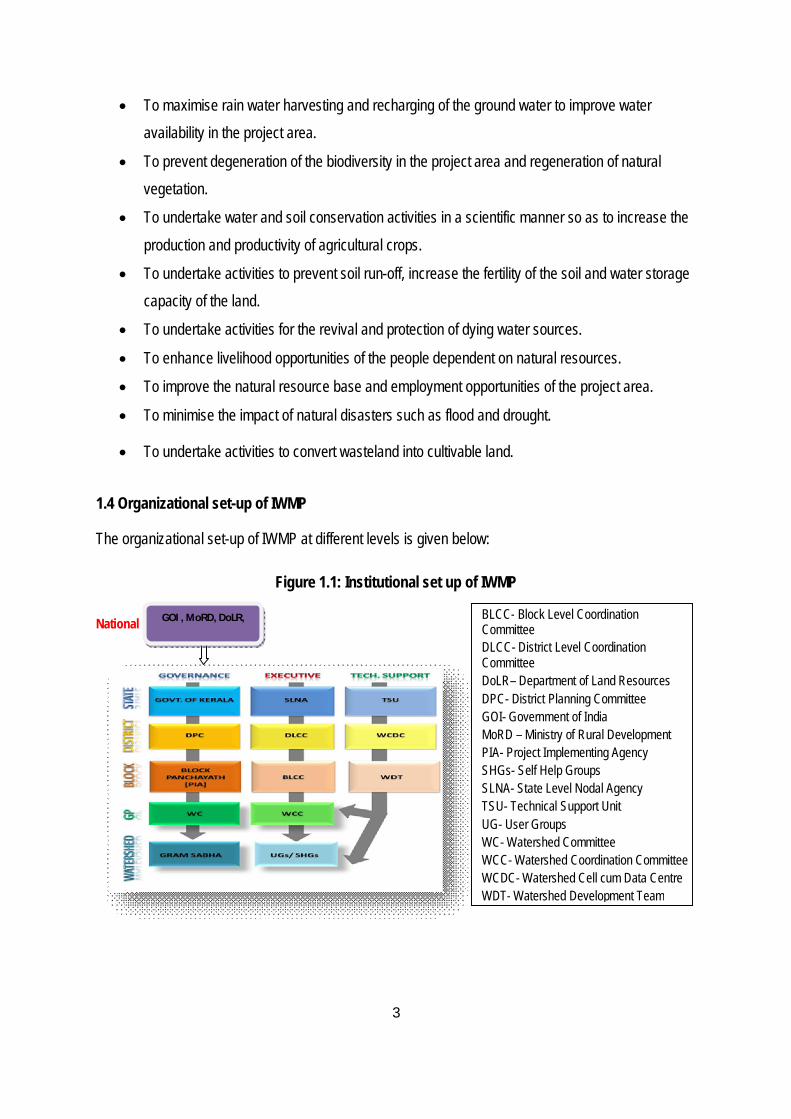
1.4 Organizational set-up of IWMP
The organizational set-up of IWMP at different levels is given below:
Figure 1.1: Institutional set up of IWMP
National
BLCC- Block Level Coordination Committee DLCC- District Level Coordination Committee DoLR– Department of Land Resources DPC- District Planning Committee GOI- Government of India MoRD – Ministry of Rural Development PIA- Project Implementing Agency SHGs- Self Help Groups SLNA- State Level Nodal Agency TSU- Technical Support Unit UG- User Groups WC- Watershed Committee WCC- Watershed Coordination Committee WCDC- Watershed Cell cum Data Centre WDT- Watershed Development Team
GOI , MoRD, DoLR,

4
1.5 Funding Pattern District Name
of Project
Name of PIA
No. Of Microwatersheds
Project Area (Ha)
Project Cos
(Crores)
Central Share (90%)
State Share (10%)
Pathanamthitta IWMP II/ 2011-
12
Pulikeezhu Block
Panchayath
5 4838 5.8056 5.225 0.5806
1.6 Approach and Methodology of Preparing the Detailed Project Report (DPR)
The project area lies in Pulikeezhu Block Panchayat of Pathanamthitta district. The common guidelines provide a flexible framework for the preparation of the Detailed Project Report of the projects under IWMP. The methodology for the preparation of the Detailed Project Report of IWMP – II/2011-12 of Pathanamthitta District is outlined below:
o The project comprises of five micro watersheds. A cluster approach has been followed in the preparation of DPR.
o Review of the official documents on MGNREGS at the national and state levels was done prior to the field level activities.
o Preliminary discussions with elected representatives and officials at the block and district level were conducted.
o Secondary Data: The DPR has to be based on a situation analysis of secondary data and information available from various sources. Basic information about the watershed such as rainfall, temperature, location, topography, hydrology, hydrogeology, soils, geology and geomorphology, demographic and socio-economic characteristics of the population, land-use pattern, major crops and productivity, soil and water conservation practices adopted, irrigation, livestock and microenterprisers were collected from different sources such as Census of India, development reports, publications of government departments etc.
o Baseline Survey: A detailed baseline survey was conducted covering all households in the project area. The database thus created is expected to facilitate the assessment of the impact of the watershed development programme on the project area during and after the implementation of the project.
o Participatory Rural Appraisal (PRA): The participation of stakeholders is essential in identifying the problems and needs of the people in the project area and in identifying suitable watershed

5
development activities. A Logical Framework Analysis was done at the project level for identifying the important problems (through problem tree analysis) as well as for the purpose of assessing the present situation. Other PRA techniques like transect walk, social mapping, resource mapping, seasonal calendar, etc., were employed in each micro watershed area.
o Use of GIS and Remote Sensing for Planning: GIS and remote sensing devices have made use in the preparation of DPR. Quantum GIS Software was used for preparation of maps. Google Earth images of the project area were also used for the planning. 1: 4000 scale cadastral maps of each village were the base map for planning.
o Indepth interviews, Focused Group Discussions with officials, farmers, entrepreneurs of micro-enterprises etc. were undertaken.
o An assessment of the resources likely to be available from other sources and schemes was done in the initial stages of the plan preparation.
o Field level verification of the identified interventions was undertaken by the DPR preparation team which includes the Technical Support Organisation, Watershed Development Team and Watershed Cell come Data Centre.
o Prioritisation: Prioritisation of the interventions was done taking into account the scientific and technical inputs.
o Identification of Entry Point Activities: The entry point activities were identified taking into account its potential as a model for replication.
o IEC and Capacity Building: IEC and capacity building plan has been formulated to achieve the desired results from watershed management programmes.
6
CHAPTER II
THE PROJECT AREA
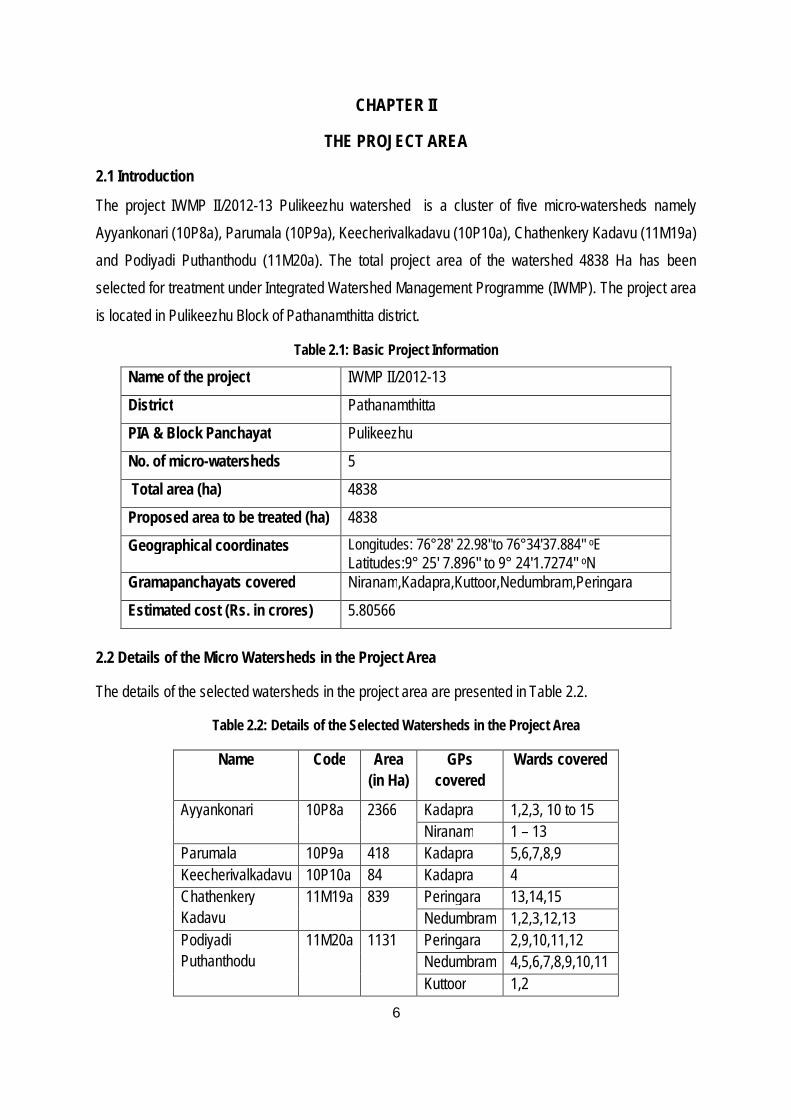
2.1 Introduction
The project IWMP II/2012-13 Pulikeezhu watershed is a cluster of five micro-watersheds namely Ayyankonari (10P8a), Parumala (10P9a), Keecherivalkadavu (10P10a), Chathenkery Kadavu (11M19a) and Podiyadi Puthanthodu (11M20a). The total project area of the watershed 4838 Ha has been selected for treatment under Integrated Watershed Management Programme (IWMP). The project area is located in Pulikeezhu Block of Pathanamthitta district.
Table 2.1: Basic Project Information
Name of the project IWMP II/2012-13 District Pathanamthitta PIA & Block Panchayat Pulikeezhu No. of micro-watersheds 5 Total area (ha) 4838 Proposed area to be treated (ha) 4838 Geographical coordinates Longitudes: 76°28' 22.98"to 76°34'37.884" oE
Latitudes:9° 25' 7.896" to 9° 24'1.7274" oN Gramapanchayats covered Niranam,Kadapra,Kuttoor,Nedumbram,Peringara
Estimated cost (Rs. in crores) 5.80566 2.2 Details of the Micro Watersheds in the Project Area
The details of the selected watersheds in the project area are presented in Table 2.2.
Table 2.2: Details of the Selected Watersheds in the Project Area
Name Code Area (in Ha)
GPs covered
Wards covered
Ayyankonari 10P8a 2366 Kadapra 1,2,3, 10 to 15 Niranam 1 – 13
Parumala 10P9a 418 Kadapra 5,6,7,8,9 Keecherivalkadavu 10P10a 84 Kadapra 4 Chathenkery Kadavu
11M19a 839 Peringara 13,14,15 Nedumbram 1,2,3,12,13
Podiyadi Puthanthodu
11M20a 1131 Peringara 2,9,10,11,12 Nedumbram 4,5,6,7,8,9,10,11 Kuttoor 1,2

7
2.3 Brief History
From 9th to 12th century A.D., Thiruvalla taluk of the then Alleppey district was part of Nantuzhainad and later it was merged to Odanad and subsequently with Thekkumkur. Pliny the famous traveller of the 1st century A.D. had described in his famous book ‘Pereplus’ about Niranam (Neleynda), the river Pamba (Baris) and about exporting pepper from Thiruvalla. The famous Niranam Poets - Madhava Panikkar, Sankara Panikkar and Rama Panikkar of the Kannassa family are well known for their great contribution to Malayalam literature. They lived between AD 1350 and 1450. It is believed that in A.D. 52, St.Thomas, one of the twelve Apostles of Jesus Christ, landed at Malankara and founded seven churches in Malabar coast, one of which is located at Niranam1. Pulikeezhu block was formed on December 23rd 1955 as the part of the Community Project Approach Programme2.
2.4 Location
The project area is located in Pulikeezhu Block, Panchayat Pathanamthitta District and lies between longitudes 76. 47304 oE to 76.57719 oE and latitudes 9.32202 oN to 9.40048 oN. Among the eight blocks of Pathanamthitta district, Pulikeezhu block is the smallest. The project area is spread over five Grama Panchayats namely, Kadapra, Niranam, Peringara, Nedumbram and Kuttoor. The total geographical area of the block is 68.66 sq.km. Pulikeezhu block is bounded on the Northern side by Madappally block (Kottayam District) and on the Southern side by Mavelikkara block (Alappuzha District). On the Eastern side it is bounded by Koyipram block and Thiruvalla Municipality (both in Pathanamthitta district) and on the Western side by Champakulam block (Alappuzha District).
1 Pathanamthitta district urbanization report. 2 http://lsgkerala.in/pulikeezhublock/

41
Figure 2.1: Location & Administrative Map
42
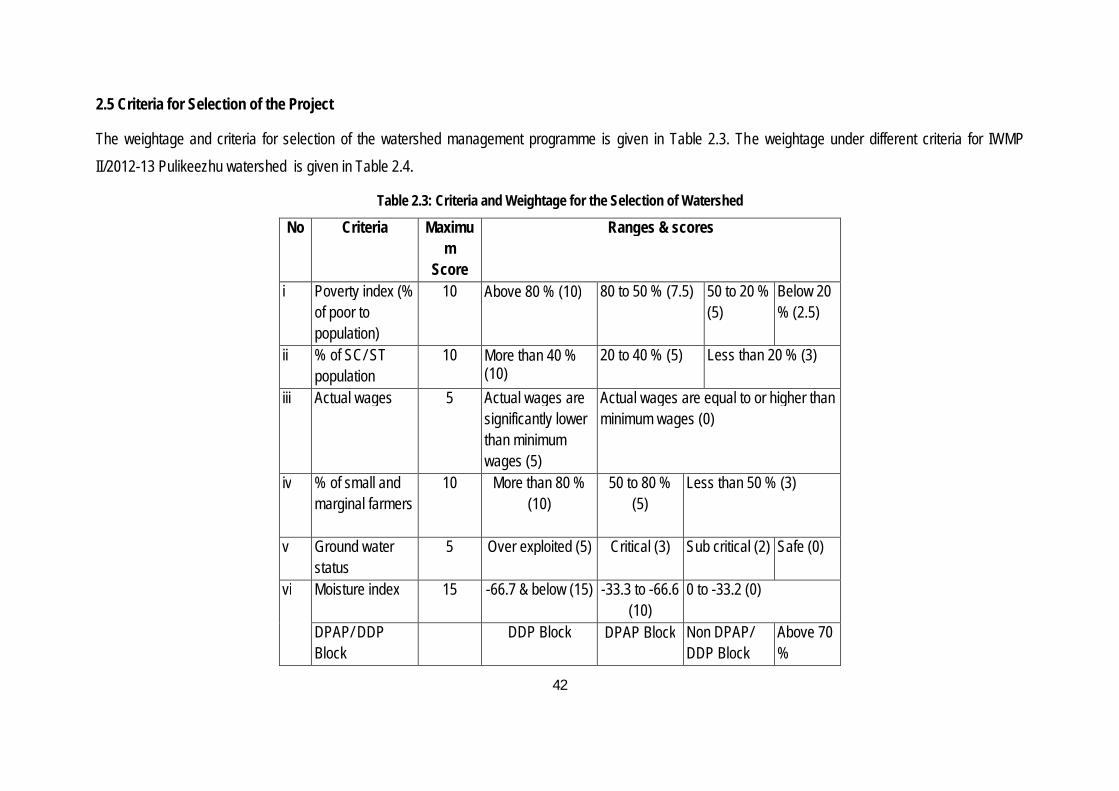
2.5 Criteria for Selection of the Project
The weightage and criteria for selection of the watershed management programme is given in Table 2.3. The weightage under different criteria for IWMP II/2012-13 Pulikeezhu watershed is given in Table 2.4.
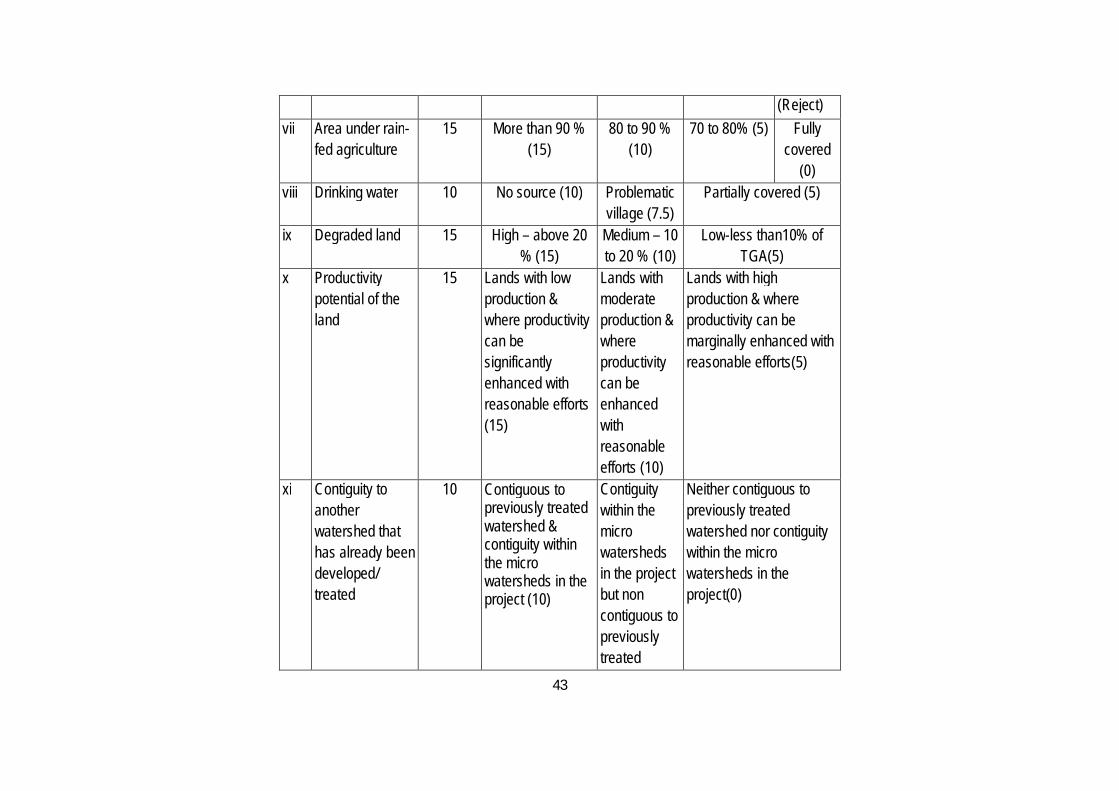
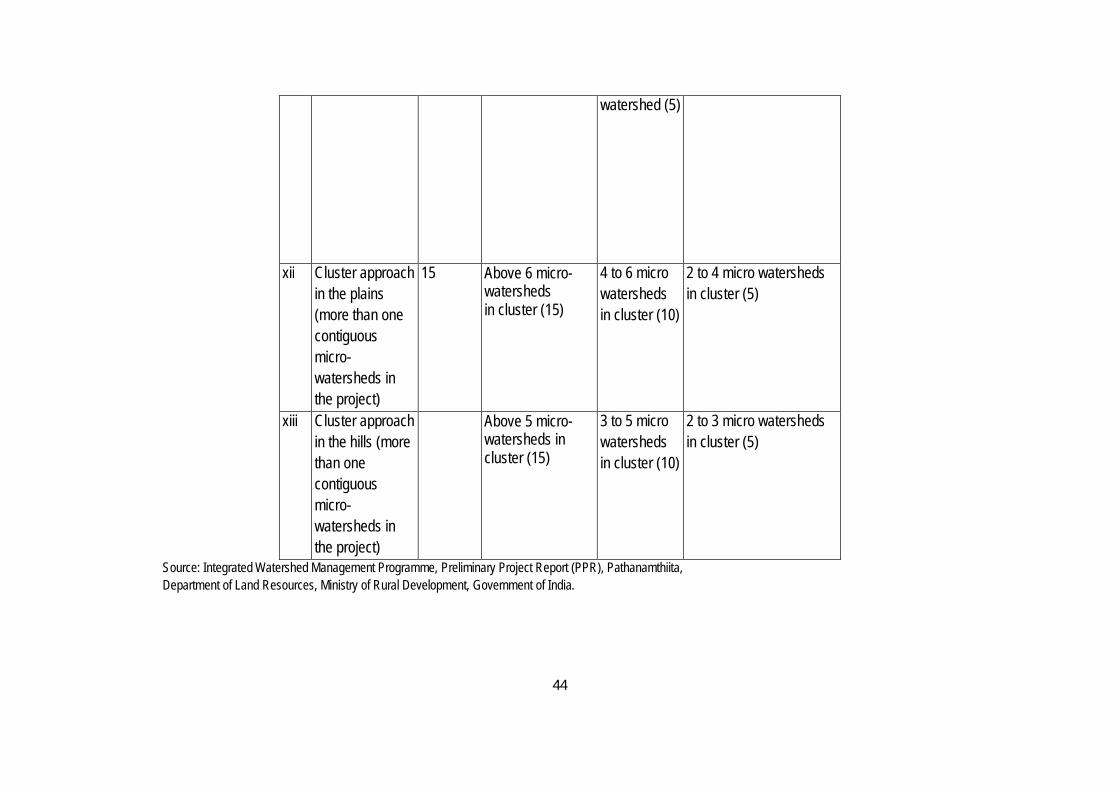
Table 2.3: Criteria and Weightage for the Selection of Watershed
No Criteria Maximum
Score
Ranges & scores
i Poverty index (% of poor to population)
10 Above 80 % (10)
80 to 50 % (7.5) 50 to 20 % (5)
Below 20 % (2.5)
ii % of SC/ ST population
10 More than 40 % (10)
20 to 40 % (5) Less than 20 % (3)
iii
Actual wages 5 Actual wages are significantly lower than minimum wages (5)
Actual wages are equal to or higher than minimum wages (0)
iv % of small and marginal farmers
10 More than 80 % (10)
50 to 80 % (5)
Less than 50 % (3)
v Ground water status
5 Over exploited (5) Critical (3) Sub critical (2) Safe (0)
vi Moisture index 15 -66.7 & below (15) -33.3 to -66.6 (10)
0 to -33.2 (0)
DPAP/ DDP Block
DDP Block DPAP Block
Non DPAP/ DDP Block
Above 70 %
43
(Reject) vii Area under rain-
fed agriculture 15 More than 90 %
(15) 80 to 90 %
(10) 70 to 80% (5) Fully
covered (0)
viii Drinking water 10 No source (10) Problematic village (7.5)
Partially covered (5)
ix Degraded land 15 High – above 20 % (15)
Medium – 10 to 20 % (10)
Low-less than10% of TGA(5)
x Productivity potential of the land
15 Lands with low production & where productivity can be significantly enhanced with reasonable efforts (15)
Lands with moderate production & where productivity can be enhanced with reasonable efforts (10)
Lands with high production & where productivity can be marginally enhanced with reasonable efforts(5)
xi
Contiguity to another watershed that has already been developed/ treated
10
Contiguous to previously treated watershed & contiguity within the micro watersheds in the project (10)
Contiguity within the micro watersheds in the project but non contiguous to previously treated
Neither contiguous to previously treated watershed nor contiguity within the micro watersheds in the project(0)
44
watershed (5)
xii
Cluster approach in the plains (more than one contiguous micro-watersheds in the project)
15 Above 6 micro-watersheds in cluster (15)
4 to 6 micro watersheds in cluster (10)
2 to 4 micro watersheds in cluster (5)
xiii Cluster approach in the hills (more than one contiguous micro-watersheds in the project)
Above 5 micro-watersheds in cluster (15)
3 to 5 micro watersheds in cluster (10)
2 to 3 micro watersheds in cluster (5)
Source: Integrated Watershed Management Programme, Preliminary Project Report (PPR), Pathanamthiita, Department of Land Resources, Ministry of Rural Development, Government of India.
45
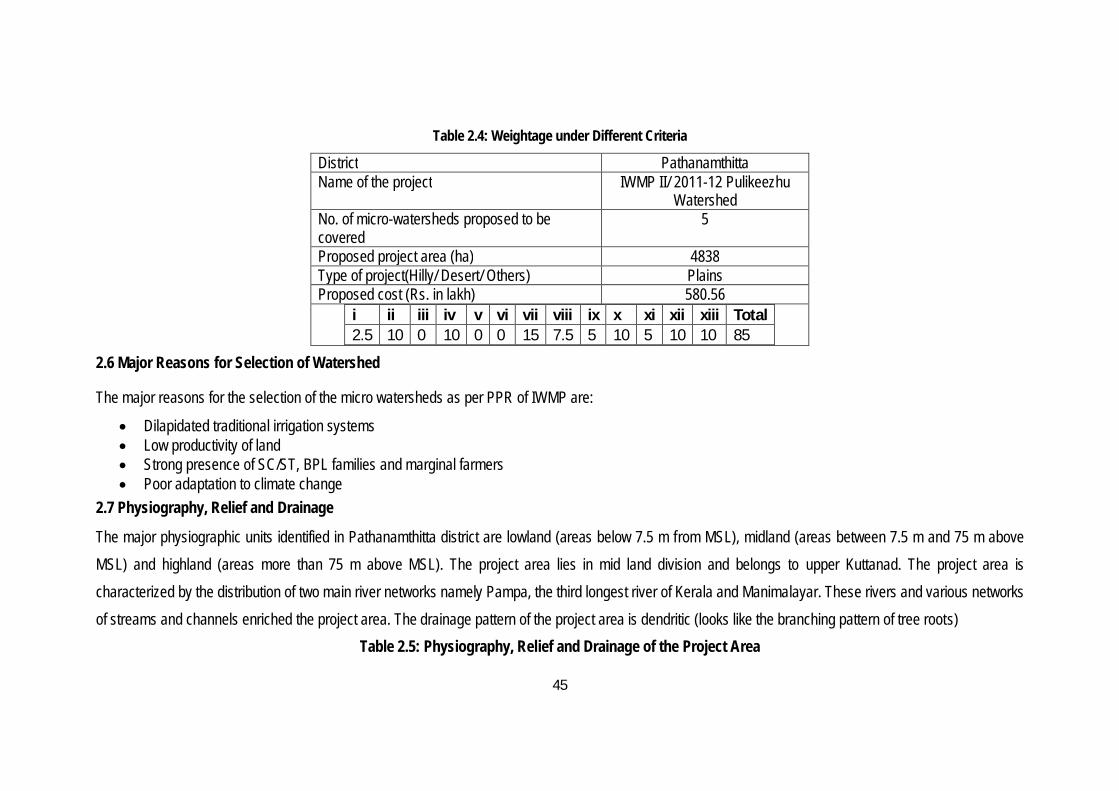
Table 2.4: Weightage under Different Criteria
District Pathanamthitta Name of the project IWMP II/ 2011-12 Pulikeezhu
Watershed No. of micro-watersheds proposed to be covered
5
Proposed project area (ha) 4838 Type of project(Hilly/ Desert/ Others) Plains Proposed cost (Rs. in lakh) 580.56
i ii iii iv v vi vii viii ix x xi xii xiii Total 2.5 10 0 10 0 0 15 7.5 5 10 5 10 10 85
2.6 Major Reasons for Selection of Watershed
The major reasons for the selection of the micro watersheds as per PPR of IWMP are:
Dilapidated traditional irrigation systems Low productivity of land Strong presence of SC/ST, BPL families and marginal farmers Poor adaptation to climate change
2.7 Physiography, Relief and Drainage
The major physiographic units identified in Pathanamthitta district are lowland (areas below 7.5 m from MSL), midland (areas between 7.5 m and 75 m above MSL) and highland (areas more than 75 m above MSL). The project area lies in mid land division and belongs to upper Kuttanad. The project area is characterized by the distribution of two main river networks namely Pampa, the third longest river of Kerala and Manimalayar. These rivers and various networks of streams and channels enriched the project area. The drainage pattern of the project area is dendritic (looks like the branching pattern of tree roots)
Table 2.5: Physiography, Relief and Drainage of the Project Area

46
Name of Project
Physiography Maximum Relief (M)
Maximum Base in Relief (M)
Slope Range (%)
Major Drainage
IWMP II/2012-13 Pulikeezhu Watershed
Midland 4 to 13 1 to 17 0 to 1 Pamba and Manimala rivers
2.8 Climate
2.8.1Rainfall
The project area experiences humid tropical climate with a bountiful rainy season through the northeast and southwest monsoons and severe summer. The hot season is from March to May and it is followed by South West monsoon season from June to September. South west monsoon contributes the major part of the annual rainfall3. Average annual rainfall is 2920mm.There is no drought or dry spells, but Niranam and Peringara panchayats which come under Chathenkerykadavu (11M19a) and Podiyadi Puthenthodu (11M20a) experiences mild flood during rainy season. The South-West monsoon contributes nearly 59% of annual rainfall followed by 21% of North-Eatst monsoon. Summer showers contribute remaining 19%.
Table 2.6: Annual Rainfall from 1997 to 2010 Year Jan Feb Mar Apr May June July Aug Sept Oct Nov Dec Total 1997 0 2.2 79.2 169.7 49 473.5 845 460 554 359 179 198 3368.6 1998 28 0 7.4 123 195.2 795.5 386 608.1 699.9 466.9 55.4 150.4 3515.8 1999 0 0 36 335.8 507.3 759.9 445.4 266.5 130.9 690.5 161.7 0 3334 2000 20 176.4 72 90.4 128.4 608.2 234.5 549.7 301 243.8 121 41 2586.4 2001 81.7 63.6 13 177.6 368.6 627.6 845 248 426.2 340.8 95.2 14.2 3301.5 2002 0 3 22.2 96.2 445.7 568.6 220.2 375.6 85 448.5 302 0 2567 2003 0 59 60 161.7 110.4 504.2 430.2 345.2 93.8 496.9 95.4 0 2356.8
3 Ground Water Information Booklet of Pathanamthitta District, Central Ground Water Board, Ministry of Water Resources, Government of India.
47
2004 3.8 0 53.4 100.4 827.8 519.8 324 306.5 195.8 508.5 253 0 3093 2005 16.4 63.6 37.4 200.2 206.8 602.6 451.7 132.1 312.8 251.2 119.4 73.4 2467.6 2006 43 0 46 107.4 511 505.5 430.4 309.2 349.1 407.6 188.2 0 2897.4 2007 0 22.2 3.6 200.4 264.4 596.9 861.3 418.8 363.4 279.7 168 13 3191.7 2008 0 60 200.9 145.8 62 392.8 641.5 236.8 273.1 308.9 171 8.8 2501.6 2009 0 0 78.2 99.1 286.7 629.9 563.8 207 214.4 165.7 299.2 97.2 2641.2 2010 23.4 0 42.2 191.8 346.5 537.4 469.4 253.2 253.6 561.4 241.8 131 3051.7 Average during 1997 to 2010
15 32 54 157 308 580 511 337 304 395 175 52 2920
Share of different seasons 1997-2010 (%)
19 Jan-May
59 (June-Sept)
21 (Oct-Dec)
100
Source: Agriculture Contingency Plan, National Initiative on Climate Resilient Agriculture (NICRA)
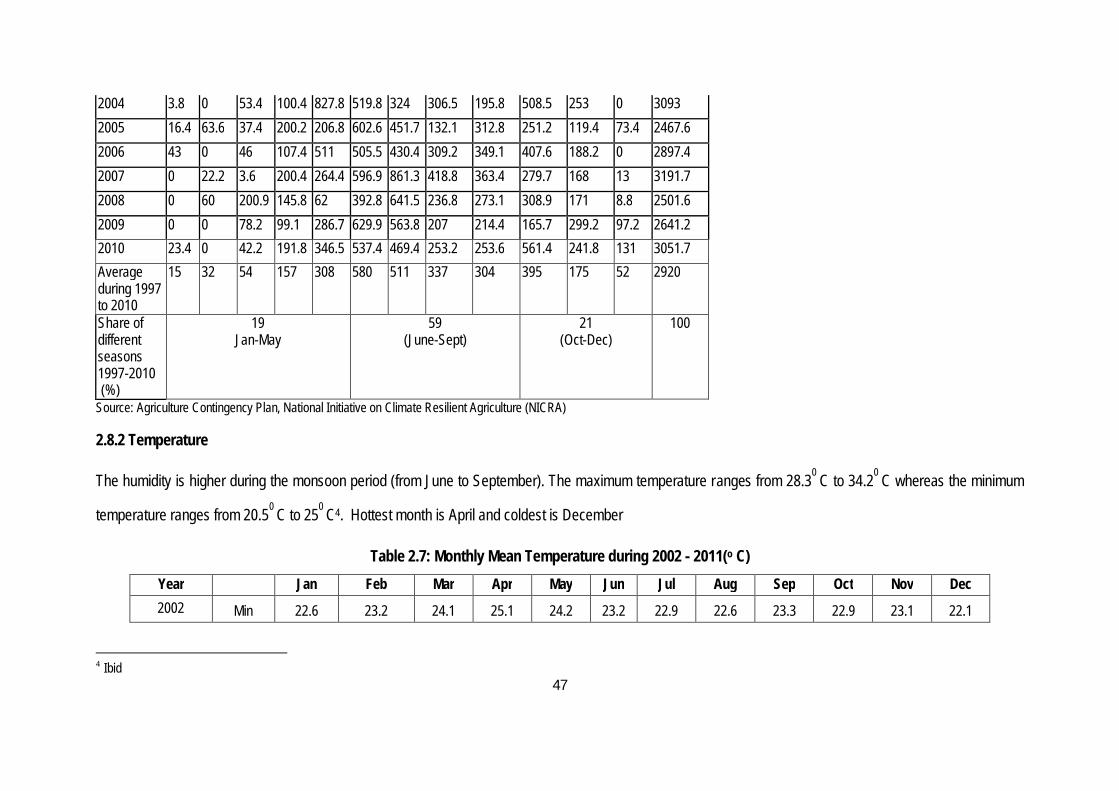
2.8.2 Temperature
The humidity is higher during the monsoon period (from June to September). The maximum temperature ranges from 28.30 C to 34.20 C whereas the minimum
temperature ranges from 20.50 C to 250 C4. Hottest month is April and coldest is December
Table 2.7: Monthly Mean Temperature during 2002 - 2011(o C) Year Jan Feb Mar Apr May Jun Jul Aug Sep Oct Nov Dec 2002 Min 22.6 23.2 24.1 25.1 24.2 23.2 22.9 22.6 23.3 22.9 23.1 22.1
4 Ibid

48
Max 32.2 32.0 33.5 33.6 31.7 29.5 29.4 29.0 30.8 31.9 31.9 33.2
2003 Min 22.0 23.4 23.9 24.9 24.6 22.8 21.7 22.1 22.1 22.1 22.3 20.6
Max 32.6 33.0 34.0 34.1 32.9 30.8 28.8 29.5 30.7 31.3 32.2 32.6
2004 Min 20.7 21.7 23.6 23.5 22.1 22.0 21.5 21.3 22.0 21.6 21.6 20.9
Max 32.0 34.2 34.0 33.7 30.1 29.7 29.3 28.9 30.8 30.8 32.3 32.9
2005 Min 23.8 23.8 25.5 23.7 24.1 21.9 21.3 22.6 23.9 23.7 23.7 23.1
Max 32.6 32.9 32.8 32.9 33.6 30.4 29.2 30.4 29.7 31.1 31.2 31.2
2006 Min 22.4 22.8 24.7 25.7 24.9 23.8 22.7 23.0 23.2 23.1 22.9 21.8
Max 32.1 32.4 32.7 33.1 32.1 30.5 29.1 29.2 30.0 30.4 30.9 32.1
2007 Min 21.6 22.5 24.9 24.5 25.0 23.0 22.0 22.4 22.9 22.9 22.7 22.1
Max 31.8 31.7 32.5 32.8 32.3 29.2 28.4 29.1 30.0 30.9 31.4 32.1
2008 Min 21.2 22.8 22.7 23.6 24.2 23.0 22.2 22.6 22.9 22.9 22.8 22.0
Max 31.9 31.2 31.6 31.8 32.1 30.0 29.0 29.5 30.3 31.1 31.1 32.0
2009 Min 20.5 22.2 23.6 24.7 24.3 23.2 22.5 22.8 23.0 23.6 23.0 22.7
Max 32.8 32.4 33.1 33.3 32.1 30.7 29.8 30.5 30.1 31.7 32.3 32.8
2010 Min 21.9 23.2 24.6 24.4 24.2 23.6 23.1 24.3 24.6 24.3 24.6 23.7
Max 32.2 32.8 34.2 34.0 33.0 30.2 29.1 28.3 29.3 30.4 30.4 30.8
2011 Min 23.0 23.1 24.9 24.5 25.7 24.2 23.3 23.1 23.0 23.9 23.1 22.5
Max 31.5 31.6 32.7 32.8 32.6 30.9 29.3 29.2 29.6 31.6 31.5 32.2 Source: Indian Meteorological Department, for Alappuzha, Thiruvananthapuram.
2.8.3 Wind
49
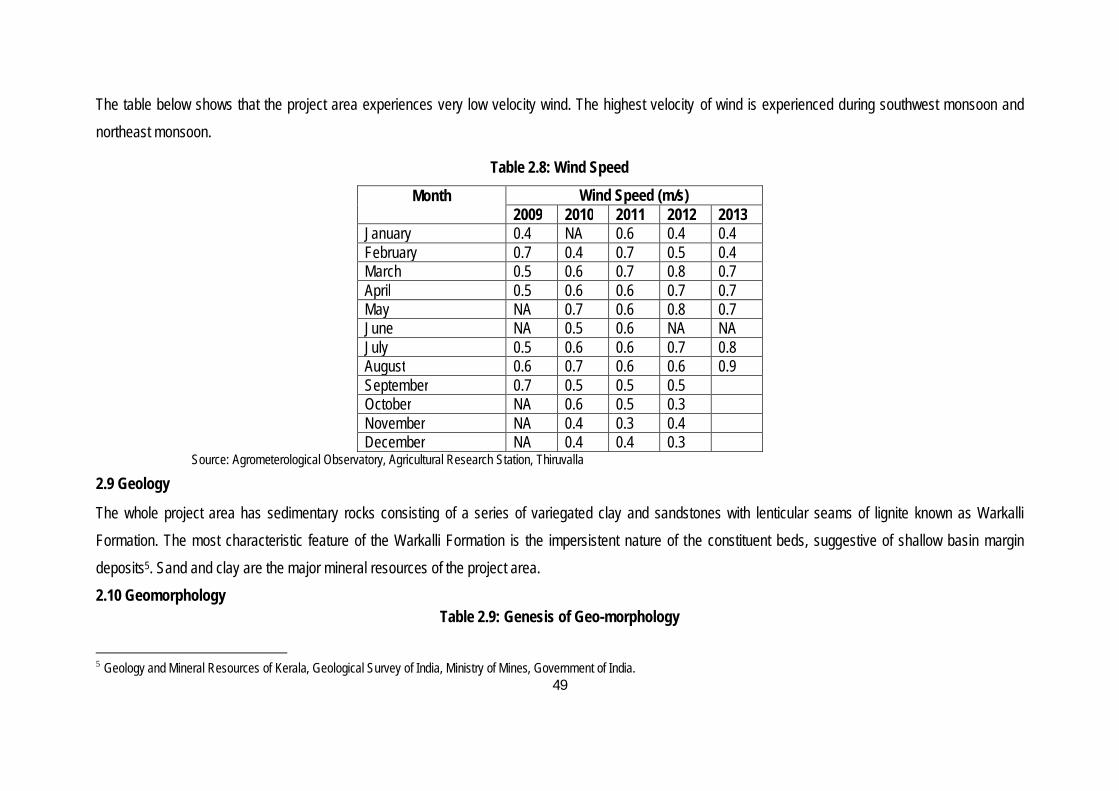
The table below shows that the project area experiences very low velocity wind. The highest velocity of wind is experienced during southwest monsoon and northeast monsoon.
Table 2.8: Wind Speed
Month
Wind Speed (m/s) 2009 2010 2011 2012 2013
January 0.4 NA 0.6 0.4 0.4 February 0.7 0.4 0.7 0.5 0.4 March 0.5 0.6 0.7 0.8 0.7 April 0.5 0.6 0.6 0.7 0.7 May NA 0.7 0.6 0.8 0.7 June NA 0.5 0.6 NA NA July 0.5 0.6 0.6 0.7 0.8 August 0.6 0.7 0.6 0.6 0.9 September 0.7 0.5 0.5 0.5 October NA 0.6 0.5 0.3 November NA 0.4 0.3 0.4 December NA 0.4 0.4 0.3
Source: Agrometerological Observatory, Agricultural Research Station, Thiruvalla
2.9 Geology
The whole project area has sedimentary rocks consisting of a series of variegated clay and sandstones with lenticular seams of lignite known as Warkalli Formation. The most characteristic feature of the Warkalli Formation is the impersistent nature of the constituent beds, suggestive of shallow basin margin deposits5. Sand and clay are the major mineral resources of the project area. 2.10 Geomorphology
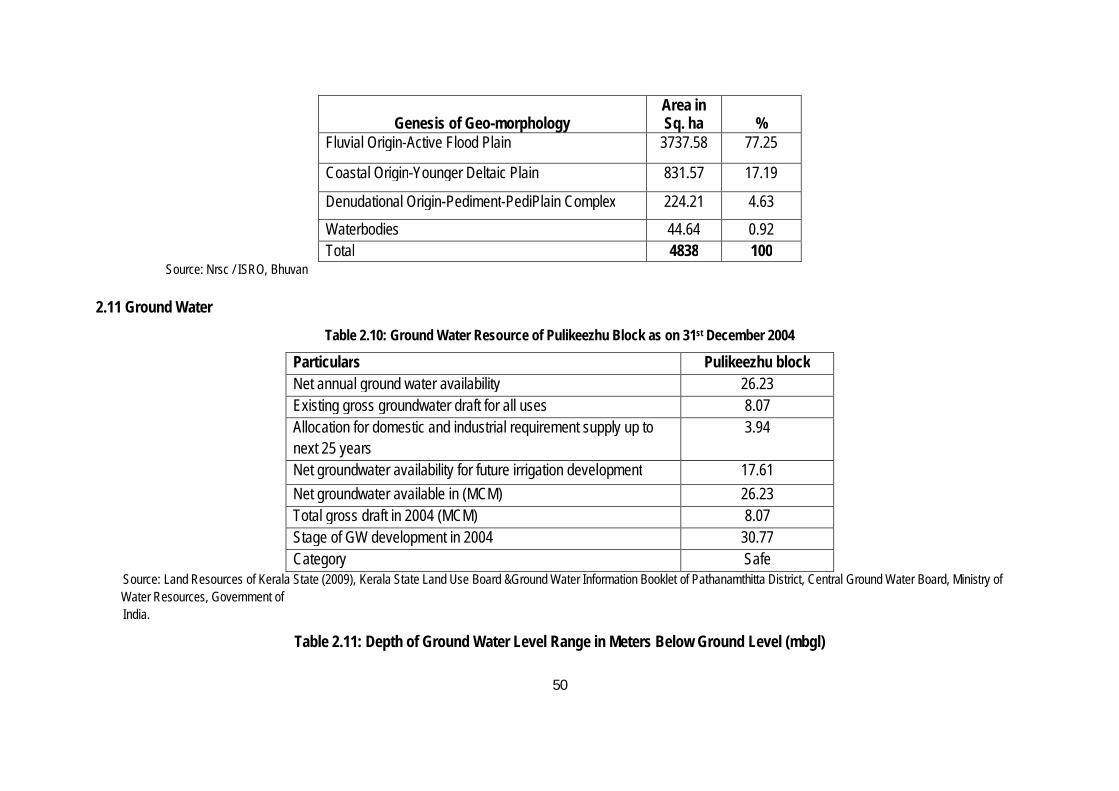
Table 2.9: Genesis of Geo-morphology
5 Geology and Mineral Resources of Kerala, Geological Survey of India, Ministry of Mines, Government of India.
50
Genesis of Geo-morphology
Area in Sq. ha %
Fluvial Origin-Active Flood Plain 3737.58 77.25
Coastal Origin-Younger Deltaic Plain 831.57 17.19
Denudational Origin-Pediment-PediPlain Complex 224.21 4.63 Waterbodies 44.64 0.92 Total 4838 100
Source: Nrsc / ISRO, Bhuvan
2.11 Ground Water Table 2.10: Ground Water Resource of Pulikeezhu Block as on 31st December 2004
Particulars Pulikeezhu block Net annual ground water availability 26.23 Existing gross groundwater draft for all uses 8.07 Allocation for domestic and industrial requirement supply up to next 25 years
3.94
Net groundwater availability for future irrigation development 17.61 Net groundwater available in (MCM) 26.23 Total gross draft in 2004 (MCM) 8.07 Stage of GW development in 2004 30.77 Category Safe
Source: Land Resources of Kerala State (2009), Kerala State Land Use Board &Ground Water Information Booklet of Pathanamthitta District, Central Ground Water Board, Ministry of Water Resources, Government of India.
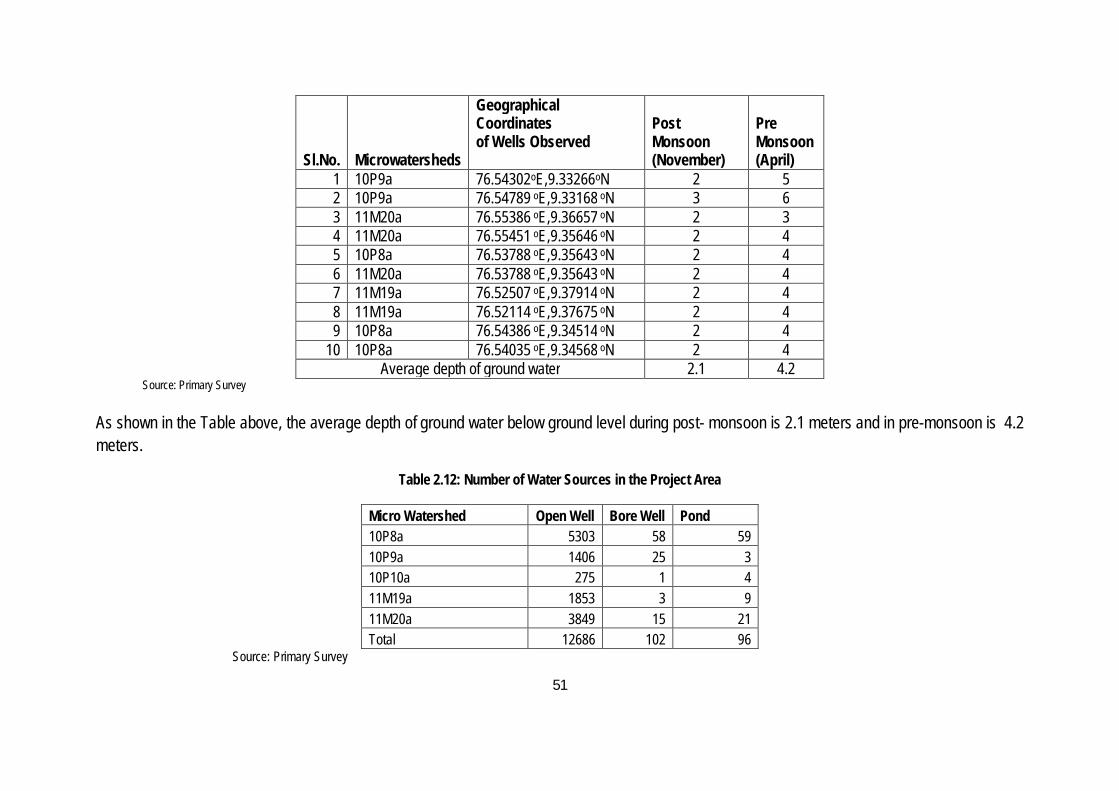
Table 2.11: Depth of Ground Water Level Range in Meters Below Ground Level (mbgl)
51
Sl.No. Microwatersheds
Geographical Coordinates of Wells Observed
Post Monsoon (November)
Pre Monsoon (April)
1 10P9a 76.54302oE,9.33266oN 2 5 2 10P9a 76.54789 oE,9.33168 oN 3 6 3 11M20a 76.55386 oE,9.36657 oN 2 3 4 11M20a 76.55451 oE,9.35646 oN 2 4 5 10P8a 76.53788 oE,9.35643 oN 2 4 6 11M20a 76.53788 oE,9.35643 oN 2 4 7 11M19a 76.52507 oE,9.37914 oN 2 4 8 11M19a 76.52114 oE,9.37675 oN 2 4 9 10P8a 76.54386 oE,9.34514 oN 2 4
10 10P8a 76.54035 oE,9.34568 oN 2 4 Average depth of ground water 2.1 4.2
Source: Primary Survey
As shown in the Table above, the average depth of ground water below ground level during post- monsoon is 2.1 meters and in pre-monsoon is 4.2 meters.
Table 2.12: Number of Water Sources in the Project Area
Micro Watershed Open Well Bore Well Pond 10P8a 5303 58 59 10P9a 1406 25 3 10P10a 275 1 4 11M19a 1853 3 9 11M20a 3849 15 21 Total 12686 102 96
Source: Primary Survey
52
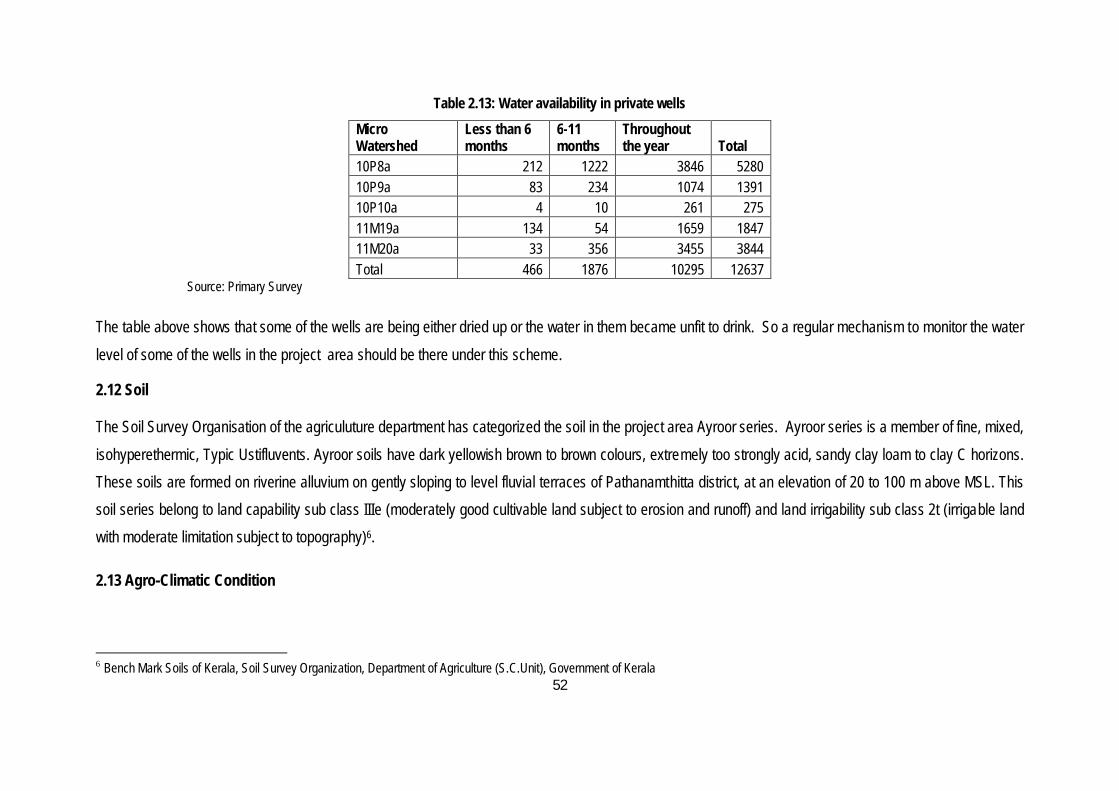
Table 2.13: Water availability in private wells Micro Watershed
Less than 6 months
6-11 months
Throughout the year Total
10P8a 212 1222 3846 5280 10P9a 83 234 1074 1391 10P10a 4 10 261 275 11M19a 134 54 1659 1847 11M20a 33 356 3455 3844 Total 466 1876 10295 12637
Source: Primary Survey
The table above shows that some of the wells are being either dried up or the water in them became unfit to drink. So a regular mechanism to monitor the water level of some of the wells in the project area should be there under this scheme.
2.12 Soil
The Soil Survey Organisation of the agriculuture department has categorized the soil in the project area Ayroor series. Ayroor series is a member of fine, mixed, isohyperethermic, Typic Ustifluvents. Ayroor soils have dark yellowish brown to brown colours, extremely too strongly acid, sandy clay loam to clay C horizons. These soils are formed on riverine alluvium on gently sloping to level fluvial terraces of Pathanamthitta district, at an elevation of 20 to 100 m above MSL. This soil series belong to land capability sub class IIIe (moderately good cultivable land subject to erosion and runoff) and land irrigability sub class 2t (irrigable land with moderate limitation subject to topography)6.
2.13 Agro-Climatic Condition
6 Bench Mark Soils of Kerala, Soil Survey Organization, Department of Agriculture (S.C.Unit), Government of Kerala

53
The State is divided into five agro-climate zones (South Zone, Central Zone, North Zone, Special Zone on Problem Areas, High Altitude Zone) as per State Land Use Board records. The project area comes under the South Zone. Based on altitude, rainfall, soil and topography, the state has been delineated into thirteen agro-ecological zones. Block Panchayath has been taken as the unit for the purpose of delineation. The Pulikeezhu block comes under Kuttanad zone. The details of the zones are presented in Table 2.14.
Table 2.14: Agro-ecological Situation of the Project Area
Zone Altitude type
Rainfall pattern Topography model
Soil type
Kuttanad
Type I: Up to 500 m above MSL (Low altitude zone)
Pattern I: Both the southwest and northeast monsoons are active and moderately distributed. Southwest monsoon give more rain with maximum rain in June
Model I: Extensive valleys with level but raised garden lands
Peat (Kari)
Source: Kerala Agricultural University 2.14 Socio-economic and Demographic Characteristics of the Population
The socio-economic characteristics of the population in the project area have been obtained by conducting a census survey of the households in the project area. As may be seen from Table 2.17, there are 15203 households in the project area. The sex ratio in project area is 1046 females per 1000 males (See Table 2.15).
Table 2.15: Details of the Population in the Project Area
Micro Sex Total Sex

54
Watershed Male Female ratio 10P8a 12988 13577 26565 1045 10P9a 3481 3647 7128 1048 10P10a 632 648 1280 1025 11M19a 5150 5450 10600 1058 11M20a 9042 9418 18460 1042 Total 31293 32740 64033 1046
Source: Primary Survey Age wise classification of population in the project area is shown in Table 2.16.
Table 2.16: Age Distribution of Population in the Project Area
Micro Watershed
Age Group
Total Below 15
years 15 - 60 years
Above 60 years
10P8a 4455 17448 4662 26565 10P9a 1303 4694 1131 7128 10P10a 223 836 221 1280 11M19a 1979 6707 1914 10600 11M20a 3180 12147 3133 18460 Total 11140 41832 11061 64033
Source: Primary Survey Table 2.17: Number of Households in the Project Area
Micro Watershed
Grama Panchayat Total Kadapra Niranam Peringara Nedumbram Kuttoor
10P8a 2837 3472 0 0 0 6309 10P9a 1613 0 0 0 0 1613 10P10a 308 0 0 0 0 308 11M19a 0 0 1245 1261 0 2506

55
11M20a 0 0 1736 2153 578 4467 Total 4758 3472 2981 3414 578 15203
Source: Primary Survey Table 2.18: Social Classification of Households in the Project Area and Literacy Rate
Watershed
Category
SC ST Others 10P8a 695 6 5608 10P9a 209 0 1404
10P10a 33 0 275 11M19a 177 8 2321 11M20a 290 11 4166
Total 1404 25 13774 Source: Primary Survey
Literacy rate of the population in the project area is in the chart given below.

56
Source: Primary Survey
Table 2.19. presents the details about the number and proportion of families living below poverty line (BPL) and those living above poverty line (APL). About 37 per cent of the families in the project area live below poverty line.
Table 2.19: Poverty status of households
Micro Watershed
BPL APL Total No. % No. % No. %
10P8a 2289 36.28 4020 63.72 6309 100.00 10P9a 696 43.15 917 56.85 1613 100.00 10P10a 137 44.48 171 55.52 308 100.00 11M19a 1007 40.18 1499 59.82 2506 100.00 11M20a 1535 34.36 2932 65.64 4467 100.00 Total 5664 37.26 9539 62.74 15203 100.00
Source: Primary Survey

57
The distribution of households according to the main source of income of the household is presented in Table 2.20. Table 2.20: Main Source of Income of Households in the Project Area
Main source of income
Micro Watershed Total 10P8a 10P9a 10P10a 11M19a 11M20a
No. % No. % No. % No. % No. % No. % Agriculture 552 8.75 110 6.82 36 11.69 206 8.22 137 3.07 1041 6.85 Fishing 64 1.01 26 1.61 - - 33 1.32 34 0.76 157 1.03 Daily labour 2743 43.48 785 48.67 148 48.05 1196 47.73 1860 41.64 6732 44.28 Agriculture labour 58 0.92 24 1.49 2 0.65 19 0.76 42 0.94 145 0.95 Salary -Government 246 3.90 72 4.46 17 5.52 111 4.43 358 8.01 804 5.29 Salary – Private 467 7.40 114 7.07 23 7.47 133 5.31 297 6.65 1034 6.80 Self employed/Business
359 5.69 118 7.32 6 1.95 119 4.75 305 6.83 907 5.97
Income from abroad 898 14.23 195 12.09 20 6.49 303 12.09 685 15.33 2101 13.82 Pension 711 11.27 144 8.93 40 12.99 285 11.37 619 13.86 1799 11.83 Others 211 3.34 25 1.55 16 5.19 101. 4.03 130 2.91 483 3.18 Total 6309 100.00 1613 100.00 308 100.00 2506 100.00 4467 100.00 15203 100.00 Source: Primary Survey
The decline in agricultural employment is an emerging issue in the project area. There has also been an alienation of the younger generation from the agriculture sector. The details about the landless households in the project area are presented in Table 2.21. Landless households constitute about two per cent of the total number of households in the project area.
Table 2.21: Details about the Landless Households in the Project Area Micro
Watershed Landless Households No. % to total

58
10P8a 114 1.81 10P9a 5 0.31 10P10a 10 3.25 11M19a 30 1.20 11M20a 92 2.06 Total 251 1.65
Source: Primary Survey
Table 2.22. presents the details of land owned by farmers in the watershed area. Majority of the households in the project area have a land holding of less than 50 cents.
Table 2.22 Details of Land Owned by Farmers in the Microwatersheds in the Project Area
Land Holding Size (cents) 10P8a 10P9a 10P10a 11M19a 11M20a Total
1-5 1581 545 76 589 1069 3860 5.1-50 3807 916 186 1437 2830 9176 51-250 782 140 36 406 463 1827 251-500 and above 25 7 0 44 13 89 Landless 114 5 10 30 92 251 Total HH 6309 1613 308 2506 4467 15203
Source: Primary Survey
Proportion of households with electric connection in the project area is shown in Table 2.23. Only one per cent of the households in the project area do not have access to electricity.
Table 2.23: Proportion of Households with Electric Connection

59
Micro Watershed
Yes No Total No. % No. % No. %
10P8a 6214 98.49 95 1.51 6309 100.00 10P9a 1582 98.08 31 1.92 1613 100.00 10P10a 307 99.68 1 0.32 308 100.00 11M19a 2457 98.04 49 1.96 2506 100.00 11M20a 4418 98.90 49 1.10 4467 100.00 Total 14978 98.52 225 1.48 15203 100.00
Source: Primary Survey Table 2.24. presents main fuel used for cooking by households in the project area. More than half of the population use wood as main fuel for cooking.
Table 2.24: Main Fuel for Cooking in the Households
Micro Watershed
Main Fuel Total LPG Wood Others
No. % No. % No. % No. % 10P8a 2230 35.35 4055 64.27 24 0.38 6309 100.00 10P9a 876 54.31 735 45.57 2 0.12 1613 100.00 10P10a 289 93.83 18 5.84 1 0.32 308 100.00 11M19a 692 27.61 1804 71.99 10 0.40 2506 100.00 11M20a 1890 42.31 2553 57.15 24 0.54 4467 100.00 Total 5977 39.31 9165 60.28 61 0.40 15203 100.00
Source: Primary Survey The distribution of households according to the type of toilet facility available in the households is presented in Table 2.25. Toilet facility is not available in three per cent of the households in the project area.
Table 2.25: Toilet Facility of the Households in the Project Area

60
Micro Watershed
Type of Toilet Septic Tank Pit Public Toilet No toilet Total No. % No. % No. % No. % No. %
10P8a 3419 54.19 2636 41.78 19 0.30 235 3.72 6309 100.00 10P9a 982 60.88 578 35.83 7 0.43 46 2.85 1613 100.00 10P10a 301 97.73 4 1.30 0 0.00 3 0.97 308 100.00 11M19a 1589 63.41 776 30.97 16 0.64 125 4.99 2506 100.00 11M20a 2222 49.74 2180 48.80 7 0.16 58 1.30 4467 100.00 Total 8513 56.00 6174 40.61 49 0.32 467 3.07 15203 100.00
source: Primary Survey
Table 2.26. presents participation of households in Self Help Groups. About half of the population have membership in SHGs of which large majority have membership in Kudumbasree SHGs.
Table 2.26: Membership in Self Help Groups
Micro Watershed
Type of SHG No
membership Total Kudumbashree
Block SHG
Others
No. % No. % No. % No. % No. %
10P8a 3243 51.40 7 0.11 172 2.73 2887 45.76 6309 100.00 10P9a 865 53.63 47 2.91 10 0.62 691 42.84 1613 100.00 10P10a 171 55.52 2 0.65 0 0.00 135 43.83 308 100.00 11M19a 1217 48.56 5 0.20 44 1.76 1240 49.48 2506 100.00 11M20a 1819 40.72 14 0.31 140 3.13 2494 55.83 4467 100.00 Total 7315 48.12 75 0.49 366 2.41 7447 48.98 15203 100.00
Source: Primary Survey
61
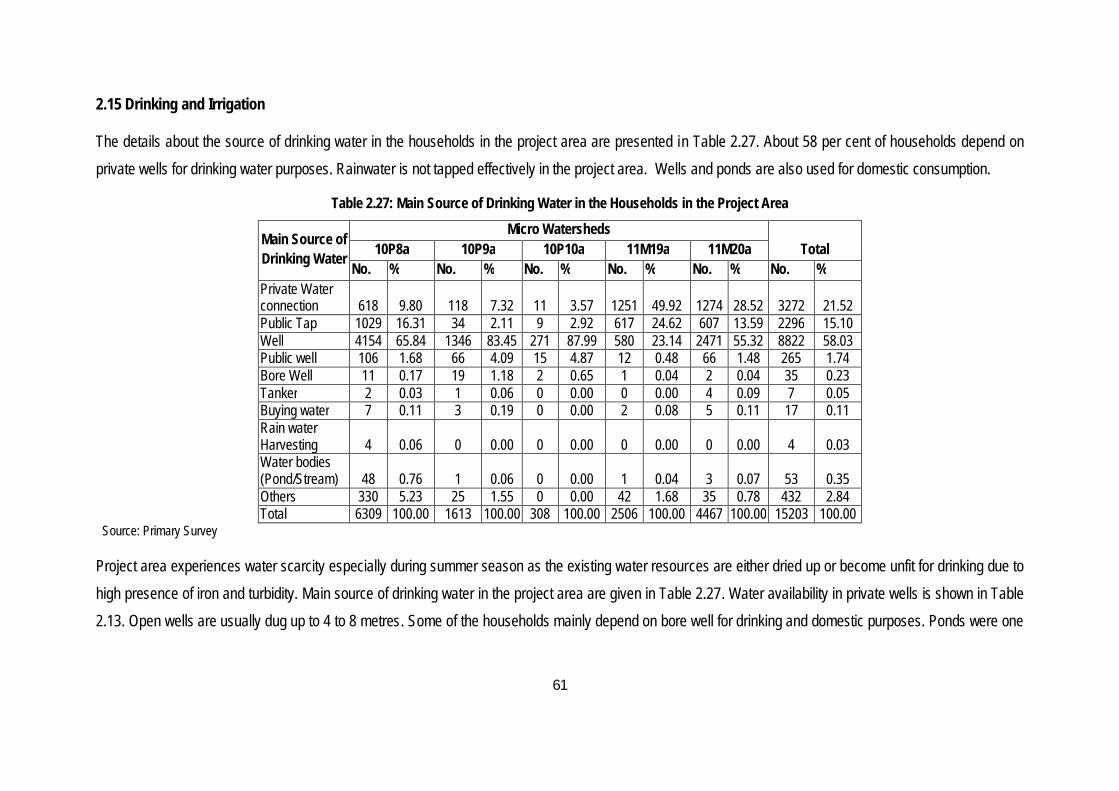
2.15 Drinking and Irrigation
The details about the source of drinking water in the households in the project area are presented in Table 2.27. About 58 per cent of households depend on private wells for drinking water purposes. Rainwater is not tapped effectively in the project area. Wells and ponds are also used for domestic consumption.
Table 2.27: Main Source of Drinking Water in the Households in the Project Area
Main Source of Drinking Water
Micro Watersheds Total 10P8a 10P9a 10P10a 11M19a 11M20a
No. % No. % No. % No. % No. % No. % Private Water connection 618 9.80 118 7.32 11 3.57 1251 49.92 1274 28.52 3272 21.52 Public Tap 1029 16.31 34 2.11 9 2.92 617 24.62 607 13.59 2296 15.10 Well 4154 65.84 1346 83.45 271 87.99 580 23.14 2471 55.32 8822 58.03 Public well 106 1.68 66 4.09 15 4.87 12 0.48 66 1.48 265 1.74 Bore Well 11 0.17 19 1.18 2 0.65 1 0.04 2 0.04 35 0.23 Tanker 2 0.03 1 0.06 0 0.00 0 0.00 4 0.09 7 0.05 Buying water 7 0.11 3 0.19 0 0.00 2 0.08 5 0.11 17 0.11 Rain water Harvesting 4 0.06 0 0.00 0 0.00 0 0.00 0 0.00 4 0.03 Water bodies (Pond/Stream) 48 0.76 1 0.06 0 0.00 1 0.04 3 0.07 53 0.35 Others 330 5.23 25 1.55 0 0.00 42 1.68 35 0.78 432 2.84 Total 6309 100.00 1613 100.00 308 100.00 2506 100.00 4467 100.00 15203 100.00
Source: Primary Survey
Project area experiences water scarcity especially during summer season as the existing water resources are either dried up or become unfit for drinking due to high presence of iron and turbidity. Main source of drinking water in the project area are given in Table 2.27. Water availability in private wells is shown in Table 2.13. Open wells are usually dug up to 4 to 8 metres. Some of the households mainly depend on bore well for drinking and domestic purposes. Ponds were one

62
of the major sources of irrigation in the past but presently most of them are either converted to land by filling or using as a waste dumping place. Ponds are dug at a depth of 1.5 to 3 metres.
Table 2.28: Quality of water from Pulikeezhu Tube Well Constituent Value
pH 5.89 TH 1040 Calcium mg/l 184 Mg mg/l 141 CO3 0 HCO3 29 Cl 2244 F 0.21 Na 960 K 31 EC µs/cm at 25o C 6300
Source: Ground Water Information Booklet of Pathanamthitta District
The chemical analysis of water samples from a tube well at Pulikeezhu is summarized in Table 2.28. The data indicates that the water is brackish with the electrical conductivity value of 6300 µs/cm at 25oC. Thus the water is unfit for domestic and irrigation purposes7.
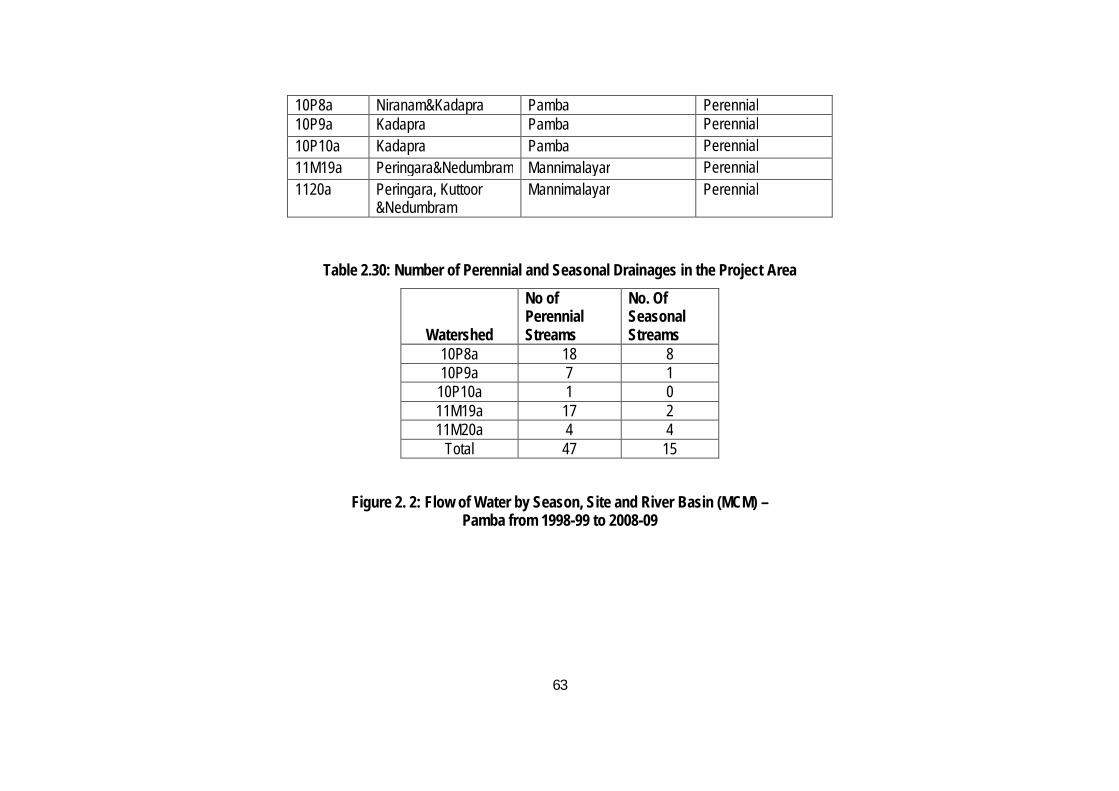
There are large number of canals and vachals in the project area which are used for watering the crops and dewatering. Majority of streams are perennial and some are drying up due to sediment deposition. List of drainages and its status are given below.
Table 2.29 : Drainages in the Project Area Watershed
code Grama Panchayath Name of the
drains/streams/ rivers Perennial/Seasonal
7 Ground Water Information Booklet of Pathanamthitta District, Central Ground Water Board, Ministry of Water Resources, Government of India.
63
10P8a Niranam&Kadapra Pamba Perennial 10P9a Kadapra Pamba Perennial 10P10a Kadapra Pamba Perennial 11M19a Peringara&Nedumbram Mannimalayar Perennial 1120a Peringara, Kuttoor
&Nedumbram Mannimalayar Perennial
Table 2.30: Number of Perennial and Seasonal Drainages in the Project Area
Watershed
No of Perennial Streams
No. Of Seasonal Streams
10P8a 18 8 10P9a 7 1 10P10a 1 0 11M19a 17 2 11M20a 4 4
Total 47 15
Figure 2. 2: Flow of Water by Season, Site and River Basin (MCM) – Pamba from 1998-99 to 2008-09

64
Figure 2.3: Flow of Water by Season, Site and River Basin (MCM) – Manimala from 1998-99 to 2008-09

65
Table: 2.31: Number of Ponds and Water Storage Capacity in Cubic Metres
Watershed Code Total no. of Water Storage Structures
Total storage capacity of water storage
structures 10P8a 59 20320 10P9a 3 2400 10P10a 4 2560 11M19a 9 2880 11M20a 21 8400
Total 96 36560 Source: Primary Survey
2.16 Transport and Communication Facilities
All the microwatersheds in the project area are well connected with road transport. But unscientific construction of these roads without considering the flow of water leads to destruction of these roads during rainy season. Almost of all the households in the project area have access to telephone connection. A telephone exchange is also functioning in the project area
Table: 2.32: Length of Roads (in Km)
Watershed Length of Roads
Tarred Roads
10P8a 209 94.1 10P9a 18.75 8.4 10P10a 6.25 2.8 11M19a 86.17 38.8 11M20a 86.17 38.8

66
Total 297.34 182.9 Source: Calculated using GIS
2.17 Agriculture and Land Use Pattern
Paddy is the main crop cultivated in the project area. Farmers here mostly use Uma variety of paddy for the 3rd Puncha season (October to March). 1st and 2nd crops are not popular in the area due to flood in the rainy season and lack of labourers. Some of the paddy fields are used for vegetable cultivation. Cow dung, organic manures, chemicals, pesticides etc are used for farming. Agriculture depends mainly on rainfall. Other crops like turmeric, mango, coconut, arecanut, banana, tapioca, pulses and vegetables like cucumber, snake gourd, bitter gourd, ivy gourd etc are also cultivated in the project area. The main problems faced by the agriculture sector are labour shortage, high labour cost, unutilization of fallow/wasteland, lack of interest among youngsters, climatic conditions, improper soil and water management, lack of repair/maintenance of ponds, extensive use of chemicals and pesticides, increased prices of fertilizers and chemicals etc.
Table: 2.33: Details of Cultivable Wasteland in the Project Area
Name of Micro Watershed
Area of Waste Land Cultivable (ha) Problems Suggestions
10P8a 47.33 Land is owned by the people who are not interested in farming and reluctant to lease it to others for farming. These families do not consider agriculture as a major source of income.
People's representatives could encourage the owners to lease the land to SHGs 10P9a 3.27
10P10a 0 11M19a 0 11M20a 0 Total 50.6 Source: Preliminary Project Report for IWMP II/2012-13

67
2.18 Animal Husbandry, Dairying and Poultry
Livestock and poultry are important subsidiary activities in the project area. Rearing livestock in homestead is a source of income and employment. Cattle breeds like Holstein Friesian, Jercy etc are reared. Farmers have recently started raising buffalo for meat considering the increased demand of beef. The major problems in dairy sector identified through PRA are high cost of feed, lack of maintenance of shed, low selling cost of milk, etc. The livestock population in the project area is shown in Table 2.36.
Table 2.34: Details of Livestock and Poultry in the Project Area Micro
Watershed Cow Buffalo Duck Hen Goat
10P8a 946 56 2574 6461 725 10P9a 221 8 72 531 47 10P10a 93 4 44 38 35 11M19a 331 35 929 7073 254 11M20a 544 47 514 3176 289 Total 2135 150 4133 17279 1350
Source: Primary Survey
2.19 Educational and Health Infrastructure in the Project Area The details of the educational infrastructure in the project area collected through PRA techniques are presented in Table 2.37, 2.40 and 2.41. Health institutions in the project area are shown in Table 2.38
Table 2.35: Educational Institutions in the Project Area Lower Primary School 33 Upper Primary School 11 High School 12 Higher Secondary School 1 Technical institution 2

68
Coaching center 4 College 4
Table 2.36: Medical Facilities in the Project Area Health centre 4 Allopathy hospital 2 Ayurveda hospital 2 Homeopathy hospital 1
2.20 Recreation Facilities
Major recreation facilities in the project area are Arts and Sports clubs. There are 7 clubs functioning at various locations. Lack of public place is a limitation to the younger generation to engage in pass time activities. Six libraries are also functioning in the project area.
2.21 Other Infrastructure in the Project Area
Other infrastructure in the project area other than mentioned above are shown below
Table 2.37: Infrastructure in the Project Area Facilities Number Anganwady 14 Commercial bank 8 Co-operative society/bank 4 Day Care Centre/Play School/Children home 3 Ration shop 9 Maveli store 4 Neethi store 4 Public market 6 Margin free market 2 Arts/ Sports club 7

69
Post office 5 Police station 1 Community hall 5 Library 6 Milk collection centre/society 4 Nursery 2 Krishi Bhavan 4 Veterinary hospital 6 Village office 4 Panchayat office 4 Market 8 Church 37 Temple 23 Mosque 4 Akshaya Information Centre 4 Auditorium 2 Telephone exchange 1 KSEB 2 Padanaveedu 1 Kudumbasree office 5
Source: Primary Survey
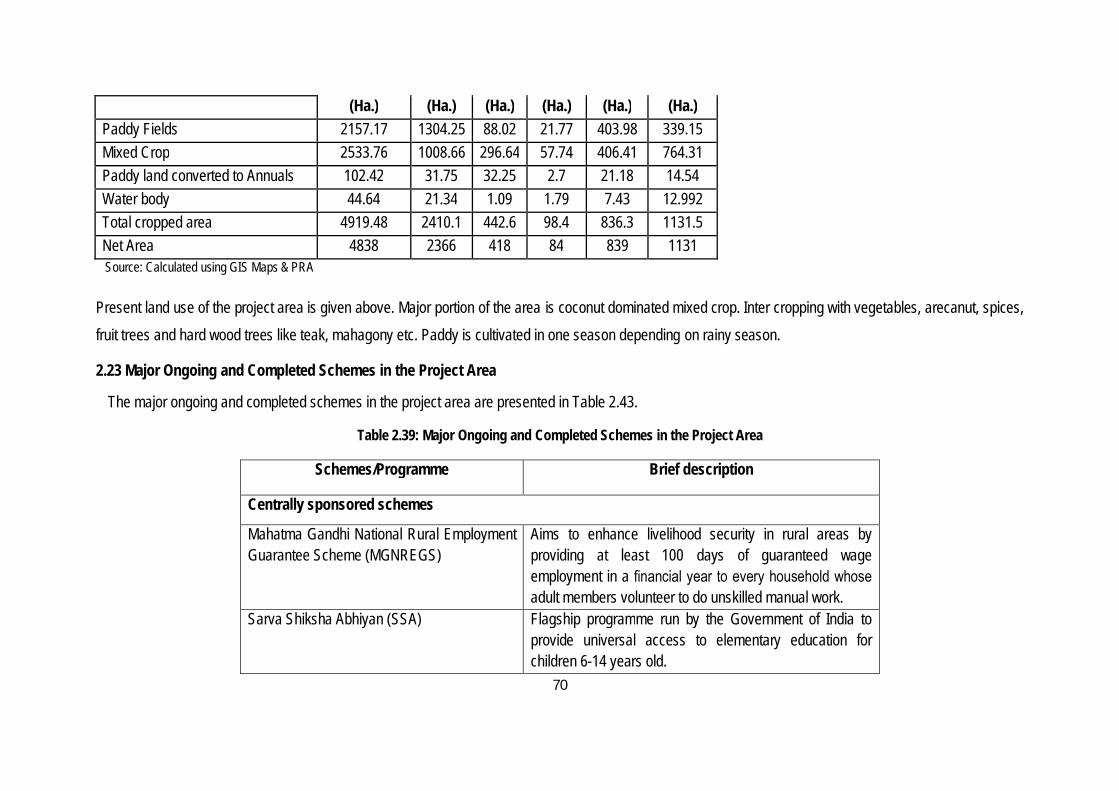
2.22 Land Use Pattern of the Project Area
Table 2.38: Present Land Use Pattern in Micro Watershed
Land used for
Micro Watersheds Project area 10P8a 10P9a 10P10a 11M19a 11M20a
Area Area Area Area Area Area
70
(Ha.) (Ha.) (Ha.) (Ha.) (Ha.) (Ha.) Paddy Fields 2157.17 1304.25 88.02 21.77 403.98 339.15 Mixed Crop 2533.76 1008.66 296.64 57.74 406.41 764.31 Paddy land converted to Annuals 102.42 31.75 32.25 2.7 21.18 14.54 Water body 44.64 21.34 1.09 1.79 7.43 12.992 Total cropped area 4919.48 2410.1 442.6 98.4 836.3 1131.5 Net Area 4838 2366 418 84 839 1131
Source: Calculated using GIS Maps & PRA
Present land use of the project area is given above. Major portion of the area is coconut dominated mixed crop. Inter cropping with vegetables, arecanut, spices, fruit trees and hard wood trees like teak, mahagony etc. Paddy is cultivated in one season depending on rainy season.
2.23 Major Ongoing and Completed Schemes in the Project Area
The major ongoing and completed schemes in the project area are presented in Table 2.43.
Table 2.39: Major Ongoing and Completed Schemes in the Project Area
Schemes/Programme Brief description
Centrally sponsored schemes
Mahatma Gandhi National Rural Employment Guarantee Scheme (MGNREGS)
Aims to enhance livelihood security in rural areas by providing at least 100 days of guaranteed wage employment in a financial year to every household whose adult members volunteer to do unskilled manual work.
Sarva Shiksha Abhiyan (SSA) Flagship programme run by the Government of India to provide universal access to elementary education for children 6-14 years old.

71
Indira Awas Yojana (IAY) To help in construction/upgradation of dwelling units of rural BPL SC/ST households and other vulnerable sections by providing lump sum financial assistance.
Swarnjayanti Gram Swarozgar Yojana (SGSY)
To bring the assisted poor families above the Poverty Line by ensuring appreciable sustained level of income over a period of time. This objective is to be achieved by organising the rural poor into Self Help Groups (SHGs) through the process of social mobilization, their training and capacity building and provision of income generating assets.
Integrated Child Development Services (ICDS)
This scheme represents one of the world’s largest and most unique programmes for early childhood development. ICDS is the foremost symbol of India’s commitment to her children – India’s response to the challenge of providing pre-school education on one hand and breaking the vicious cycle of malnutrition, morbidity, reduced learning capacity and mortality, on the other.
Support to State Extension Programmes for Extension Reforms
This is the main scheme to revamp agricultural extension across the country and aims at providing a decentralized and demand driven extension system by way of new institutional arrangements for technology dissemination in the form of an Agricultural Technology Management Agency (ATMA) at district level. Important farmer oriented activities under ATMA includes: (a) training of farmers (b) demonstrations on agriculture and allied sector (c) exposure visit of farmers (d) farmer-scientist interactions (d) farm schools.
72
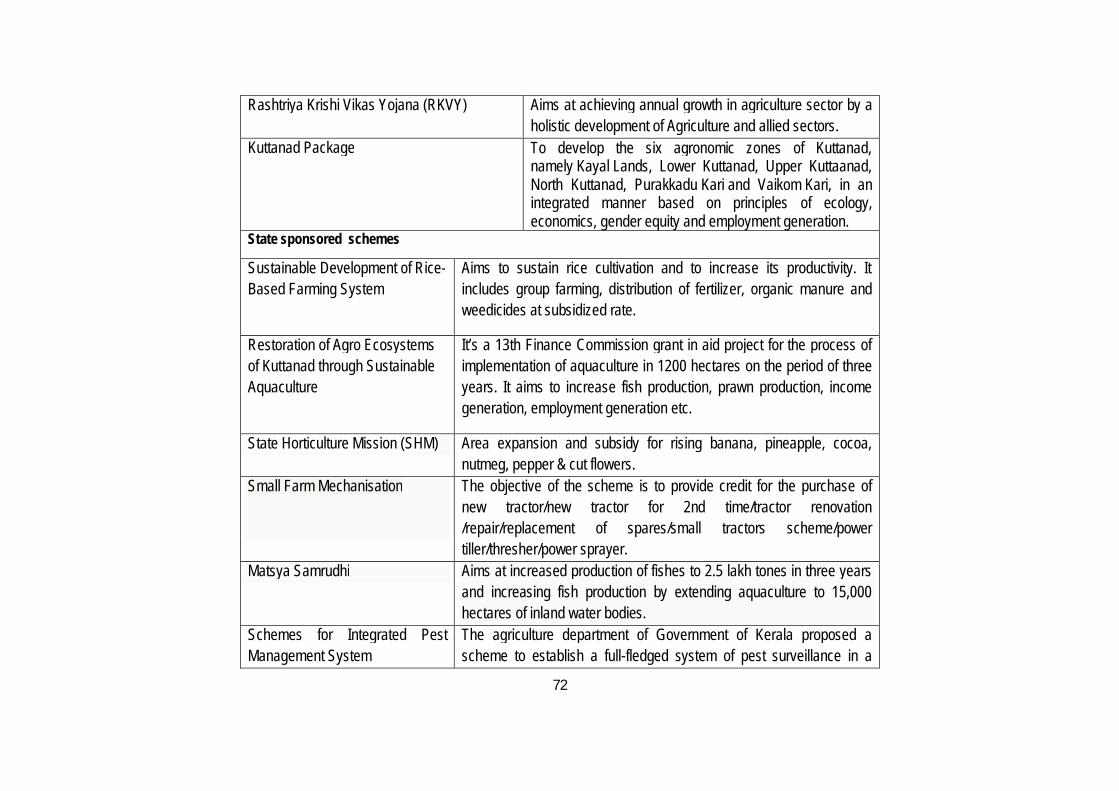
Rashtriya Krishi Vikas Yojana (RKVY) Aims at achieving annual growth in agriculture sector by a holistic development of Agriculture and allied sectors.
Kuttanad Package To develop the six agronomic zones of Kuttanad, namely Kayal Lands, Lower Kuttanad, Upper Kuttaanad, North Kuttanad, Purakkadu Kari and Vaikom Kari, in an integrated manner based on principles of ecology, economics, gender equity and employment generation.
State sponsored schemes
Sustainable Development of Rice-Based Farming System
Aims to sustain rice cultivation and to increase its productivity. It includes group farming, distribution of fertilizer, organic manure and weedicides at subsidized rate.
Restoration of Agro Ecosystems of Kuttanad through Sustainable Aquaculture
It’s a 13th Finance Commission grant in aid project for the process of implementation of aquaculture in 1200 hectares on the period of three years. It aims to increase fish production, prawn production, income generation, employment generation etc.
State Horticulture Mission (SHM) Area expansion and subsidy for rising banana, pineapple, cocoa, nutmeg, pepper & cut flowers.
Small Farm Mechanisation
The objective of the scheme is to provide credit for the purchase of new tractor/new tractor for 2nd time/tractor renovation /repair/replacement of spares/small tractors scheme/power tiller/thresher/power sprayer.
Matsya Samrudhi
Aims at increased production of fishes to 2.5 lakh tones in three years and increasing fish production by extending aquaculture to 15,000 hectares of inland water bodies.
Schemes for Integrated Pest Management System
The agriculture department of Government of Kerala proposed a scheme to establish a full-fledged system of pest surveillance in a

73
phased manner, to cover major crops of the State. The thrust of the scheme will be on biocontrol measures from a long-term perspective. The main objectives of the scheme are: (a) To keep pests and diseases of crops below Economic Threshold level by adopting an integrated pest management practice. (b) Constant pest surveillance and monitoring to ascertain pest population (c) Creating awareness among farmers on the prominent pests and diseases, which cause severe damage to crops and suggest measures to prevent them.
Integrated Nutrient Management System
The scheme intends to promote usage of organic manures so as to maintain and to enhance the fertility level of soil. Objectives:(a) To establish soil nutrient balance (b) To increase orgasnic matter content of the soil and make it productive (c) To create awarness among farmers about the sustainability aspects of soil fertility (d)To chalk out soil fertility map of the panchayats (e) Strengthening of Soil/Fertiliser/Bio-fertiliser/Pesticide laboratories.
Schemes implemented by Government agency / departments in the project area
Development of Aquaculture Support from Agency for Development of Aquaculture Kerala (ADAK) for infrastructure development for fish culture; fish seed, fish food, pond perpetuation, pen culture, cage culture.
Fishermen welfare activities Accidental death insurance; aid for education, marriage, house maintenance; subsidy for fishing equipments, freezing plants for SHGs; Saving Cum Relief Scheme to Fishermen under National Fishermen Welfare Fund (NFWF).
Dairy farmers welfare activities Aid is given from welfare fund of dairy farmers for scholarships, marriage, pension, family pension, medical treatment.
Measures and schemes for cattle Distribution of breeding calves, distribution of cattle food and medicine, subsidy for renovation of cow shed, compulsory vaccination and treatment of
74
protection.
livestock, cattle artificial insemination centre, preventive measures for communicable diseases, provide cattle insurance facility to farmers for their livestock, prevention and control of cattle borne diseases with the support of institutions and groups, conduct infertility camps, provide technical support for self employed farmers.
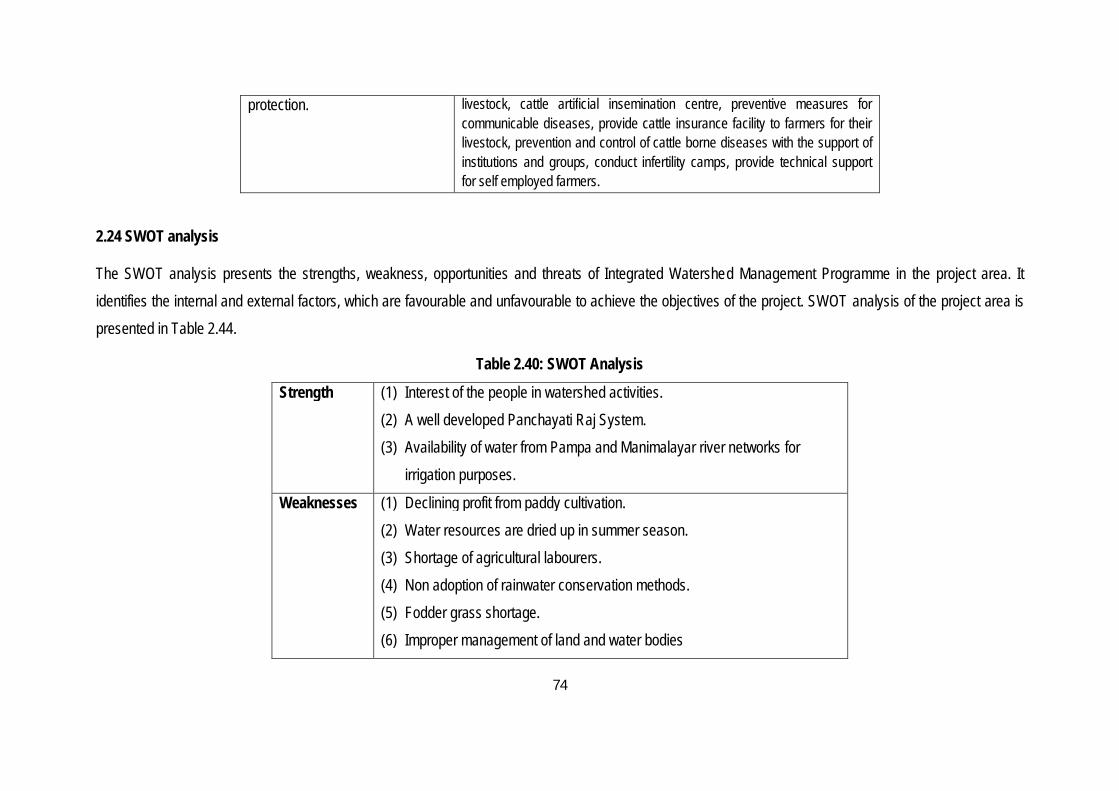
2.24 SWOT analysis
The SWOT analysis presents the strengths, weakness, opportunities and threats of Integrated Watershed Management Programme in the project area. It identifies the internal and external factors, which are favourable and unfavourable to achieve the objectives of the project. SWOT analysis of the project area is presented in Table 2.44.
Table 2.40: SWOT Analysis
Strength (1) Interest of the people in watershed activities. (2) A well developed Panchayati Raj System. (3) Availability of water from Pampa and Manimalayar river networks for
irrigation purposes.
Weaknesses (1) Declining profit from paddy cultivation. (2) Water resources are dried up in summer season. (3) Shortage of agricultural labourers. (4) Non adoption of rainwater conservation methods. (5) Fodder grass shortage. (6) Improper management of land and water bodies

75
(7) Improper waste management practices
Opportunities (1) Scope for improving productivity of agricultural crops by adopting modern techniques of farming.
(2) Possibilities of cooperative farming and organic farming practices. (3) Scope for improving land area under horticulture crops. (4) Scope for breed improvement, pisciculture, duck farming etc. (5) Scope for using fallow/wastelands for cultivation. (6) Scope for convergence with other schemes (7) Possibilities to adopt water conservation/harvesting and recharging
structures (8) Scope for management programmes to control flood/water logging and
sediment removal
Threats (1) Change in climatic conditions. (2) Rise in cost of agriculture machines, pesticides, chemicals etc. (3) Lack of interest among new generation towards agriculture activities. (4) Excessive use of chemicals and pesticides. (5) Increase in cost of seeds, fertilizers, pesticides etc. (6) Spread of diseases (foot and mouth disease) among cattle. (7) Delay in implementation of renovation activities of water bodies. (8) Over grazing of land. (9) Delay in timely interventions by the authorities.

76
(10) Contamination of drinking water because of seepage from latrines during flood.
(11) Uncontrolled sand mining from Pamba and Manimala resulting in ground water level depletion.
77
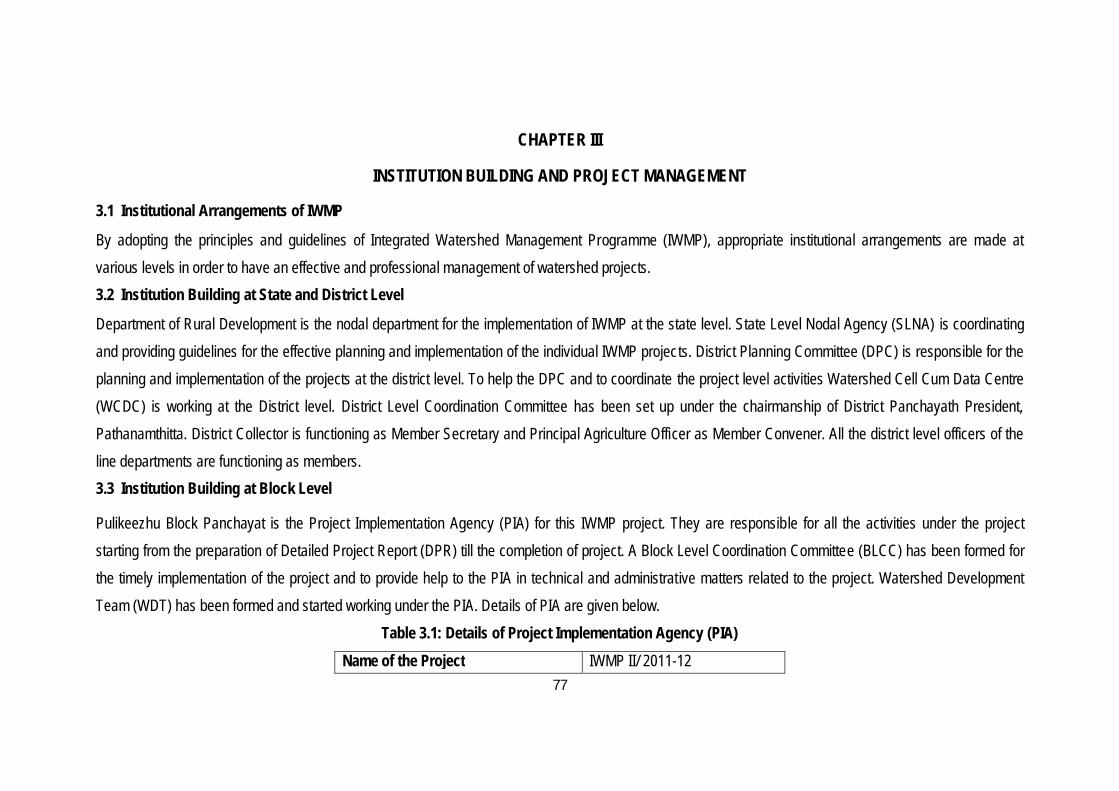
CHAPTER III
INSTITUTION BUILDING AND PROJECT MANAGEMENT
3.1 Institutional Arrangements of IWMP
By adopting the principles and guidelines of Integrated Watershed Management Programme (IWMP), appropriate institutional arrangements are made at various levels in order to have an effective and professional management of watershed projects. 3.2 Institution Building at State and District Level
Department of Rural Development is the nodal department for the implementation of IWMP at the state level. State Level Nodal Agency (SLNA) is coordinating and providing guidelines for the effective planning and implementation of the individual IWMP projects. District Planning Committee (DPC) is responsible for the planning and implementation of the projects at the district level. To help the DPC and to coordinate the project level activities Watershed Cell Cum Data Centre (WCDC) is working at the District level. District Level Coordination Committee has been set up under the chairmanship of District Panchayath President, Pathanamthitta. District Collector is functioning as Member Secretary and Principal Agriculture Officer as Member Convener. All the district level officers of the line departments are functioning as members. 3.3 Institution Building at Block Level
Pulikeezhu Block Panchayat is the Project Implementation Agency (PIA) for this IWMP project. They are responsible for all the activities under the project starting from the preparation of Detailed Project Report (DPR) till the completion of project. A Block Level Coordination Committee (BLCC) has been formed for the timely implementation of the project and to provide help to the PIA in technical and administrative matters related to the project. Watershed Development Team (WDT) has been formed and started working under the PIA. Details of PIA are given below.
Table 3.1: Details of Project Implementation Agency (PIA) Name of the Project IWMP II/ 2011-12
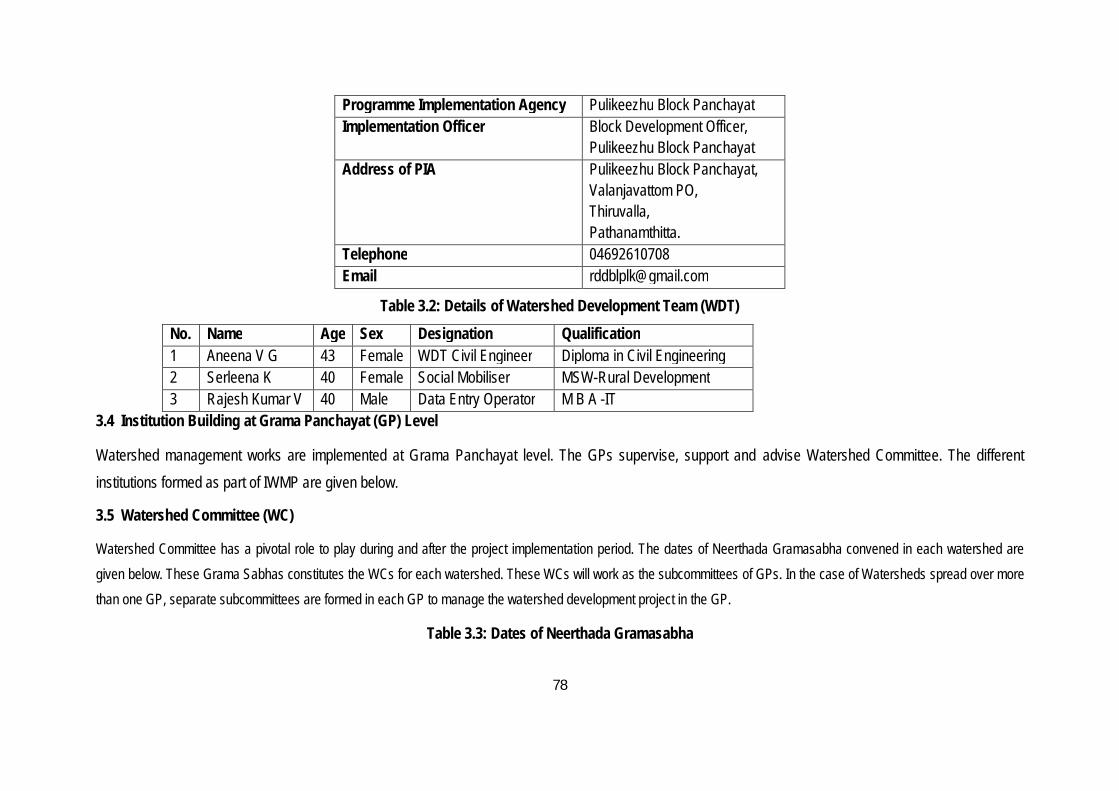
78
Programme Implementation Agency Pulikeezhu Block Panchayat Implementation Officer Block Development Officer,
Pulikeezhu Block Panchayat Address of PIA Pulikeezhu Block Panchayat,
Valanjavattom PO, Thiruvalla, Pathanamthitta.
Telephone 04692610708 Email [email protected]
Table 3.2: Details of Watershed Development Team (WDT) No. Name Age Sex Designation Qualification 1 Aneena V G 43 Female WDT Civil Engineer Diploma in Civil Engineering 2 Serleena K 40 Female Social Mobiliser MSW-Rural Development 3 Rajesh Kumar V 40 Male Data Entry Operator M B A -IT
3.4 Institution Building at Grama Panchayat (GP) Level
Watershed management works are implemented at Grama Panchayat level. The GPs supervise, support and advise Watershed Committee. The different institutions formed as part of IWMP are given below.
3.5 Watershed Committee (WC)
Watershed Committee has a pivotal role to play during and after the project implementation period. The dates of Neerthada Gramasabha convened in each watershed are given below. These Grama Sabhas constitutes the WCs for each watershed. These WCs will work as the subcommittees of GPs. In the case of Watersheds spread over more than one GP, separate subcommittees are formed in each GP to manage the watershed development project in the GP.
Table 3.3: Dates of Neerthada Gramasabha

79
Sl No.
Name and code of Micro Watershed
Grama Panchayat
Date of Watershed Grama sabha
1 Ayyankonary, 10P8a Niranam 14/6/2013 2 Podiyadi Puthanthodu, 11M20a Nedumbram 15/6/2013 3 Keecherivalkadavu, 10P10a Kadapra 17/6/2013 4 Parumala, 10P9a Kadapra 2/7/2013 5 Chathenkery Kadavu, 11M19a Peringara 29/8/2013
3.6 Self Help Groups (SHGs) There are 246 SHGs working in the project area already. Under IWMP II/ 2011-12 project, until now 172 SHGs have been registered and the registration process is going on. These groups are organized through credit and thrift activities. Some of the groups are also engaged in micro-enterprises . Both women and men SHGs are active in the project area. Details of the SHGs in the project area are given below.
3.7 User Groups (UGs)
User groups are proposed to be formed to manage the different activities or assets created under the programme on a long term basis. The user groups are expected to collect user charges from their members, oversee the works and manage the benefits. At present, user groups to implement Entry Point Activities have been formed. Later on, it will be formed for each work.
3.8 IWMP Project Management
Table 3.4: Implementation phases of IWMP
Phase Name Duration I Preparatory Phase 1-2 years II Watershed Works Phase 2-3 years III Consolidation and Withdrawal Phase 1-2 years
Activities under each phase are mentioned below.

80
3.9 Preparatory Phase:
Institution building, training and empowerment of institutions like watershed committee (WC), user groups (UGs) and self help groups (SHGs) through Capacity Builiding and IEC ativities.
Preparation of Detailed Project Report with detailed action plans through participatory exercises Entry Point Activity shall be taken up during this phase to establish credibility of the Watershed Development Team (WDT) and create a rapport with the village community.
3.10 Watershed Works Phase:
This phase is the heart of the programme in which the DPR will be implemented. Execution of yearly action plans (NRM works, Production System and Micro-enterprises and Livelihood activities will be implemented)
3.11 Consolidation and Withdrawal Phase:
In this phase the resources augmented and economic plans developed in watershed work phase becomes the foundation to create new nature-based, sustainable livelihoods and raise productivity levels.
Bridging the gaps for post project sustainability.
Building the capacity of the community based organizations to carry out the new agenda items during post project period.
Preparation of project completion report with details about status of each intervention.
Documentation of successful experiences as well as lessons learnt for future use.

81
CHAPTER IV MICRO WATERSHEDS IN THE PROJECT AREA
4.1 Introduction
The project IWMP II/2012-13 is a cluster of five micro-watersheds namely Ayyankonari (10P8a), Parumala (10P9a), Keecherivalkadavu (10P10a), Chathenkery Kadavu (11M19a) and Podiyadi Puthanthodu (11M20a).The details of each micro watershed in the project area are presented in this chapter.
4.2 Location and Extent of Micro Watersheds
The location and extent of the selected watersheds in the project area are presented in Table 4.1.
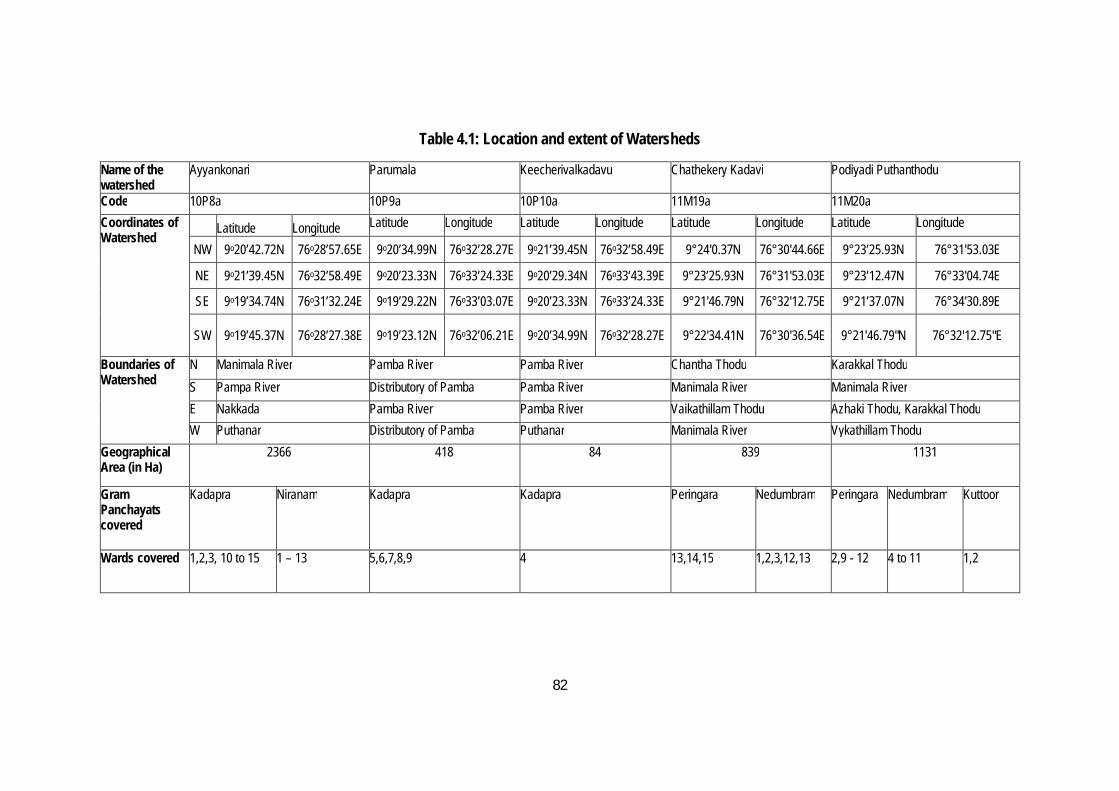
82
Table 4.1: Location and extent of Watersheds
Name of the watershed
Ayyankonari Parumala Keecherivalkadavu Chathekery Kadavi Podiyadi Puthanthodu
Code 10P8a 10P9a 10P10a 11M19a 11M20a Coordinates of Watershed
Latitude Longitude Latitude Longitude Latitude Longitude Latitude Longitude Latitude Longitude
NW 9o20’42.72N 76o28’57.65E 9o20’34.99N 76o32’28.27E 9o21’39.45N 76o32’58.49E 9°24'0.37N 76°30'44.66E 9°23’25.93N 76°31'53.03E
NE 9o21’39.45N 76o32’58.49E 9o20’23.33N 76o33’24.33E 9o20’29.34N 76o33’43.39E 9°23’25.93N 76°31'53.03E 9°23’12.47N 76°33'04.74E
SE 9o19’34.74N 76o31’32.24E 9o19’29.22N 76o33’03.07E 9o20’23.33N 76o33’24.33E 9°21'46.79N 76°32'12.75E 9°21’37.07N 76°34'30.89E
SW 9o19’45.37N 76o28’27.38E 9o19’23.12N 76o32’06.21E 9o20’34.99N 76o32’28.27E 9°22'34.41N 76°30'36.54E 9°21'46.79"N 76°32'12.75"E
Boundaries of Watershed
N Manimala River Pamba River Pamba River Chantha Thodu Karakkal Thodu S Pampa River Distributory of Pamba Pamba River Manimala River Manimala River E Nakkada Pamba River Pamba River Vaikathillam Thodu Azhaki Thodu, Karakkal Thodu W Puthanar Distributory of Pamba Puthanar Manimala River Vykathillam Thodu
Geographical Area (in Ha)
2366 418 84 839
1131
Gram Panchayats covered
Kadapra Niranam Kadapra
Kadapra
Peringara Nedumbram Peringara Nedumbram Kuttoor
Wards covered 1,2,3, 10 to 15 1 – 13 5,6,7,8,9
4
13,14,15 1,2,3,12,13 2,9 - 12 4 to 11 1,2

83
4.3 Physiography, Relief and Drainage of Micro Watersheds
Physiographically the project area lies between 7.5 m and 75 m above MSL. The five micro watersheds coming under Pulikeezhu IWMP - 2 project falls under mid land division. The geographical area of these micro watersheds ranges from 80 – 2400 hectares. Maximum relief (elevation difference between highest and lowest point) of these micro watersheds ranges from 4 m to 13 m. Table 4.2 represents some characteristics of micro watersheds.
Table 4.2: Characteristics of Micro Watersheds coming under IWMP II / 2011-12 Watershed character
Project Area
10P8a 10P9a 10P10a 11M19a 11M20a
Compactness Index (C= P/2√π A)
2.95 1.45 1.25 1.59 1.61 1.43
Length of Main stream (KM) 71.4 24.96 9.09 3.87
16.49 16.99
Drainage Density (KM/Sq.KM) 1.5 1.1 2.2 4.6 2.0 1.5
Average Slope (%) 0 to 1 0 to 1 0 to 1 0 to 1 0 to 1 0 to 1
Relief(M) 4 to 13 11 13 4 9 8 Elevation (M) 1 to 17 1 to 12 3 to 17 6 to 10 2 to 11 5 to 13 Perimeter(KM) 72.70 24.96 9.09 5.17 16.49 19.99 Area (KM2) 48.38 23.67 4.18 0.84 8.39 11.30 Drainage inside the WS (KM) 51.1 29.7 3 2.4 6.7 9.3
Source: Calculated using GIS Maps
4.4 Agriculture and Present Land Use in Micro Watersheds
The details of the land use pattern in the micro watersheds are presented in this section
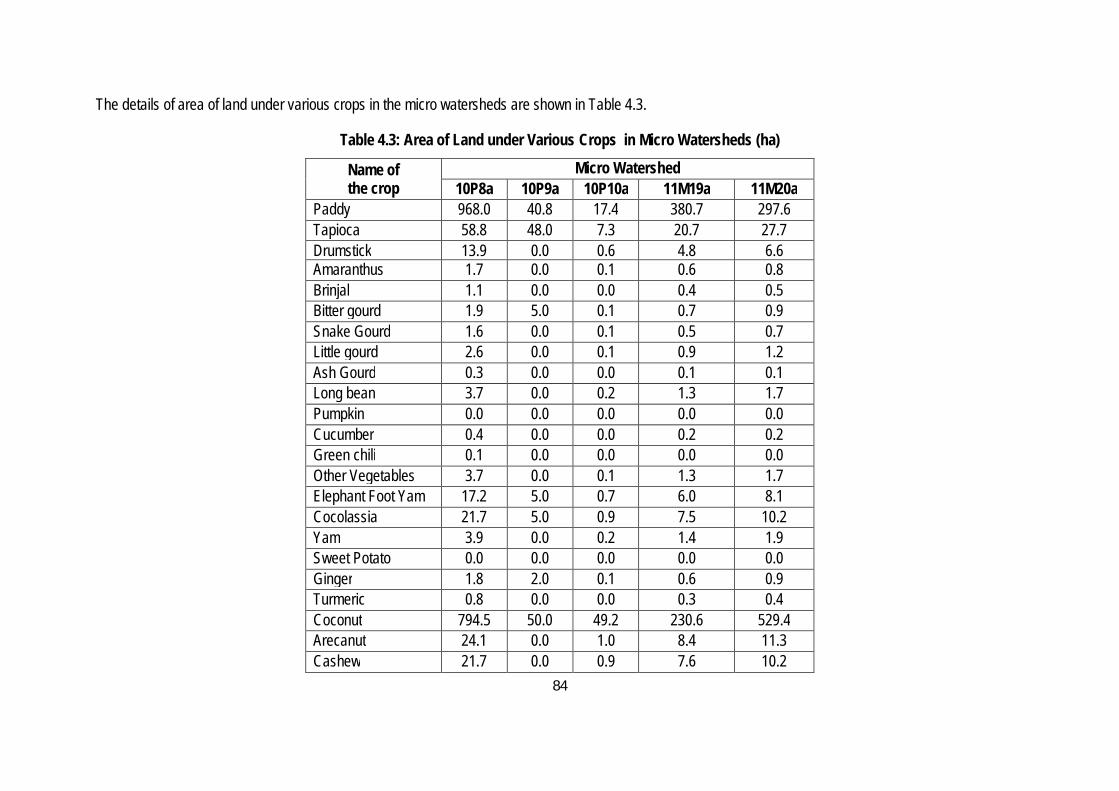
84
The details of area of land under various crops in the micro watersheds are shown in Table 4.3.
Table 4.3: Area of Land under Various Crops in Micro Watersheds (ha)
Name of the crop
Micro Watershed 10P8a 10P9a 10P10a 11M19a 11M20a
Paddy 968.0 40.8 17.4 380.7 297.6 Tapioca 58.8 48.0 7.3 20.7 27.7 Drumstick 13.9 0.0 0.6 4.8 6.6 Amaranthus 1.7 0.0 0.1 0.6 0.8 Brinjal 1.1 0.0 0.0 0.4 0.5 Bitter gourd 1.9 5.0 0.1 0.7 0.9 Snake Gourd 1.6 0.0 0.1 0.5 0.7 Little gourd 2.6 0.0 0.1 0.9 1.2 Ash Gourd 0.3 0.0 0.0 0.1 0.1 Long bean 3.7 0.0 0.2 1.3 1.7 Pumpkin 0.0 0.0 0.0 0.0 0.0 Cucumber 0.4 0.0 0.0 0.2 0.2 Green chili 0.1 0.0 0.0 0.0 0.0 Other Vegetables 3.7 0.0 0.1 1.3 1.7 Elephant Foot Yam 17.2 5.0 0.7 6.0 8.1 Cocolassia 21.7 5.0 0.9 7.5 10.2 Yam 3.9 0.0 0.2 1.4 1.9 Sweet Potato 0.0 0.0 0.0 0.0 0.0 Ginger 1.8 2.0 0.1 0.6 0.9 Turmeric 0.8 0.0 0.0 0.3 0.4 Coconut 794.5 50.0 49.2 230.6 529.4 Arecanut 24.1 0.0 1.0 8.4 11.3 Cashew 21.7 0.0 0.9 7.6 10.2

85
Pepper 24.7 0.0 1.0 8.6 11.6 Jack 91.7 5.0 3.8 31.9 43.1 Mango tree 90.4 5.0 3.7 31.4 42.5 Tamarind 7.9 0.0 0.3 2.7 3.7 Cloves 0.8 0.0 0.0 0.3 0.4 Nutmeg 33.6 0.0 1.4 11.7 15.8 Cocoa 18.4 0.0 0.8 6.4 8.6 Papaya 24.6 0.0 1.0 8.6 11.6 Banana 36.7 0.0 1.5 12.8 17.3 Pineapple 0.9 1.9 0.0 0.0 0.0 Plantain 24.9 0.0 1.0 8.6 11.7 Green Manure Plants
51.7 0.0 2.1 18.0 24.3
Vanila 0.2 0.0 0.0 0.1 0.1 Teak 59.3 10.8 2.4 20.6 27.9 Medicinal Plants 0.6 0.0 0.0 0.2 0.3
Source: Primary Survey
4. 5 Plant Species in Micro Watersheds
The plants like fruit plants, oil crops, pulses etc seen in the micro watersheds in the project area are shown in Table 4.4.
Table 4.4: Plant Species in Micro Watersheds
Crop type Vernacular name Common name Scientific name Tuber Crops
Kappa/Maracheeni Tapioca Manihot esculenta Chena Elephant yam Amorphophallus
companulatus Kachil Yam Dioscorea alata
Vegetable Padavalanga Snake gourd Trichosanthes

86
Crops cucumerina Vellarikka Cucumber melon Cucumis sativus Kumbalanga Ash gourd Benincasa hispida Vazhuthananga Brinjal Solanum
melongena Thakkali Tomato Solanum
lycopersicum Pachamulaku Chilli Capsicum annuum Cheera Amaranthus Amaranthus viridis Achinga Long bean Vina unguiculata Pavakka Bitter gourd Momordica
charantia Kovakka Little gourd Coccinea indica Mathanga Pumpkin Cucurbita moschata Churakka Bottle gourd Lagenaria siceraria Vendakka Okra/Lady’s
finger Abelmoschus esculentus
Kudampuli Garacenia Garcinia gummi-gutta
Valanpuli Tamarind Tamarindus indicus Kariveppila Curry leaf Murayya koenigii Irumbampuli Bilimbi Averrhoa bilimbi
Fruit Crops Vazhapazham Banana Musa paradisiacal. M.sapiendum
Manga Mango Mangifera indica Chakka Jack fruit Artocarpus
heterophyllus Anjilichakka Anjili Artocarpus hirsutus Omakka Papaya Carica papaya Kaithachakka Pineapple Ananas comosus

87
Perakka Guava Psidium guajava Sapota Sapota Achras sapota Rambutan Rambutan Nephelium
lappaceum Chambanga Water apple Syzgium aqueum Kashumavu Cashew Anacardium
occidentale Oil Crops Thengu Coconut Cocos nucifera
Ellu Seasame Sesamum indicum Nilakkadala Ground nut Arachis hypogea
Spices and Condiments
Manjal Turmeric Curcuma longa Inchi Ginger Zingiber officinale Kurumulaku Pepper Piper nigrum Jathikka Nutmeg Myristica fragrans
Plantation Crops
Rubber Rubber Heva brasiliensis
Kasumavu Cashew Anarcadium occidentale
Karimbu Sugar cane Saccharum officinarum
Kavungu Arecanut Areca catchu
The different medicinal plants seen in the micro watersheds in the project area are shown in Table 4.5.
Table 4.5: Medicinal Plants in Micro Watersheds
Vernacular name Scientific name Karuka Cynodon dactylon Kudumpuli Garcinia gummi gutta

88
Mylanchi Lawsonia inermis Karivepu Murraya koenigii Thulasi Ocimum sanctum Keezharnelli Phyllanthus Cheroola Aerva lanata Shankupushpam Clirtoria ternatea Iruveli Coleus amboinicus Panikoorkka Coleus zeylanicus Benth
Nilappana Curculigo orchioides Gaertn
Manjal Curcuma longa Muthanga Cyperus rotundus. Asokam Saraca asoca Kallurukki Scoparia dulsis Kurumthotti Sida rhombifolia Adakkamaniyan Sphaeranthus indcus Kanjiram Strychnos nux-vumica
Valanpuli Tamaridus indica

89
CHAPTER V PROBLEMS TO BE ADDRESSED
The treatment in a watershed depends on the specific problems faced by the area. The five micro watersheds in the project area face many common problems because of the similarities existing among the micro watersheds. In order to ensure that the benefits of the project reaches different sections of the population, particularly the vulnerable, the involvement of the community is essential right from the planning the project. The participation of the community, particularly the vulnerable sections of the society such as those living below poverty line, small and marginal farmers, women, landless families, SC/ST communities have been ensured in the identification of the problems. The major problems identified through PRA techniques in the IWMP II/2012-13 project are given below:
1. Acute drinking water shortage. 2. Vachals/Thodu filled with silt resulting in water logging. 3. Flood damage due to improper drainage. 4. Waste dumping into the water bodies. 5. Acidity of the soil and lack of reclamation practices. 6. Water bodies filled with water hyacinth. 7. Keeping paddy fields fallow. 8. Lack of conservation measures for agricultural and non-agricultural lands. 9. Insufficient milk production. 10. Lack of livelihood opportunities. 11. Other environmental issues

90
Recalling the ship wrecked sailors, water as far as up to the horizon, but not a single drop to drink. Inspite of having a large number of water bodies, many households of Nedumbram, Peringara, Kadapra, Niranam and Kuttoor faces difficulties to fetch a pot of drinking water. The yellow coloured water from open wells in summer, contaminated water due to flood in rainy season, irregular supply of drinking water of water authority are the major problems related to the availability of drinking water.
The main drinking water sources of the project area are open wells and piped water. The households mainly depend on open wells for drinking and domestic purposes. The project area is prone to flooding except the Parumala watershed. During flood, many of the latrines in the project area overflow due to the rise in water table, which in turn results in the contamination of open wells and water bodies. Immediately after the rainy season, the water table goes down up to 8 meters below ground level. In 2013, despite good rainfall, acute drinking water scarcity was a problem for the region due to unscientific infrastructure projects
that block canals and flood-escape routes.
During summer season, the water in many wells is seen to be yellow in color due to the presence of silt and iron. Uncontrolled sand mining from Pamba and Manimala rivers resulted in drastic reduction of water table in the five micro watersheds. It compels the people to dig wells deeper. They still get turbid water.
The situation is worsened due to unhealthy practices of the watershed community such as depositing plastic wastes in water bodies. It necessitates a strong campaign for preserving precious water. To ensure availability of safe drinking water, the following interventions are suggested;
1. Providing roof top rain water harvesting ferrocement tanks to the community. The excess water from the harvesting tank can be diverted to nearby well. 2. Renovation of public wells. 3. Open well recharging from roof top. 4. Installallation of Reverse Osmosis Plant in highly polluted areas. 5. Providing Terrafil water filters to individual households.
91
The micro watersheds in the project area are endowed with several canals and channels. The canals have become dumping grounds for garbage in certain areas. In some places, the waste from the sewage pipes is dumped into the water bodies. Water logging due to poor drainage is another major problem reported in all the micro watersheds. Water logged areas becomes a habitation ground of mosquitoes. Silting, due to inadequate protection of the side walls, of the canals also adds to the gravity of the problem. Improper drainage affects environment and agriculture in the area. Desilting and increasing depth of canals and vachals will help to hold more rain water. Vachal is a suitable ecosystem for fish. While the removal of waste can be undertaken under MGNREGS, the activities related to side protection such as constructing side walls, planting vettiver, mangroves etc can be undertaken under the IWMP. Water flow can be improved by renovating the existing drainages which will ensure connectivity between channels and canals. Some of the canals and channels are blocked by the unscientific construction of roads and foot paths without culverts. It leads to water logging and flood. So construction of culverts has been suggested as an activity under the project.
One of the major agricultural crops in all the micro watersheds is paddy. The livelihood of a good number of households depends on the income from paddy farming. The low productivity and profitability of paddy farming has been a major problem faced by the area. Due to low profitability, many households have shifted to other jobs. We have also noticed that some of the paddy fields are being converted or kept uncultivated.
For paddy farming, water is to be pumped out of the fields prior to sowing. So strong outer bunds, around the field are inevitable to reduce the expenses for maintenance. These bunds can also be used as footpaths. Construction and strengthening of outer bunds for the paddy fields will improve the productivity and profitability of paddy cultivation in the project area. Hence, this activity has been proposed under the project. The dewatering of paddy fields necessitates the availability of motor, motor sheds, petti and para and electricity. Another aspect that leads to low profitability of paddy farming is the shortage of agriculture labourers. Soil of paddy fields have high acidity. So application of lime is essential to improve productivity.
Soil erosion from the homestead (ridges) to low lying areas is another problem noticed in the project area. Erosion decreases the productivity of the soil. So biofencing by local vegetation is proposed.
92
People having more than one cattle can be provided with biogas plants to make sure that the waste is not drained to the water bodies.
Proliferation of water hyacinthin the water bodies is another major problem in the project area. Ponds and canals are filled with these weeds. Removal of this can be converged with MGNREGA.
Lack of livelihood opportunities for the poor is another problem. In order to improve the livelihood opportunities of the population, the following interventions are proposed:
Fisheries, duck farming, back yard poultry, cow/buffalo/goat rearing etc are suggested. Individuals and groups can be involved in this activity. Convergence is possible with the projects of the Department of Fisheries and animal husbandry.
Land scarcity is a major barrier for horticulture development in the project area. So plants can be grown in plastic bags by filling soil and organic manure. These can be placed both in homestead and on the terrace of houses. The programme can be converged with the schemes of Vegetable and Fruit Promotional Council and the Department of Agriculture or RKVY.
Other livelihood improvement options include floriculture, fodder cultivation, construction of cattle shed, production of different eco-friendly products, ornamental fish farming and lease farming.

93
CHAPTER VI
WATERSHED INTERVENTIONS 6.1 Introduction
The major objective of Integrated Watershed Management Programme (IWMP) is to restore the ecological balance by harnessing, conserving and developing degraded natural resources such as soil, vegetative cover and water. The watershed approach would result in improving the productivity of not only agriculture but also the overall production of bio-mass for enhancement of self-employment opportunities and thus the overall income of the rural households. Based on the problems identified through participatory methods and the inputs from several rounds of discussions with stakeholders including experts, suitable interventions for watershed development of the project area have been identified. The specific interventions under IWMP are broadly classified into Information, Education & Communication (IEC) Activities, Entry Point Activities (EPA), Natural Resource Management (NRM), Production System and Microenterprises (PSM) and Livelihood Activities.
6.2 Information, Education & Communication (IEC) Activities
Information, Education and Communication (IEC) is an important component and it has a vital role in creating awareness, mobilizing people and lays the basis for successful implementation of IWMP.
6.3 Entry Point Activities (EPA)
Entry point activities aim to mobilize the community in support of the subsequent interventions under the project. EPA helps to create rapport with the watershed community. Entry point activities are identified with a view to showcase them as model interventions which, in turn, would generate the interest of the community in watershed development activities. Community participation is essential to maximize the impact of the project and to ensure the sustainability of the project outcomes. Entry point activities identified in the project area are presented below:
(a). Portable Biogas plant of capacity 3m3
94
Biogas/Biomethanation technology refers to the production of a combustible gas (biogas) and value added fertiliser (slurry) by the anaerobic fermentation of organic materials under certain controlled conditions of temperature, pH, C/N ratio. In the context of global warming the conversion of methane gas to CO2 is important. The manure produced through a biogas unit has a comparative adavantage over ordinary manure in terms of both quantity and quality. It is rich in plant nutrients. The slurry improves soil fertility and therefore, increases crop yield.
Two plants are proposed, one in St. Mary’s High School, Niranam and another in Devaswom Board High School, Kadapra.
Maintenance is proposed to be entrusted with the user group. The gas and slurry produced by the biogas plant can be used by the UGs.
(b). Construction of Roof top Rainwater Harvesting Ferrocement Tanks
Availability of safe drinking water is a major problem in the project area. To improve the availability of safe drinking water, roof water harvesting proposed. Here the water from the roof top is made to flow through a natural filter media and is then collected in ferrocement tanks for domestic use.
(c). Reverse Osmosis Plant
Reverse Osmosis (RO) is a proven technology that is used to remove large majority of contaminants from water by pushing the water under pressure through a semi-permeable membrane. It is capable of removing more than 99% of the dissolved salts (ions), particles, colloids, organics, bacteria and pyrogens from the feed water. Reverse Osmosis is very effective in treating brackish, surface and ground water.
RO membranes requires cleaning atleast once in every year. If the normalized pressure drop or the normalised salt passage increases by 15% indicates the time for cleaning the membrane. The cleaning work can be entrusted to reputed service providers. The annual cleaning of membranes costs Rs. 5000 to 15000. Primary Health Centre located on western part of the Niranam Grama Panchayat faces acute drinking water shortage. This PHC is visited, on an average, by 100 patients everyday. But safe drinking water is not provided here even though it has an open well. The households near the PHC also face water shortage. A reverse osmosis plant in the PHC is proposed. Maintenance is to be entrusted with the local people and the hospital authority. An amount of Rs. 0.50 per litre

95
can be collected from the beneficiaries and the same can be used for annual maintenance (cleaning of membrane). A collection point has to be provided at the entrance of the hospital with a time frame of supply.
(d).Rain Water Harvesting Syringe for Sub Surface Ground Water Recharge
It’s a recharge or injection technique, directly to discharge water into water bearing zones. The roof water is stored in a tank is directed to the bore well. The water column exerts pressure and water will be spread in to the soil, pushing silt and other impurities backwards.The water is retained in the underground water column and this harvested water can be subsequently collected by simple piston pump or motor by constructing a tube well in the vicinity. 500 to 2500 litres of water can be drawn daily. The water thus harvested can be used for both drinking and minor irrigation.
(e). Renovation and Desiltation of dug out pond at Peringara
Renovation of dug out pond in Peringara High School is suggested to ensure continuous supply of safe drinking water in the school. Presently the pond is a dumping place of plastic wastes and bottles.
(f). Organic Vegetable Garden
Vegetable production in the project area is declining due to unscientific and unsustainable practices of vegetable cultivation such as uncontrolled usage of fertilisers, pesticides and weedicides. Hence a model vegetable garden is proposed at the Government High School Peringara.
To summarize, the entry point activities identified in the project area are presented in Table 6.2.
Table 6.1: Entry Point Activities – Location and Estimate
Rain Water Harvesting Tank (Capacity 50000 L) Sl.No.
Location Panchayat Ward No
Amount Persons/Families Benefitte
Area Benefitted
Total Amount (in lakhs)
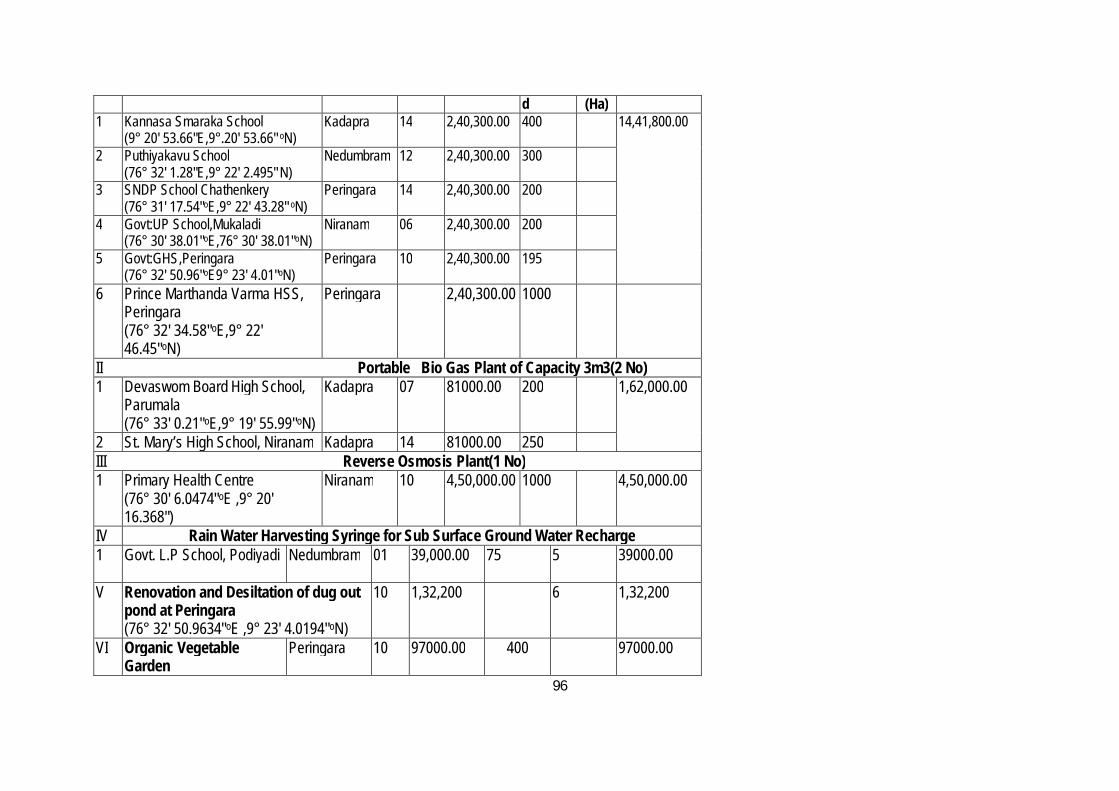
96
d (Ha) 1 Kannasa Smaraka School
(9° 20' 53.66"E,9°.20' 53.66" oN) Kadapra 14 2,40,300.00 400 14,41,800.00
2 Puthiyakavu School (76° 32' 1.28"E,9° 22' 2.495" N)
Nedumbram 12 2,40,300.00 300
3 SNDP School Chathenkery (76° 31' 17.54"oE,9° 22' 43.28" oN)
Peringara 14 2,40,300.00 200
4 Govt:UP School,Mukaladi (76° 30' 38.01"oE,76° 30' 38.01"oN)
Niranam 06 2,40,300.00 200
5 Govt:GHS,Peringara (76° 32' 50.96"oE9° 23' 4.01"oN)
Peringara 10 2,40,300.00 195
6 Prince Marthanda Varma HSS, Peringara (76° 32' 34.58"oE,9° 22' 46.45"oN)
Peringara 2,40,300.00 1000
II Portable Bio Gas Plant of Capacity 3m3(2 No) 1 Devaswom Board High School,
Parumala (76° 33' 0.21"oE,9° 19' 55.99"oN)
Kadapra 07 81000.00 200 1,62,000.00
2 St. Mary’s High School, Niranam Kadapra 14 81000.00 250 III Reverse Osmosis Plant(1 No) 1 Primary Health Centre
(76° 30' 6.0474"oE ,9° 20' 16.368")
Niranam 10 4,50,000.00 1000 4,50,000.00
IV Rain Water Harvesting Syringe for Sub Surface Ground Water Recharge 1 Govt. L.P School, Podiyadi
Nedumbram 01 39,000.00 75 5 39000.00
V Renovation and Desiltation of dug out pond at Peringara (76° 32' 50.9634"oE ,9° 23' 4.0194"oN)
10 1,32,200 6 1,32,200
VI Organic Vegetable Garden
Peringara 10 97000.00 400 97000.00
97
6.4 Watershed Work Phase
The major activities in this phase are
i. Watershed Development Works or Natural Resource Management (NRM) ii. Livelihood Activities for the poor people iii. Production System and Microenterprises
The main watershed development interventions are as follows,
6.4.1 Watershed Development Works/Natural Resource Management (NRM) Activities
Natural resource management aims to maintain and improve natural resource base. People in the project area depend upon agriculture and allied activities. Management of natural resources helps to enhance livelihood of the local community on a sustainable basis. The main NRM activities identified for the project area are as follows: (a). Renovation of Outer Bund/Strengthening/Construction of Outer Bunds for Conservation Measures of Agricultural Land Strong outer bunds are prerequisite for successfull cultivation of paddy in the Padasekharams. Paddy fields in the project area are lying below or equal to the water level of
canals. So to avoid water intrusion, renovation/strengthening/construction of outer bund is proposed. The works undertaken are listed in the annual action plan. Some of the padasekharams in the project area are willing to start “Orunellum Orumeenum” programme expecting more profitability from the farm. This could be encouraged by providing financial support to raise the field bund to hold sufficient water. Tharkolil, Valavanari, Niranathuthadam, Vanjippuzhappallam Paddy field, and Manakeri Padasekharams are identified for this intevention. This could be converged with Kuttanad Package. (b). Vettiver/Fodder Grass Planting to Prevent Soil Erosion
(76° 32' 50.9634"oE ,9° 23' 4.0194"oN)
Total Amount 23,22,000.00
98
Soil erosion from bund and raised land is occurring due to high amount of precipitation during monsoon. The bunds bordering canals and paddy fields are having gentle slope. During precipitation, soil on bund will erode to the water bodies and to paddy fields. This erosion causes degradation of soil fertility. It can be prevented by suitable soil conservation interventions like planting vettiver or fodder grass along the bunds and slope.
(c). Desilting/Deepening/Formation/Interlinking of Channels (Vachals) Vachals are drainage channels in the padasekharams. These are used for irrigation as well as drainage of the padashekarams. In some padasekharams, vachals are being silted partially or completely, making the process of dewatering and irrigation insufficient. The proper management of vachals is required for water conservation irrigation and drainage. So desilting/deepening/formation/interlinking of drainage channels (Vachals) are suggested. This can be integrated with MGNREGA.
(d). Removal of Water Hyacinth from Canals
The canals are being filled with water hyacinth due to high eutrification. Low level of salinity, increased discharge of organic waste and fertilizer residues in water bodies are the main reasons for this. Aggressive growth of weeds is preventing the movement of ducks and is also affecting reproduction of fish. So removal of water hyacinth is suggested. It can be fully undertaken in MGNREGS. (e).Desilting, Widening and Deepening of Canals for Conservation of Irrigation and Drainage
The project area has a number of canals around the padasekarams. Long back, they were used to transport agricultural produce to distant markets. Presently, most of the canals are filled with water hyacinth, waste and silt. Removal of silt will increase the water storage capacity of the canal and will, therefore, help to hold more water during flood. It will also be helpful to improve the quality of water in wells and ponds. (f).Box Culverts and Shutter for the Management of Flood
Project area has a number of criss crossing water channels and these are being blocked due to unscientific construction of roads and foot paths without culverts. It leads to water logging and flood. So sufficient box culverts have to be constructed to avoid water logging. Regulation of water flow from the canals
99
and paddy fields are controlled by shutters. There is shortage of shutters in some of the paddy fields in the project area. So shutters are suggested in these padasekharams. (g). Agro forestry at Home Stead/Bund Sides
The garden land (home stead) and raised bunds of paddy fields are occupied by a variety of plants adn trees. Even though the vegetative cover in the area is thick, further enhancement can be done by providing demand based supply of seedlings without compromising the natural habitat . So, seeds of fruit trees, cash crops, and other varieties of plants can be distributed among households free of cost.
(h). Strengthening of inner bunds of paddy fields Inner bunds of paddy fields help in reducing soil erosion. At present, some of the inner bunds in Padasekharams are not maintained properly. Strengthening of inner bunds can be undertaken in MGNREGS. (i).Renovation/Desilting of Dugout Ponds (Embankment & Side Wall Protection) Ponds are considered as one of the important freshwater habitats and are useful for surface runoff harvesting and ground water recharging. It has an important role in maintaining the biodiversity of the area. Ponds in the project area are not maintained well. In the past, there were ponds in many homesteads. But later it got filled. Most of the public ponds are also facing degradation due to lack of proper maintenance. Silting and over growth of water hyacinth are the major problems. So removal of water hyacinth, desiltation and side wall protection is proposed. Removal of water hyacinth can be converged with MGNREGS. (j). Rooftop Rainwater Harvesting Ferrocement Tanks Project area faces acute drinking water shortage. Most people use traditional water harvesting technique by using a clean cloth or clean plastic sheet for collection of water. At present, they can store water only for a few days. Large storage facility is essential to conserve water. One option to improve drinking water availability is to make use of water harvesting technique.The process involves collecting rainwater from roof catchments, passing it through the natural filter media and storing it in ferrocement tanks for drinking and other domestic purposes. So it is suggested that ferrocemnent tank may be allotted to households and installed in public places.
100
(k).Open Well Recharging from Roof tops for Ground Water Recharge
Drinking water shortage due to turbidity of the water can be sorted to some extent through recharging from roof top. The process involves collection of rain water from the roof top and diverting directly to the well through a filter medium. Entry of rain water into the well results in a rise in water column. It will exert pressure and infiltrate into ground water
(l)Floating Drum Portable Biogas Plant
Improper waste management practices such as dumping waste in the water bodies and public places is an important problem identified through PRA. To solve this problem, it is suggested that floating drum portable biogas plants may be provided to households in the project area. The portable biogas technlology has the following advantages.
Requires only kitchen waste and other biodegradable wastes from surroundings.
Requires less space
Portable nature.
High gas production.
Cheap and economical.
Solution to biodegradable waste management.
Ecofriendly approach.
A 1m3 litre plant will provide approximately 2.5 hours of cooking gas and the slurry coming out of the plant is a good bio-manure. (m). Terrafil Water Filter
101
Project area is experiencing acute drinking water shortage due to high presence of iron and turbidity. So a low cost device, ‘Household Terrafil Water Filter’ (30 litre capacity), developed by CIPET Bhuvaneswar is suggested. TERAFIL is a low cost burnt red clay porous media (disc/candle), used for filtration & treatment of turbid raw water into clean drinking water for domestic/ community applications. Suspended particles, sediment, iron & many heavy metals, micro-organism, are separated from raw water effectively during filtration, without clogging the core of the TERAFIL. It can be fixed with any container for purification of water. Quality of product water is within BIS limits, especially for turbidity, iron & micro-organisms. Cost of purification is within Rs.2/- per ton of product water, considering total cost of plant. It operates without electricityAverage life of TERAFIL media is five years.
(n) Construction of Ramp for Land Management
Mechanised agriculture is common in the project area due to shortage of agriculture labourers. Presently, farmers are spending large amounts of money and man power to bring these machines to the fields. To avoid this burden, construction of ramp is proposed in suitable places.
(o) Well Renovation
There are a large number of public wells in the project area and most of them are being utilised by the people. But due to improper maintenance a number of them are unhygienic. It is suggested that some of the public wells are renovate to make them usable.
(p) Construction of New Well
Western end of the Niranam gram panchayat is facing acute drinking water shortage due to water contamination. Households in the area are located in very small land holdings from 3 cents to 5 cents. Every household in the area is having own toilet and they have no space for digging a new well at a safe distance from the toilet pit. About 50 families in the area and a health centre located in the area are fetching water from distant places. So digging a new well at the health centre is proposed. A reverse osmosis plant is also necessary to improve availability of safe drinking water. User group can collect Rs. 0.50 per litre for future maintenance.
6.6 Production System and Microenterprises
102
According to the Common Guidelines for Watershed Development Projects (2008), 10 per cent of the total project cost is to be assigned to support the production system and micro enterprises. This component aims to: (a). promote diversified production/farming system based livelihood activities/ interventions (b). encourage farmers to adopt and upscale successful experiences of proven technologies, integrated farming systems and improved farming practices for livelihood augmentation.
The activities / interventions planned under this component are:
Fodder Cultivation: Promotion of fodder cultivation is important to reduce the production cost of milk and making cattle rearing profitable. Financial assistance of Rs. 550/Unit (10 cents) to farmers can be given through diary co-operative societies/ SHGs for grass cultivation
Liming for Reclamation of the Acidity of Soil
Due to acidity in soil, farmers spend a large amount to stabilize the pH value. Application of lime in soil helps to improve the soil quality. 700 – 1400 Kg of quick lime is recommended per hectare per year depending on the pH of the soil. Lease Farming:
Labours shortage has been a major problem faced by the farmers and it has led many farmers to keep the land fallow. By providing financial and technical support, the SHG members could start agriculture meaningfully.
Cage Fish Farming
Cage culture of fish is an innovative method to grow fish in a limited space. Fishes are raised commercially in cages. This method is easier for fish stock monitoring and harvesting. It can be converged with schemes of the Fisheries department.
103
Horticulture - Vegetable Cultivation:
Project area is located very near to Thiruvalla Municipality, which is a thickly populated town. Most of the people in the town and in the project area are depending on the supplies from Tamil Nadu for vegetable. At the same time, a large extent of land, which are suitable for agriculture production are being kept fallow. The situation can be changed by providing financial and technical support to interested farmers or to a group of farmers to bring their land under vegetable cultivation.
Nursery Formation of Fruit and Spices Plants:
Formation of a nursery is suggested to produce seedlings of various plants like coconut, spices, mango, jack, medicinal plants etc. It directly helps to improve the vegetative cover of the project area.
Paddy Straw Mushroom cultivation:
Due to good demand for mushroom and because of the abundant availability of the base material (Paddy straw) mushroom cultivation by farmers can be encouraged in the project area.
Distribution of 6 month old buffalo Calveby farmers:Since the project area has a large extent of paddy fields, animal husbandary has good scope.
6.7 Livelihood Support
The Common Guidelines for Watershed Development Projects (2008) gives priority to livelihood support for landless/asset less persons. Nine per cent of the total project cost is assigned to support the livelihood activities of landless/asset less households. This aims to maximize the utilization of potential generated by watershed activities and in creating sustainable livelihoods for households within the watershed area.
104
The guiding principles for livelihood improvement initiatives are:
1. Livelihood improvement initiatives emphasize on natural resource based activities and conform to principles of equity, gender sensitivity and transparency. It strives to:-
a) Enhance livelihood opportunities for the poor through investment into asset creation and improvement in productivity and income. b) Improve access of the marginalized communities including SC/ST, landless/ asset less people, women etc to the benefits. c) Select the beneficiaries in a transparent manner.
2. Livelihood initiatives for landless/asset less households should aim at improved household income, participation and division of labour, access to information, knowledge, appropriate technologies and resources.
The activities/interventions related to livelihood improvement suggested for the project area are as follows:
Ornamental fish farming: Can be promoted among Kudumbasree groups and individuals. Rearing of ornamental fishes can be taken up in fresh water ponds, agrifilm ponds, canals, etc with the help of enterprises which are ready to buy the products.
Vegetable Retail Shop: Vegetable retail shops along the state highways or main junctions are proposed.
Goat/Poultry/Duckery Rearing: Groups of landless and poor households can be assisted to start purchase Goat/Poultry/Duckery.
Units for food processing: There is some potential for starting food processing units on a small scale. Locally available rice can be powdered and dry roasted to make it suitable for cooking appam, puttu, dosa etc. If powdered in the traditional way, it can add value to the product.
Book binding units : Project area is very close to Thiruvalla municipality and a number or government offices and educational institutions are there. Binding of books and project reports have a good scope from these offices. SHG Federations can start such units.
105
Garment Unit: Spending on clothing by Malayalees have changed significantly over the years. There is an increase in demand for ready made clothing. To capitalise on this demand, garment making units suggested in the project area. Apart from making ready made garment, the units can also cater to the local demand for stitiching clothes
6.8 Sustainable Management Practices for Watershed Area
Micro watershed management involves integrating people, land and water. Management practices aims at long term well being of the local community. Following are some of the micro watershed management practices suggested for the project area:
a. Regular maintenance of ponds, wells and drainages b. Prevent dumping of waste into water bodies. c. Keep the drainages waste free. d. Manage waste in home by using compost pits, bio gas plants etc. e. Reuse the plastic items. f. Install and maintain rain water harvesting structures and harvest maximum rain water using filtered tanks. g. Regularly clean the rain water harvesting structures to ensure purity of drinking water. Also ensure that stored rain water is not contaminated. h. Undertake vegetable cultivation/horticulture in yard or terrace using sacks and polythene covers. i. Plant trees and preserve existing trees and shrubs to prevent soil erosion. j. Do not spray pesticides indiscriminately. k. Prevent over grazing by domestic animals (like goats, cows etc).

106
CHAPTER VII DETAILED ACTION PLAN
7.1 Annual Action Plan
Table No. 7.1: Annual Action Plan - Instituition & Capacity Building (Lakhs)
I Instituition building 1.25 II Information, Education & Communication (IEC) Activities in the Project Area 9.338 III
Capacity Building
Programme
Year 1 Year 2 Year 3 Year 4 Total
Phy sical
Fina ncial
Phy sical
Fina ncial
Phy sical
Fina ncial
Phy sical
Fina ncial
Phy sical
Fina ncial
1
Empowering Elected Representatives for IWMP 2 0.144 2 0.144 1 0.072 5 0.360
2
Training Programme on IWMP 8 1.20 8 1.20 8 1.20 0 24 3.60
3
Training Programme for Watershed Committee Members 14 0.84 14 0.84 7 0.42 7 0.42 42 2.52
4
Training Programme for User Groups 10 0.60 10 0.60 10 0.60 4 0.22 34 2.02
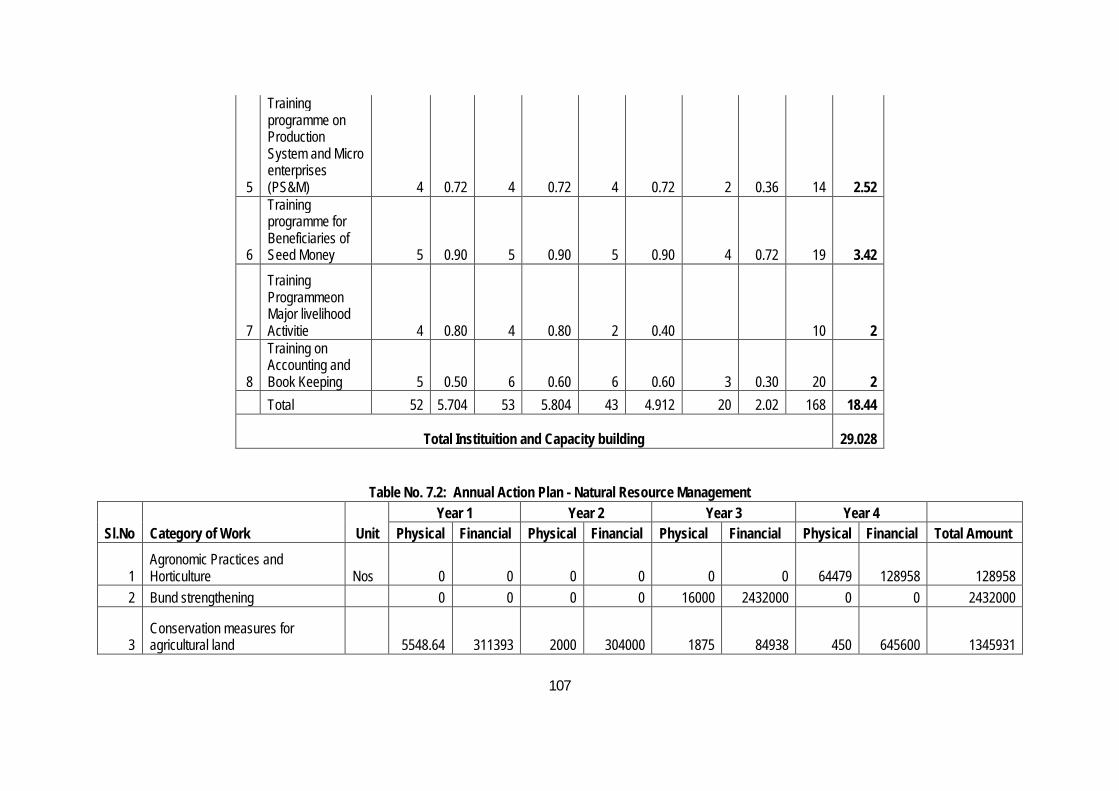
107
5
Training programme on Production System and Micro enterprises (PS&M) 4 0.72 4 0.72 4 0.72 2 0.36 14 2.52
6
Training programme for Beneficiaries of Seed Money 5 0.90 5 0.90 5 0.90 4 0.72 19 3.42
7
Training Programmeon Major livelihood Activitie 4 0.80 4 0.80 2 0.40 10 2
8
Training on Accounting and Book Keeping 5 0.50 6 0.60 6 0.60 3 0.30 20 2
Total 52 5.704 53 5.804 43 4.912 20 2.02 168 18.44
Total Instituition and Capacity building 29.028
Table No. 7.2: Annual Action Plan - Natural Resource Management Sl.No Category of Work
Unit
Year 1 Year 2 Year 3 Year 4 Physical Financial Physical Financial Physical Financial Physical Financial Total Amount
1 Agronomic Practices and Horticulture Nos 0 0 0 0 0 0 64479 128958 128958
2 Bund strengthening
0 0 0 0 16000 2432000 0 0 2432000
3 Conservation measures for agricultural land
5548.64 311393 2000 304000 1875 84938 450 645600 1345931

108
4 Drinking water purifier
951 713250 0 0 452 339000 105 78750 1131000
5 Flood control/Irrigation
2 837253 0 0 6 1774432 11 386584 2998269
6 Ground water recharging
267 1068000 270 1080000 831 3324000 269 1076000 6548000
7 Household wastemanagement
5 85000 141 2397000 57 1033000 0 0 3515000
8
Land management for the passage of agricultural implements from one part to other
3 177204 1 42715 1 42715 0 0 262634
9 Management programme for conservaton irrigation and drainage
5444.84 827615 27012 4105824 21839.48 3319601 4508.98 685412 8938452
10 Management programme for drainage
1425.7 216706 0 0 0 0 0 0 216706
11 Recharge/Storage/Extraction of water from/to ground water
16 326057 19 544899 14 216636 21 324954 1412546
12 Surface runoff water harvesting and ground water recharging
3924 1316448 608 92416 900 136800 600 91200 1636864
13 Water harvesting structure
4 276000 29 805000 0 0 5 345000 1426000
14 Drainageline Treatment
100000 0 1 69000 0 0 100000 0 69000
15 Drinking water purification Plant
1 450000 0 0 0 0 0 0 450000 Total 6604926
9440854
12703122
3762458 32511360
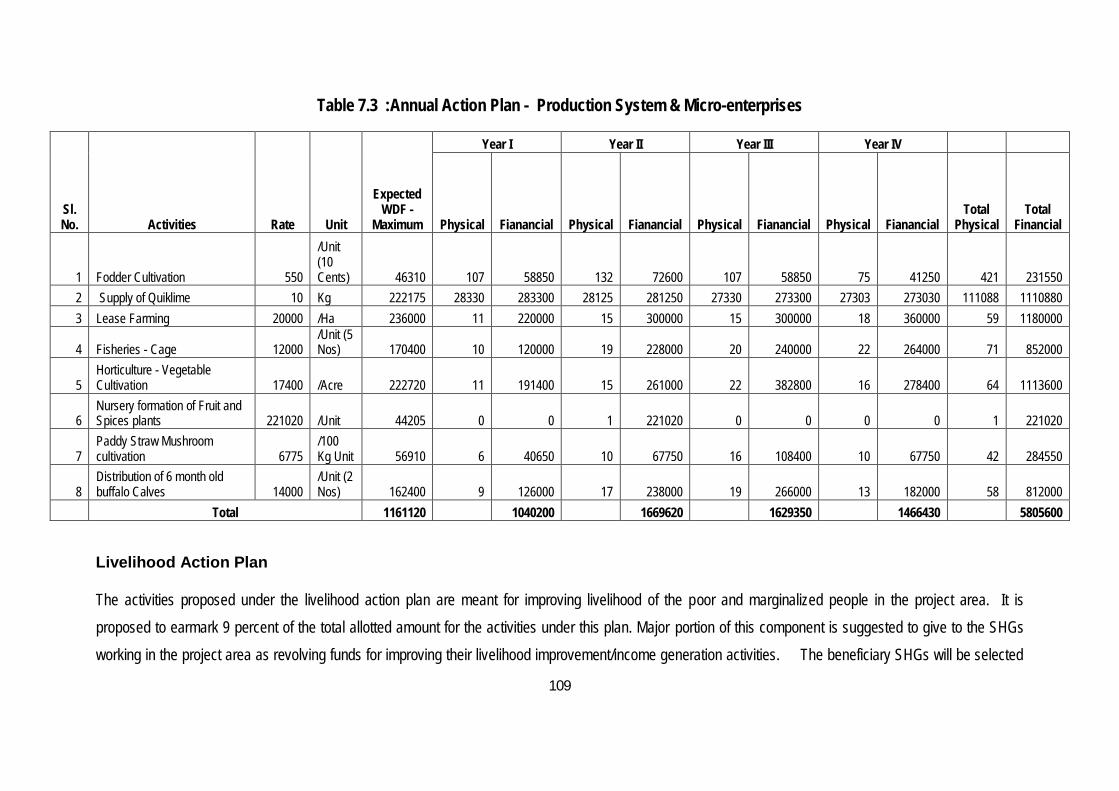
109
Table 7.3 :Annual Action Plan - Production System & Micro-enterprises
Sl. No. Activities Rate Unit
Expected WDF -
Maximum
Year I Year II Year III Year IV
Physical Fianancial Physical Fianancial Physical Fianancial Physical Fianancial Total
Physical Total
Financial
1 Fodder Cultivation 550
/Unit (10 Cents) 46310 107 58850 132 72600 107 58850 75 41250 421 231550
2 Supply of Quiklime 10 Kg 222175 28330 283300 28125 281250 27330 273300 27303 273030 111088 1110880 3 Lease Farming 20000 /Ha 236000 11 220000 15 300000 15 300000 18 360000 59 1180000
4 Fisheries - Cage 12000 /Unit (5 Nos) 170400 10 120000 19 228000 20 240000 22 264000 71 852000
5 Horticulture - Vegetable Cultivation 17400 /Acre 222720 11 191400 15 261000 22 382800 16 278400 64 1113600
6 Nursery formation of Fruit and Spices plants 221020 /Unit 44205 0 0 1 221020 0 0 0 0 1 221020
7 Paddy Straw Mushroom cultivation 6775
/100 Kg Unit 56910 6 40650 10 67750 16 108400 10 67750 42 284550
8 Distribution of 6 month old buffalo Calves 14000
/Unit (2 Nos) 162400 9 126000 17 238000 19 266000 13 182000 58 812000
Total 1161120 1040200 1669620 1629350 1466430 5805600
Livelihood Action Plan
The activities proposed under the livelihood action plan are meant for improving livelihood of the poor and marginalized people in the project area. It is proposed to earmark 9 percent of the total allotted amount for the activities under this plan. Major portion of this component is suggested to give to the SHGs working in the project area as revolving funds for improving their livelihood improvement/income generation activities. The beneficiary SHGs will be selected
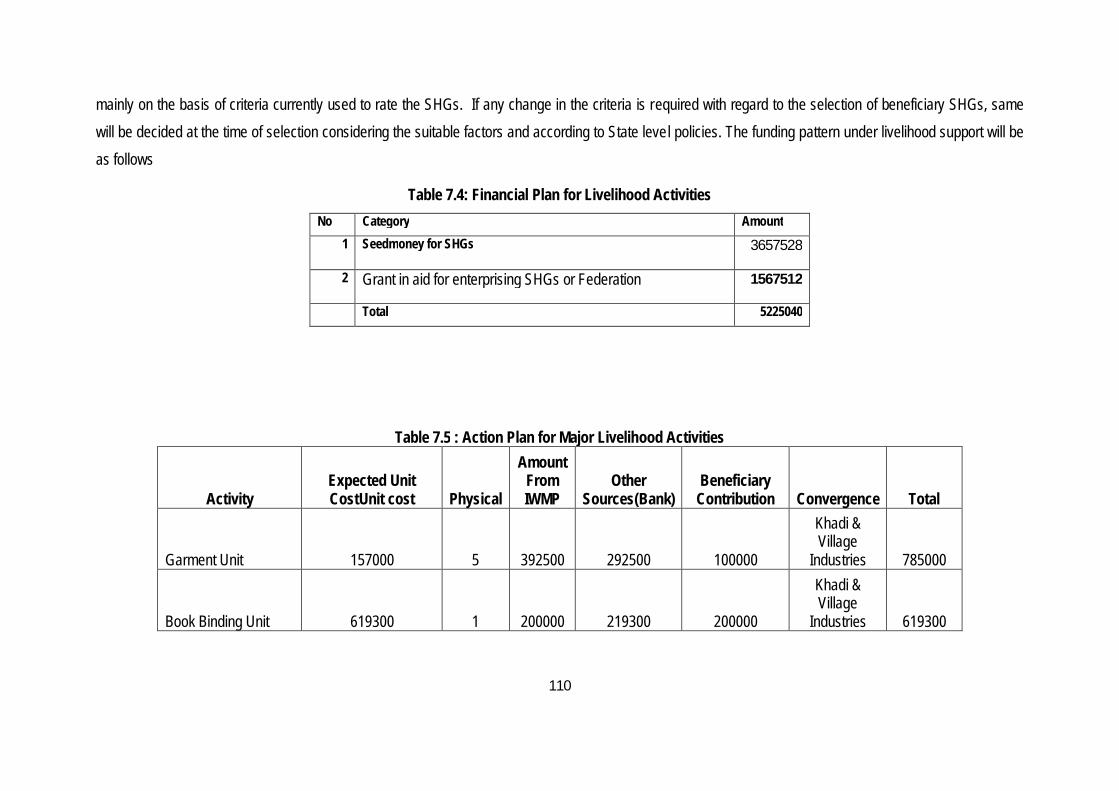
110
mainly on the basis of criteria currently used to rate the SHGs. If any change in the criteria is required with regard to the selection of beneficiary SHGs, same will be decided at the time of selection considering the suitable factors and according to State level policies. The funding pattern under livelihood support will be as follows
Table 7.4: Financial Plan for Livelihood Activities No Category Amount
1 Seedmoney for SHGs 3657528
2 Grant in aid for enterprising SHGs or Federation 1567512
Total 5225040
Table 7.5 : Action Plan for Major Livelihood Activities
Activity Expected Unit CostUnit cost Physical
Amount From IWMP
Other Sources(Bank)
Beneficiary Contribution Convergence Total
Garment Unit 157000 5 392500 292500 100000
Khadi & Village
Industries 785000
Book Binding Unit 619300 1 200000 219300 200000
Khadi & Village
Industries 619300
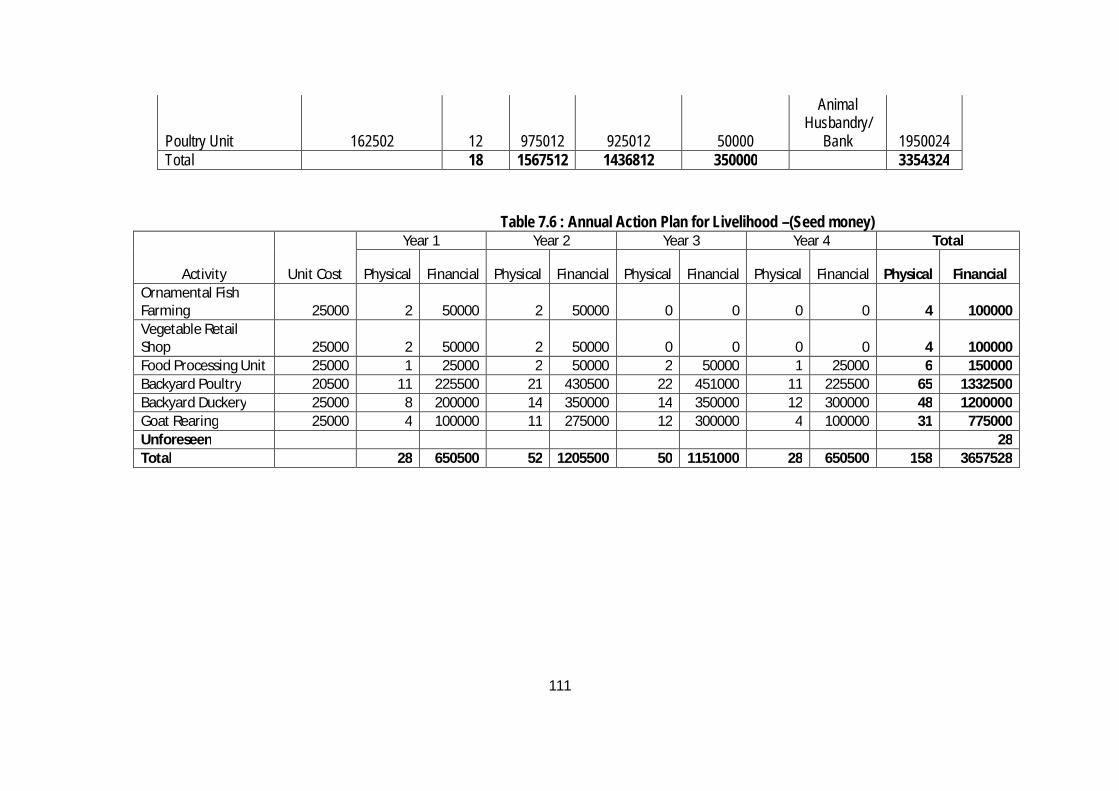
111
Poultry Unit 162502 12 975012 925012 50000
Animal Husbandry/
Bank 1950024 Total
18 1567512 1436812 350000
3354324
Table 7.6 : Annual Action Plan for Livelihood –(Seed money)
Activity Unit Cost
Year 1 Year 2 Year 3 Year 4 Total
Physical Financial Physical Financial Physical Financial Physical Financial Physical Financial Ornamental Fish Farming 25000 2 50000 2 50000 0 0 0 0 4 100000 Vegetable Retail Shop 25000 2 50000 2 50000 0 0 0 0 4 100000 Food Processing Unit 25000 1 25000 2 50000 2 50000 1 25000 6 150000 Backyard Poultry 20500 11 225500 21 430500 22 451000 11 225500 65 1332500 Backyard Duckery 25000 8 200000 14 350000 14 350000 12 300000 48 1200000 Goat Rearing 25000 4 100000 11 275000 12 300000 4 100000 31 775000 Unforeseen
28
Total 28 650500 52 1205500 50 1151000 28 650500 158 3657528
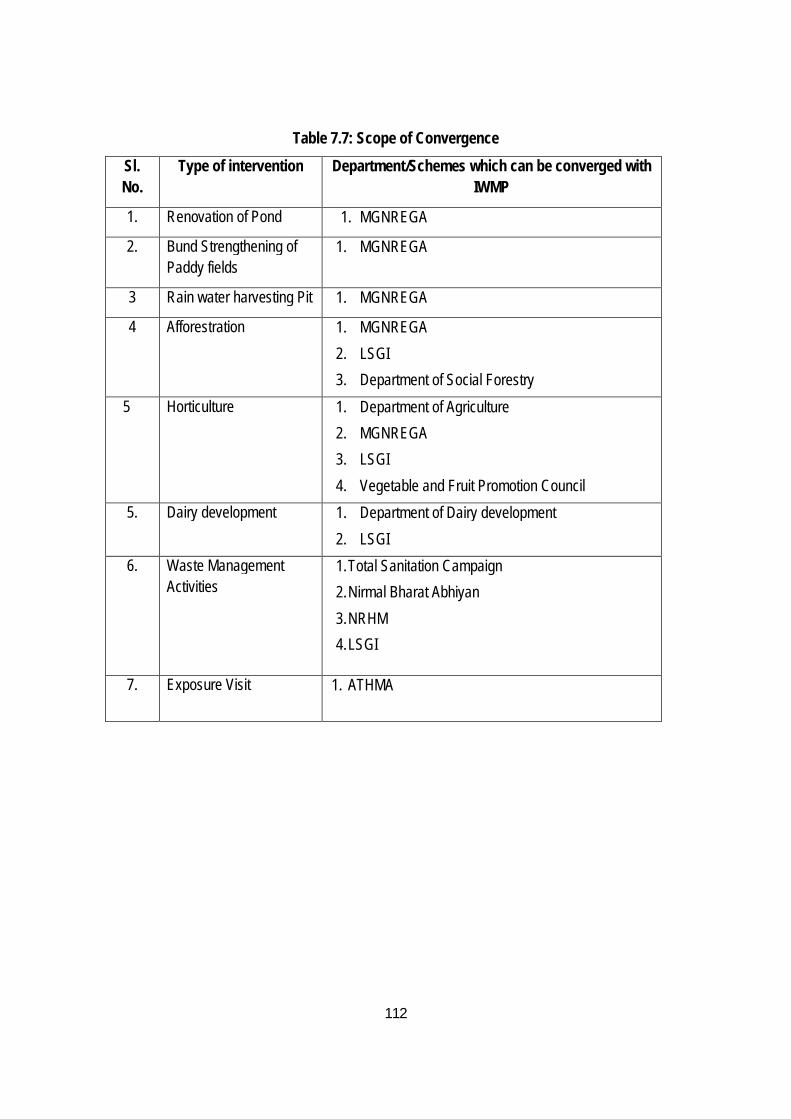
112
Table 7.7: Scope of Convergence Sl. No.
Type of intervention Department/Schemes which can be converged with IWMP
1. Renovation of Pond 1. MGNREGA
2. Bund Strengthening of Paddy fields
1. MGNREGA
3 Rain water harvesting Pit 1. MGNREGA
4 Afforestration 1. MGNREGA 2. LSGI 3. Department of Social Forestry
5 Horticulture 1. Department of Agriculture 2. MGNREGA 3. LSGI 4. Vegetable and Fruit Promotion Council
5. Dairy development 1. Department of Dairy development 2. LSGI
6. Waste Management Activities
1. Total Sanitation Campaign 2. Nirmal Bharat Abhiyan 3. NRHM 4. LSGI
7. Exposure Visit 1. ATHMA

113
CHAPTER VIII EXPECTED OUTCOMES
8.1 Expected Outcomes
The expected outcomes of the IWMP project are detailed below:
Table 8.1: Expected Outcomes Sl.No
Activity Target Group
Pre project period status Post project period Status
1 Renovation of irrigation canals/Ponds
Farmers Irrigation canals filled with sediment deposit
27 drainages are deepen resulting in the following benefits
Smoothen water flow
Expansion of area irrigated(1197 Ha)
Production enhancement(5%)
2 Construction of Culvert/Shutter/Ramp
Farmers Lack of adequate flood
control measures
Difficulty in movement of agricultural implements and machines
23 Nos of the Culvert/ Ramp/ Shutter will bring the following benefit:
Flood control (in 540 Ha)
Sufficient water availability (in 540 Ha)
Easy movement of agricultural implements and machines
3 Management of water resources
Watershed community
Inadequate water
Water resources are polluted
Recharging of 1658 open wells, desiltation of Pond (7184m3), Rainwater Harvesting Ferrocement Tank (30 Nos), and distribution of 2147 purification devices will ensure the following results:
Water availability in summer season (12
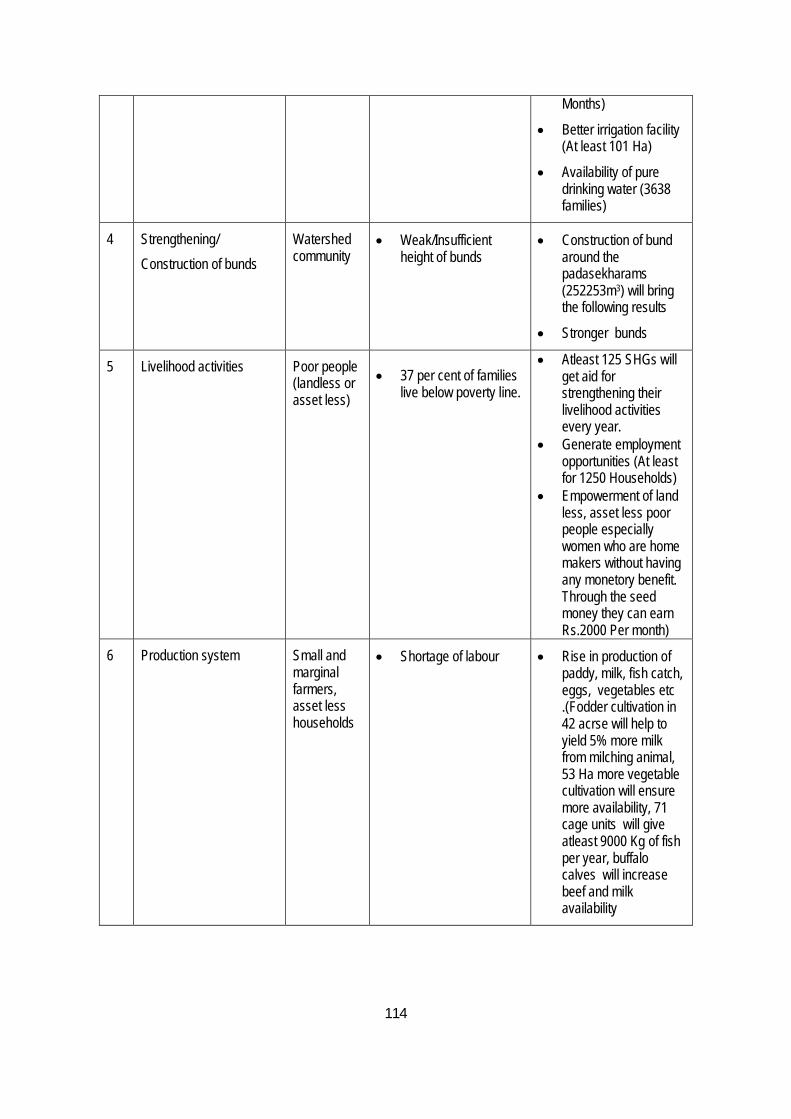
114
Months)
Better irrigation facility (At least 101 Ha)
Availability of pure drinking water (3638 families)
4 Strengthening/ Construction of bunds
Watershed community
Weak/Insufficient height of bunds
Construction of bund around the padasekharams (252253m3) will bring the following results
Stronger bunds
5 Livelihood activities Poor people (landless or asset less)
37 per cent of families live below poverty line.
Atleast 125 SHGs will get aid for strengthening their livelihood activities every year.
Generate employment opportunities (At least for 1250 Households)
Empowerment of land less, asset less poor people especially women who are home makers without having any monetory benefit. Through the seed money they can earn Rs.2000 Per month)
6 Production system Small and marginal farmers, asset less households
Shortage of labour Rise in production of paddy, milk, fish catch, eggs, vegetables etc .(Fodder cultivation in 42 acrse will help to yield 5% more milk from milching animal, 53 Ha more vegetable cultivation will ensure more availability, 71 cage units will give atleast 9000 Kg of fish per year, buffalo calves will increase beef and milk availability
115
CHAPTER IX WATERSHED DEVELOPMENT FUND & EXIT PROTOCOL
The main source of financial assistance for the post implementation period is Watershed Development Fund (WDF). One of the mandatory conditions for the selection of villages for watershed projects is people’s contribution towards WDF. The Contribution to WDF shall be a minimum 10 % of the cost of NRM works executed on private land only. However, in case of SC/ST, small and marginal farmers, the minimum contribution shall be 5 % of cost of NRM works executed on their land. These contributions would be acceptable either in cash at the time of execution of works or voluntary labour. A sum equivalent to the monetary value of the voluntary labour would be transferred from the watershed project account to the WDF bank account that will be distinct from the Watershed Committee (WC) bank account. User charges, sales proceeds and other contributions, disposal amounts of intermediate usufruct rights shall also be deposited in the WDF bank account. Income earned from assets created under the project on common property resources shall also be credited to WDF.
For other cost intensive farming system based livelihood activities/interventions such as Aquaculture, Horticulture, Agro-Forestry, Animal Husbandry etc. on private land directly benefiting the individual farmers, the contribution of farmers will be 20 percent for general category and 10 percent for SC/ST beneficiaries and the project funds will meet the cost of farming system activity to a maximum limit of an amount equal to double of the unit cost of the project for watershed development (i.e. Rs 12,000/15,000 per ha, as the case may be). Farmers’ contribution i.e. 20 percent for general category and 10 percent for SC/ST of this amount (i.e. a maximum of Rs 4800/6000 and Rs 2400/3000 as the case may be, respectively for general category and SC/ST beneficiaries) will go to WDF.
The Secretary, Watershed Committee (WC) shall maintain a completely separate account of the income and expenditure of the WDF. Rules for operation of the fund should be prepared by the Watershed Committee (WC) and ratified by the Gram Sabha. The WDF bank account should be operated by the President of the Gram Panchayat and any member from the SHG nominated by the Gram Sabha. Alternatively, the guidelines for the management and utilization of the WDF may be evolved by the concerned Nodal Ministry.

116
After completion of Phase II, at least 50% of the WDF funds shall be reserved for maintenance of assets created on community land or for common use under the project. Works taken up on private land shall not be eligible for repairing/ maintenance out of this Fund. The remaining money may be used as a revolving fund to advance loans to the villagers of the project area who have contributed to the fund. Individuals as well as charitable institutions should be encouraged to contribute generously to this Fund.

117
SUMMARY AND CONCLUSION
Pulikeezhu (IWMP 2) project is located in Pulikeezhu block in Thiruvalla Taluk of Pathanamthitta District. The project comprises of five micro-watersheds namely Ayyankonari (10P8a), Parumala (10P9a), Keecherivalkadavu (10P10a), Chathenkery Kadavu (11M19a) and Podiyadi Puthanthodu (11M20a). The project area is spread over five grama Panchayats of Pulikeezhu block namely Kadapra, Niranam, Peringara, Nedumbram and Kuttoor. There are 15203 households in the project area and the total population is 64033. The total project cost of the Pulikeezhu IWMP 2 project is Rs.580.53 lakhs.
Department of Local Self Government is the nodal department for the implementation of IWMP at the state level. State Level Nodal Agency (SLNA) is coordinating and providing guidelines for the effective planning and implementation of the individual IWMP projects. District Planning Committee (DPC) is responsible for the planning and implementation of the projects at the district level. To help the DPC and to coordinate the project level activities, Watershed Cell Cum Data Centre (WCDC) is working at the district level. The Pulikeezhu Block Panchayat is the Programme Implementing Agency (PIA) of the Pulikeezhu IWMP 2 project. A Block Level Coordination Committee (BLCC) has been formed for the timely implementation of the project and to provide help to the PIA in technical and administrative matters related to the project. Watershed Development Team (WDT) has been formed under the PIA. Centre for Socio-economic & Environmental Studies (CSES) is the Technical Support Organisation (TSO).
A cluster approach was followed in the preparation of DPR. The preparation of the DPR involved several rounds of discussions with elected representatives, officials and other stakeholders. A situational analysis was undertaken using secondary data and information collected from different sources. A baseline survey covering all the households in the project area was also conducted. A Logical Framework Analysis was done at the project level for identifying the important problems (through problem tree analysis) as well as for the purpose of assessing the present situation. Other PRA techniques like transect walk, social mapping, resource mapping, seasonal calendar, etc., were employed in each micro watershed area. GIS and remote sensing devices have been made use of in the preparation of DPR. Quantum GIS Software was used for the preparation of maps. 1:4000 scaled cadastral maps of each village formed the base map for planning. Depth interviews with officials,

118
farmers, fisher folk, entrepreneurs of micro-enterprises etc. were also undertaken. Field level verification of the identified interventions was undertaken by the DPR preparation team.
The five micro watersheds in the project area face many common problems because of the similarities existing among the micro watersheds. The major problems identified through PRA techniques which have led to the identification of the interventions to be undertaken under the IWMP project are drinking water shortage, canals filled with silt, waste dumping into the water bodies, flood during rainy season, water logging, weak bunds, acidity of the soil, water bodies filled with water hyacinth, fields reclaimed or kept uncultivated, shortage of agricultural labourers, unscientific construction of roads and foot paths, uncultivated paddy fields etc. The suggested interventions for the above mentioned problems are: (a) construction of ferrocement rain water harvesting tanks (b) maintenance of wells and ponds for the availability of fresh water (c) install reverse osmosis plant (d) installation of a water quality testing lab (e) de silting and increasing depth of canals and vachals to hold more water (f) planting vettiver, fodder grass etc for side protection (g) construction of culverts to prevent water logging and flood (h) construction and strengthening of outer bunds for the paddy fields to improve the productivity and profitability of paddy cultivation (i) install biogas plants (j) removing water hyacinth (k) improve livelihood opportunities by promoting pisciculture, horticulture, cage fishing, floriculture, fodder cultivation, supply of cow, goat, duck, chicks etc, training on production of different eco-friendly products etc. The scope for convergence with other schemes and programmes have been examined in identifying interventions under IWMP. The interventions under IWMP is expected to help in restoring the ecological balance of the project area, conserving the natural resources and in improving the livelihood opportunities of the people.
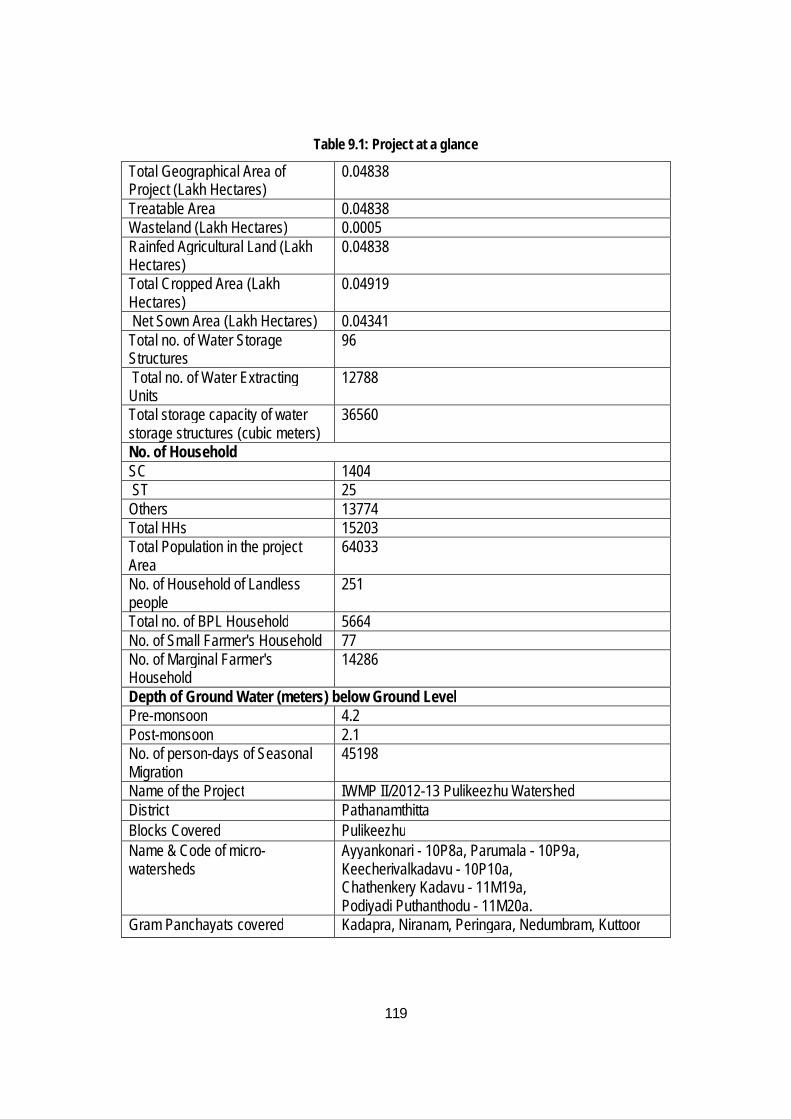
119
Table 9.1: Project at a glance
Total Geographical Area of Project (Lakh Hectares)
0.04838
Treatable Area 0.04838 Wasteland (Lakh Hectares) 0.0005 Rainfed Agricultural Land (Lakh Hectares)
0.04838
Total Cropped Area (Lakh Hectares)
0.04919
Net Sown Area (Lakh Hectares) 0.04341 Total no. of Water Storage Structures
96
Total no. of Water Extracting Units
12788
Total storage capacity of water storage structures (cubic meters)
36560
No. of Household SC 1404 ST 25 Others 13774 Total HHs 15203 Total Population in the project Area
64033
No. of Household of Landless people
251
Total no. of BPL Household 5664 No. of Small Farmer's Household 77 No. of Marginal Farmer's Household
14286
Depth of Ground Water (meters) below Ground Level Pre-monsoon 4.2 Post-monsoon 2.1 No. of person-days of Seasonal Migration
45198
Name of the Project IWMP II/2012-13 Pulikeezhu Watershed District Pathanamthitta Blocks Covered Pulikeezhu Name & Code of micro-watersheds
Ayyankonari - 10P8a, Parumala - 10P9a, Keecherivalkadavu - 10P10a, Chathenkery Kadavu - 11M19a, Podiyadi Puthanthodu - 11M20a.
Gram Panchayats covered Kadapra, Niranam, Peringara, Nedumbram, Kuttoor

120
APPENDIX -I

121
DETAILED ESTIMATE
Detailed Estimate
SL NO. DESCRIPTION NO
LENGTH
BREADTH DEPTH QUANTITY RATE/
UNIT
AMOUNT
MATERIAL (COST+CONVEYANCE)
LABOUR
TAX (6%) TOTAL
1. RAMP CONSTRUCTION(2 sides)
1
Earth work excavation in or under water and depositing cutsoil on the side of paddy field
m3 1515.6 /10m3
3801.12 3801.12
For foundation 4 5 1.2 1 24
For blocks 2 1.8 0.6 0.5 1.08
25.08
2
Dry rubble masonary for foundation including all charges conveyance, labour charges etc. Complete 4 5 1.2 0.5 12 m3 1524.8 /m3
18297.60 10609.2 7688.4
3
Random rubble masonary for superstructure including all charges conveyance, labour charges etc. Complete
For side walls 4 5 0.6 (1.5+.50)/2 12.6
2882.49 /m3 38394.
77 28730.4408 9664.32
6
For bed block 2 1.2 0.6 0.5 0.72
Total 13.32 m3
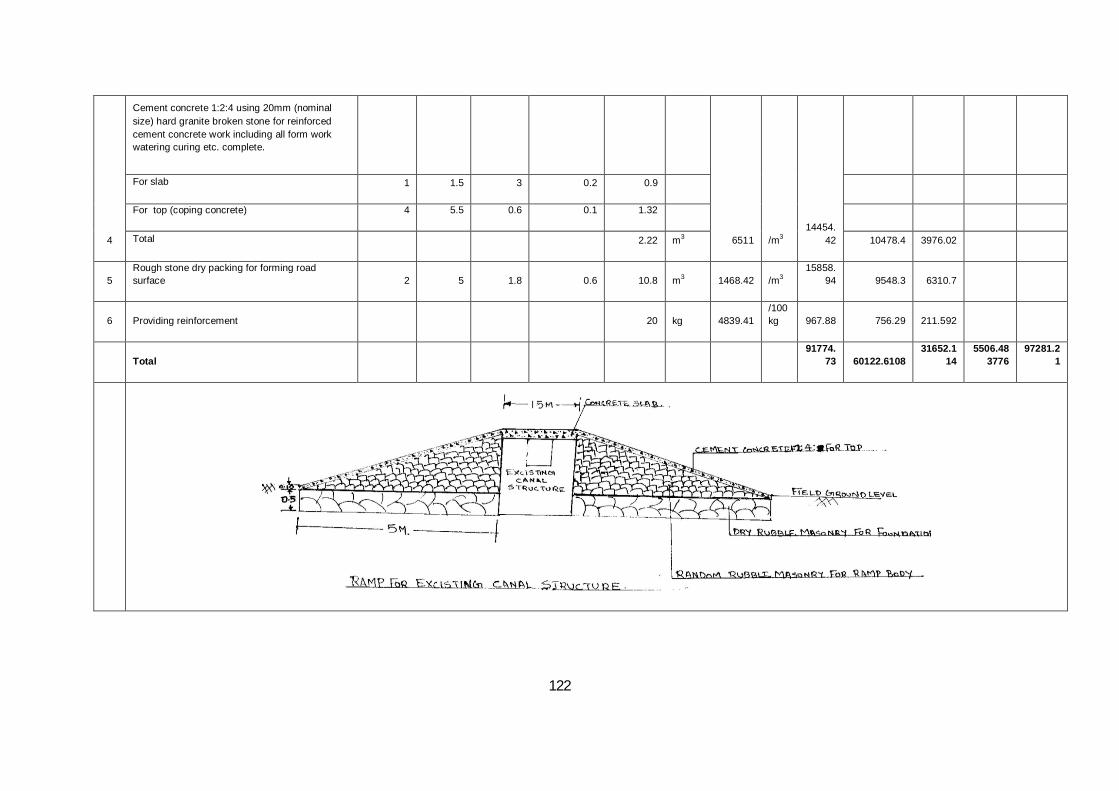
122
4
Cement concrete 1:2:4 using 20mm (nominal size) hard granite broken stone for reinforced cement concrete work including all form work watering curing etc. complete.
6511 /m3 14454.
42
For slab 1 1.5 3 0.2 0.9
For top (coping concrete) 4 5.5 0.6 0.1 1.32
Total 2.22 m3 10478.4 3976.02
5 Rough stone dry packing for forming road surface 2 5 1.8 0.6 10.8 m3 1468.42 /m3
15858.94 9548.3 6310.7
6 Providing reinforcement 20 kg 4839.41 /100kg 967.88 756.29 211.592
Total 91774.
73 60122.6108 31652.1
14 5506.48
3776 97281.2
1

123
2. VAACHAAL NIRMANAM
1 Clearing grass and other overgrowths of vegetation and small trees of girth up to 30 cm 1 500 2.1 1050 m2 188.5
/100m2
1979.25 0.00 1979.25
2
Earth work excavation in or under water and depositing cutsoil on the side of paddy field for channel (vaachaal) 1 500 0.9 0.6 270 m3 1515.6
/10m3
409212.00 0.00 409212
411191 24671 435862.
7
3. CONSTRUCTION OF RAMP(SLOPE)
1
Earth work excavation in or under water and depositing cutsoil on the side of paddy field
m3 1515.6 /10m3
1900.56 1900.56
For foundation 2 5 1.2 1 12
For blocks 1 1.8 0.6 0.5 0.54
12.54
2
Dry rubble masonary for foundation including all charges conveyance, labour charges etc. Complete 2 5 1.2 0.5 6 m3 1524.8 /m3
9148.80 5304.6 3844.2
3
Random rubble masonary for superstructure including all charges conveyance, labour charges etc. Complete
For side walls 2 5 0.6 (1.5+.50)/2 6.3 2882.49 /m3 19197.
14365.22 4832.16
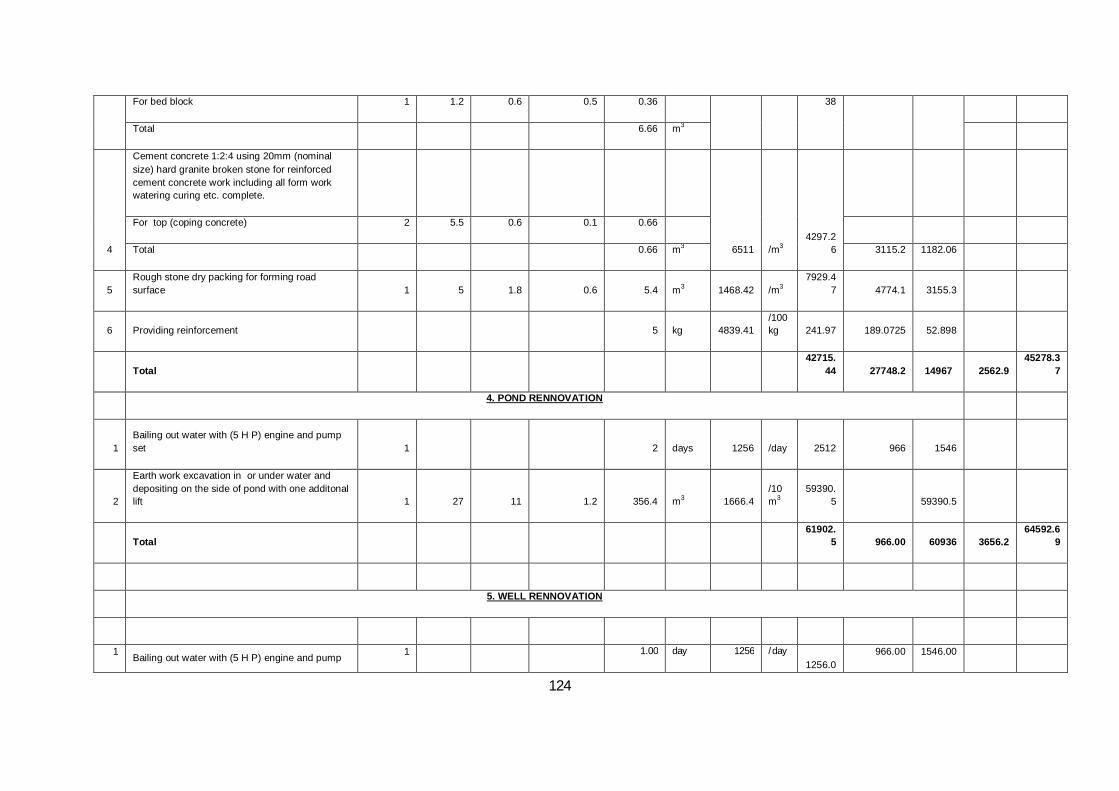
124
For bed block 1 1.2 0.6 0.5 0.36 38
Total 6.66 m3
4
Cement concrete 1:2:4 using 20mm (nominal size) hard granite broken stone for reinforced cement concrete work including all form work watering curing etc. complete.
6511 /m3 4297.2
6
For top (coping concrete) 2 5.5 0.6 0.1 0.66
Total 0.66 m3 3115.2 1182.06
5 Rough stone dry packing for forming road surface 1 5 1.8 0.6 5.4 m3 1468.42 /m3
7929.47 4774.1 3155.3
6 Providing reinforcement 5 kg 4839.41 /100kg 241.97 189.0725 52.898
Total 42715.
44 27748.2 14967 2562.9 45278.3
7
4. POND RENNOVATION
1 Bailing out water with (5 H P) engine and pump set 1 2 days 1256 /day 2512 966 1546
2
Earth work excavation in or under water and depositing on the side of pond with one additonal lift 1 27 11 1.2 356.4 m3 1666.4
/10m3
59390.5 59390.5
Total 61902.
5 966.00 60936 3656.2 64592.6
9
5. WELL RENNOVATION
1 Bailing out water with (5 H P) engine and pump 1 1.00 day 1256 /day 1256.0
966.00 1546.00

125
set 0
2 Desilting
1 3.14 1.44 1.80 8.14 m3
2571 /10m3
1046.33
1046.33
3 Plastering with cement mortar 1 3.14 2.4 1.5 11.30 m2 1863 /10m2
2105.38 923.04 1182.34
4 Cement concrete 1:2:4 (for nellipalaka)
1 3.14 1.44 0.10 0.45 m3 6511
/m3 2944.0
1 2134.20 809.82
5 Filltering media
24mm gravel 1 3.14 1.44 0.3 1.36 m3
1508 /m3 2045.5
7 2045.57
sand 1 3.14 1.44 0.3 1.36 m3
2880 /m3 3906.6
6 3906.66
Coal 1 3.14 1.44 0.3 1.36 m3
1600.00 /m3 2170.3
7 2170.37
Total 15474.
33 12145.84 4584 928.46 16402.7
9
6. CANAL CONSTRUCTION
1 Clearing grass and other overgrowths of vegetation and small trees of girth up to 30 cm 1 350 2.2 770 m2 188.5
/100m2
1451.45 0 1451.45
2
Earth work excavation in or under water and depositing cutsoil on the side of paddy field for channel (vaachaal) 1 350 2.2 0.3 231 m3 1515.6
/10m3
350103.60 0.00 350104
3 Cement concrete 1:4:8 for bed 1 350 2.2 0.2 154 m3 4432.22 /m3 68256
1.88 535969.28 146593

126
4 shuttering for sides 2 350 2.6 1820 m2 1989.73 /10m2
362130.86 202516.86 159614
5 Cement concrete 1:3:6 for sides 2 350 0.6 1 420 m3
5292.96 /m3 2223043.20 1647097.2 575946
6 wearing coat 1:2:4 1 350 1 0.075 26.25 m3
6511 /m3 17091
3.75 123900 47013.8
7 plastering with C.M 1 350 6.2 2170 m2 1862.51 /10m2
404164.67 177193.52 226971
Total 4194369.41 2686676.86
1507692.55
251662.16
4446031.57
7. CONSTRUCTION OF WELL
Item
No. Description
No. L B D Qty Rate Unit Amou
nt
1 Earth work excavation in hard soil for digging well with initial lift up to 1.50m 3.14 1.175 1.175 1.50 6.5 2710 10 m3
1761.30
2 Earth work excavation in hard soil for digging well with 2nd depth up to 3.00m including all charges(20% add every one lift) 3.14 1.175 1.175 1.50 6.5 3252 10 m3
2113.56
3 Earth work excavation in hard soil for digging well with 3rd depth up to 4.50m including all charges 3.14 1.175 1.175 1.50 6.5 3902 10 m3
2536.27
4 Earth work excavation in ordinary rock for digging well with 4th depth up to 6.00m including all charges 3.14 1.175 1.175 1.50 6.5 4682 10 m3
3043.52
5 Earth work excavation in ordinary rock for digging well with 5th depth up to 7.50m including all charges 3.14 1.175 1.175 1.20 5.2 5619 10 m3
2921.78
6 Cement concrete 1:11/2:3 for ring 12.00 0.4239 5.0868 6900 1 m3
35098.92
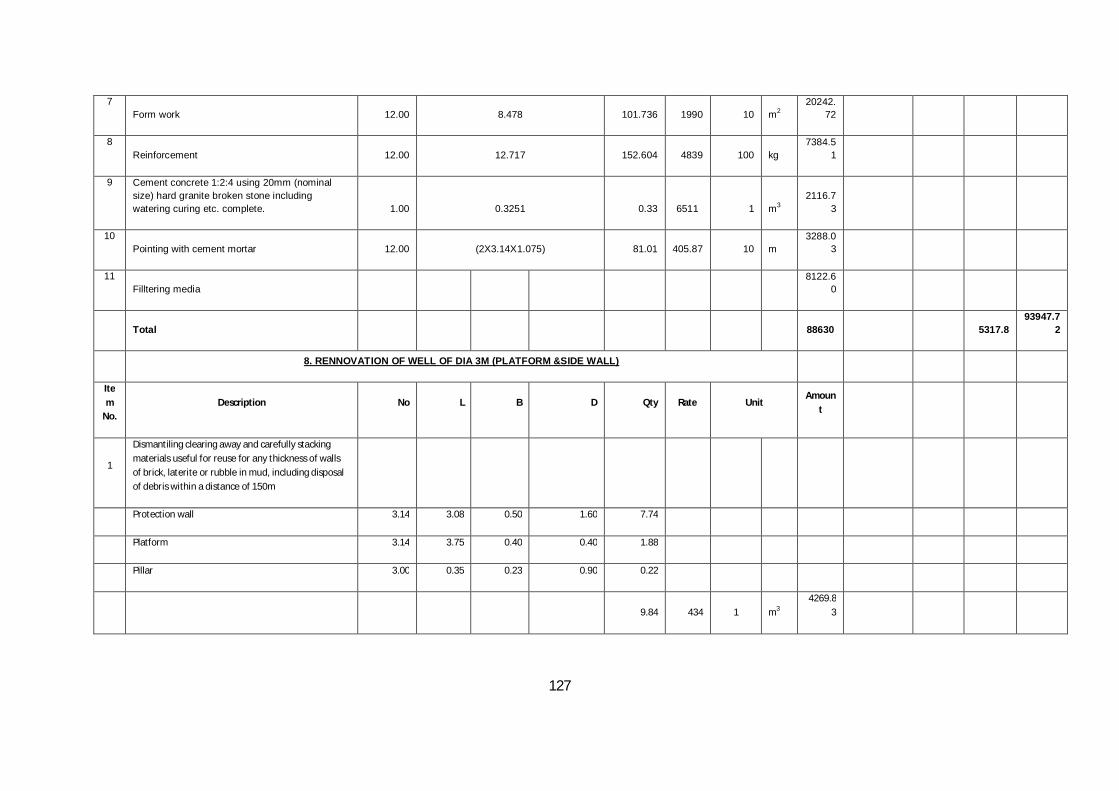
127
7 Form work 12.00 8.478 101.736 1990 10 m2
20242.72
8 Reinforcement 12.00 12.717 152.604 4839 100 kg
7384.51
9 Cement concrete 1:2:4 using 20mm (nominal size) hard granite broken stone including watering curing etc. complete. 1.00 0.3251 0.33 6511 1 m3
2116.73
10 Pointing with cement mortar 12.00 (2X3.14X1.075) 81.01 405.87 10 m
3288.03
11 Filltering media
8122.60
Total 88630 5317.8
93947.72
8. RENNOVATION OF WELL OF DIA 3M (PLATFORM &SIDE WALL)
Item
No. Description No L B D Qty Rate Unit
Amount
1
Dismantiling clearing away and carefully stacking materials useful for reuse for any thickness of walls of brick, laterite or rubble in mud, including disposal of debris within a distance of 150m
Protection wall 3.14 3.08 0.50 1.60 7.74
Platform 3.14 3.75 0.40 0.40 1.88
Pillar 3.00 0.35 0.23 0.90 0.22
9.84 434 1 m3 4269.8
3
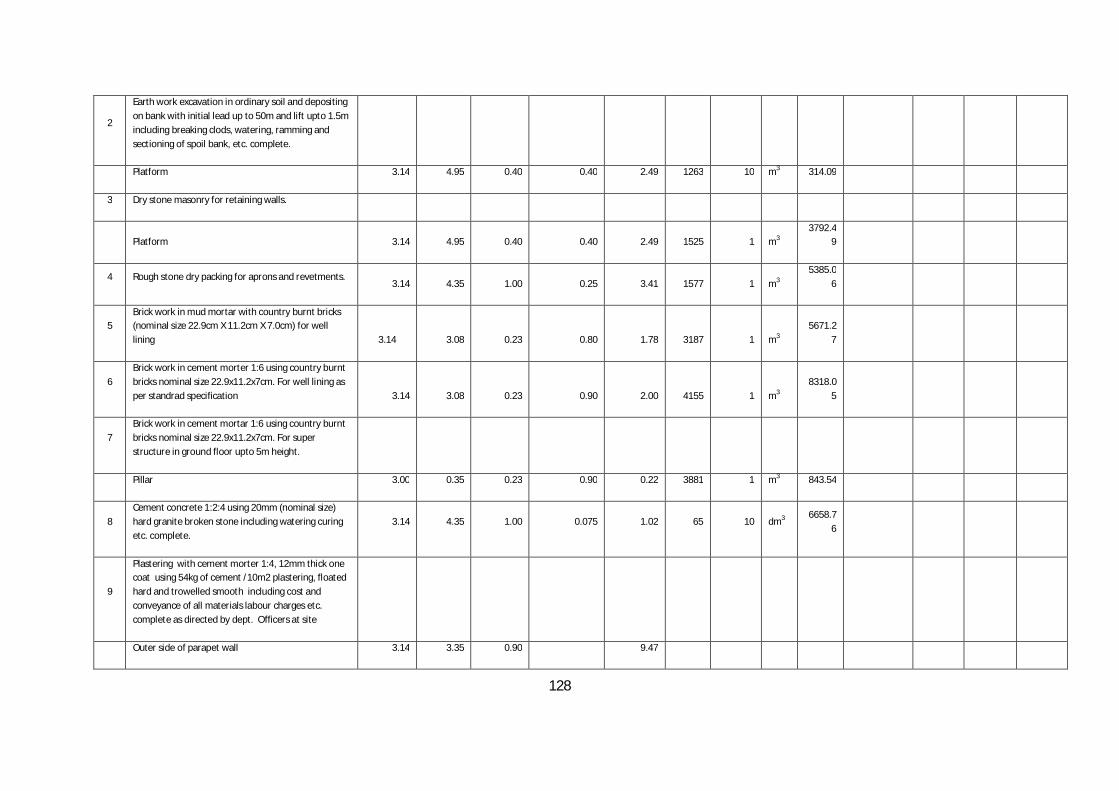
128
2
Earth work excavation in ordinary soil and depositing on bank with initial lead up to 50m and lift upto 1.5m including breaking clods, watering, ramming and sectioning of spoil bank, etc. complete.
Platform 3.14 4.95 0.40 0.40 2.49 1263 10 m3 314.09
3 Dry stone masonry for retaining walls.
Platform 3.14 4.95 0.40 0.40 2.49 1525 1 m3
3792.49
4 Rough stone dry packing for aprons and revetments. 3.14 4.35 1.00 0.25 3.41 1577 1 m3
5385.06
5 Brick work in mud mortar with country burnt bricks (nominal size 22.9cm X 11.2cm X 7.0cm) for well lining 3.14 3.08 0.23 0.80 1.78 3187 1 m3
5671.27
6 Brick work in cement morter 1:6 using country burnt bricks nominal size 22.9x11.2x7cm. For well lining as per standrad specification 3.14 3.08 0.23 0.90 2.00 4155 1 m3
8318.05
7 Brick work in cement mortar 1:6 using country burnt bricks nominal size 22.9x11.2x7cm. For super structure in ground floor upto 5m height.
Pillar 3.00 0.35 0.23 0.90 0.22 3881 1 m3 843.54
8 Cement concrete 1:2:4 using 20mm (nominal size) hard granite broken stone including watering curing etc. complete.
3.14 4.35 1.00 0.075 1.02 65 10 dm3 6658.7
6
9
Plastering with cement morter 1:4, 12mm thick one coat using 54kg of cement /10m2 plastering, floated hard and trowelled smooth including cost and conveyance of all materials labour charges etc. complete as directed by dept. Officers at site
Outer side of parapet wall 3.14 3.35 0.90 9.47
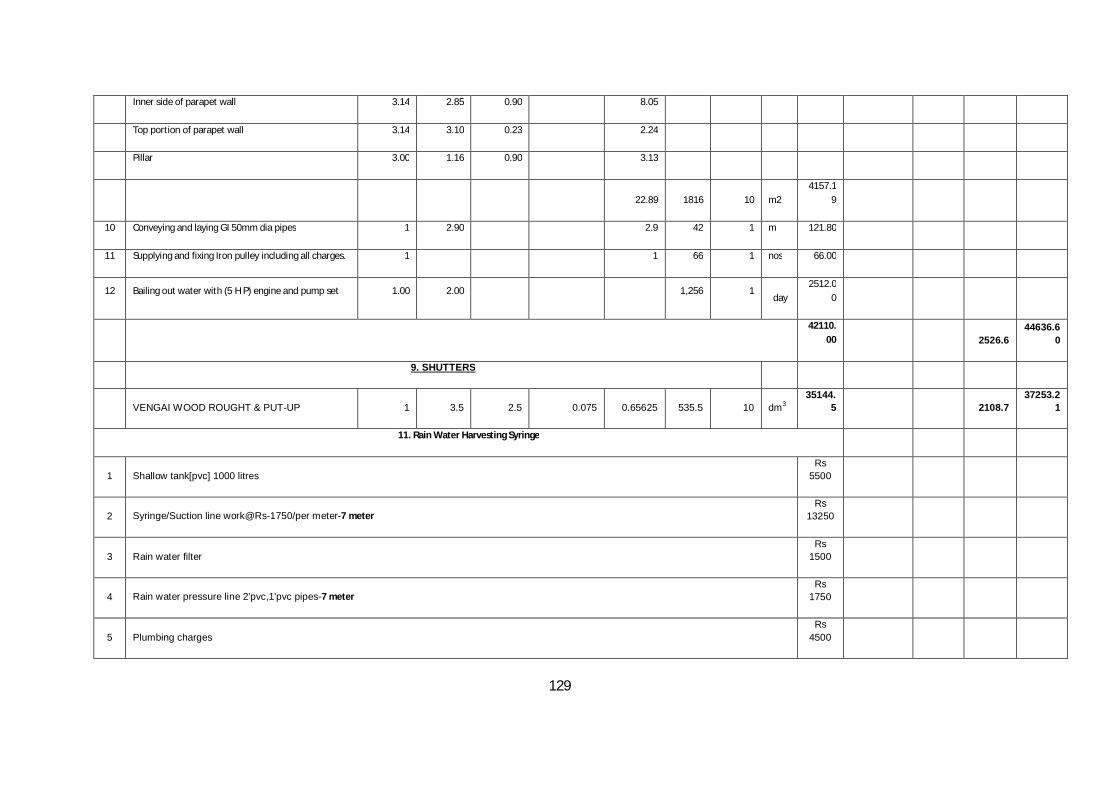
129
Inner side of parapet wall 3.14 2.85 0.90 8.05
Top portion of parapet wall 3.14 3.10 0.23 2.24
Pillar 3.00 1.16 0.90 3.13
22.89 1816 10 m2
4157.19
10 Conveying and laying GI 50mm dia pipes 1 2.90 2.9 42 1 m 121.80
11 Supplying and fixing Iron pulley including all charges. 1 1 66 1 nos 66.00
12 Bailing out water with (5 H P) engine and pump set 1.00 2.00 1,256 1 day
2512.00
42110.00 2526.6
44636.60
9. SHUTTERS
VENGAI WOOD ROUGHT & PUT-UP 1 3.5 2.5 0.075 0.65625 535.5 10 dm3 35144.
5 2108.7 37253.2
1
11. Rain Water Harvesting Syringe
1 Shallow tank[pvc] 1000 litres Rs
5500
2 Syringe/Suction line work@Rs-1750/per meter-7 meter Rs
13250
3 Rain water filter Rs
1500
4 Rain water pressure line 2'pvc,1'pvc pipes-7 meter Rs
1750
5 Plumbing charges Rs
4500
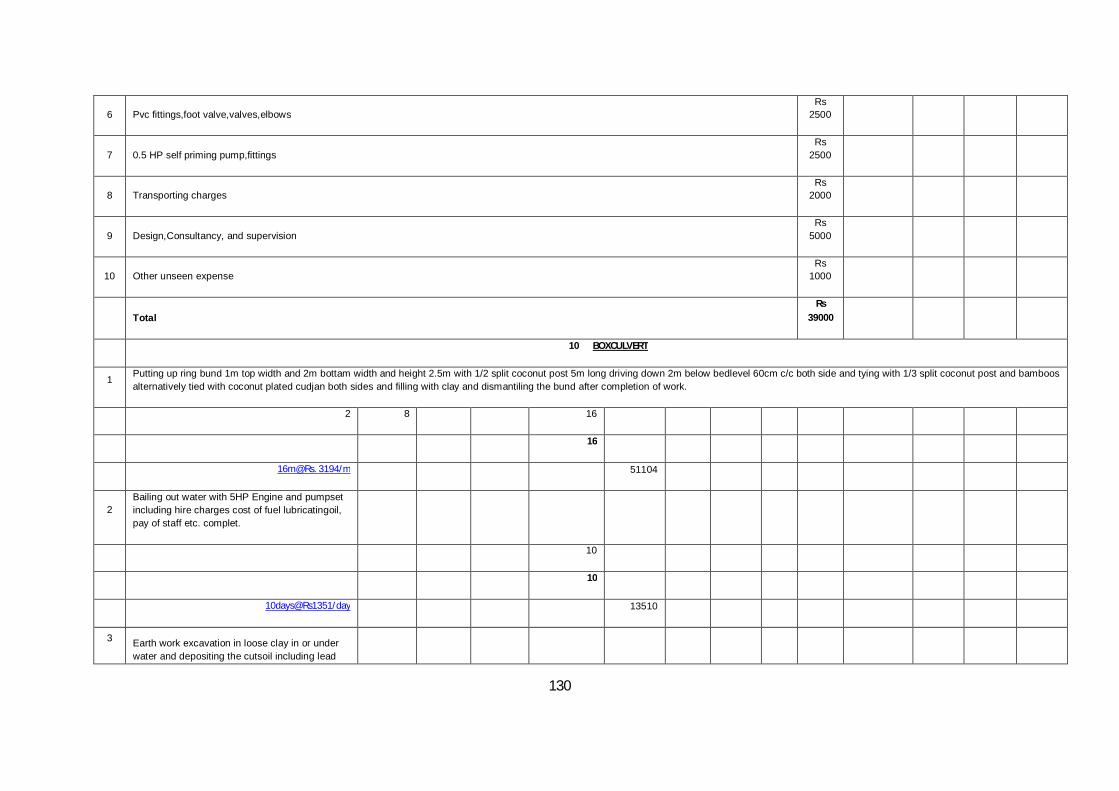
130
6 Pvc fittings,foot valve,valves,elbows Rs
2500
7 0.5 HP self priming pump,fittings Rs
2500
8 Transporting charges Rs
2000
9 Design,Consultancy, and supervision Rs
5000
10 Other unseen expense Rs
1000
Total Rs
39000
10 BOXCULVERT
1 Putting up ring bund 1m top width and 2m bottam width and height 2.5m with 1/2 split coconut post 5m long driving down 2m below bedlevel 60cm c/c both side and tying with 1/3 split coconut post and bamboos alternatively tied with coconut plated cudjan both sides and filling with clay and dismantiling the bund after completion of work.
2 8 16
16
16m@Rs. 3194/m 51104
2 Bailing out water with 5HP Engine and pumpset including hire charges cost of fuel lubricatingoil, pay of staff etc. complet.
10
10
10days@Rs1351/day 13510
3 Earth work excavation in loose clay in or under water and depositing the cutsoil including lead

131
and lift as per direction
4 3.5 1.35 18.9
18.9
[email protected]/10m3 2793
4 Supplying and stacking well matured coconut posts 5m to 7mlong
(4/0.60) +1=6.67 say7 nos
(3.5/0.60)+1 =5.83 say6nos 7 6 7 294
294
[email protected]/m 33222
5 Driving down wooden piles 200to 300mm dia to lines and levels as per the directions
Qty wide item no.4 294
294
[email protected]/m 126432
6 providing sand bedding with clear grity river sand including applying and spreading the sand in lines and levels
4 3.5 0.4 5.6
5.6
5.6m@Rs3811/m3 21341.6
7 Rough stone Dry packing for D.R Foundation abow coconut pileing
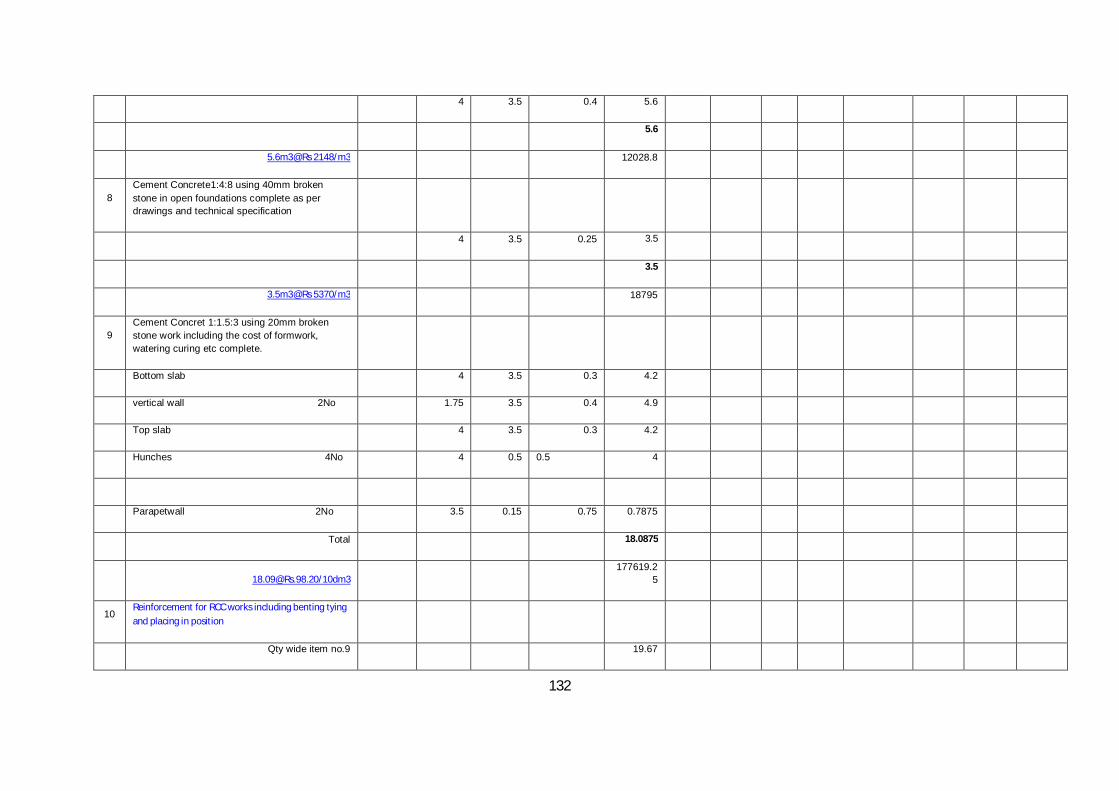
132
4 3.5 0.4 5.6
5.6
5.6m3@Rs 2148/m3 12028.8
8 Cement Concrete1:4:8 using 40mm broken stone in open foundations complete as per drawings and technical specification
4 3.5 0.25 3.5
3.5
3.5m3@Rs 5370/m3 18795
9 Cement Concret 1:1.5:3 using 20mm broken stone work including the cost of formwork, watering curing etc complete.
Bottom slab 4 3.5 0.3 4.2
vertical wall 2No 1.75 3.5 0.4 4.9
Top slab 4 3.5 0.3 4.2
Hunches 4No 4 0.5 0.5 4
Parapetwall 2No 3.5 0.15 0.75 0.7875
Total 18.0875
[email protected]/10dm3
177619.25
10 Reinforcement for RCC works including benting tying and placing in position
Qty wide item no.9 19.67

133
18.09m3@120kg/m3 2171 Kg
24Qtl@Rs6339/Qtl 137619.6
9
11 Earth work excavation in loose clay in or under water and depositing the cutsoil including lead and lift as per direction
Wingwall 4No 5 1.2 0.5 12
Total 12
12m3@Rs1263/10m3 1515.6
12 DR masonry for foundation and super structre including all charges convayance labour charges etc. for the side protection of the pipe culvert
1. Foundation
Wingwall 4No 5 1.2 0.5 28
2. Super structre
Wingwall 4No 5 0.8 1.75 28
Total 56
56m3@Rs2096/m3 117376
13
Cement concrete 1:3:6 using 20mm broken stone for wearing coat including hire for form work watercuring all labour charges etc. complete
Wingwall 4No 5 0.5 0.075 0.75
Total 0.75
.75m3@Rs68/10dm3 5100

134
15
Earthwork filling with gravelly earth cut and convayed from availabe source including allcost of convayance labourcharge for spreading and cosolidating by using power roller or tamping with rammer or 600mm dia stone rollr etc complete..
4 3.5 1 14
4No 5 1 1 20
34
[email protected]/10m3 30800.6
GRAND TOTAL
RUPEES TWELVE
LAKHS ONLY 752345.09
TAX 6%
45140.7051
TOTAL 797485.79
SAY EIGHT LAKHS RUPEES
11. Open Well Recharging
1 150 mm gutter pipe 1 7.5 1 Nos 675
2 150 mm Stopper 2 65 Nos 130
3 150 mm dropper 2 60 Nos 120
4 150 mm GI clamp 7 70 Nos 210
5 63 mm Pipe Gm (4+2) 6 70 Nos 420
6 Supplying and Fixing 300 litre sintex tank 1 300 5 litre 1500
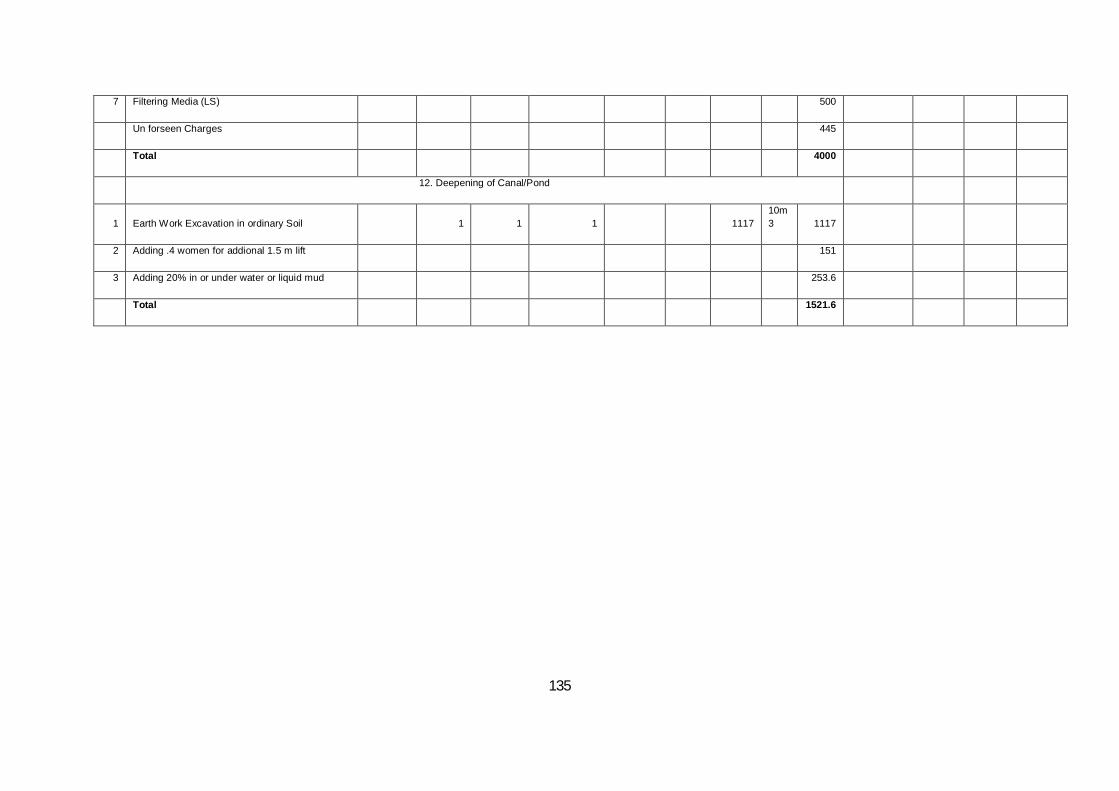
135
7 Filtering Media (LS) 500
Un forseen Charges 445
Total 4000
12. Deepening of Canal/Pond
1 Earth Work Excavation in ordinary Soil 1 1 1 1117 10m3 1117
2 Adding .4 women for addional 1.5 m lift 151
3 Adding 20% in or under water or liquid mud 253.6
Total 1521.6

136
FERRO CEMENT WATER TANK OF 15000litres
DESCRIPTION QUANTITY UNIT RATE AMOUNT
Clearing the Tank site 36 m2 1.20 43.20 Excavation in hard soil for foundation 1.1602 m3 150.00 174.03 P.C.C 1:4:8 using 20mm broken stone for foundation 0.3867 m3 4828.73 1867.27 Brick work in CM 1:6 for foundation and basement 1.5822 m3 4286.43 6781.99 Basement filling with boulders 1.0935 m3 1031.00 1127.40 PCC 1:4:8 using 20mm broken stone below base slab 0.45 m3 4828.73 2172.93 Steel reinforcement for belt and floor concrete 0.5131 Qtl 5213.40 2675.00 Floor &belt concreting in R.C.C 1:11/2:3, using 20mm broken stone including form work but excluding reinforcement
1.1695
m3 6020.84 7041.37 Making steel cage for wall, dome and filter chamber with 8mm & n6mm bars including supply of material and labour
0.5131
Qtl 7388.40 3790.99 Supplying and winding with 1 layer of 10 guage, 50 mm x 50mm welded mesh over the steel cage including material and labour
20.72
m2 228.88 4742.39 Supplying and winding with two layers of 10 cage, 12.5x12.5 mm GI chicken mesh around the cylindrical steel cage, dome and filter including material and labour
31.574
m2 180.00 5683.32 Plastering with CM 1:2.5, 21 mm thick each on both sides of tankwall, applied in layers and finished smooth with cement flushing coat including material and labour
41.44
m2 285.75 11841.48 Plastering with CM 1:3, 15mm thick each on both sides of dome and filter chamber applied in layers and finished smooth with cement flushing coat including
21.71
m2 267.00 5796.57
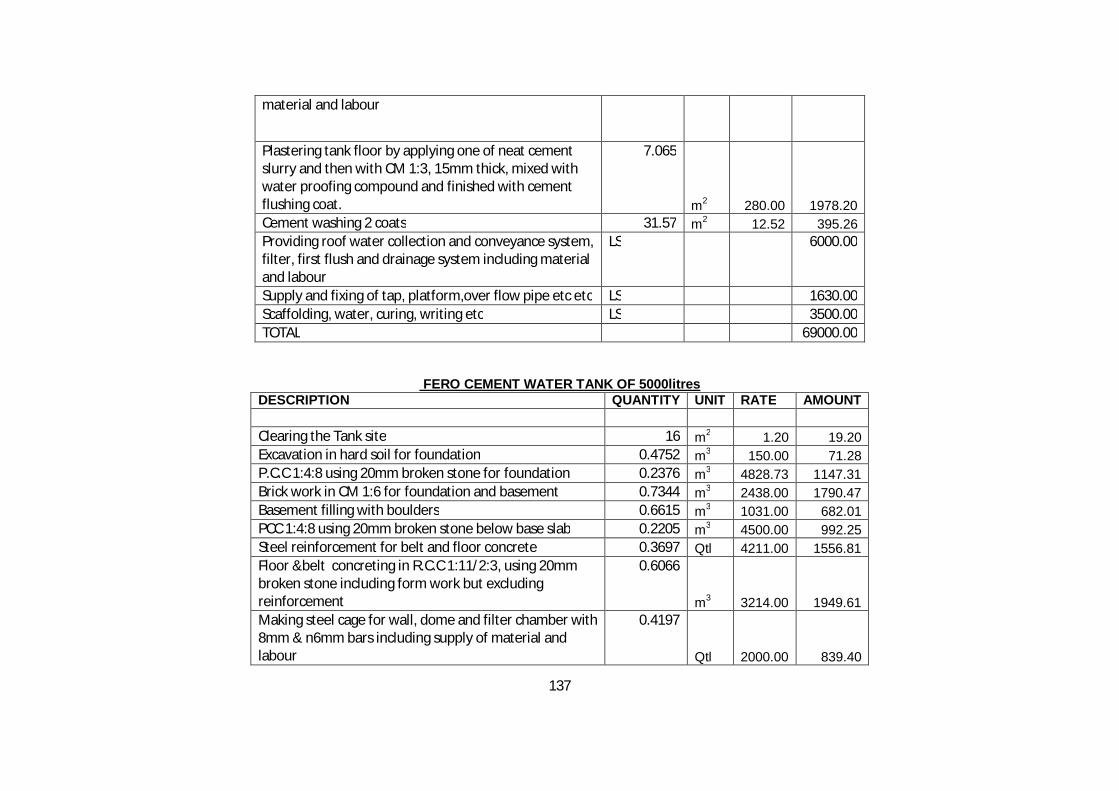
137
material and labour
Plastering tank floor by applying one of neat cement slurry and then with CM 1:3, 15mm thick, mixed with water proofing compound and finished with cement flushing coat.
7.065
m2 280.00 1978.20 Cement washing 2 coats 31.57 m2 12.52 395.26 Providing roof water collection and conveyance system, filter, first flush and drainage system including material and labour
LS 6000.00
Supply and fixing of tap, platform,over flow pipe etc etc LS 1630.00 Scaffolding, water, curing, writing etc LS 3500.00 TOTAL 69000.00
FERO CEMENT WATER TANK OF 5000litres DESCRIPTION QUANTITY UNIT RATE AMOUNT
Clearing the Tank site 16 m2 1.20 19.20 Excavation in hard soil for foundation 0.4752 m3 150.00 71.28 P.C.C 1:4:8 using 20mm broken stone for foundation 0.2376 m3 4828.73 1147.31 Brick work in CM 1:6 for foundation and basement 0.7344 m3 2438.00 1790.47 Basement filling with boulders 0.6615 m3 1031.00 682.01 PCC 1:4:8 using 20mm broken stone below base slab 0.2205 m3 4500.00 992.25 Steel reinforcement for belt and floor concrete 0.3697 Qtl 4211.00 1556.81 Floor &belt concreting in R.C.C 1:11/2:3, using 20mm broken stone including form work but excluding reinforcement
0.6066
m3 3214.00 1949.61 Making steel cage for wall, dome and filter chamber with 8mm & n6mm bars including supply of material and labour
0.4197
Qtl 2000.00 839.40

138
Supplying and winding with 1 layer of 10 guage, 50 mm x 50mm welded mesh over the steel cage including material and labour
11.25
m2 132.00 1485.00 Supplying and winding with two layers of 10 cage, 12.5x12.5 mm GI chicken mesh around the cylindrical steel cage, dome and filter including material and labour
15.255
m2 136.25 2078.49 Plastering with CM 1:2.5, 21 mm thick each on both sides of tankwall, applied in layers and finished smooth with cement flushing coat including material and labour
22.5
m2 190.00 4275.00 Plastering with CM 1:3, 15mm thick each on both sides of dome and filter chamber applied in layers and finished smooth with cement flushing coat including material and labour
8
m2 123.00 984.00 Plastering tank floor by applying one of neat cement slurry and then with CM 1:3, 15mm thick, mixed with water proofing compound and finished with cement flushing coat.
3.14
m2 180.92 568.09 Cement washing 2 coats 15.255 m2 12.52 190.99 Providing roof water collection and conveyance system, filter, first flush and drainage system including material and labour
LS 1500.00
Supply and fixing of tap, platform,over flow pipe etc etc LS 1500.00 Scaffolding, water, curing, writing etc LS 1005.00 TOTAL 22634.90
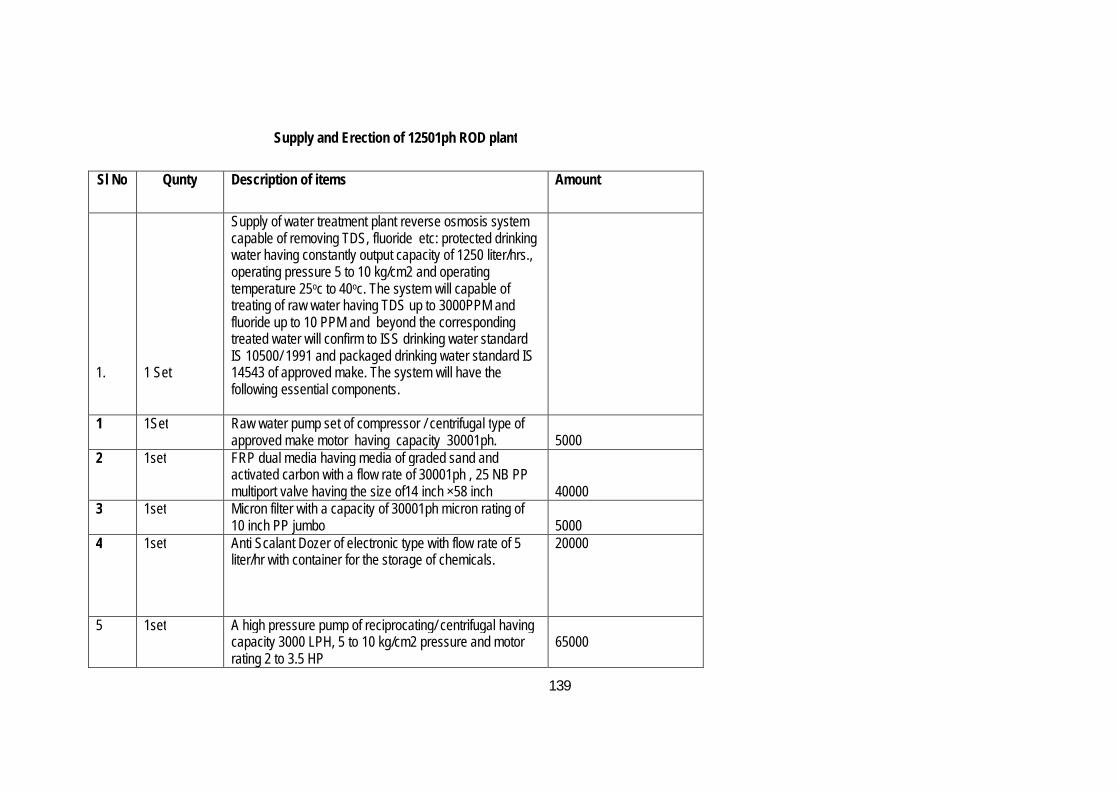
139
Supply and Erection of 12501ph ROD plant
Sl No Qunty Description of items Amount
1.
1 Set
Supply of water treatment plant reverse osmosis system capable of removing TDS, fluoride etc: protected drinking water having constantly output capacity of 1250 liter/hrs., operating pressure 5 to 10 kg/cm2 and operating temperature 25oc to 40oc. The system will capable of treating of raw water having TDS up to 3000PPM and fluoride up to 10 PPM and beyond the corresponding treated water will confirm to ISS drinking water standard IS 10500/ 1991 and packaged drinking water standard IS 14543 of approved make. The system will have the following essential components.
1 1Set Raw water pump set of compressor / centrifugal type of approved make motor having capacity 30001ph.
5000
2 1set FRP dual media having media of graded sand and activated carbon with a flow rate of 30001ph , 25 NB PP multiport valve having the size of14 inch ×58 inch
40000
3 1set Micron filter with a capacity of 30001ph micron rating of 10 inch PP jumbo
5000
4 1set Anti Scalant Dozer of electronic type with flow rate of 5 liter/hr with container for the storage of chemicals.
20000
5 1set A high pressure pump of reciprocating/ centrifugal having capacity 3000 LPH, 5 to 10 kg/cm2 pressure and motor rating 2 to 3.5 HP
65000
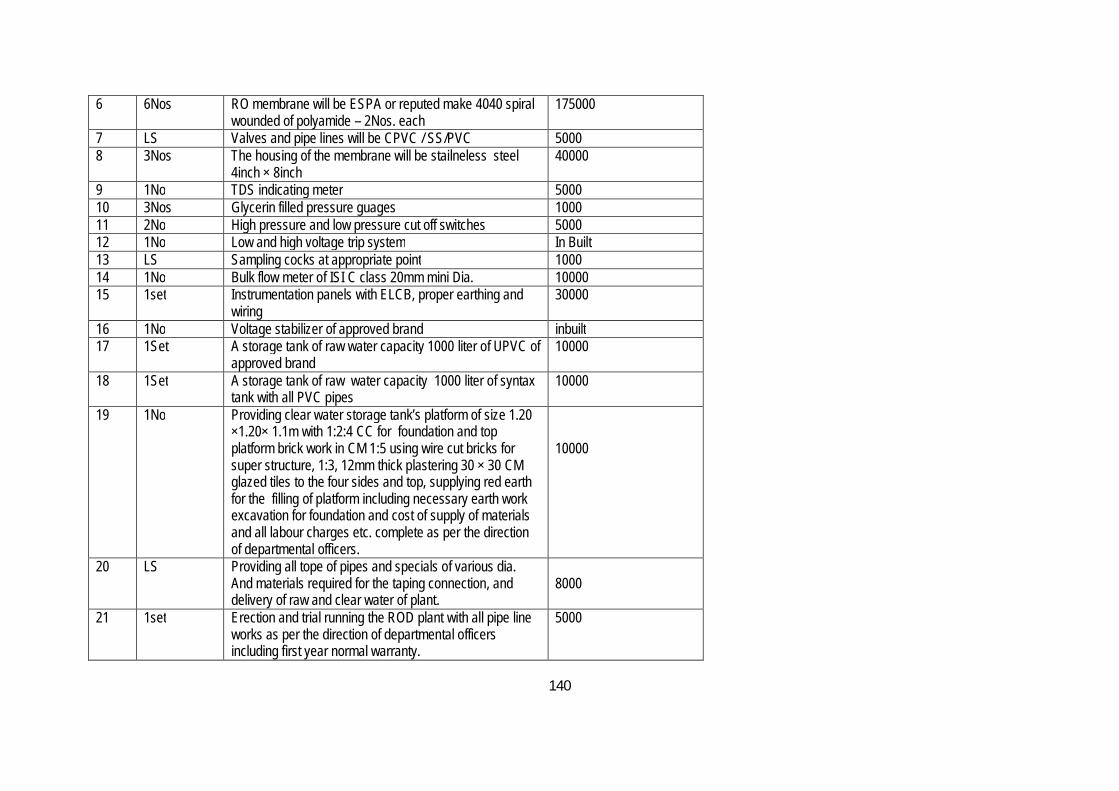
140
6 6Nos RO membrane will be ESPA or reputed make 4040 spiral wounded of polyamide – 2Nos. each
175000
7 LS Valves and pipe lines will be CPVC / SS/PVC 5000 8 3Nos The housing of the membrane will be stailneless steel
4inch × 8inch 40000
9 1No TDS indicating meter 5000 10 3Nos Glycerin filled pressure guages 1000 11 2No High pressure and low pressure cut off switches 5000 12 1No Low and high voltage trip system In Built 13 LS Sampling cocks at appropriate point 1000 14 1No Bulk flow meter of ISI C class 20mm mini Dia. 10000 15 1set Instrumentation panels with ELCB, proper earthing and
wiring 30000
16 1No Voltage stabilizer of approved brand inbuilt 17 1Set A storage tank of raw water capacity 1000 liter of UPVC of
approved brand 10000
18 1Set A storage tank of raw water capacity 1000 liter of syntax tank with all PVC pipes
10000
19 1No Providing clear water storage tank’s platform of size 1.20 ×1.20× 1.1m with 1:2:4 CC for foundation and top platform brick work in CM 1:5 using wire cut bricks for super structure, 1:3, 12mm thick plastering 30 × 30 CM glazed tiles to the four sides and top, supplying red earth for the filling of platform including necessary earth work excavation for foundation and cost of supply of materials and all labour charges etc. complete as per the direction of departmental officers.
10000
20 LS Providing all tope of pipes and specials of various dia. And materials required for the taping connection, and delivery of raw and clear water of plant.
8000
21 1set Erection and trial running the ROD plant with all pipe line works as per the direction of departmental officers including first year normal warranty.
5000
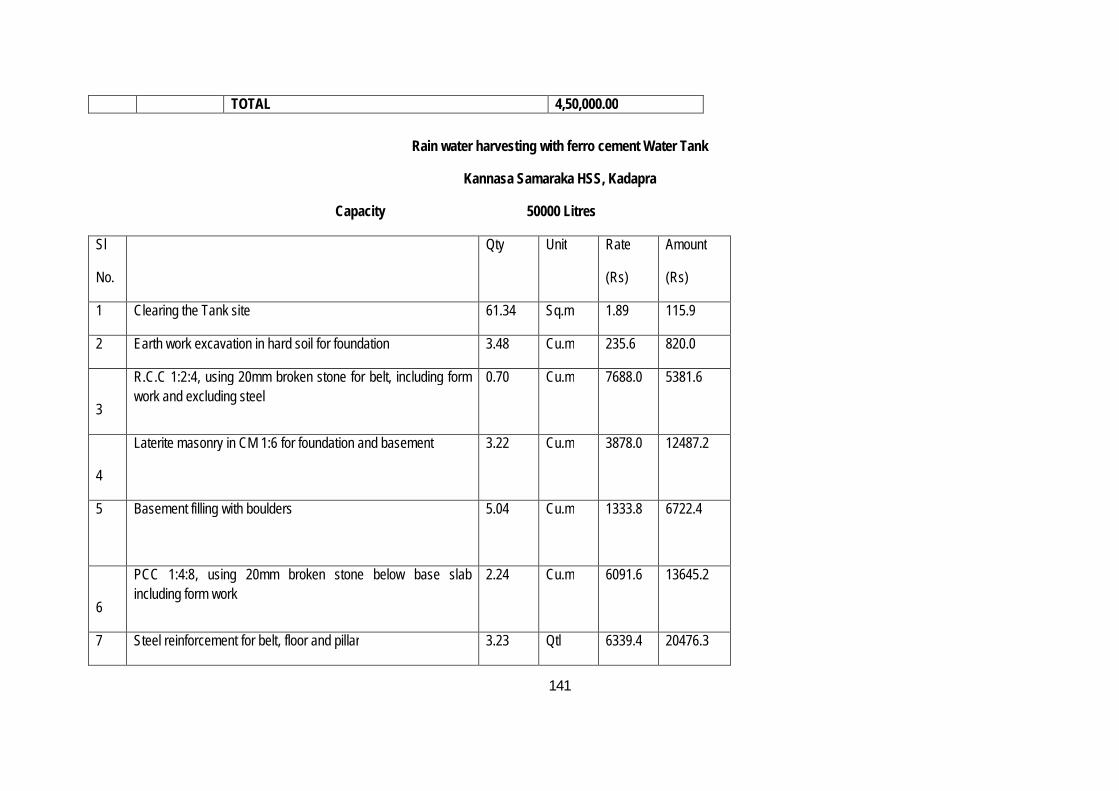
141
TOTAL 4,50,000.00
Rain water harvesting with ferro cement Water Tank
Kannasa Samaraka HSS, Kadapra
Capacity 50000 Litres
Sl
No.
Qty Unit Rate
(Rs)
Amount
(Rs)
1 Clearing the Tank site 61.34 Sq.m 1.89 115.9
2 Earth work excavation in hard soil for foundation 3.48 Cu.m 235.6 820.0
3
R.C.C 1:2:4, using 20mm broken stone for belt, including form work and excluding steel
0.70 Cu.m 7688.0 5381.6
4
Laterite masonry in CM 1:6 for foundation and basement 3.22 Cu.m 3878.0 12487.2
5 Basement filling with boulders 5.04 Cu.m
1333.8 6722.4
6
PCC 1:4:8, using 20mm broken stone below base slab including form work
2.24 Cu.m 6091.6 13645.2
7 Steel reinforcement for belt, floor and pillar 3.23 Qtl 6339.4 20476.3
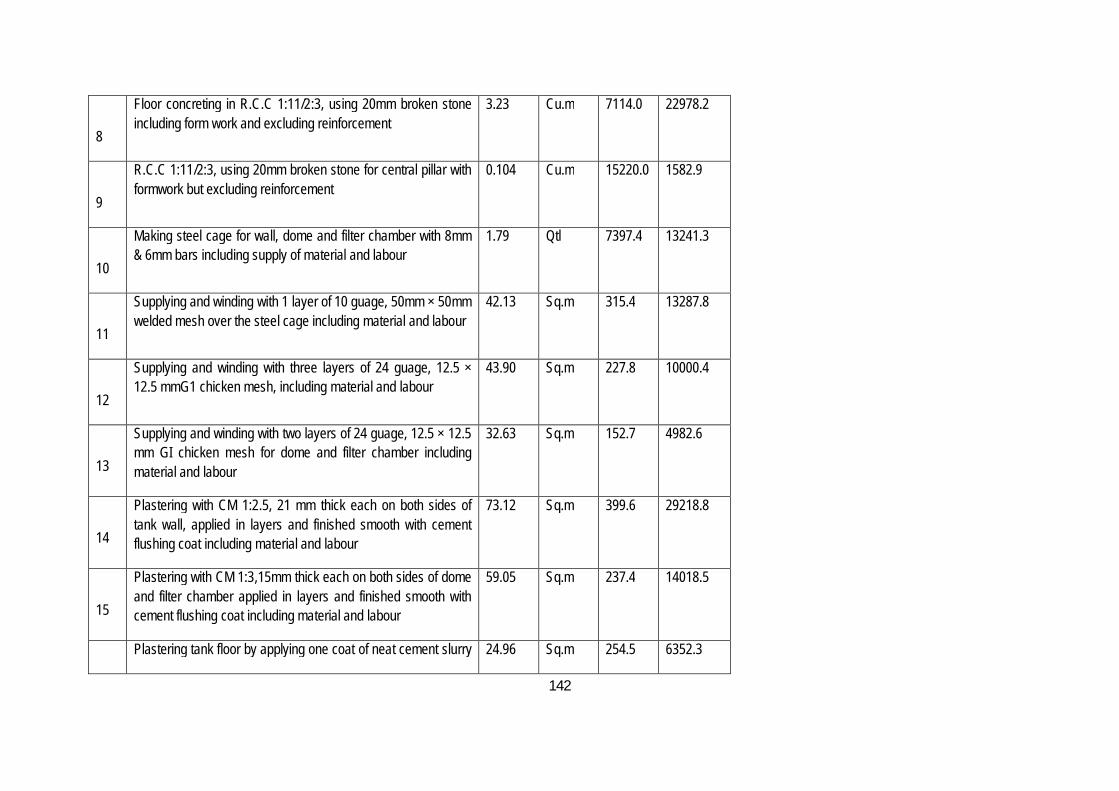
142
8
Floor concreting in R.C.C 1:11/2:3, using 20mm broken stone including form work and excluding reinforcement
3.23 Cu.m 7114.0 22978.2
9
R.C.C 1:11/2:3, using 20mm broken stone for central pillar with formwork but excluding reinforcement
0.104 Cu.m 15220.0 1582.9
10
Making steel cage for wall, dome and filter chamber with 8mm & 6mm bars including supply of material and labour
1.79 Qtl 7397.4 13241.3
11
Supplying and winding with 1 layer of 10 guage, 50mm × 50mm welded mesh over the steel cage including material and labour
42.13 Sq.m 315.4 13287.8
12
Supplying and winding with three layers of 24 guage, 12.5 × 12.5 mmG1 chicken mesh, including material and labour
43.90 Sq.m 227.8 10000.4
13
Supplying and winding with two layers of 24 guage, 12.5 × 12.5 mm GI chicken mesh for dome and filter chamber including material and labour
32.63 Sq.m 152.7 4982.6
14
Plastering with CM 1:2.5, 21 mm thick each on both sides of tank wall, applied in layers and finished smooth with cement flushing coat including material and labour
73.12 Sq.m 399.6 29218.8
15
Plastering with CM 1:3,15mm thick each on both sides of dome and filter chamber applied in layers and finished smooth with cement flushing coat including material and labour
59.05 Sq.m 237.4 14018.5
Plastering tank floor by applying one coat of neat cement slurry 24.96 Sq.m 254.5 6352.3

143
16 and then with CM 1:3, 15mm thick, mixed with water proofing compound and finished with cement flushing coat .
17 Cement washing 2 coats 66.08 Sq.m 9.3 613.2
18 Providing roof water collection and conveyance system, filter, first flush and drainage system including material and labour
LS 6000.00
19 Supply and installation of 1 HP submersible pump, laying of 5 pumping line, 1.5 mm electrical cable and accessories with necessary specials including material and labour.
LS 17500.00
20 Supply and installation of 500litres capacity HDPE tank distribution line, taps, with necessaries specials and valves including material and labour
LS 5000.00
21 Stone and writing charge LS 2500.00
22 Contingencies LS 250
Sub total 207175
23 Management charges to SEUF @ 8% as per GO No.
71858/DA1/11/LSGD dated 27/3/12
16574.0
24 KVAT including cess @ 4% 8287.0
25 KCWWF @ 1% 2072.0
26 IT @ 2% 4143.0

144
27 Service tax @ 12.36% of item No.21 2049.0
Total 240300
ESTIMATE FOR BIOGAS PLANT
Description Quandity Unit Rate (Rs) Amount(Rs)
1 Excavation of hand soil for plant erection 4 labours 500 2000
2 Portable biogas plant with double burner and gas pipe
1 no 60000
3 Cow dung 50 Basket 50 2500
4 Installation Charge 1 3000
5 Transportation and others LS 2500
6 Contingency 696
Sub Total 70696
7 Management charges to SEUF @ 8% as per GO No.71858/DA 1/ 11/LSGD dated 27/3/2012
5655.7
8 KVAT including cess @ 4.04% 2856.1184
9 KCWWF @ 1% 706.96
145
10 IT including cess @ 1.01% 714.0296
11 Service tax @ 12.36% of item no 4 371
TOTAL 81000
( Rupees Eighty One Thousand only)

146
CROSS SECTION OF WELL WITH FILTER MEDIA AT BOTTOM & SIDES
CROSS SECTION OF OPEN WELL

147
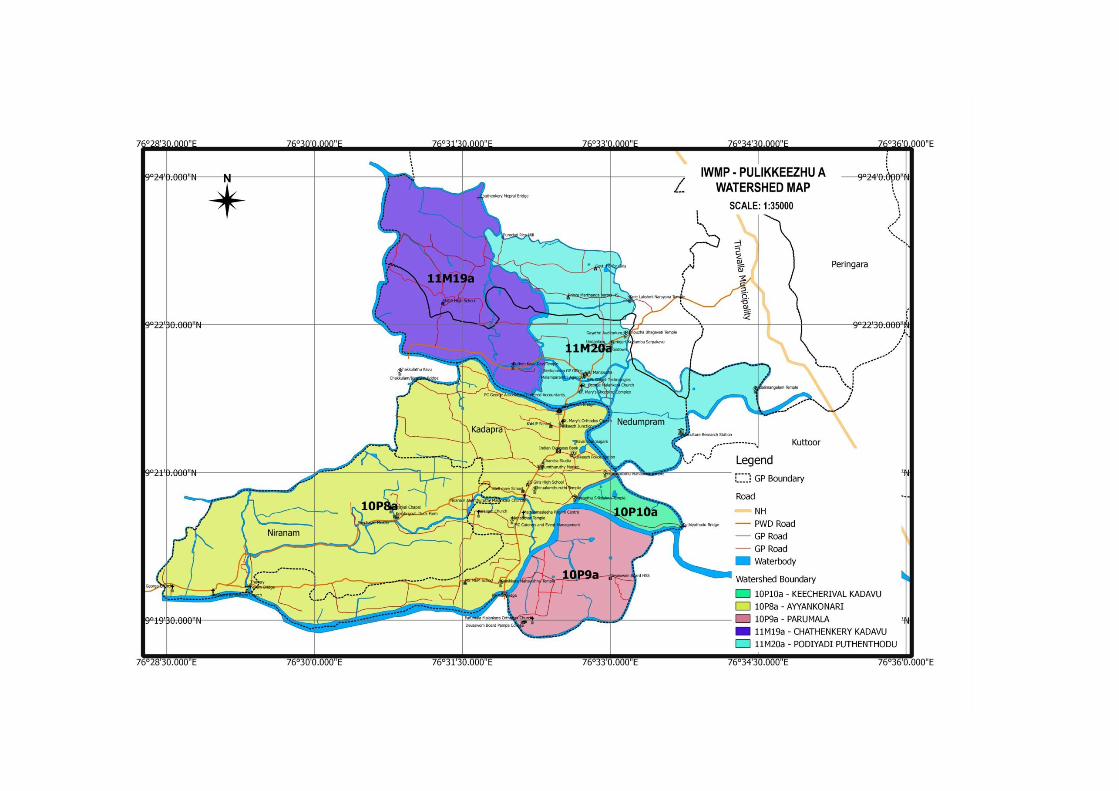
148
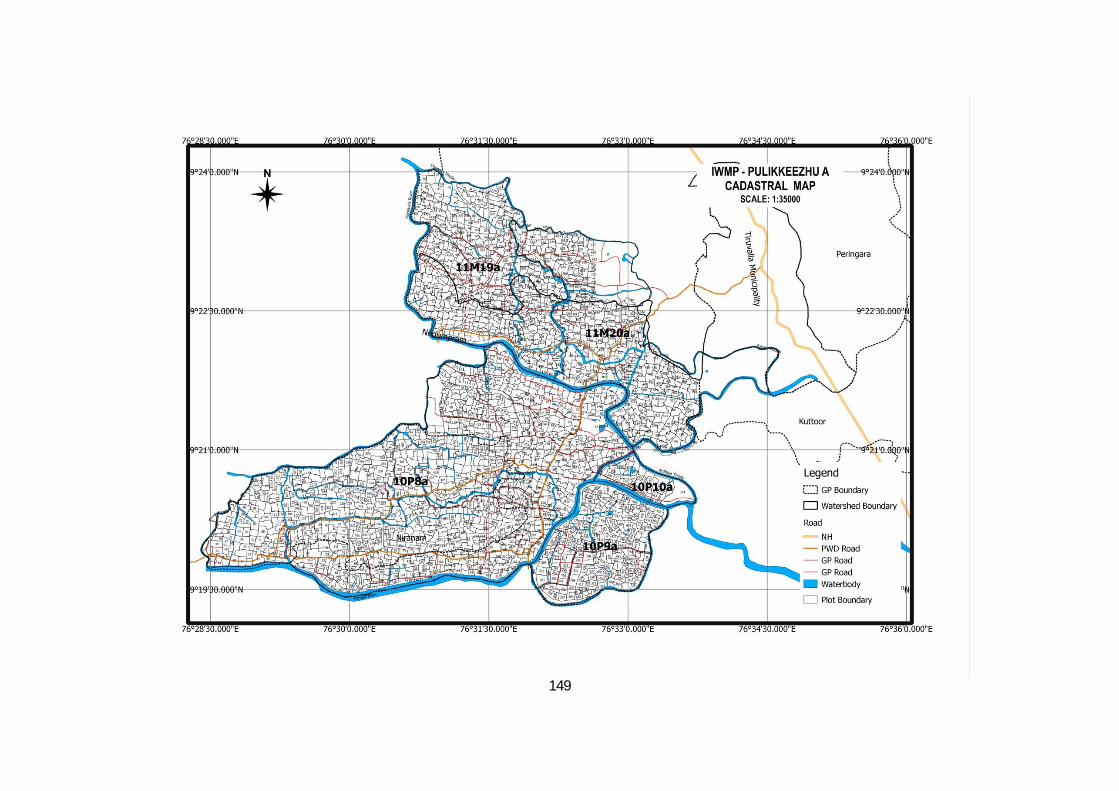
149

150

151

152
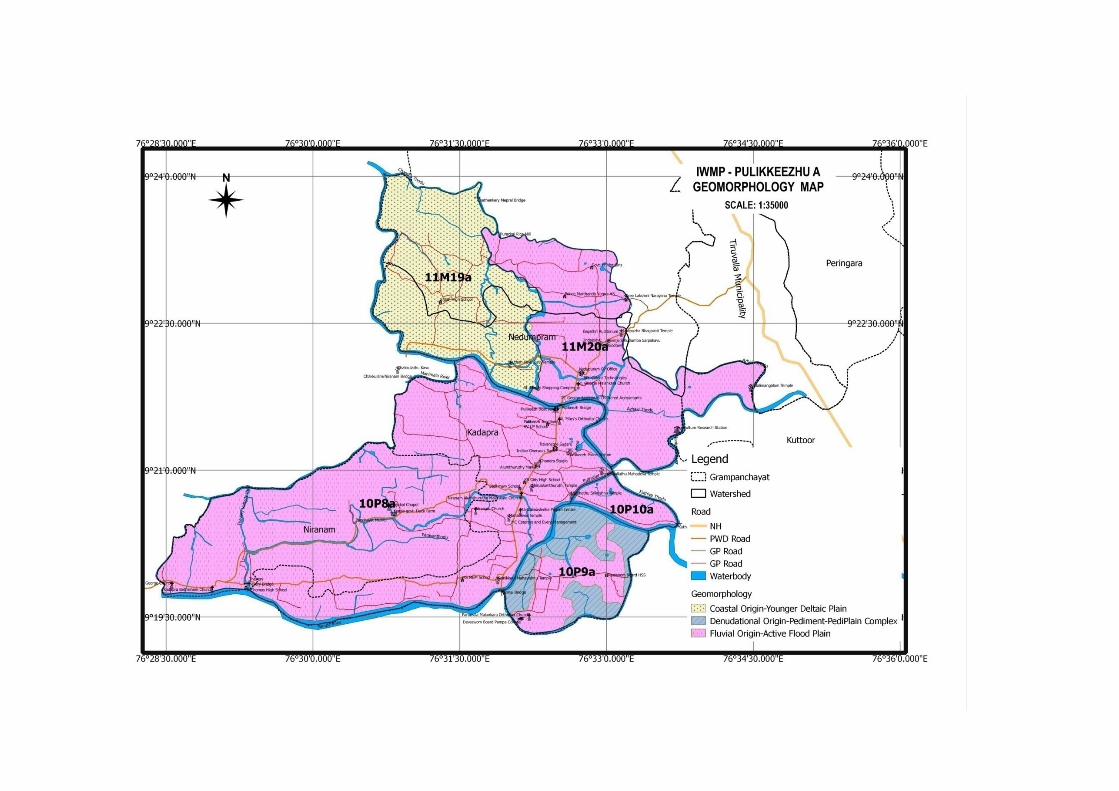
153

154

155

156

157
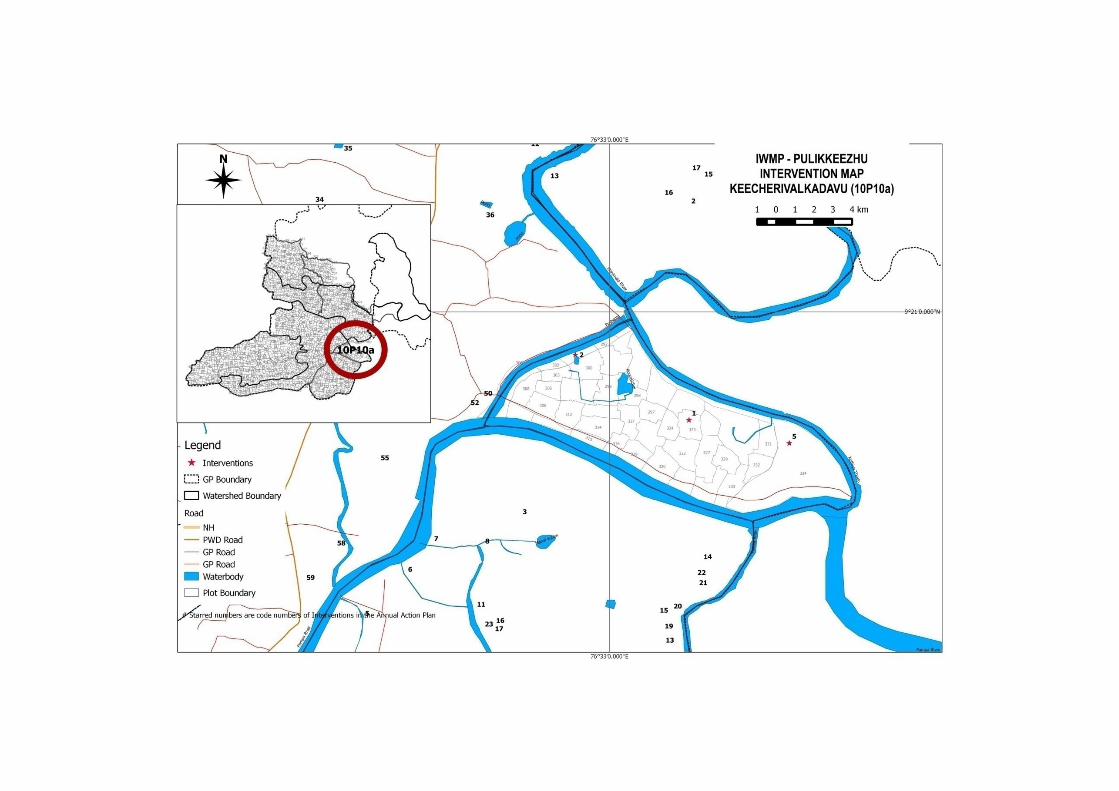
158

159
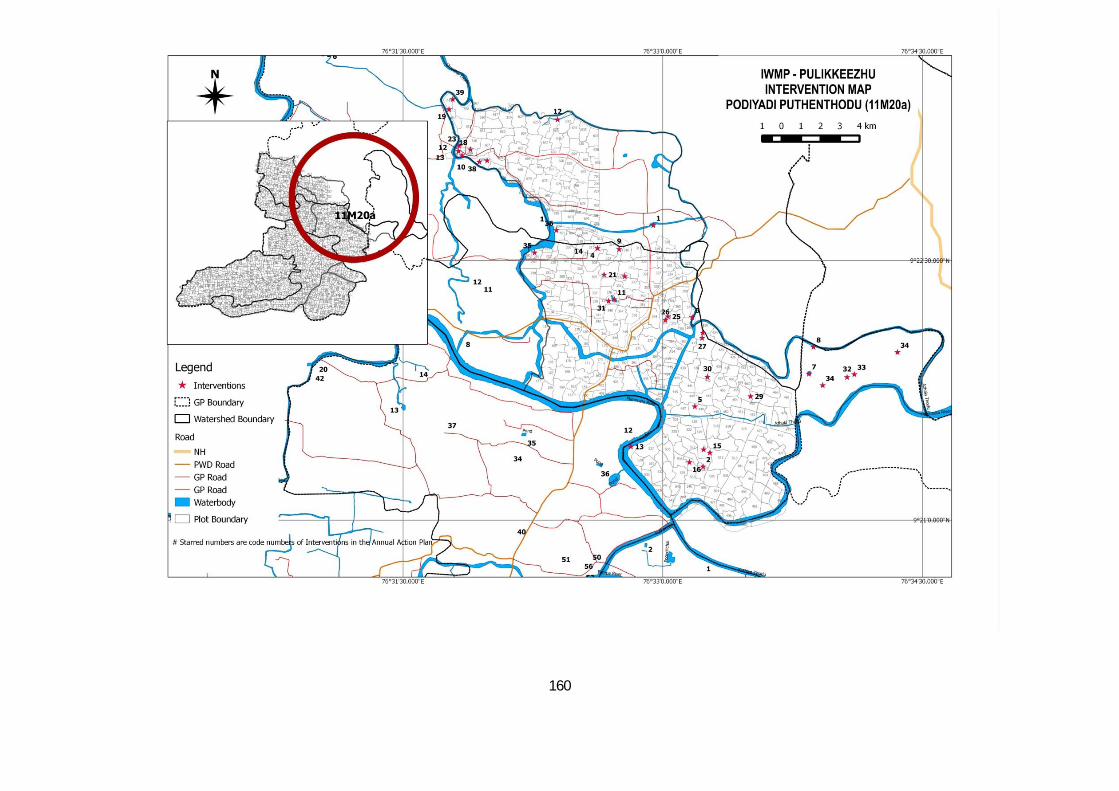
160


