Integrating 5-Hydroxymethylcytosine into the Epigenomic Landscape of Human Embryonic Stem Cells Keith E. Szulwach 1 , Xuekun Li 1 , Yujing Li 1 , Chun-Xiao Song 2 , Ji Woong Han 3 , SangSung Kim 3 , Sandeep Namburi 1 , Karen Hermetz 1 , Julie J. Kim 3 , M. Katharine Rudd 1 , Young-Sup Yoon 3 , Bing Ren 4,5,6 , Chuan He 2 , Peng Jin 1 * 1 Department of Human Genetics, Emory University School of Medicine, Atlanta, Georgia, United States of America, 2 Department of Chemistry and Institute for Biophysical Dynamics, The University of Chicago, Chicago, Illinois, United States of America, 3 Division of Cardiology, Department of Medicine, Emory University School of Medicine, Atlanta, Georgia, United States of America, 4 Ludwig Institute for Cancer Research, La Jolla, California, United States of America, 5 Department of Cellular and Molecular Medicine, Institute of Genomic Medicine, University of California San Diego, La Jolla, California, United States of America, 6 UCSD Moores Cancer Center, University of California San Diego, La Jolla, California, United States of America Abstract Covalent modification of DNA distinguishes cellular identities and is crucial for regulating the pluripotency and differentiation of embryonic stem (ES) cells. The recent demonstration that 5-methylcytosine (5-mC) may be further modified to 5-hydroxymethylcytosine (5-hmC) in ES cells has revealed a novel regulatory paradigm to modulate the epigenetic landscape of pluripotency. To understand the role of 5-hmC in the epigenomic landscape of pluripotent cells, here we profile the genome-wide 5-hmC distribution and correlate it with the genomic profiles of 11 diverse histone modifications and six transcription factors in human ES cells. By integrating genomic 5-hmC signals with maps of histone enrichment, we link particular pluripotency-associated chromatin contexts with 5-hmC. Intriguingly, through additional correlations with defined chromatin signatures at promoter and enhancer subtypes, we show distinct enrichment of 5-hmC at enhancers marked with H3K4me1 and H3K27ac. These results suggest potential role(s) for 5-hmC in the regulation of specific promoters and enhancers. In addition, our results provide a detailed epigenomic map of 5-hmC from which to pursue future functional studies on the diverse regulatory roles associated with 5-hmC. Citation: Szulwach KE, Li X, Li Y, Song C-X, Han JW, et al. (2011) Integrating 5-Hydroxymethylcytosine into the Epigenomic Landscape of Human Embryonic Stem Cells. PLoS Genet 7(6): e1002154. doi:10.1371/journal.pgen.1002154 Editor: Christopher E. Pearson, The Hospital for Sick Children and University of Toronto, Canada Received April 7, 2011; Accepted May 9, 2011; Published June 23, 2011 Copyright: ß 2011 Szulwach et al. This is an open-access article distributed under the terms of the Creative Commons Attribution License, which permits unrestricted use, distribution, and reproduction in any medium, provided the original author and source are credited. Funding: PJ is supported by NIH grants (NS051630 and MH076090). Y-SY is supported by NIH grant RC1GM092035. Work in the CH laboratory was partially supported by NIH GM071440. PJ is the recipient of a Beckman Young Investigator Award, Basil O’Connor Scholar Research Award, and Alfred P. Sloan Research Fellow in Neuroscience. This work is supported, in part, by the Emory Genetics Discovery Fund. The funders had no role in study design, data collection and analysis, decision to publish, or preparation of the manuscript. Competing Interests: The authors have declared that no competing interests exist. * E-mail: [email protected]Introduction The potency and fate of a cell can be influenced strongly by the covalent modification of cytosine methylation at carbon five. This critical epigenetic mark influences cellular potency and differentia- tion by modulating DNA-protein interactions, which direct epigenomic states and transcriptional processes, allowing otherwise common genomes to be expressed as distinct cell types. DNA- methylation-mediated epigenomic processes include dosage com- pensation, control over aberrant retrotransposon expression, and regulation of centromeric and telomeric heterochromatin [1]. The importance of such processes is exemplified by the essential requirement for DNA methyltransferases (DNMT1, DNMT3A, and DNMT3B) in embryonic and early mammalian development [2,3]. Coincident with critical roles for DNA methyltransferases in the regulation of pluripotency, Fe(II)/a-ketoglutarate-dependent hy- droxylation of 5-mC to 5-hydroxymethylcytosine (5-hmC) by Ten- eleven translocation (Tet) family proteins also contributes to the maintenance of pluripotency [4–6]. Discovery of this new epigenetic modification raises the possibility that 5-hmC could alter chromatin structure and thereby contribute to gene regulation. Recent functional studies have shown that Tet proteins, particularly Tet1 and Tet2, are required for ES cell self-renewal and maintenance. However, despite the emergence of these important roles for Tet family proteins, and therefore 5- hmC-associated regulation in ES cells, the genomic- and chromatin-associated contexts of 5-hmC have gone unexplored in human embryonic stem cells. Although there are detailed chromatin state maps of histone modifications in human embryonic stem cells, much less is known about the distinction between 5-hmC and 5-mC localization, largely because of the inability of bisulfite sequencing to resolve the two marks [7,8]. Recent studies indicate distinct differences in the presence of stable 5-hmC and Tet1 in mouse ES cells, where strong promoter-proximal Tet1 binding is inversely correlated with the presence of both 5-mC and 5-hmC [9–13], providing putative support for a Tet1-associated demethylation mechanism in the maintenance of unmethylated active promoters. Interestingly, these studies indicate that while Tet1 binding sites are highly enriched at transcription start sites (TSSs) in mouse ES cells, a significant fraction of detectable 5-hmC lies within gene bodies and other regulatory PLoS Genetics | www.plosgenetics.org 1 June 2011 | Volume 7 | Issue 6 | e1002154
Transcript
Integrating 5-Hydroxymethylcytosine into theEpigenomic Landscape of Human Embryonic Stem CellsKeith E. Szulwach1, Xuekun Li1, Yujing Li1, Chun-Xiao Song2, Ji Woong Han3, SangSung Kim3,
Sandeep Namburi1, Karen Hermetz1, Julie J. Kim3, M. Katharine Rudd1, Young-Sup Yoon3, Bing Ren4,5,6,
Chuan He2, Peng Jin1*
1Department of Human Genetics, Emory University School of Medicine, Atlanta, Georgia, United States of America, 2Department of Chemistry and Institute for
Biophysical Dynamics, The University of Chicago, Chicago, Illinois, United States of America, 3Division of Cardiology, Department of Medicine, Emory University School of
Medicine, Atlanta, Georgia, United States of America, 4 Ludwig Institute for Cancer Research, La Jolla, California, United States of America, 5Department of Cellular and
Molecular Medicine, Institute of Genomic Medicine, University of California San Diego, La Jolla, California, United States of America, 6UCSD Moores Cancer Center,
University of California San Diego, La Jolla, California, United States of America
Abstract
Covalent modification of DNA distinguishes cellular identities and is crucial for regulating the pluripotency anddifferentiation of embryonic stem (ES) cells. The recent demonstration that 5-methylcytosine (5-mC) may be furthermodified to 5-hydroxymethylcytosine (5-hmC) in ES cells has revealed a novel regulatory paradigm to modulate theepigenetic landscape of pluripotency. To understand the role of 5-hmC in the epigenomic landscape of pluripotent cells,here we profile the genome-wide 5-hmC distribution and correlate it with the genomic profiles of 11 diverse histonemodifications and six transcription factors in human ES cells. By integrating genomic 5-hmC signals with maps of histoneenrichment, we link particular pluripotency-associated chromatin contexts with 5-hmC. Intriguingly, through additionalcorrelations with defined chromatin signatures at promoter and enhancer subtypes, we show distinct enrichment of 5-hmCat enhancers marked with H3K4me1 and H3K27ac. These results suggest potential role(s) for 5-hmC in the regulation ofspecific promoters and enhancers. In addition, our results provide a detailed epigenomic map of 5-hmC from which topursue future functional studies on the diverse regulatory roles associated with 5-hmC.
Citation: Szulwach KE, Li X, Li Y, Song C-X, Han JW, et al. (2011) Integrating 5-Hydroxymethylcytosine into the Epigenomic Landscape of Human Embryonic StemCells. PLoS Genet 7(6): e1002154. doi:10.1371/journal.pgen.1002154
Editor: Christopher E. Pearson, The Hospital for Sick Children and University of Toronto, Canada
Received April 7, 2011; Accepted May 9, 2011; Published June 23, 2011
Copyright: ! 2011 Szulwach et al. This is an open-access article distributed under the terms of the Creative Commons Attribution License, which permitsunrestricted use, distribution, and reproduction in any medium, provided the original author and source are credited.
Funding: PJ is supported by NIH grants (NS051630 and MH076090). Y-SY is supported by NIH grant RC1GM092035. Work in the CH laboratory was partiallysupported by NIH GM071440. PJ is the recipient of a Beckman Young Investigator Award, Basil O’Connor Scholar Research Award, and Alfred P. Sloan ResearchFellow in Neuroscience. This work is supported, in part, by the Emory Genetics Discovery Fund. The funders had no role in study design, data collection andanalysis, decision to publish, or preparation of the manuscript.
Competing Interests: The authors have declared that no competing interests exist.
The potency and fate of a cell can be influenced strongly by thecovalent modification of cytosine methylation at carbon five. Thiscritical epigenetic mark influences cellular potency and differentia-tion by modulating DNA-protein interactions, which directepigenomic states and transcriptional processes, allowing otherwisecommon genomes to be expressed as distinct cell types. DNA-methylation-mediated epigenomic processes include dosage com-pensation, control over aberrant retrotransposon expression, andregulation of centromeric and telomeric heterochromatin [1]. Theimportance of such processes is exemplified by the essentialrequirement for DNA methyltransferases (DNMT1, DNMT3A,and DNMT3B) in embryonic and early mammalian development[2,3].Coincident with critical roles for DNA methyltransferases in the
regulation of pluripotency, Fe(II)/a-ketoglutarate-dependent hy-droxylation of 5-mC to 5-hydroxymethylcytosine (5-hmC) by Ten-eleven translocation (Tet) family proteins also contributes to themaintenance of pluripotency [4–6]. Discovery of this newepigenetic modification raises the possibility that 5-hmC could
alter chromatin structure and thereby contribute to generegulation. Recent functional studies have shown that Tetproteins, particularly Tet1 and Tet2, are required for ES cellself-renewal and maintenance. However, despite the emergence ofthese important roles for Tet family proteins, and therefore 5-hmC-associated regulation in ES cells, the genomic- andchromatin-associated contexts of 5-hmC have gone unexploredin human embryonic stem cells.Although there are detailed chromatin state maps of histone
modifications in human embryonic stem cells, much less is knownabout the distinction between 5-hmC and 5-mC localization, largelybecause of the inability of bisulfite sequencing to resolve the twomarks [7,8]. Recent studies indicate distinct differences in thepresence of stable 5-hmC and Tet1 in mouse ES cells, where strongpromoter-proximal Tet1 binding is inversely correlated with thepresence of both 5-mC and 5-hmC [9–13], providing putativesupport for a Tet1-associated demethylation mechanism in themaintenance of unmethylated active promoters. Interestingly, thesestudies indicate that while Tet1 binding sites are highly enriched attranscription start sites (TSSs) in mouse ES cells, a significant fractionof detectable 5-hmC lies within gene bodies and other regulatory
regions, which is also consistent with our previous study mapping 5-hmC genome-wide in mouse cerebellum [14]. Furthermore, atregions bound by both Polycomb (PRC2) and Tet1, the presence of5-hmC is associated with a repressive state, indicating diverseregulatory roles for 5-hmC that depend at least in part on itschromatin context. Whether localization of 5-hmCwith other distinctchromatin signatures results in diverse regulatory mechanismsremains to be explored.To unravel the biology of 5-hmC, we recently developed a
selective chemical labeling method for 5-hmC by using T4bacteriophage ß-glucosyltransferase to transfer an engineeredglucose moiety containing an azide group onto the hydroxylgroup of 5-hmC, which in turn can chemically incorporate a
biotin group for detection, affinity enrichment, and sequencing.Here, to understand the role of 5-hmC in the epigenomiclandscape of pluripotent cells, we profiled the genome-wide 5-hmC distribution and correlated it with the genomic profiles of 11diverse histone modifications and six transcription factors inhuman ES cells. By integrating genomic 5-hmC signals with mapsof histone enrichment, we link particular pluripotency-associatedchromatin contexts with 5-hmC. Intriguingly, through additionalcorrelations with defined chromatin signatures at promoter andenhancer subtypes, we found distinct enrichment of 5-hmC atenhancers marked with H3K4me1 and H3K27ac. These resultssuggest potential role(s) for 5-hmC in the regulation of specificpromoters and enhancers. In addition, our results provide adetailed epigenomic map of 5-hmC from which to pursue futurefunctional studies on the diverse regulatory roles associated with 5-hmC.
Results
Exclusion of 5-hmC from metaphase pericentromericheterochromatinTo assess the distribution and general chromatin context of 5-
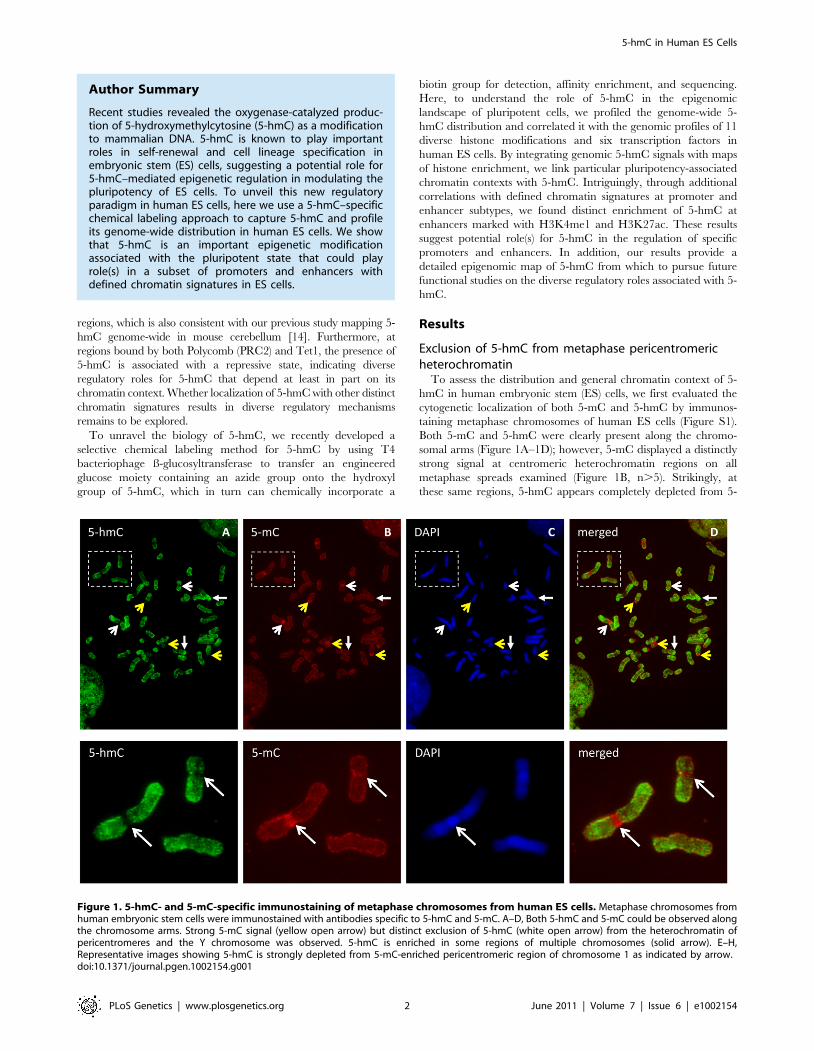
hmC in human embryonic stem (ES) cells, we first evaluated thecytogenetic localization of both 5-mC and 5-hmC by immunos-taining metaphase chromosomes of human ES cells (Figure S1).Both 5-mC and 5-hmC were clearly present along the chromo-somal arms (Figure 1A–1D); however, 5-mC displayed a distinctlystrong signal at centromeric heterochromatin regions on allmetaphase spreads examined (Figure 1B, n.5). Strikingly, atthese same regions, 5-hmC appears completely depleted from 5-
Figure 1. 5-hmC- and 5-mC-specific immunostaining of metaphase chromosomes from human ES cells. Metaphase chromosomes fromhuman embryonic stem cells were immunostained with antibodies specific to 5-hmC and 5-mC. A–D, Both 5-hmC and 5-mC could be observed alongthe chromosome arms. Strong 5-mC signal (yellow open arrow) but distinct exclusion of 5-hmC (white open arrow) from the heterochromatin ofpericentromeres and the Y chromosome was observed. 5-hmC is enriched in some regions of multiple chromosomes (solid arrow). E–H,Representative images showing 5-hmC is strongly depleted from 5-mC-enriched pericentromeric region of chromosome 1 as indicated by arrow.doi:10.1371/journal.pgen.1002154.g001
Author Summary
Recent studies revealed the oxygenase-catalyzed produc-tion of 5-hydroxymethylcytosine (5-hmC) as a modificationto mammalian DNA. 5-hmC is known to play importantroles in self-renewal and cell lineage specification inembryonic stem (ES) cells, suggesting a potential role for5-hmC–mediated epigenetic regulation in modulating thepluripotency of ES cells. To unveil this new regulatoryparadigm in human ES cells, here we use a 5-hmC–specificchemical labeling approach to capture 5-hmC and profileits genome-wide distribution in human ES cells. We showthat 5-hmC is an important epigenetic modificationassociated with the pluripotent state that could playrole(s) in a subset of promoters and enhancers withdefined chromatin signatures in ES cells.
mC-enriched pericentromeric regions (Figure 1A, 1E–1H). Givenboth the defined epigenetic architecture and distinct sequencecontent of relatively stable centromeric heterochromatic regions,these results may suggest an association of 5-hmC with moreepigenetically dynamic loci, such as those throughout chromosomearms, and perhaps exclusion from more epigenetically stableheterochromatin, such as that present in metaphase centromeres.
Genomic features associated with 5-hmC in humanembryonic stem cellsTo further evaluate the epigenomic context of 5-hmC, we first
established a genome-wide map of 5-hmC in human H1 ES cells byselectively enriching 5-hmC-containing fragments of DNA andsubjecting them to high-throughput sequencing. We used a previouslyestablished approach to transfer a chemically modified glucose moiety,6-N3-glucose, onto the hydroxyl group of 5-hmC, which in turnsallows cycloaddition of biotin for affinity enrichment and deepsequencing. We prepared and sequenced libraries from 5-hmC-enriched as well as unenriched DNA from the same preparation andsequenced to a depth of.10 million unique, non-duplicate reads per
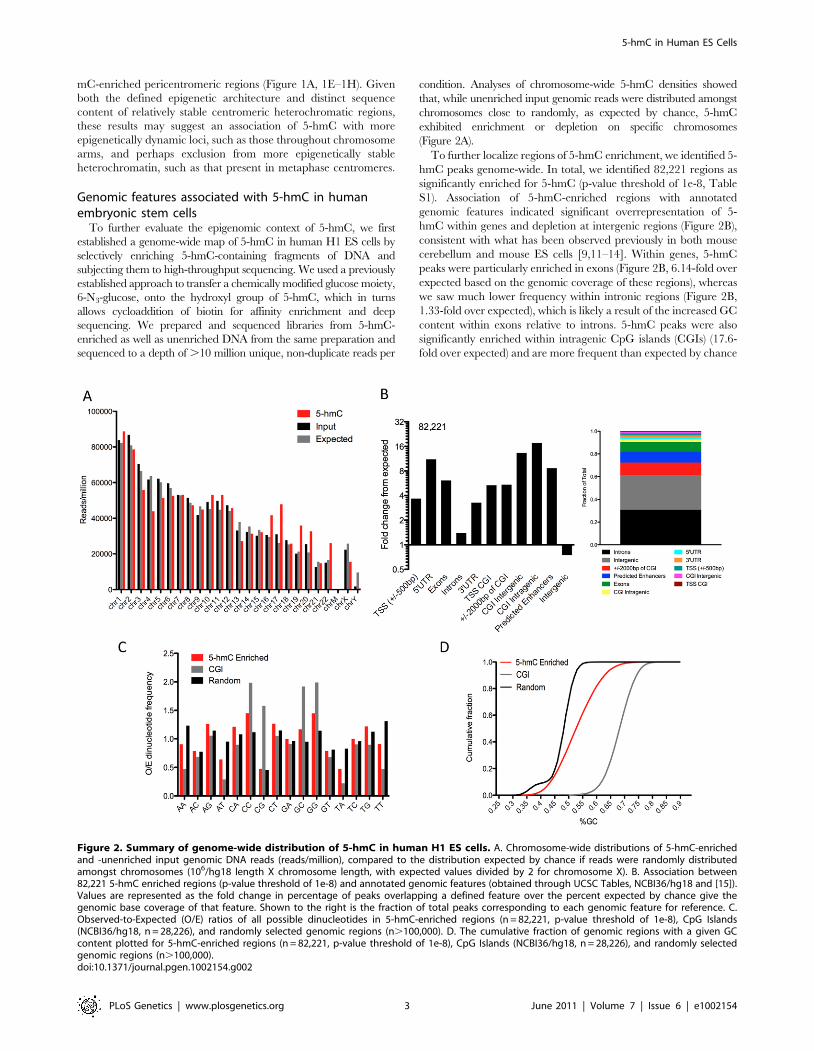
condition. Analyses of chromosome-wide 5-hmC densities showedthat, while unenriched input genomic reads were distributed amongstchromosomes close to randomly, as expected by chance, 5-hmCexhibited enrichment or depletion on specific chromosomes(Figure 2A).To further localize regions of 5-hmC enrichment, we identified 5-
hmC peaks genome-wide. In total, we identified 82,221 regions assignificantly enriched for 5-hmC (p-value threshold of 1e-8, TableS1). Association of 5-hmC-enriched regions with annotatedgenomic features indicated significant overrepresentation of 5-hmC within genes and depletion at intergenic regions (Figure 2B),consistent with what has been observed previously in both mousecerebellum and mouse ES cells [9,11–14]. Within genes, 5-hmCpeaks were particularly enriched in exons (Figure 2B, 6.14-fold overexpected based on the genomic coverage of these regions), whereaswe saw much lower frequency within intronic regions (Figure 2B,1.33-fold over expected), which is likely a result of the increased GCcontent within exons relative to introns. 5-hmC peaks were alsosignificantly enriched within intragenic CpG islands (CGIs) (17.6-fold over expected) and are more frequent than expected by chance
Figure 2. Summary of genome-wide distribution of 5-hmC in human H1 ES cells. A. Chromosome-wide distributions of 5-hmC-enrichedand -unenriched input genomic DNA reads (reads/million), compared to the distribution expected by chance if reads were randomly distributedamongst chromosomes (106/hg18 length X chromosome length, with expected values divided by 2 for chromosome X). B. Association between82,221 5-hmC enriched regions (p-value threshold of 1e-8) and annotated genomic features (obtained through UCSC Tables, NCBI36/hg18 and [15]).Values are represented as the fold change in percentage of peaks overlapping a defined feature over the percent expected by chance give thegenomic base coverage of that feature. Shown to the right is the fraction of total peaks corresponding to each genomic feature for reference. C.Observed-to-Expected (O/E) ratios of all possible dinucleotides in 5-hmC-enriched regions (n = 82,221, p-value threshold of 1e-8), CpG Islands(NCBI36/hg18, n = 28,226), and randomly selected genomic regions (n.100,000). D. The cumulative fraction of genomic regions with a given GCcontent plotted for 5-hmC-enriched regions (n = 82,221, p-value threshold of 1e-8), CpG Islands (NCBI36/hg18, n = 28,226), and randomly selectedgenomic regions (n.100,000).doi:10.1371/journal.pgen.1002154.g002
at intergenic CGIs (Figure 2B). Interestingly, we find significantlymore 5-hmC peaks overlapping predicted enhancers than wasexpected (8.6-fold over expected, Figure 2B). These results indicatethat in addition to gene body-associated regulatory roles, 5-hmCmay also function within other genomic regions important for genemodulation.We also assessed the general sequence content of these peaks,
including GC content and dinucleotide frequencies. We found thatthe frequency of CpG dinucleotides within 5-hmC-enrichedregions was no greater than randomly chosen regions of thegenome and significantly lower than CGIs, whereas CA, CC, andCT dinucleotides each exhibited an O/E .1 and enrichmentrelative to random genomic locations (Figure 2C). Furthermore,GC content as a whole was significantly reduced compared withCGIs, and slightly increased relative to random genomic loci(Figure 2D). These data suggest that 5-hmC-enriched loci occurmost often in regions of the genome with moderate GC contentand that it occurs less frequently within a high density of CpGs.
Genome-wide association among 5-hmC, 5-mC, and 11histone modificationsIn order to determine the specific chromatin contexts associated
with 5-hmC in human embryonic stem cells, we obtained sequence
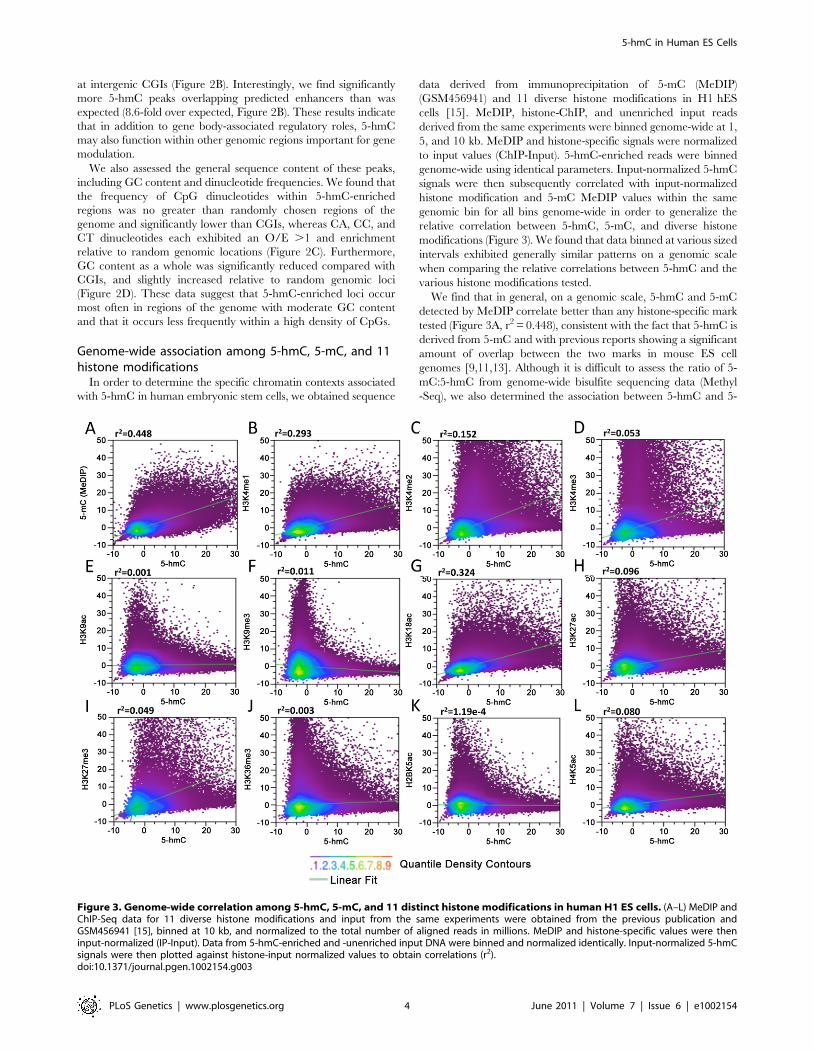
data derived from immunoprecipitation of 5-mC (MeDIP)(GSM456941) and 11 diverse histone modifications in H1 hEScells [15]. MeDIP, histone-ChIP, and unenriched input readsderived from the same experiments were binned genome-wide at 1,5, and 10 kb. MeDIP and histone-specific signals were normalizedto input values (ChIP-Input). 5-hmC-enriched reads were binnedgenome-wide using identical parameters. Input-normalized 5-hmCsignals were then subsequently correlated with input-normalizedhistone modification and 5-mC MeDIP values within the samegenomic bin for all bins genome-wide in order to generalize therelative correlation between 5-hmC, 5-mC, and diverse histonemodifications (Figure 3). We found that data binned at various sizedintervals exhibited generally similar patterns on a genomic scalewhen comparing the relative correlations between 5-hmC and thevarious histone modifications tested.We find that in general, on a genomic scale, 5-hmC and 5-mC
detected by MeDIP correlate better than any histone-specific marktested (Figure 3A, r2 = 0.448), consistent with the fact that 5-hmC isderived from 5-mC and with previous reports showing a significantamount of overlap between the two marks in mouse ES cellgenomes [9,11,13]. Although it is difficult to assess the ratio of 5-mC:5-hmC from genome-wide bisulfite sequencing data (Methyl-Seq), we also determined the association between 5-hmC and 5-
Figure 3. Genome-wide correlation among 5-hmC, 5-mC, and 11 distinct histone modifications in human H1 ES cells. (A–L) MeDIP andChIP-Seq data for 11 diverse histone modifications and input from the same experiments were obtained from the previous publication andGSM456941 [15], binned at 10 kb, and normalized to the total number of aligned reads in millions. MeDIP and histone-specific values were theninput-normalized (IP-Input). Data from 5-hmC-enriched and -unenriched input DNA were binned and normalized identically. Input-normalized 5-hmCsignals were then plotted against histone-input normalized values to obtain correlations (r2).doi:10.1371/journal.pgen.1002154.g003
mC+5-hmC detected by Methyl-Seq (Figure S2). Within the CGcontext, regions with higher 5-hmC also tend to have a higherpercentage of 5-mC+5-hmC, as would be expected. However, thereare also a large number of regions with a high percentage of 5-mC+5-hmC that contain very low levels of 5-hmC and are thereforepresumably dominated by 5-mC (Figure S2A). These results areagain consistent with the notion that 5-hmC is derived from 5-mC.We also compared 5-hmC signals to 5-mC+5-hmC within the non-CpG context, which occurs in human ES cells more frequently thanin differentiated cell types [16]. 5-hmC has been reported to occurwithin non-CpG contexts in mouse ES cells as well [11]. Ouranalyses indicate that regions containing high levels of 5-hmC tendto harbor less non-CpG methylation (Figure S2B and S2C).However, due to the low percentage of both CHG and CHHmethylation throughout the genome, it is difficult to resolve theextent to which 5-hmCmay occur at non-CpG sites and analyses donot exclude the possibility that 5-hmC occurs within a non-CpGcontext in human ES cells. Further resolution of single base pair 5-hmCwill be required to conclusively establish the sequence contextsof hydroxymethylated cytosines.Correlations between 5-hmC and the 11 histone modifications
tested were largely, with a few notable exceptions, in agreement withthe previously observed associations between histone modificationsand the percentage of overall DNA methylation (5-mC+5-hmC)assessed by Methyl-Seq [15]. Consistent with the correlationsbetween Methyl-Seq and histone modifications, we find a relativelystrong association between 5-hmC and H3K4me1 (r2= 0.293) andH3K4me2 (r2=0.152) compared with H3K4me3 (r2=0.0518)(Figure 3B–3D). The relatively strong correlations between 5-hmC,H3K4me1, and H3K4me2 compared to H3K4me3 are alsoconsistent with earlier observations showing enrichment of 5-hmCwithin active gene bodies, but depletion at TSSs. We also saw arelatively strong correlation between H3K18ac, a mark that directlyregulated CBP/p300 enhancer complexes with transcriptionalactivation [17,18], and 5-hmC (Figure 3G, r2= 0.324). A significantlysmaller albeit moderate correlation was found between 5-hmC andH3K27ac, H3K27me3 (with H3K27ac . H3K27me3), andH4K5ac (Figure 3H, 3I and 3L). Both H3K9ac and H3K9me3exhibited relatively low levels of correlation with 5-hmC (Figure 3Eand 3F). Surprisingly, we see a relatively weak correlation between 5-hmC and H3K36me3 (Figure 3J). H3K36me3 is known to correlatewell with gene expression levels and has been linked to transcriptionalelongation in hES cells [19], but is largely absent from TSSs.H3K36me3 is also one of the few histone marks for which there is astrong correlation with methylated DNA, as detected by bisulfitesequencing [15]. These results suggest the possible enrichment ofH3K36me3 or 5-hmC on distinct groups of gene bodies in hES cells,which could depend on the level of gene expression.Together, the correlations between 5-hmC, 5-mC, and the 11
specific histone modifications tested indicate that, in addition tobeing generally associated with more euchromatic accessiblechromatin, 5-hmC may be linked to diverse gene regulatoryelements and transcriptional regulatory processes in human ES cells.
Expression level–dependent distribution of 5-hmC atpromoter-proximal regionsBoth cytogenetic localization of 5-hmC and genome-wide
correlations with 11 diverse histone modifications indicate linksbetween 5-hmC, more accessible euchromatic chromatin, andgene regulation. To test the dependence of gene-associated 5-hmC distributions on expression levels in human ES cells, wemeasured 5-hmC signals at genes with varying expression asmeasured by RNA-Seq RPKM [16]. Overall, 5-hmC displays astrong promoter-proximal bias in hES cells, while also being
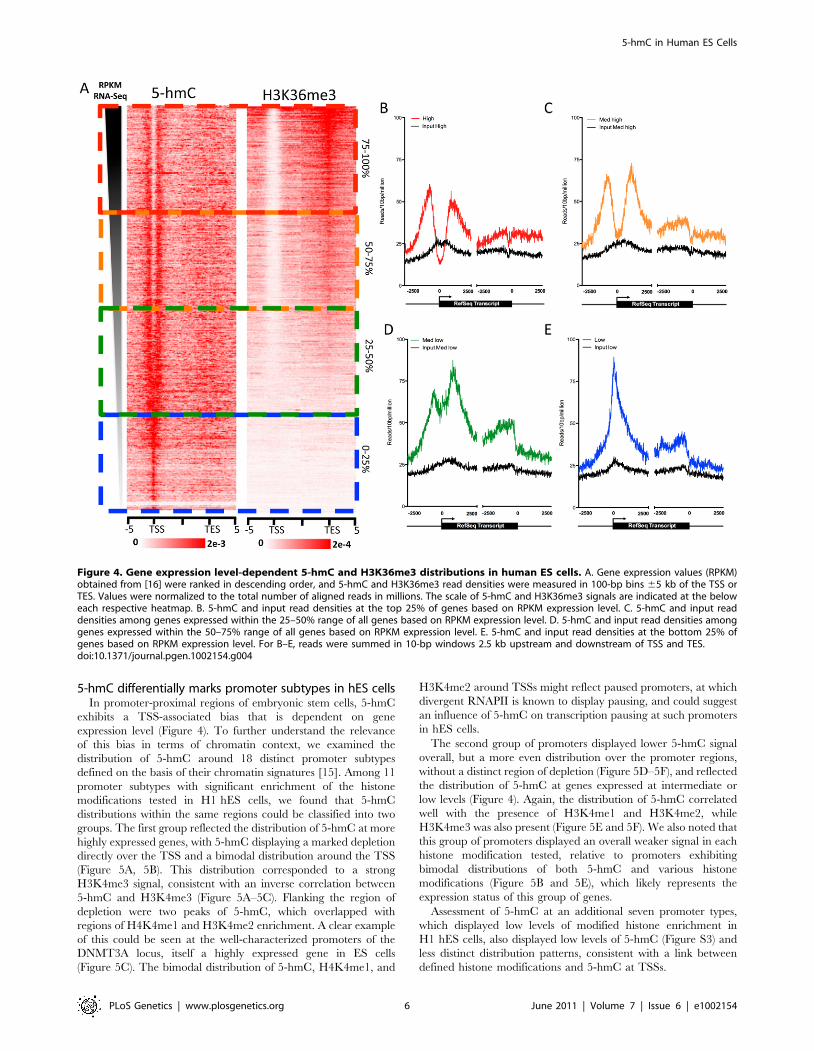
enriched within gene bodies, albeit to a lesser degree relative tothe TSS (Figure 4A–4E). Interestingly, we observed a distinctforking in the 5-hmC distribution around the TSS as expressionlevels rose, ultimately transitioning to a bimodal distribution atmore highly expressed genes compared with genes expressed atlower levels (Figure 4A–4E). However, the correlation between5-hmC and both TSSs and gene bodies is not strictly linear. 5-hmC tends to be higher, both within the gene body and at theTSS, at genes expressed within the 25–75% range of all genesbased on RNA-Seq RPKM (Figure 4C and 4D), compared tothe top 25% of expressed genes (Figure 4A). Meanwhile, atgenes within the bottom 25%, 5-hmC is mainly enriched directlyover the TSS and only moderately enriched within the genebody. Thus, at genes exhibiting lower expression, 5-hmC ispresent directly at the TSS (Figure 4E), whereas genes withintermediate expression display higher gene body 5-hmC and adistinct bimodal distribution (Figure 4A) at the TSS. At the mosthighly expressed genes, 5-hmC exhibits a similar distribution tothat seen on intermediately expressed genes, but overall lowerlevels at both the TSS and gene body. These results areconsistent with the observed dual function of 5-hmC in mouseES cells, where the Polycomb complex PRC2 may act incombination with Tet1 to influence the distribution of 5-hmC atrepressed genes, while at more highly expressed genes thepresence of Tet1, without PRC2, results in loss of 5-hmC at theTSS and establishment of a bimodal distribution [9,10].To further explore the enrichment of 5-hmC at gene bodies with
intermediate levels of expression, we directly compared thedistribution of 5-hmC to that of H3K36me3 in and around genesranked by expression level (Figure 4A). H3K36me3 is anintragenically enriched histone modification that also correlates wellwith gene expression levels [19]. We found that genes with the highestintragenic 5-hmC also had relatively low intragenic H3K36me3(Figure 4A), consistent with the relatively low genome-widecorrelations between binned 5-hmC and H3K36me3 (Figure 3J).The same genes were also those expressed at intermediate levels (25–75% range based on RNA-Seq RPKM). At the top 25% of expressedgenes, H3K36me3 is highly enriched within gene bodies andtranscription end sites (TES), while 5-hmC tends to be lower at bothTSSs and gene bodies compared to genes expressed at intermediatelevels (Figure 4A). These data suggest a complex relationship between5-hmC, H3K36me3, and gene expression levels in human ES cells.One possible explanation could be that 5-hmC functions to tempertranscription at the genes that are not fully committed to aconstitutive expression state. At genes expressed at the lowest levels,5-hmC may play a role at the TSS to represses full-lengthtranscription, while still maintaining the transcriptional potential ofthe marked genes. Such a role is consistent with the previouslyreported interaction between TSS 5-hmC and repression byPolycomb group complexes, which repress many developmentallyregulated genes in ES cells [9,10]. At the genes with intermediateexpression levels, 5-hmC may temper expression at both TSS andgene body. At genes with the highest expression, TSS- and genebody-associated 5-hmC may be, at least in part, replaced byH3K36me3 to allow full transcriptional potential.We note that such distributions of 5-hmC in ES cells is distinct
from that observed in mouse brain, where 5-hmC is largely depletedfrom TSSs, enriched within gene bodies, and correlates well withgene expression levels (Szulwach and Jin, unpublished observationsand [14]). These differences may reflect stem cell-specific and brain-specific roles for 5-hmC-mediated gene regulation. Such differencesmay be accounted for by the relative enrichment of Tet1 in ES cellsand/or yet-to-be-identified Tet-family co-factors compared to moredifferentiated cell types.
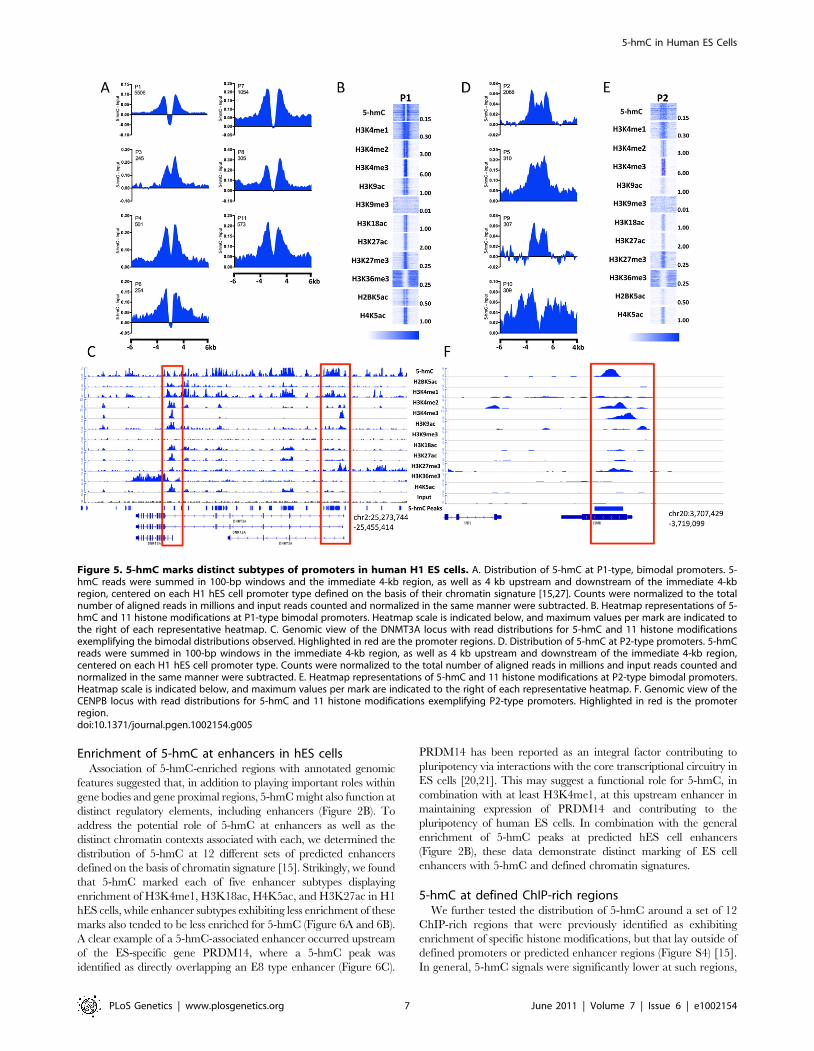
5-hmC differentially marks promoter subtypes in hES cellsIn promoter-proximal regions of embryonic stem cells, 5-hmC
exhibits a TSS-associated bias that is dependent on geneexpression level (Figure 4). To further understand the relevanceof this bias in terms of chromatin context, we examined thedistribution of 5-hmC around 18 distinct promoter subtypesdefined on the basis of their chromatin signatures [15]. Among 11promoter subtypes with significant enrichment of the histonemodifications tested in H1 hES cells, we found that 5-hmCdistributions within the same regions could be classified into twogroups. The first group reflected the distribution of 5-hmC at morehighly expressed genes, with 5-hmC displaying a marked depletiondirectly over the TSS and a bimodal distribution around the TSS(Figure 5A, 5B). This distribution corresponded to a strongH3K4me3 signal, consistent with an inverse correlation between5-hmC and H3K4me3 (Figure 5A–5C). Flanking the region ofdepletion were two peaks of 5-hmC, which overlapped withregions of H4K4me1 and H3K4me2 enrichment. A clear exampleof this could be seen at the well-characterized promoters of theDNMT3A locus, itself a highly expressed gene in ES cells(Figure 5C). The bimodal distribution of 5-hmC, H4K4me1, and
H3K4me2 around TSSs might reflect paused promoters, at whichdivergent RNAPII is known to display pausing, and could suggestan influence of 5-hmC on transcription pausing at such promotersin hES cells.The second group of promoters displayed lower 5-hmC signal
overall, but a more even distribution over the promoter regions,without a distinct region of depletion (Figure 5D–5F), and reflectedthe distribution of 5-hmC at genes expressed at intermediate orlow levels (Figure 4). Again, the distribution of 5-hmC correlatedwell with the presence of H3K4me1 and H3K4me2, whileH3K4me3 was also present (Figure 5E and 5F). We also noted thatthis group of promoters displayed an overall weaker signal in eachhistone modification tested, relative to promoters exhibitingbimodal distributions of both 5-hmC and various histonemodifications (Figure 5B and 5E), which likely represents theexpression status of this group of genes.Assessment of 5-hmC at an additional seven promoter types,
which displayed low levels of modified histone enrichment inH1 hES cells, also displayed low levels of 5-hmC (Figure S3) andless distinct distribution patterns, consistent with a link betweendefined histone modifications and 5-hmC at TSSs.
Figure 4. Gene expression level-dependent 5-hmC and H3K36me3 distributions in human ES cells. A. Gene expression values (RPKM)obtained from [16] were ranked in descending order, and 5-hmC and H3K36me3 read densities were measured in 100-bp bins 65 kb of the TSS orTES. Values were normalized to the total number of aligned reads in millions. The scale of 5-hmC and H3K36me3 signals are indicated at the beloweach respective heatmap. B. 5-hmC and input read densities at the top 25% of genes based on RPKM expression level. C. 5-hmC and input readdensities among genes expressed within the 25–50% range of all genes based on RPKM expression level. D. 5-hmC and input read densities amonggenes expressed within the 50–75% range of all genes based on RPKM expression level. E. 5-hmC and input read densities at the bottom 25% ofgenes based on RPKM expression level. For B–E, reads were summed in 10-bp windows 2.5 kb upstream and downstream of TSS and TES.doi:10.1371/journal.pgen.1002154.g004
Enrichment of 5-hmC at enhancers in hES cellsAssociation of 5-hmC-enriched regions with annotated genomic
features suggested that, in addition to playing important roles withingene bodies and gene proximal regions, 5-hmCmight also function atdistinct regulatory elements, including enhancers (Figure 2B). Toaddress the potential role of 5-hmC at enhancers as well as thedistinct chromatin contexts associated with each, we determined thedistribution of 5-hmC at 12 different sets of predicted enhancersdefined on the basis of chromatin signature [15]. Strikingly, we foundthat 5-hmC marked each of five enhancer subtypes displayingenrichment of H3K4me1, H3K18ac, H4K5ac, and H3K27ac in H1hES cells, while enhancer subtypes exhibiting less enrichment of thesemarks also tended to be less enriched for 5-hmC (Figure 6A and 6B).A clear example of a 5-hmC-associated enhancer occurred upstreamof the ES-specific gene PRDM14, where a 5-hmC peak wasidentified as directly overlapping an E8 type enhancer (Figure 6C).
PRDM14 has been reported as an integral factor contributing topluripotency via interactions with the core transcriptional circuitry inES cells [20,21]. This may suggest a functional role for 5-hmC, incombination with at least H3K4me1, at this upstream enhancer inmaintaining expression of PRDM14 and contributing to thepluripotency of human ES cells. In combination with the generalenrichment of 5-hmC peaks at predicted hES cell enhancers(Figure 2B), these data demonstrate distinct marking of ES cellenhancers with 5-hmC and defined chromatin signatures.
5-hmC at defined ChIP-rich regionsWe further tested the distribution of 5-hmC around a set of 12
ChIP-rich regions that were previously identified as exhibitingenrichment of specific histone modifications, but that lay outside ofdefined promoters or predicted enhancer regions (Figure S4) [15].In general, 5-hmC signals were significantly lower at such regions,
Figure 5. 5-hmC marks distinct subtypes of promoters in human H1 ES cells. A. Distribution of 5-hmC at P1-type, bimodal promoters. 5-hmC reads were summed in 100-bp windows and the immediate 4-kb region, as well as 4 kb upstream and downstream of the immediate 4-kbregion, centered on each H1 hES cell promoter type defined on the basis of their chromatin signature [15,27]. Counts were normalized to the totalnumber of aligned reads in millions and input reads counted and normalized in the same manner were subtracted. B. Heatmap representations of 5-hmC and 11 histone modifications at P1-type bimodal promoters. Heatmap scale is indicated below, and maximum values per mark are indicated tothe right of each representative heatmap. C. Genomic view of the DNMT3A locus with read distributions for 5-hmC and 11 histone modificationsexemplifying the bimodal distributions observed. Highlighted in red are the promoter regions. D. Distribution of 5-hmC at P2-type promoters. 5-hmCreads were summed in 100-bp windows in the immediate 4-kb region, as well as 4 kb upstream and downstream of the immediate 4-kb region,centered on each H1 hES cell promoter type. Counts were normalized to the total number of aligned reads in millions and input reads counted andnormalized in the same manner were subtracted. E. Heatmap representations of 5-hmC and 11 histone modifications at P2-type bimodal promoters.Heatmap scale is indicated below, and maximum values per mark are indicated to the right of each representative heatmap. F. Genomic view of theCENPB locus with read distributions for 5-hmC and 11 histone modifications exemplifying P2-type promoters. Highlighted in red is the promoterregion.doi:10.1371/journal.pgen.1002154.g005
and few patterns were apparent. However, we did find that ChIP-rich regions with H3K36me3 displayed markedly lower levels of 5-hmC and that regions enriched for K3K9me3 actually exhibiteddepletion of 5-hmC (Figure S2), consistent with the lower genome-wide correlations we found between 5-hmC and these two histonemodifications (Figure 4E and 4I).
5-hmC at pluripotency-associated transcription factorbinding sitesDNA methylation has been implicated in regulating transcrip-
tion factor binding dynamics and has been found to differentiallymark sites of core pluripotency-associated transcription factors inES cells [16]. We therefore asked whether or not 5-hmC markedsites bound by six transcription factors mapped genome-wide inH1 hES cells, including the pluripotency-associated transcriptionfactors NANOG, OCT4, and SOX2, as well as more generalfactors, such as p300 and TAF1 (Figure 7). At sites of all types wecould detect a slight enrichment of 5-hmC and direct overlapbetween subsets of 5-hmC peaks and transcription factor binding
sites, consistent with previous observations in mouse ES cellsdetecting 5-hmC at transcription factor binding sites [9,11,13].However, signals varied across factors. Among pluripotency-related factors, we find distinct marking and enrichment of 5-hmCat of only NANOG sites (Figure 7A). An example of 5-hmCenrichment at a NANOG binding site was seen directly upstreamof DNMT3B (Figure 7B), a gene expressed a high levels in EScells. Consistent with a lack of 5-hmC at many TSSs, we alsoobserve depletion of 5-hmC at TAF1 interaction sites (Figure 7A).Although we observed good correlation between histone mod-
ifications demarcating enhancers and enrichment of 5-hmC atspecific subtypes of enhancers defined by chromatin signature, wedid not observe distinct 5-hmC marking at p300 sites (Figure 7A).We further addressed this by asking what the overlap was betweenthe 82,221 identified 5-hmC enriched regions (Table S1), predictedenhancers [15] and p300 sites [16]. As expected a large proportion ofp300 sites (1795 of 3094, 58%) overlap predicted enhancers(Figure 7C). However, the fraction of predicted enhancers explainedby p300 binding remained quite low (1,795 of 58,023, 3.1%),
Figure 6. Enrichment of 5-hmC at specific enhancers in human H1 ES cells. A. 5-hmC reads were summed in 100-bp windows in theimmediate 4-kb region, as well as 4 kb upstream and downstream of the immediate 4-kb region, centered on each of 12 predicted H1 hES cellenhancers defined on the basis of their chromatin signature [15,27,28]. Counts were normalized to the total number of aligned reads in millions andinput reads counted and normalized in the same manner were subtracted [15,27,28]. B. Heatmap representations of read distributions for 5-hmC and11 histone modifications at 5 predicted enhancer subtypes found to have significant enrichment in H1 hES cells. Heatmap scale is constant for allmarks and indicated in the lower left-hand corner. C. Genomic view of an E8-type enhancer overlapping a region identified as significantly enrichedfor 5-hmC by peak identification upstream of the PRDM14 gene.doi:10.1371/journal.pgen.1002154.g006
suggesting a significant amount of enhancer regulation by p300independent mechanisms. Interestingly, we find that while only asmall fraction of p300 sites (166 of 3094, 5.4%) overlap 5-hmCenriched regions, a significant percentage of predicted enhancers(19,973 of 58,023, 34.4%) overlap with 5-hmC enriched regions(Figure 7C). Furthermore, sites that were enriched for 5-hmC,bound by p300, and predicted as enhancers were quite rare,occurring only 25 times. These data suggest that significant portionof predicted enhancers are also enriched in 5-hmC, but lack p300binding, and may indicate a role for 5-hmC in regulating p300independent enhancers.Together these results indicate that 5-hmC may also influence
the chromatin states at protein-DNA interaction sites, therebymodulating the function of key transcription factors and diverseenhancer subtypes.
Discussion
Recent studies have shown that Tet family proteins can catalyze5-methylcytosince (5-mC) conversion to 5-hydroxymethylcytosine(5-hmC) and play important roles in self-renewal and cell lineage
specification in embryonic stem (ES) cells [4–6,11,22]. Thesefindings suggest a potential role for 5-hmC-mediated epigeneticregulation in modulating the pluripotency of ES cells. To unveilthis new regulatory paradigm in human ES cells, here we used aselective 5-hmC chemical labeling approach coupled with affinitypurification and deep sequencing that we developed before toestablish the genome-wide distribution of 5-hmC in human EScells. Integration of 5-hmC distributions with genome-wide histoneprofiles led us to identify the pluripotency-linked chromatincontexts associated with 5-hmC. Through association withgenomic features defined on the basis of chromatin signatures,we find 5-hmC-mediated marking of not only specific promotersand gene bodies, but also distinct enhancer subtypes, includingthose marked with H3K4me1 and H3K27Ac. Lastly, we find 5-hmC is associated with the binding sites of specific corepluripotency transcription factors and a lack of 5-hmC at others.Our results suggest that 5-hmC is an important epigeneticmodification associated with the pluripotent state that could playrole(s) in a subset of promoters and enhancers with definedchromatin signatures in ES cells.
Figure 7. 5-hmC at pluripotency-associated core transcription factor binding sites in human H1 ES cells. A. 5-hmC read distributions atKLF4 (n = 3,795), OCT4 (n = 3,890), SOX2 (n = 5,684), NANOG (n= 25,076), p300 (n = 3,094), and TAF1 (n = 12,363) binding sites in H1 hES cells. 5-hmCreads were counted in 40 equally portions within, upstream, and downstream of each binding site and values were normalized to the total number ofaligned reads. Input reads counted and normalized in the same manner were then subtracted. Shown to the right of each plot is a scaled Venndiagram of the number of transcription factor binding sites (in gray) directly overlapping 5-hmC enriched regions (in black, 82,221) for reference.Overlaps are defined as $1 bp. B. Genomic view of 5-hmC coverage and 11 histone modifications at the DNMT3B locus, showing overlap of a 5-hmCpeak, NANOG site, and the associated histone modifications. C. Scaled Venn diagram depicting the overlap between 5-hmC enriched regions (black,82,221), p300 binding sites (gray, 3,094), and predicted enhancers reported in [15] (blue, 58,023). Shown in red is the overlap of all three (25 regions).Overlaps are defined as $1 bp.doi:10.1371/journal.pgen.1002154.g007
By correlating genome-wide distributions of 5-hmC with thoseof 11 diverse histone marks, we found that 5-hmC displayedrelatively strong correlations with H3K4me1 and H3K4me2versus H3K4me3, which, as expected, is consistent with previouscorrelations between DNA methylation detected by Methyl-Seqand histone modifications [15]. 5-hmC also exhibited a strongcorrelation with H3K18ac, a mark regulated by CBP/p300 atenhancers that is associated with transcriptional activation. Wealso found more modest correlations with H3K27ac, H3K27me3,and H4K5ac, and very low correlations with H3K9ac andH3K9me3. However, our data suggested that 5-hmC was notstrongly correlated with H3K36me3, a histone modificationpreviously linked to DNA methylation detected by Methyl-Seq.This intriguing difference suggested differential marking of genebodies by 5-hmC and H3K36me3 in pluripotent cells. Directcomparisons of genic 5-hmC and H3K36me3 indeed revealed thatgenes with the highest levels of TSS and gene body 5-hmC tend toexhibit intermediate levels of expression and harbor less intragenicH3K36me3, compared to genes with the highest levels ofexpression. Although a number of intriguing explanations mightaccount for these observations, one possibility is that 5-hmC mayfunction to temper transcription at both the TSS and gene body ofintermediately expressed genes, while maintaining their potentialto be more fully expressed when needed. Upon full activation, 5-hmC may be at least partially removed as the transcriptional unitacquires H3K36me3 and commits to a more fully active state.Restriction of 5-hmC at the TSS of repressed genes and itspresence at both TSSs and gene bodies of intermediatelyexpressed genes may also indicate distinct regulation of 5-hmCat these locations. At TSSs of genes that are repressed or expressedat low levels, Polycomb group complex, PRC2, may interact with5-hmC to repress but maintain the potential for expression oftargeted genes, as has been previously suggested [9,10]. However,such distributions are distinct from those observed in mousecerebellum [14], where 5-hmC is significantly enriched comparedto ES cells, largely absent from TSSs, and high within gene-bodies,positively correlating gene-expression. Thus, distinction of me-chanisms differentially influencing the state and regulation of 5-hmC within genes bodies in the context of gene expressionoutcomes will be important towards understanding the role of 5-hmC in both brain and ES cells.Our genome-wide analyses of 5-hmC also revealed a general
promoter-proximal bias of 5-hmC around RefSeq transcripts inhuman ES cells, which is consistent with the recently publishedwork on mapping 5-hmC in mouse ES cells [9,11–13]. This TSS-associated bias was also dependent on gene expression levels, with5-hmC transitioning from a position directly over the TSS atrepressed genes to a bimodal distribution at more highly expressedgenes, likely reflecting the observed dual function of 5-hmC inmouse ES cells [9–13], although this correlation was not strictlylinear. Interestingly, we find that the bimodal distribution of 5-hmC is also strongly correlated with the distributions of H3K4me1and H3K4me2, but inversely correlated with H3K4me3. Thebimodal distribution of 5-hmC, H4K4me1, and H3K4me2around TSSs might reflect the establishment of divergent pausedRNAPII, which is known to play a critical regulatory role atdevelopmentally regulated transcripts in ES cells [23,24]. Thiscould thereby point to an influence of 5-hmC on transcriptionpausing at such promoters in hES cells. We also noted that such apromoter-proximal bias of 5-hmC in ES cells is distinct from thatobserved in mouse brain, where 5-hmC is largely depleted fromTSSs and enriched within gene bodies (Szulwach and Jin,unpublished observations and [14]), where it also correlates wellwith gene expression. This could suggest that such a bias reflects a
stem cell-specific role for 5-hmC-mediated gene regulation at andaround certain TSSs. Such differences may be accounted for bythe enrichment of Tet1, or yet-to-be-identified co-factors of Tet1,in ES cells relative to more differentiated cell types.Analyses of 5-hmC-enriched peaks and their correlation with
enhancer-associated specific histone modifications, such asH3K4me1, H3K18ac, and H3K27ac, suggested that, in additionto being present at promoters, 5-hmC could also mark otherdiverse regulatory elements in the genome, such as enhancers.Interestingly, assessment of 5-hmC distributions at the predictedenhancers in H1 hES cells demonstrated the enrichment of theepigenetic mark at specific enhancer subtypes, including thoseenriched for K3K4me1, H3K27ac, H3K18ac, and H4K5ac.Despite a good correlation between 5-hmC and histone marksdemarcating enhancers, we found that only small fraction ofregions bound by p300 were also enriched for 5-hmC.Finally, we examined the correlation of 5-hmC distributions
with the genome-wide binding sites of six transcription factors thathave been linked to maintaining the pluripotency of ES cells [16].We find that 5-hmC can also mark NANOG binding sites, whilebeing depleted at TAF1 sites. These results further suggest diverseroles for 5-hmC in regulating the accessibility of transcriptionfactors in defined chromatin contexts, including those regulatingpluripotency in ES cells.In summary, here we present the genome-wide distribution of 5-
hmC and its correlation with 11 diverse histone modifications andsix transcription factors in human ES cells. By integrating genomic5-hmC signals with maps of different histone marks, we linkparticular pluripotency-associated chromatin contexts with 5-hmC. Our study suggests that 5-hmC could play diverse roles inregulating specific promoters, gene bodies, and enhancers in EScells, thereby providing a detailed epigenomic map of 5-hmC fromwhich to study its contribution to pluripotency.
Materials and Methods
Human ES cell cultureH1 human ES cells were maintained on mitomycin C-treated
STO cells in ES medium consisting of DMEM/F12 medium(Invitrogen) supplemented with 20% serum replacement (SR;Invitrogen), 1 mM L-glutamine (Invitrogen), 100 mM nonessentialamino acids (Invitrogen), 0.1 mM ß-mercaptoethanol (Sigma), 1XAntibiotics-Antimycotic (Invitrogen), and 4 ng/mL bFGF (Invi-trogen). The fully grown H1 cells were mechanically isolated andtransferred into a prepared dish with fresh feeder cells. Prior to theisolation of genomic DNA, cells were treated with dispase (2 mg/ml in DMEM/F12) to detach human ES cells from feeder cells.
Metaphase chromosome preparation and stainingMetaphase chromosomes were prepared by standard protocols
as described previously [25]. The slides with hES metaphasechromosome spreads were washed with PBS for 5 min. The slideswere immersed in 1N HCl and incubated at 37uC for 30 min.After HCl treatment, the slides were washed with PBS for 15 minfollowed by blocking with 3% goat serum/0.4 Triton X-100 inPBS for 1 h. The samples were incubated with primary antibodiesat 4uC overnight. The following primary antibodies were used:rabbit anti 5-hydroxymehtylcytosine (1:10,000, #39769, ActiveMotif), mouse anti-5-methylcytosine (1:1000, Eurogentec, BI-MECY-0100). On the second day, the slides were washed withPBS and then incubated with secondary antibodies: goat anti-rabbit Alexa488 (1:500, #A11008, Invitrogen) and goat anti-mouse Alexa568 (1:500, #A11031, Invitrogen). The slides werecounter-stained with the fluorescent nuclear dye 49,6-diamidino-2-
phenylindole (#B2261, Sigma). The slides were examined using aZeiss AX10 microscope, and images were processed with Photo-shop software. More than 5 metaphase spreads were examined for5-mC and 5-hmC.
Genomic DNA preparationGenomic DNA was isolated by cell lysis in digestion buffer
(100 mM Tris-HCl, pH 8.5, 5 mM EDTA, 0.2% SDS, 200 mMNaCl), Proteinase K treatment (0.667 ug/ul, 55uC overnight). Thesecond day, an equal volume of Phenol:Chloroform:IsoamylAlcohol (25:24:1 Saturated with 10 mM Tris, pH 8.0, 1 mMEDTA) (P-3803, Sigma) was added to samples, mixed completely,and centrifuged for 5 min at 14,000 rpm. The aqueous layersolution was transferred into a new Eppendorf tube andprecipitated with 2 volumes 100% ethanol and 1/10 volume3 M NaOAc. The genomic DNA was recovered and dissolvedwith 10 mM Tris-HCl, pH 8.0. Genomic DNA samples werefurther sonicated into ,500 bp by Misonix sonicator 3000 (usingmicrotip, 4 pulses of 27 s each, with 1 min of rest and a poweroutput level of 2; the sonication was performed always on ice). Thefragment size of sonicated DNA was verified by agarose gelelectrophoresis. The DNA concentration was determined withNANO-DROP 1000 (Thermo Scientific).
5-hmC and 5-mC dot blotThe dot blot was performed on a Bio-Dot Apparatus (#170-
6545, BIO-RAD). Briefly, the serially diluted C, 5-mC, or 5-hmC only standard DNA samples (Zymo research) were mixedwith 2N NaOH and 10 mM Tris?Cl, pH 8.5, and loaded onto6X SSC rinsed Hybond-N+ membrane (Amersham Biosciences,#RPN303B). The completely dried membrane was baked for30 min at 80uC and then blocked with PBS containing 5% drymilk and 0.1% Triton X-100 for 1 h at room temperature.The primary rabbit anti-5-hydroxymethylcytosine antibody(1:10,000, #39769, Active Motif) or (1:1,000, mouse mono-clonal anti-5-methylcytosine, BI-MECY-0100, Anaspec) wasapplied to the membrane and incubated overnight at 4uC. Thesecond day, the membrane was rinsed with PBS and the signalwas developed after incubation with HRP-conjugated secondaryantibody for 30 min.
5-hmC–specific chemical labeling and affinity purification5-hmC enrichment was performed using a previously described
procedure with an improved selective chemical labelling method[14]. Briefly, the 5-hmC labelling reactions were performed in a100-mL solution containing 50 mM HEPES buffer (pH 7.9),25 mM MgCl2, 300 ng/mL sonicated genomic DNA (100–500 bp), 250 mM UDP-6-N3-Glu, and 2.25 mM wild-type b-GT.The reactions were incubated for 1 h at 37uC. After the reaction,the DNA substrates were purified via Qiagen DNA purification kitor by phenol-chloroform precipitation and reconstituted in H2O.The click chemistry was performed with the addition of 150 mMdibenzocyclooctyne-modified biotin into the DNA solution, andthe reaction mixture was incubated for 2 h at 37uC. The DNAsamples were then purified by Pierce Monomeric Avidin Kit(Thermo) following the manufacturer’s recommendations. Afterelution, the biotin-5-N3-gmC-containing DNA was concentratedby 10 K Amicon Ultra-0.5 mL Centrifugal Filters (Millipore) andpurified by Qiagen DNA purification kit.
Sequencing of 5-hmC–enriched and input genomic DNADNA libraries were generated following the Illumina protocol
for ‘‘Preparing Samples for ChIP Sequencing of DNA’’ (Part#
111257047 Rev. A). We used 25 ng of input genomic DNA or 5-hmC-captured DNA to initiate the protocol. DNA fragments of,150–300 bp were gel-purified after the adapter ligation step.PCR-amplified DNA libraries were quantified on an Agilent 2100Bioanalyzer and diluted to 6-8 pM for cluster generation andsequencing. We performed 38-cycle single-end sequencing usingVersion 4 Cluster Generation and Sequencing Kits (Part#15002739 and#15005236 respectively) and Version 7.0 recipes.Image processing and sequence extraction were done using thestandard Illumina Pipeline.
Sequence alignment, binning, and peak identificationFASTQ sequence files were aligned to the Human reference
(NCBI36, hg18) using Bowtie 0.12.6, retaining only unique, non-duplicate genomic matches with no more than 2 mismatcheswithin the first 25 bp.Unique, non-duplicate reads from non-enriched input genomic
DNA and each 5-hmC-enriched sequence set were counted in1000-, 5000-, and 10,000-bp bins genome-wide and subsequentlynormalized to the total number of non-duplicate reads in millions.We find that bins of varying size produce largely similar patternsgenome wide and have reported values within a bin size of 10 kbwithin all figures. Input-normalized values were subtracted from 5-hmC-enriched values per bin to generate normalized 5-hmCsignals.Summary of sequence output: H1, 5-hmC enriched =10038770
non-duplicate reads, H1, Unenriched input =20656172 non-duplicate reads.Chromosome-wide densities were determined as reads per
chromosome divided by the total number of reads in millions.Expected values were determined by dividing 106 by the totalNCBI36/hg18 length, and multiplying by chromosomal length.Expected values were divided by 2 for chromosomes X and Y.For MeDIP/histone modification correlations, unique, non-
duplicate reads from non-enriched input genomic DNA and 5-hmC-enriched DNA were counted in 10,000-bp bins genome-wide and subsequently normalized to the total number of non-duplicate reads in millions. Input-normalized values weresubtracted from 5-hmC/histone-enriched values per bin togenerate normalized 5-hmC/histone signals. All histone ChIP-Seq data was acquired from Sequence Read Archive (SRA),accession SRP000941, [15]. MeDIP data were obtained fromNCBI GEO Accession GSM456941. All histone ChIP-Seq dataand MeDIP were mapped and processed with the identicalparameters used for 5-hmC reads described above.5-hmC peaks were identified using MACS [26] with the
following parameters: effective genome size = 2.7e+09; Tag size= 38; Bandwidth = 200; P-value cutoff = 1.00e-08; ranges forcalculating regional lambda are: peak_region, 200, 1000.Association of 5-hmC peaks with genomic features was
performed by overlapping peak locations with known genomicfeatures obtained from UCSC Tables for NCBI36/hg18: RefSeqWhole Gene, 59UTR, Exon, Intron, 39UTR, +/2500 bp ofRefSeq TSS, RefSeq Intergenic (complement of Whole Gene),CpG Islands (+/22 kb of CGI, Intergenic/Intragenic/TSS basedon RefSeq Whole Gene). Predicted enhancer locations wereobtained from [15]. Peaks were assigned to a given genomicfeature if overlapping $1 bp. Expected values were determinedbased on the percent base coverage of each defined genomicfeature in NCBI36/hg18.
Histone ChIP-Seq and chromatin signaturesAll histone ChIP-Seq data were acquired from Sequence Read
Archive (SRA), accession SRP000941. All histone ChIP-Seq data
were mapped and processed with the identical parameters used for5-hmC reads described above. Chromatin signatures for promo-ters, enhancers, and ChIP-rich regions were acquired from [15].5-hmC reads were counted in 100-bp bins, in the 4 kb directlysurrounding identified binding sites, as well as 4 kb upstream anddownstream of the immediate 4-kb region. Read counts werenormalized to the total number of aligned reads in millions andinput reads counted and normalized in the same manner weresubsequently subtracted to determine 5-hmC enrichment.
for KLF4, NANOG, OCT4, p300, SOX2, and TAF1 in H1 EScells were described previously [16]. For correlations between 5-hmC and gene expression, 5-hmC reads were counted in 100-bpbins, in the 65 kb directly surrounding TSSs and TESs. Readcounts were normalized to the total number of aligned reads inmillions. For transcription factor binding sites, 5-hmC reads werecounted in 40 equally sized portions within, upstream, anddownstream of the binding sites. Read counts were normalized tothe total number of aligned reads in millions and input readscounted and normalized in the same manner were subtracted todetermine 5-hmC enrichment.
Methyl-seq data and analysisMethyl cytosine counts in the CG, CHG, or CHH context were
obtained directly from [16] and the percent methylation in each10 kb bin genome-wide was determined as the weighted sum ofmethylated cytosine detected at each position.
Supporting Information
Figure S1 Verification of 5-mC and 5-hmC antibody specificity.Dot blots of cytosine only (C), 5-methylcytosine only (mC), or 5-hydroxymethylcytosine only (5-hmC), control DNA (949 bp,Zymo Research) demonstrating the specificity of anti-5 mC andanti-5-hmC antibodies used on metaphase spreads.(TIF)
Figure S2 Correlation between 5-hmC and methyl-seq CG,CHG, and CGG DNA methylation. A. 5-hmC versus percent 5-mCG detected by methyl-seq. B. 5-hmC versus percent 5-mCHGdetected by methyl-seq. C. 5-hmC versus percent 5-mCHHdetected by methyl-seq. For all plots 5-hmC and input reads were
counted in 10 kb bins, normalized to the total number of alignedreads in millions and input values were subtracted from 5-hmCvalues. Methyl cytosine counts in the CG, CHG, or CHH contextwere obtained directly from [16] and the percent methylation ineach 10 kb bin genome-wide was determined as the weighted sumof methylated cytosine detected at each position.(TIF)
Figure S3 Distribution of 5-hmC at P12–P18 type promoterspreviously defined on the basis of their chromatin signature[15,27]. 5-hmC reads were summed in 100-bp windows and theimmediate 4 kb region, as well as 4 kb upstream and downstreamof the immediate 4 kb region, centered on each H1 hES cellpromoter type. Read counts were normalized to the total numberof read in millions and input reads counted and normalized in thesame manner were subtracted.(TIF)
Figure S4 Distribution of 5-hmC at 12 ChIP-rich regionspreviously defined on the basis of their chromatin signature that lieoutside known promoters and predicted enhancers [15,27]. 5-hmC reads were summed in 100-bp windows and the immediate4 kb region, as well as 4 kb upstream and downstream of theimmediate 4 kb region, centered on each H1 hES cell promotertype. Read counts were normalized to the total number of read inmillions and input reads counted and normalized in the samemanner were subtracted. Histone marks identified as enriched atparticular ChIP-rich regions are indicated to the right of thespecific regions.(TIF)
Table S1 List of 82,221 5-hmC enriched regions in H1 hEScells.(XLSX)
Acknowledgments
We would like to thank the members of the Jin lab for their assistance andC. Strauss for critical reading of the manuscript.
Author Contributions
Conceived and designed the experiments: KES PJ. Performed theexperiments: KES XL YL KH. Analyzed the data: KES XL SN MKRBR PJ. Contributed reagents/materials/analysis tools: C-XS JWH SK JJKY-SY CH PJ. Wrote the paper: KES XL PJ.
References
1. Jaenisch R, Bird A (2003) Epigenetic regulation of gene expression: how the genomeintegrates intrinsic and environmental signals. Nat Genet 33 Suppl: 245–254.
2. Li E, Bestor TH, Jaenisch R (1992) Targeted mutation of the DNAmethyltransferase gene results in embryonic lethality. Cell 69: 915–926.
3. Okano M, Bell DW, Haber DA, Li E (1999) DNA methyltransferases Dnmt3aand Dnmt3b are essential for de novo methylation and mammaliandevelopment. Cell 99: 247–257.
4. Ito S, D’Alessio AC, Taranova OV, Hong K, Sowers LC, et al. (2010) Role ofTet proteins in 5mC to 5hmC conversion, ES-cell self-renewal and inner cellmass specification. Nature 466: 1129–1133.
5. Iyer LM, Tahiliani M, Rao A, Aravind L (2009) Prediction of novel families ofenzymes involved in oxidative and other complex modifications of bases innucleic acids. Cell Cycle 8: 1698–1710.
6. Koh KP, Yabuuchi A, Rao S, Huang Y, Cunniff K, et al. (2011) Tet1 and tet2regulate 5-hydroxymethylcytosine production and cell lineage specification inmouse embryonic stem cells. Cell Stem Cell 8: 200–213.
7. Huang Y, Pastor WA, Shen Y, Tahiliani M, Liu DR, et al. (2010) The behaviourof 5-hydroxymethylcytosine in bisulfite sequencing. PLoS ONE 5: e8888.doi:10.1371/journal.pone.0008888.
8. Jin SG, Kadam S, Pfeifer GP (2010) Examination of the specificity of DNAmethylation profiling techniques towards 5-methylcytosine and 5-hydroxy-methylcytosine. Nucleic Acids Res 38: e125.
9. Wu H, D’Alessio AC, Ito S, Wang Z, Cui K, et al. (2011) Genome-wide analysisof 5-hydroxymethylcytosine distribution reveals its dual function in transcrip-tional regulation in mouse embryonic stem cells. Genes and Development April679-684 2011: 679–684.
10. Wu H, D’Alessio AC, Ito S, Xia K, Wang Z, et al. (2011) Dual funtionsof Tet1 in transcriptional regulation in mouse embryonic stem cells.Nature.
11. Ficz G, Branco MR, Seisenberger S, Santos F, Krueger F, et al. (2011) Dynamicregulation of 5-hydroxymethylcytosine in mouse ES cells and duringdifferentiation. Nature.
12. Xu Y, Wu F, Tan L, Kong L, Xiong L, et al. (2011) Genome-wide Regulation of5hmC, 5mC, and Gene Expression by Tet1 Hydroxylase in Mouse EmbryonicStem Cells. Mol Cell.
13. Williams K, Christensen J, Pedersen MT, Johansen JV, Cloos PA, et al.(2011) TET1 and hydroxymethylcytosine in transcription and DNA methyla-tion fidelity. Nature.
14. Song CX, Szulwach KE, Fu Y, Dai Q, Yi C, et al. (2011) Selective chemicallabeling reveals the genome-wide distribution of 5-hydroxymethylcytosine. NatBiotechnol 29: 68–72.
15. Hawkins RD, Hon GC, Lee LK, Ngo Q, Lister R, et al. (2010) Distinctepigenomic landscapes of pluripotent and lineage-committed human cells. CellStem Cell 6: 479–491.
16. Lister R, Pelizzola M, Dowen RH, Hawkins RD, Hon G, et al. (2009) HumanDNA methylomes at base resolution show widespread epigenomic differences.Nature 462: 315–322.
17. Ferrari R, Pellegrini M, Horwitz GA, Xie W, Berk AJ, et al. (2008) Epigeneticreprogramming by adenovirus e1a. Science 321: 1086–1088.
18. Horwitz GA, Zhang K, McBrian MA, Grunstein M, Kurdistani SK, et al. (2008)Adenovirus small e1a alters global patterns of histone modification. Science 321:1084–1085.
19. Mikkelsen TS, Ku M, Jaffe DB, Issac B, Lieberman E, et al. (2007) Genome-wide maps of chromatin state in pluripotent and lineage-committed cells. Nature448: 553–560.
20. Chia NY, Chan YS, Feng B, Lu X, Orlov YL, et al. (2010) A genome-wideRNAi screen reveals determinants of human embryonic stem cell identity.Nature 468: 316–320.
21. Ma Z, Swigut T, Valouev A, Rada-Iglesias A, Wysocka J (2011) Sequence-specific regulator Prdm14 safeguards mouse ESCs from entering extraembryonicendoderm fates. Nat Struct Mol Biol 18: 120–127.
22. Tahiliani M, Koh KP, Shen Y, Pastor WA, Bandukwala H, et al. (2009)Conversion of 5-methylcytosine to 5-hydroxymethylcytosine in mammalianDNA by MLL partner TET1. Science 324: 930–935.
23. Core LJ, Waterfall JJ, Lis JT (2008) Nascent RNA sequencing revealswidespread pausing and divergent initiation at human promoters. Science322: 1845–1848.
24. Seila AC, Calabrese JM, Levine SS, Yeo GW, Rahl PB, et al. (2008) Divergenttranscription from active promoters. Science 322: 1849–1851.
26. Zhang Y, Liu T, Meyer CA, Eeckhoute J, Johnson DS, et al. (2008) Model-basedanalysis of ChIP-Seq (MACS). Genome Biol 9: R137.
27. Hon GC, Hawkins RD, Ren B (2009) Predictive chromatin signatures in themammalian genome. Hum Mol Genet 18: R195–201.
28. Hon G, Ren B, Wang W (2008) ChromaSig: a probabilistic approach to findingcommon chromatin signatures in the human genome. PLoS Comput Biol 4:e1000201. doi:10.1371/journal.pcbi.1000201.