INTEGRATING A NATIONAL DATABASE OF SUBGRADE SOIL-WATER 1 CHARACTERISTIC CURVES AND SOIL INDEX PROPERTIES WITH THE M-EPDG 2 3 Claudia Zapata, Ph.D. * 4 Assistant Professor 5 Department of Civil, Sustainable and Environmental Engineering 6 Arizona State University 7 P.O. Box 875306, Tempe, AZ 85287-5306 8 E-mail: [email protected]9 10 and 11 12 Carlos E. Cary, Ph.D. 13 Research Associate 14 Department of Civil, Environmental and Sustainable Engineering 15 Arizona State University 16 PO Box 875306, Tempe, AZ 85287-5306 17 E-mail: [email protected]18 19 *Corresponding author 20 21 Submitted for Presentation and Publication in the 92 nd Annual Meeting of the Transportation 22 Research Board 23 Submit date: August 1 st , 2012 24 Word Count: 5,108 25 Number of Tables: 0 26 Number of Figures: 7 27 28 29 30 31 32 33 34 35 36 37 38 39 40 41 42 43 44
Transcript
INTEGRATING A NATIONAL DATABASE OF SUBGRADE SOIL-WATER 1
CHARACTERISTIC CURVES AND SOIL INDEX PROPERTIES WITH THE M-EPDG 2
3
Claudia Zapata, Ph.D. * 4 Assistant Professor 5
Department of Civil, Sustainable and Environmental Engineering 6
*Corresponding author 20 21 Submitted for Presentation and Publication in the 92
nd Annual Meeting of the Transportation 22
Research Board 23
Submit date: August 1st, 2012 24
Word Count: 5,108 25
Number of Tables: 0 26
Number of Figures: 7 27
28
29
30
31
32
33
34
35
36
37 38
39
40
41
42
43
44
TRB 2013 Annual Meeting Paper revised from original submittal.
Zapata and Cary
2
ABSTRACT 1
The database developed under the NCHRP 9-23A project, entitled "Development of a National 2
Catalog of Subgrade Soil-Water Characteristic Curves (SWCC) Default Inputs to Use in the 3
Mechanistic Empirical Pavement Design Guide (M-EPDG)", included not only measured soil 4
index properties needed in all hierarchical levels of the Enhanced Integrated Climatic Model 5
(EICM) but also soil-water characteristic curve (SWCC) parameters, which are key in the 6
implementation of Level 1 analysis. A set of maps in portable document format (pdf) displaying 7
the location of every soil unit identified within the continental US, Hawaii, Alaska and Puerto 8
Rico; and a simple interface in Excel to aid in the query of data were also developed for the 9
project. Under NCHRP 9-23B project, entitled "Integrating the National Database of Subgrade 10
Soil-Water Characteristic Curves and Soil Index Properties with the M-EPDG", a second 11
research effort was directed to integrate an enhanced version of the GIS-enabled database with 12
the M-EPDG. Specifically, NCHRP 9-23B project aimed at the implementation of an interactive 13
tool that allows the M-EPDG (current DarWin-ME) users to retrieve both appropriate soil unit 14
maps and soil properties relevant to a particular user-specified location by inputting either state 15
milepost information or geographical coordinates. The final product was integrated into a public 16
website that can be accessed by the guide users, agencies, industry and academicians through a 17
simple link. This document presents details of the development of this useful search tool and 18
outlines its main features. 19
20
21
22
23
24
25
26
27
28
29
30
31
32
33
34
35
36
37
38
39
40
41
42
43
TRB 2013 Annual Meeting Paper revised from original submittal.
Zapata and Cary
3
INTRODUCTION 1
Within the M-EPDG (and its successor program, AASHTOWare’s DARWin-ME), the EICM 2
handles input collection, characterization, and analysis of the effects of environmental factors 3
and material properties on the stiffness of unbound materials. The output of the EICM has a 4
significant impact on the final distress predictions provided by the M-EPDG. 5
The EICM requires several types of input parameters in order to accurately predict the 6
environmental adjustment factors; these can be divided into two main categories: climatic 7
information and material properties for unbound (granular base and subbase) and subgrade 8
materials. The climatic information is readily available to the user of the MEPDG through the 9
internal provision of datasets for more than 800 U.S. weather stations with hourly information 10
that includes precipitation, temperature, wind speed, cloud cover and relative humidity. By 11
contrast, the required unbound material information ranges from routine soil index properties to a 12
specialized set of moisture retention parameters (soil-water characteristic curve parameters) that 13
are fundamental to the consideration of moisture prediction and soil stiffness of all unbound 14
layers. The soil index properties include parameters such as grain-size distribution, Atterberg 15
limits, porosity, and saturated hydraulic conductivity, which are well-known to both practitioners 16
and researchers in the pavement engineering community. However, the soil-water retention 17
parameters are relatively unfamiliar to this community, despite the fact that they are widely used 18
in the agricultural sciences and play a key role in defining the stress state of unsaturated soils. 19
In NCHRP Project 9-23A "Development of a National Catalog of Subgrade Soil-Water 20
Characteristic Curves (SWCC) Default Inputs to Use in the M-EPDG," Arizona State University 21
developed a national database of M-EPDG input properties for subgrade materials. The database 22
includes SWCC parameters, which are key parameters in the implementation of the M-EPDG 23
Level 1 pavement design analysis, as well as measured soil index properties needed by the EICM 24
at all levels of analyses. In addition, the project developed a simple user's interface to facilitate 25
the search for a particular soil profile when the location of the project is known. The interface 26
was developed using Microsoft Excel® and Adobe Acrobat®. Project location maps were 27
provided in Adobe portable document format (pdf) files, while Excel was used for the soils 28
database and coding of the user interface. 29
To further encourage the use of the maps and database developed in NCHRP Project 9 -30
23A, an interactive search tool based on Google Maps and capable of displaying soil unit maps 31
and generating reports was conceived and produced as part of NCHRP Project 9-23B. The 32
importance of this tool is that it is designed for easy linking to the M-EPDG software and can be 33
used by any practitioner interested in obtaining preliminary site condition information needed for 34
the design and analysis of new and rehabilitated pavement structures. 35
OBJECTIVE 36
The specific objective of this research was to facilitate the integration of an enhanced version of 37
the GIS-enabled national database of SWCC parameters and relevant soil index properties with 38
the M-EPDG software. Achieving this objective required, in turn, the pursuit of two 39
complementary goals: 40
Provide direct access to the maps and soil properties during the operation of the M-41
EPDG software through an interactive use of coordinate points, defined by latitude and 42
longitude, that which are input by the user of the M-EPDG. Inputting the coordinate points 43
should then access a Google-based map that displays the soil units encountered in the area along 44
TRB 2013 Annual Meeting Paper revised from original submittal.
Zapata and Cary
4
with highway or route mileposts. A complete tabular summary of soil property data for the 1
chosen location can also be obtained. 2
Provide direct access to the maps and soil properties by using the official state 3
milepost system. The user should be able to (a) identify a road segment through the official state 4
milepost, (b) link the milepost to its respective latitude and longitude, and (c) access the Google-5
based map that displays the soil units and highway system and a tabular summary of all relevant 6
soil property data. 7
Additionally, the present paper is intended to share with the pavement engineering 8
community the key features and use of the search tool developed under NCHRP Project 9-23B. 9
BACKGROUND 10
Enhanced Integrated Climatic Model 11
The EICM requires different input parameters to accurately adjust the stiffness of unbound and 12
subgrade materials due to seasonal environmental changes. Although the EICM layout does not 13
specifically define the input parameters by hierarchical level of analysis, the selection of such 14
parameters can be achieved by following a general hierarchical approach as outlined in the final 15
report for the NCHRP 1-40 D project (1). In that report, the following parameters are suggested 16
for each level of analysis: 17
Level 3: AASHTO soil classification, grain-size distribution, and Atterberg’s limits of 18
the unbound/subgrade materials. These properties are expected to be measured by the user. 19
Default values, based on AASHTO soil classification, are available within the EICM. 20
Level 2: Specific gravity of solids, maximum dry density and optimum moisture 21
content are required, in addition to the parameters required for Level 3. Default values for 22
specific gravity of solids are available within the EICM. These values were gathered from 23
textbooks and published literature. As for the compaction data (optimum moisture content and 24
maximum dry density), default values based on AASHTO classification are also available. These 25
values were derived from correlations with grain size distribution and consistency limits. 26
Level 1: SWCC parameters from measured suction data are required, in addition to 27
the parameters required for Level 2. Default values based on soil classification are available. Of 28
all the soil properties needed to be input in the M-EPDG; the SWCC parameters are the least 29
standardized and the most complicated set of inputs to be selected for the EICM analysis. 30
The groundwater table depth is required as environmental parameter for all analysis 31
levels. This input is intended to be either the best estimate of the annual average depth or the 32
seasonal average depth. For input Level 1, the groundwater table depth can be determined from 33
profile characterization borings prior to design. Conversely, an estimate of the annual average 34
value or the seasonal averages should be sufficient as Level 3 input values. 35
NCHRP Project 9-23A 36
NCHRP Project 9-23A assembled an extensive database of unbound material property input data 37
required for the M-EPDG (2). A full set of Level 3 data and most Level 1 and 2 information, 38
including SWCC parameters and saturated hydraulic conductivity, was obtained. In addition, 39
predicted typical resilient modulus and CBR values based on soil index properties were obtained 40
and included as part of the database. This information was provided in the form of a national 41
database and implemented via GIS soil unit maps for the entire United States and the 42
Commonwealth of Puerto Rico. These data comprise 31,100 soil units mapped by the U.S. 43
TRB 2013 Annual Meeting Paper revised from original submittal.
Zapata and Cary
5
Department of Agriculture’s (USDA) Natural Resources Conservation Service (NRCS). The 1
catalog of subgrade material properties provides regional and state transportation agencies with a 2
tool to design better performing and more cost effective pavements through the use of a database 3
established on measured materials properties rather than empirical relationships. The SWCC 4
parameters contained in this database represent one of the largest collection of unsaturated soil 5
material properties available in the world. Further analysis of parameters such as Group Index, 6
grain-size distribution and Atterberg limits can better refine soil classification sub-divisions and 7
yield better default parameters for use with the M-EPDG. 8
Need for an Enhanced Searching Tool 9
The development of the M-EPDG has been a great step towards a more reliable pavement design 10
analysis. It is expected that the availability of the NCHRP 9-23A database to the M-EPDG user 11
will greatly simplify the design and analysis processes, and will encourage the use of the guide. 12
However, the new methodology needs a substantial amount of soil input parameters. Therefore, 13
it became necessary the creation of a tool that simplifies the selection and extraction of soil 14
properties data required to run the M-EPDG. 15
This new searching tool will allow for the interactive use of GIS-based soil maps that can 16
be easily accessed during the operation of the M-EPDG software system by adding a link to an 17
Internet server. It also upgrades the capability of the M-EPDG to a new generation of operational 18
simplicity and user friendliness. 19
DEVELOPMENT OF THE SEARCH TOOL 20
The development of the search tool was the result of completing a series of tasks grouped under 21
five general activities. Such activities are conveniently synthesized in the following sections. 22
Collection of Geographical Coordinates for the U.S. Road Network 23
The national database developed in NCHRP Project 9-23A allowed retrieval of subgrade soil 24
properties through a graphical search of state maps with a user interface running in Microsoft 25
Excel®. First, the user selects a state map and then a geographic region within the state. Each 26
regional map shows the soil units and their approximate locations within the region. Selecting a 27
specific soil unit yields a tabular report of the soil property data for that unit. 28
This project expanded the functionality of the national database to allow search and 29
retrieval of soil property data at specific mileposts. To do this, a database was developed in 30
which the U.S. road network is geographically referenced by coordinate points of latitude and 31
longitude. The goal was to assign such a coordinate point to every milepost on the U.S. road 32
network. The completed database includes such coordinate points in 46 states, the District of 33
Columbia, and Puerto Rico. 34
During the development of the database, it was found that several departments of 35
transportation—Delaware, Florida, Louisiana, North Carolina, Pennsylvania, Puerto Rico, and 36
West Virginia—no longer use the milepost reference system. These states and Puerto Rico 37
provided data in the form of road segments rather than mileposts. The road-segment data were 38
transformed to mileposts wherever possible. For those states that have never used milepost data, 39
the collected information was left intact and a unique reference system was created, which 40
allows the user to locate the point of interest by using the road segments historically used by the 41
state, instead of mileposts. 42
43
TRB 2013 Annual Meeting Paper revised from original submittal.
Zapata and Cary
6
In some instances, not all road segments or mileposts were available, and the database is 1
limited to the information collected during the duration of the NCHRP 9-23B project. However, 2
despite the lack of milepost or route data for the aforementioned states, soil unit overlays were 3
developed for all 50 states, the District of Columbia, and Puerto Rico, and these data can be 4
retrieved for any location by inputting coordinates of longitude and latitude when milepost or 5
road segment information are not available. 6
Treatment and Organization of U.S. Road Network Data 7
The U.S. road network data described above was checked for quality and then organized to make 8
it compatible with the soil properties database developed in NCHRP Project 9-23A. In addition, 9
improvements were made to the collected shapefiles (GIS format) to facilitate their use in 10
developing the overarching computer code. The following activities were conducted: 11
Data cleaning: The collected data were organized in tables and subsequently 12
formatted to create the shapefiles. Data that were not relevant to the purposes of this research 13
were deleted to simplify the process. 14
Homogenization of data files: A standard formatting style was adopted and 15
implemented for each state's data set. Each data table contains separate columns for latitude, 16
longitude, state, road type (interstate, US highway, and state route), road number, and milepost 17
number. For states that do not use a milepost system, an alternate format was adopted in which a 18
road ID column containing the identification numbers for the road segments provided by the 19
state agencies replaced the milepost number column. 20
Generation of identifiers for road segments corresponding to the existing soil units: A 21
unique identifier was created for each milepost, consisting of state abbreviation, road type, road 22
number, and milepost number. For those states which provided road segments instead of 23
milepost data, a similar unique identifier was also created, which consisted of the road segment 24
ID assigned by the corresponding state DOT. 25
Improvement and conditioning of collected shapefiles: Milepost data were geocoded 26
and transformed into shapefiles in order to join the map feature to its corresponding soil unit 27
data. 28
Conversion of shapefiles into KML files: KML files are Google-compatible files used 29
to overlay data in Google Earth and Google Maps. The creation of the KML files required an 30
additional step in the project, involving the further conversion of the soil unit shapefiles collected 31
in NCHRP Project 9-23A. All shapefiles were sorted by state and run through a web-based 32
conversion software. Size and data limitations set by Google created an additional, unforeseen 33
hurdle due to the large size of the files. The KMLs for many states were too large by Google 34
standards, so they had to be split into as many as 15 KMLs per state. 35
Of the 48 route data sets collected, the data from Texas and Puerto Rico were found to be 36
unusable for the purposes of this project. Therefore, a total of 46 data tables were generated and 37
converted into KML files. These tables can be found in the NCHRP 9-23B project final report 38
(3). 39
Development of a Code to Retrieve Data based on Geographical Coordinates Input 40
A computer code was developed capable of performing a query in the database to retrieve 41
relevant information corresponding to the soil unit map underlying the specific geographical 42
location defined by the geographical coordinates input. 43
TRB 2013 Annual Meeting Paper revised from original submittal.
Zapata and Cary
7
A preliminary evaluation of the methodology needed to implement the code determined 1
that the best option was to create a user interface capable of operating interactively. The code 2
developed under this activity requires the user to perform the following steps: 3
Input geographical location defined by the Geographical Coordinates (latitude and 4
longitude). 5
The interactive mechanism should command the mapping tool to zoom into 6
the location of interest and insert a marker indicating the point under evaluation. The 7
mapping tool loads an overlay of the soil units encountered in the geographic region. 8
The user should be easily able to identify the underlying soil units located 9
across the road segment under evaluation. 10
Identify the soil unit of interest by clicking on the map. 11
A unique identification code should be displayed for the chosen unit. 12
Key and enter the identification code in order to retrieve all relevant data 13
corresponding to the soil units of interest. 14
The display of the data is possible through the use of a code described in 15
following sections. 16
Google Maps web service is the mapping tool used to display the soil unit maps. The 17
interaction between the M-EPDG and Google Maps is expected to be relatively easy by means of 18
a link within the M-EPDG software that opens the Soil Unit map webpage. 19
Development of a Code to Retrieve Data based on Milepost Input 20
A software routine was coded that is capable of performing a query in the database to extract 21
relevant information corresponding to the soil units encountered in the road section of interest by 22
using milepost input. This code requires the user to perform the following steps: 23
Input the location defined by the milepost corresponding to the point of interest 24
within the road segment under evaluation. 25
The code performs a query to find the geographical coordinates corresponding 26
to the milepost of interest. These geographical coordinates are then used in the mapping 27
tool to display the region of interest. 28
The interactive mechanism commands the mapping tool to zoom into the 29
location of interest and to insert a marker indicating the milepost under evaluation. The 30
mapping tool will load an overlay of the soil units encountered in the geographic region. 31
The user identifies the underlying soil units located across the road segment 32
under evaluation. 33
Identify the soil unit of interest by clicking on the map. 34
A unique identification code should be displayed for the chosen unit. 35
Type the required ID code into the MapChar box and submit it in order to retrieve all 36
the relevant data corresponding to the soil units of interest. 37
The display of the data is possible through the use of a code described in 38
following sections. 39
The code development process concentrated on making the milepost query as user-40
friendly as possible, by reducing the number of steps the user must take to find the coordinates of 41
interest. Thus, the milepost query page guides the user through the query process, all while 42
reloading automatically. For example, to query a specific milepost, the user needs to select 43
parameters from four different dropdown boxes. These parameters are State, Route Type, Route 44
TRB 2013 Annual Meeting Paper revised from original submittal.
Zapata and Cary
8
Number, and Milepost. Once the user selects the relevant state from the first dropdown box on 1
the query page, the page automatically reloads and limits the choices in the next dropdown box 2
(Route Type) to those available for the selected state. Once the Route Type is selected, the page 3
again reloads and limits the choices in the milepost dropdown box. Once the user selects the 4
milepost, the latitude and longitude for that milepost will display automatically. Although more 5
labor and time intensive, the dynamic dropdown boxes allow ease of use, prevent errors, and 6
reduce mouse-clicks. 7
Development of a Code to Display Soil Unit Data 8
A software routine was coded to display the results of the query performed by running the code 9
described in the previous section. The database from NCHRP Project 9-23A was converted to 10
SQL format files. The SQL format is supported by web servers and is searchable. The database 11
was then uploaded to the server, and a connection between the webpage and database was coded. 12
As a result, a summary of the soil properties available in the database for the soil unit of interest 13
can be displayed in the screen. This summary may then be printed as an aid to inputting the data 14
in the M-EPDG or DARWin-ME. 15
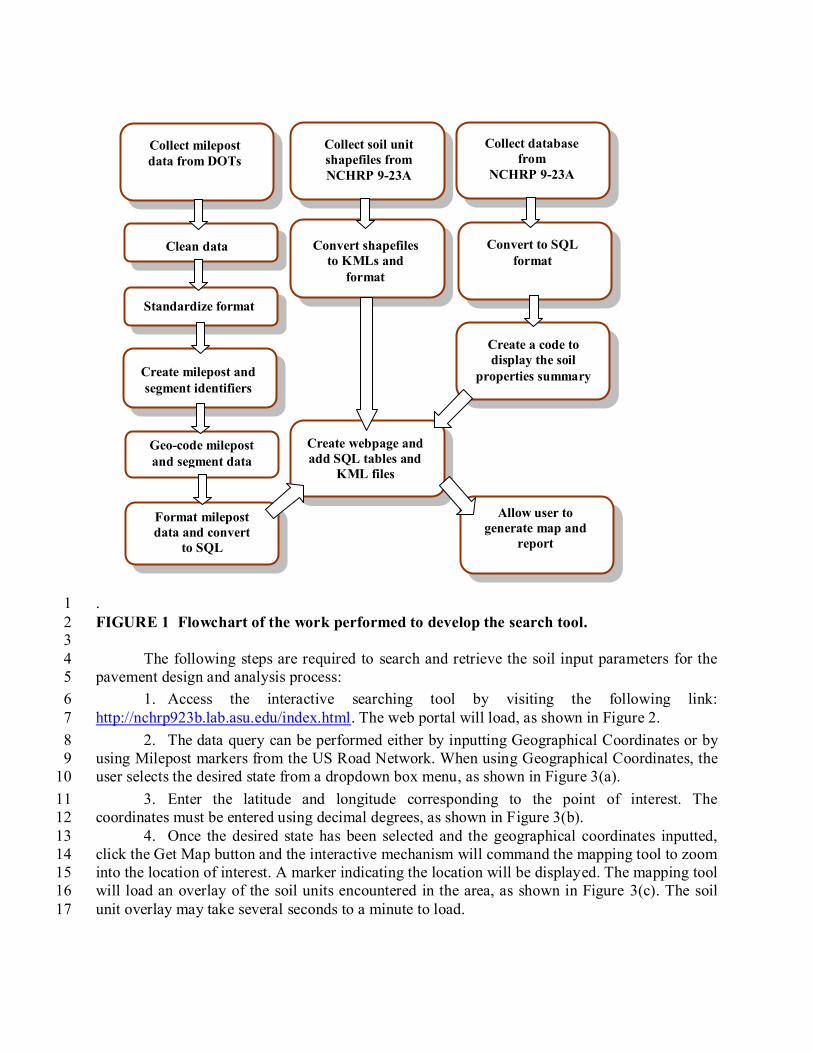
A flowchart summarizing the work performed to develop the search tool is presented in 16
Figure 1. As previously explained, for some states it was not possible to either obtain Milepost 17
data or utilize the Milepost data available for the purpose of this research. However, the soil unit 18
overlays were developed for every single state and therefore, the data can be retrieved by 19
inputting the coordinates or by specifying the state needed. 20
IMPLEMENTATION OF THE SEARCH TOOL INTO THE M-EPDG VIA MILEPOST, 21
ROAD SEGMENT, OR GEOGRAPHICAL COORDINATES 22
Ideally, the computer code described in the previous sections could be implemented to work 23
interactively with the M-EPDG. This implementation would involve changing the M-EPDG 24
interface to allow inputting the milepost, road segment, or geographical coordinates of the 25
project and retrieving the relevant soil unit data summary for direct use by the M-EPDG. 26
However, given the 2011 release of the M-EPDG as the commercial DARWin-ME software, this 27
implementation was not possible under NCHRP 9-23B project. 28
Instead, a web-based interface was developed from which all the data created in this 29
project can be easily retrieved and inputted to the DARWin-ME software. This permits the use of 30
the database not only by the DARWin-ME user but also by anyone interested or in need of a 31
preliminary assessment of the soil conditions when designing a new pavement or performing 32
rehabilitation activities. For review, the following link to the web-based interface is temporarily 33
operational and available: http://nchrp923b.lab.asu.edu/index.html. 34
USE OF THE SEARCH AND RETRIEVAL TOOL 35
This section presents detailed instructions on how to operate the interactive tool to search for and 36
retrieve in-situ soil properties required by the M-EPDG and DARWin-ME. The tool can be 37
independently accessed through any Web browser available to the user. 38
TRB 2013 Annual Meeting Paper revised from original submittal.
Zapata and Cary
9
. 1
FIGURE 1 Flowchart of the work performed to develop the search tool. 2 3
The following steps are required to search and retrieve the soil input parameters for the 4
pavement design and analysis process: 5
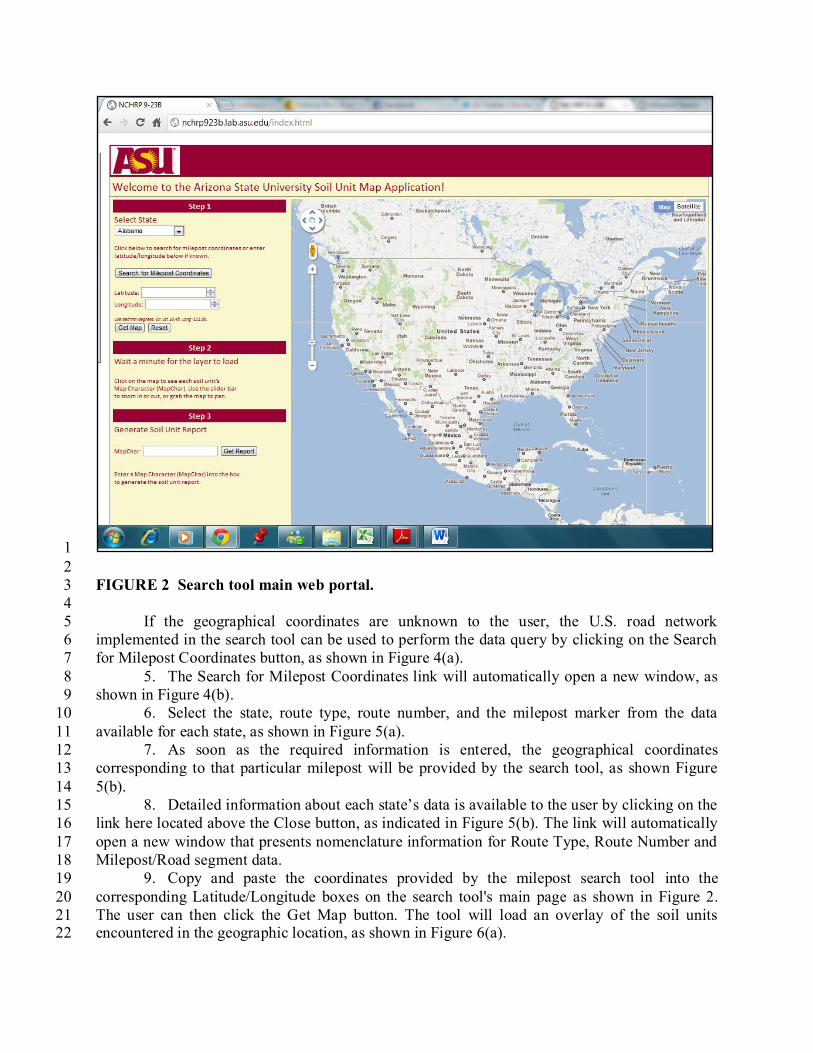
1. Access the interactive searching tool by visiting the following link: 6
http://nchrp923b.lab.asu.edu/index.html. The web portal will load, as shown in Figure 2. 7
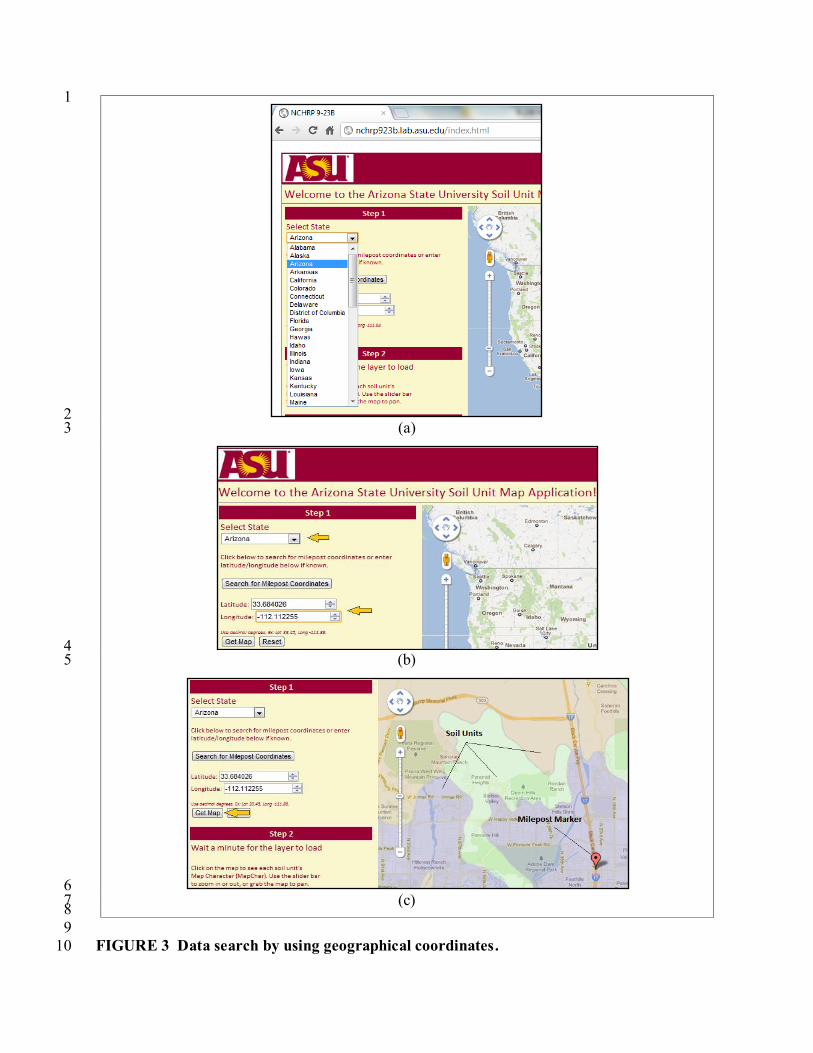
2. The data query can be performed either by inputting Geographical Coordinates or by 8
using Milepost markers from the US Road Network. When using Geographical Coordinates, the 9
user selects the desired state from a dropdown box menu, as shown in Figure 3(a). 10
3. Enter the latitude and longitude corresponding to the point of interest. The 11
coordinates must be entered using decimal degrees, as shown in Figure 3(b). 12
4. Once the desired state has been selected and the geographical coordinates inputted, 13
click the Get Map button and the interactive mechanism will command the mapping tool to zoom 14
into the location of interest. A marker indicating the location will be displayed. The mapping tool 15
will load an overlay of the soil units encountered in the area, as shown in Figure 3(c). The soil 16
unit overlay may take several seconds to a minute to load. 17
Collect milepost
data from DOTs
Collect soil unit
shapefiles from
NCHRP 9-23A
Clean data Convert shapefiles
to KMLs and
format
Collect database
from
NCHRP 9-23A
Convert to SQL
format
Standardize format
Create milepost and
segment identifiers
Geo-code milepost
and segment data
Format milepost
data and convert
to SQL
Create webpage and
add SQL tables and
KML files
Create a code to
display the soil
properties summary
Allow user to
generate map and
report
TRB 2013 Annual Meeting Paper revised from original submittal.
Zapata and Cary
10
1
2
FIGURE 2 Search tool main web portal. 3
4
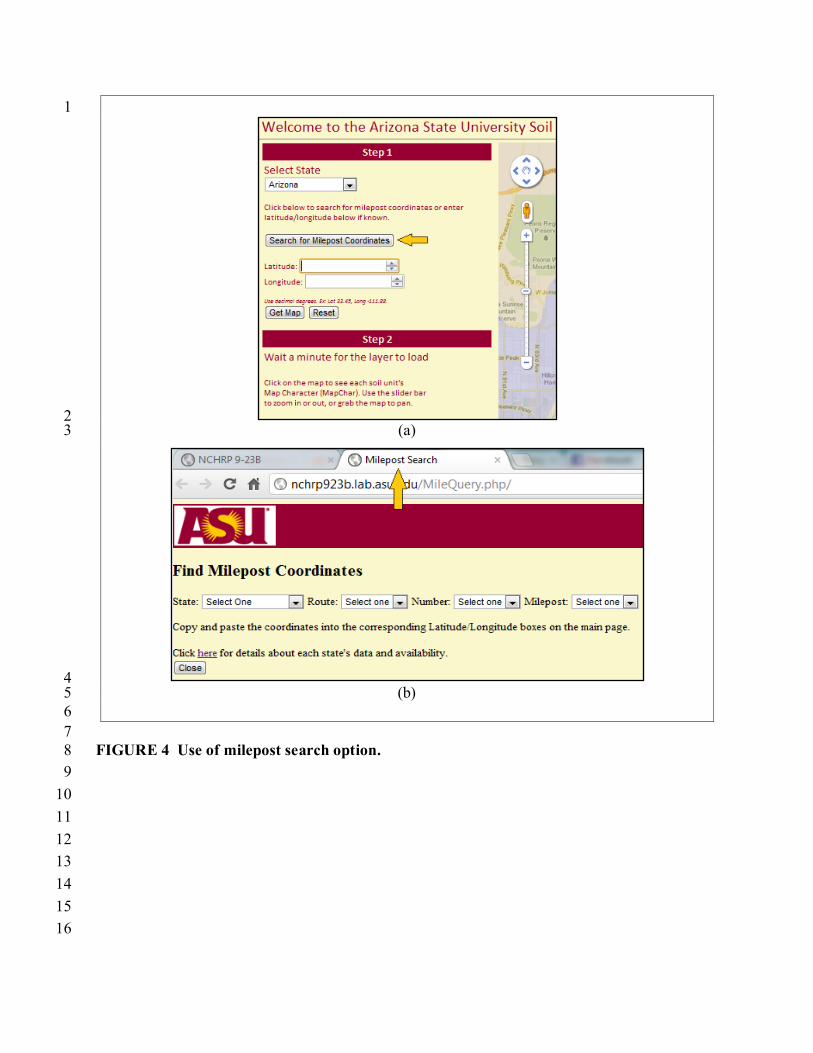
If the geographical coordinates are unknown to the user, the U.S. road network 5
implemented in the search tool can be used to perform the data query by clicking on the Search 6
for Milepost Coordinates button, as shown in Figure 4(a). 7
5. The Search for Milepost Coordinates link will automatically open a new window, as 8
shown in Figure 4(b). 9
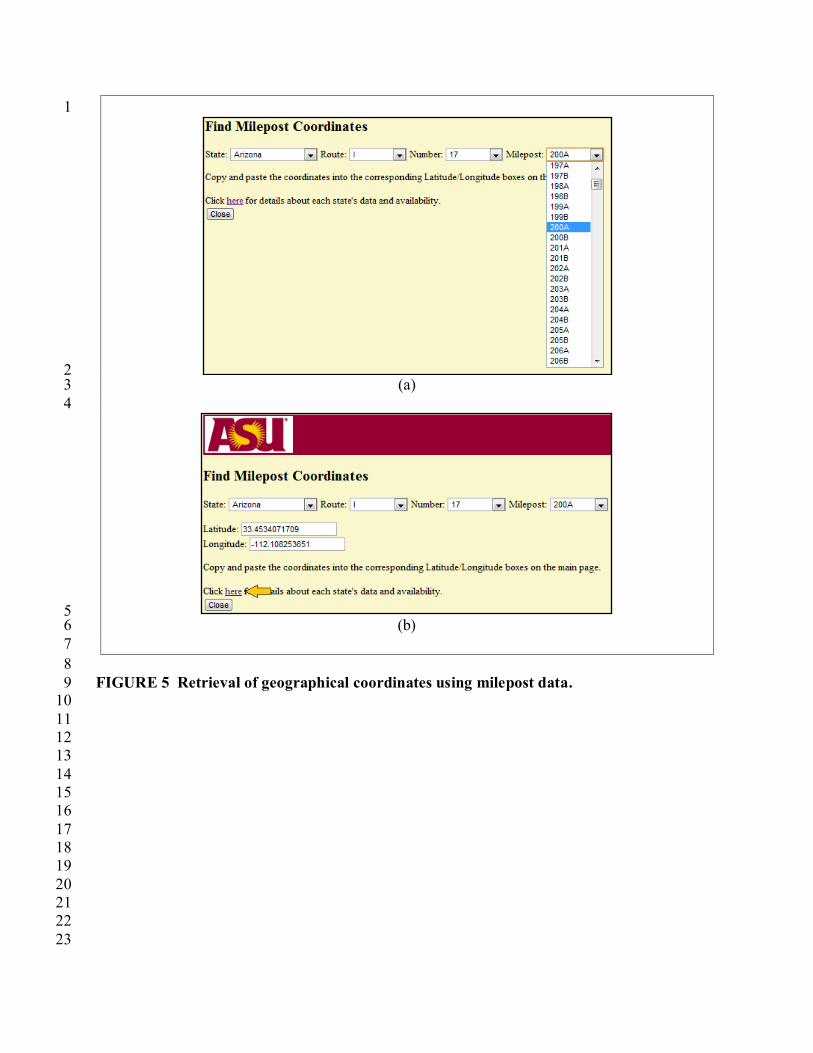
6. Select the state, route type, route number, and the milepost marker from the data 10
available for each state, as shown in Figure 5(a). 11
7. As soon as the required information is entered, the geographical coordinates 12
corresponding to that particular milepost will be provided by the search tool, as shown Figure 13
5(b). 14
8. Detailed information about each state’s data is available to the user by clicking on the 15
link here located above the Close button, as indicated in Figure 5(b). The link will automatically 16
open a new window that presents nomenclature information for Route Type, Route Number and 17
Milepost/Road segment data. 18
9. Copy and paste the coordinates provided by the milepost search tool into the 19
corresponding Latitude/Longitude boxes on the search tool's main page as shown in Figure 2. 20
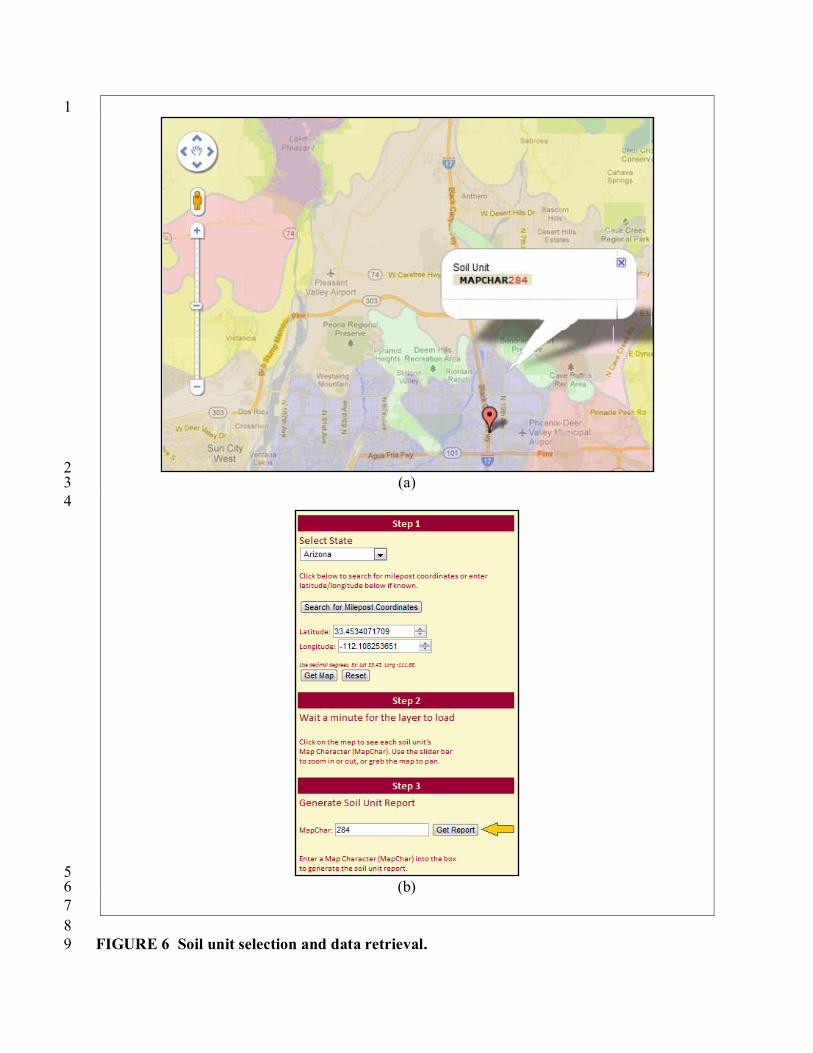
The user can then click the Get Map button. The tool will load an overlay of the soil units 21 encountered in the geographic location, as shown in Figure 6(a). 22
TRB 2013 Annual Meeting Paper revised from original submittal.
Zapata and Cary
11
1
2 (a) 3
4 (b) 5
6 (c) 7
8
9
FIGURE 3 Data search by using geographical coordinates. 10
TRB 2013 Annual Meeting Paper revised from original submittal.
Zapata and Cary
12
1
2 (a) 3
4 (b) 5
6
7
FIGURE 4 Use of milepost search option. 8
9
10
11
12
13
14
15
16
TRB 2013 Annual Meeting Paper revised from original submittal.
Zapata and Cary
13
1
2 (a) 3
4
5 (b) 6
7
8
FIGURE 5 Retrieval of geographical coordinates using milepost data. 9 10
11
12
13
14
15
16
17
18
19
20
21
22
23
TRB 2013 Annual Meeting Paper revised from original submittal.
Zapata and Cary
14
1
2 (a) 3
4
5 (b) 6
7
8
FIGURE 6 Soil unit selection and data retrieval. 9
TRB 2013 Annual Meeting Paper revised from original submittal.
Zapata and Cary
15
10. Once the soil units map is loaded, the user can use the slide bar to zoom in and out, or 1
grab the map to pan. The user should be able to identify the underlying soil units located across 2
the road segment under evaluation. By clicking on the soil unit of interest, its unique 3
identification code (MapChar code) will be displayed, as shown in Figure 6(a). 4
11. Input the identification code into the MapChar box, as shown in Figure 6(b). 5
12. Click the Get Report button to generate the Soil Unit report in a separate window, as 6
shown in Figure 7(a). 7
13. The user has two options: print out the report (Print Report) or close the window 8
(Close). These buttons are found at the bottom of the Soil Unit report window as shown in Figure 9
7(b). If the window is closed, the user will be re-directed to the main page. 10
CONCLUSIONS 11
The results of this study provide state engineers, industry and researchers with an interactive 12
search tool to extract unbound material property input data required for the M-EPDG. The 13
database integrated in the search tool is the final product of the NCHRP 9-23A project and 14
contains a full set of Level 3 data and most Level 1 and 2 information, including SWCC 15
parameters and saturated hydraulic conductivity. This information was initially provided in the 16
form of a national database implemented via GIS Soil Unit Maps for the entire United States and 17
Puerto Rico. The data comprises 31,100 soil units extracted from The U.S. Department of 18
Agriculture’s (USDA) Natural Resources Conservation Service (NRCS). 19
As part of NCHRP Project 9-23B, an interactive search tool was developed to integrate 20
the GIS-enabled national database of Soil Water Characteristic Curves and relevant soil index 21
properties with the M-EPDG software. Google Maps web service is the mapping tool used in this 22
project to display the soil unit maps. The interaction between the M-EPDG and Google Maps is 23
expected to be easily implementable and a great enhancement for the design tool program. 24
The search tool provides direct access to the maps and soil properties during operation of 25
the M-EPDG software through interactive use of the M-EPDG user-input coordinate points 26
(defined by latitude and longitude). It makes use of the input coordinates of latitude and 27
longitude to access both the appropriate soil unit map and a complete tabular summary of soil 28
property data at that particular location. 29
The tool is also capable of identifying each road segment by its official state mileposts 30
and link the mileposts to their respective latitude and longitude and soil unit areas, making it 31
possible for the user to input a specific highway or route milepost and immediately access the 32
major soil unit map located at that route milepost and a tabular summary of all relevant soil 33
property data. It should be mentioned that since the milepost marker data available was limited, 34
the milepost search feature does not work for the entire U.S. road network. However, the 35
milepost marker database can be continuously updated as more data becomes available. 36
RECOMMENDATIONS FOR FUTURE ENHANCEMENTS 37
The product of this research project is the first version of an interactive soil searching tool that 38
can be further enhanced not only by periodically updating the database but also by implementing 39
new features to simplify its operation. Some recommendations are given in this section. 40
41
42
43
TRB 2013 Annual Meeting Paper revised from original submittal.
Zapata and Cary
16
1
2 (a) 3
4
5 (b) 6
7
8
FIGURE 7 Display of soil unit data summary and print option. 9
TRB 2013 Annual Meeting Paper revised from original submittal.
Zapata and Cary
17
Upgrading the Soil Property Database 1
The soil property database used to develop the search tool was entirely based on the database 2
collected, stored, maintained, and distributed by the U.S. Department of Agriculture’s (USDA) 3
Natural Resources Conservation Service (NRCS). The NRCS database is an excellent source for 4
determining the regional distribution and general characteristics of soils for urban and rural 5
engineering projects. The NRCS information is divided into three soil geographic databases that 6
primarily differ in the scale used for mapping the different soil units. The three soil geographic 7
databases are: 8
The Soil Survey Geographic (SSURGO) database, 9
The State Soil Geographic (STATSGO) database, and 10
The National Soil Geographic (NATSGO) database. 11
The components of map units in each database are different and correspond to a differing 12
level of detail. The SSURGO database, for example, provides the most detailed level of 13
information while NATSGO has a somewhat lower level of detail and is primarily used for 14
national and regional resource appraisal, planning, and monitoring. The information used in this 15
project is based on the National Soil Geographic (NATSGO) database. Therefore, there is 16
opportunity for upgrading the database to STATSGO or even the SSURGO level in the future. 17
Updating the U.S. Road Network Milepost Marker Database 18
As previously mentioned, the milepost marker information used for this project is limited by the 19
fact that some state DOTs make use of a different referencing system. It is expected that DOTs 20
will continuously improve their databases, which will allow updates to the road network database 21
in the future. 22
Implementing a Direct Input Feature from the M-EPDG Interface to the Search Tool 23
The search tool developed in this study was intended to be linked to the M-EPDG software 24
originally issued for public evaluation in 2004. This software is no longer available, having been 25
superseded by DARWin-ME in September 2011. Even though the search tool developed here 26
functions independently of either the M-EPDG or DARWin-ME, adding a link from either 27
program to the web-server where the tool is available should not be difficult and will greatly 28
improve the input process. 29
Enhancement of Data Retrieving Methodology and Visual Display 30
Currently, the interactive tool is capable of performing the data search for a single location at a 31
time. Ideally, the tool should be able to search for multiple locations at the same time. This 32
enhancement would save time and resources when the project being designed is of considerable 33
size. 34
ACKNOWLEDGEMENT 35
This study was supported by the National Cooperative Highway Research program under the 36
NCHRP 9-23B project. The authors would like to acknowledge and thank the support, guidance 37
and edits of our NCHRP Program Manager, Dr. Ed Harrigan. 38
Also, the authors express their gratitude to Natalie Lopez and Gustavo Torres, student 39
workers at ASU, who went far and beyond in helping to generate and develop both the soil 40
property searching tool and the database. 41
TRB 2013 Annual Meeting Paper revised from original submittal.
Zapata and Cary
18
REFERENCES 1
1. Witczak, M.W., C.E. Zapata, and W.N. Houston. Models Incorporated into the Current 2