INTEGRATING AN ELECTROSTATIC PRECIPITATOR INTO A MUNICIPAL SOLID WASTE RESOURCE RECOVERY SYSTEM JON PEACY UOP, Inc. Des Plaines, I I I inois ABSTRACT The body of information presented in this paper is directed toward Consulting Enneers whose clients are municipalities, toward Municipal, County and Regional E ngineers involved with resource recovery facilities, and toward vendors of electrostatic pre- cipitators. Studies were performed evaluating the require- ments of a cost effective rigid discharge electrode precipitator to be inteated into a municipal solid waste resource recovery facility. Those studies re- sulted in the selection of an electrostatic precipita- tor that would meet stringent requirements. INTRODUCTION This paper describes selection of the design criteria for the integration of an electrostatic pre- cipitator into a municipal solid waste resource re- covery system. Basically, an electrostatic precipitator is an elec- trical and mechanical device that uses an electric field for removing solid or liquid particles from the gas in which the particles are carried in suspension. A more thorough description of this device is con- tained in the literature listed in the Reference sec- tion of this paper [1]. One advantage of the application of the electro- static precipitator is that it treats or precipitates most particles from hi temפrature gases. There are some applications that suggest precipitators can be used at temperatures as high as 705 C (1300 F). Ordinarily, however, the temperature of their ap- plication does not exceed 5 40 C ( l 000 F) [ l ] . Most have no moving mechanical parts exposed to the flue gas stream, thus eliminating mechanical wear. They have automatic solid state electrical controls that conSistently maintain proper electri- cal conditions. In addition to the capabilities of high temperature operation, low wear and con- sistant operation, they can be arranged to yield a "Gear Stack" or optically invisible exhaust gas plume. No other air pollution control device now available offers all of the above characteristics. EMISSION LIMITATIO NS The Clean Air Amendments of 1970 [2], Sec- tion III, empowered the Administrator to establish "Federal Standards of Performance for New urces." At the same time ction 1 10 of this Act required each state to adopt a plan for implemen- tation, maintenance and enforcement of such pri- mary standards. Each of the above has resulted in an emission limitation on municipal refuse fired resource recovery units (Particulate limits). a result of the Sierra Club challenge in 1972, the Supreme Court in 1973 ordered the United States Environmental Protection Agency to provide for nondeterioration. This was accomplished on cember 5 , 1975 [3]. Another result of this has been the recent publication of the "major source" criteria [4] . Briefly, this limitation requires any "major source" seeking to locate in a "nonattain- 159
Transcript
INTEGRA TING AN ELECTROST A TIC PRECIPITATOR INTO A
MUNICIPAL SOLID WASTE RESOURCE RECOVERY SYSTEM
JON PEACY UOP, Inc.
Des Plaines, III inois
ABSTRACT
The body of information presented in this paper is directed toward Consulting Engineers whose clients are municipalities, toward Municipal, County and Regional Engineers involved with resource recovery facilities, and toward vendors of electrostatic precipita tors.
Studies were performed evaluating the requirements of a cost effective rigid discharge electrode precipitator to be integrated into a municipal solid waste resource recovery facility. Those studies resulted in the selection of an electrostatic precipitator that would meet stringent requirements.
INTRO DUCTION
This paper describes selection of the design criteria for the integration of an electrostatic precipitator into a municipal solid waste resource recovery system.
Basically, an electrostatic precipitator is an electrical and mechanical device that uses an electric field for removing solid or liquid particles from the gas in which the particles are carried in suspension. A more thorough description of this device is contained in the literature listed in the Reference section of this paper [1].
One advantage of the application of the electrostatic precipitator is that it treats or precipitates most particles from high temperature gases. There are some applications that suggest precipitators can
be used at temperatures as high as 705 C (1300 F). Ordinarily, however, the temperature of their application does not exceed 5 40 C ( l 000 F) [ l ] . Most have no moving mechanical parts exposed to the flue gas stream, thus eliminating mechanical wear. They have automatic solid state electrical controls that conSistently maintain proper electrical conditions. In addition to the capabilities of high temperature operation, low wear and consistant operation, they can be arranged to yield a "Gear Stack" or optically invisible exhaust gas plume. No other air pollution control device now available offers all of the above characteristics.
EMISSION LIMITATIONS
The Clean Air Amendments of 1970 [2], Section III, empowered the Administrator to establish "Federal Standards of Performance for New Sources." At the same time Section 110 of this Act required each state to adopt a plan for implementation, maintenance and enforcement of such primary standards. Each of the above has resulted in an emission limitation on municipal refuse fired resource recovery units (Particulate limits).
As a result of the Sierra Club challenge in 1972, the Supreme Court in 1973 ordered the United States Environmental Protection Agency to provide for non deterioration. This was accomplished on December 5 , 1975 [3]. Another result of this has been the recent publication of the "major source" criteria [4] . Briefly, this limitation requires any "major source" seeking to locate in a "nonattain-
159
ment area" to "improve" the air quality in that area. A major source is defined by the following:
Pollutant Emitted
Particulate Matter
Sulfur Oxides
Nitrogen Oxides
Nonmethane Hydrocarbons
(Organics)
Carbon Monoxide
Limitation
Tons/Year t/Year
100 90.7 100 90.7 100 100
1000
90.7 90.7
907.2
At this writing, there is considerable controversy over these regulations and Congress is constantly redefIning these to allow for economic growth.
PROJECT REQUIREMENTS
For the purpose of this paper, the following emission limitations imposed by the above regulations are defmed.
Pollutant
Particulates
Sulfur Dioxide
Carbon Monoxide
Oxidants
Nitrogen Dioxide
Attainment
Yes
Yes
No
No
Yes
With this in mind and the major source criteria listed before, the resource recovery facility would be limited to less than 100 tons (90.7 t) per year of photo chemical oxidant emissions and less than 1000 tons (907.2 t) per year carbon monoxide
• • emlssIOns.
The emissions of both of these contaminants can be held to very low levels if the proper type of stoker and boiler control are included in the incineration system design. The items that operate to yield these low emissions are: (a) a variable stoker feed rate which is controlled by the furnace temperature and operates to hold a constant furnace temperature which assures burn up of the photochemically reactive hydrocarbons; (b) proper agitation of the refuse bed that assures better than 95 percent burnout of combustible matter; (c) the even high pressure underfIre air that results in intensive complete burning of orga,nics; Cd) the position and amounts of overfIre air that assure complete destruction of the uncombusted gases and partially combusted gases as they rise through the furnace; and (e) a combustion chamber with the "arch" design and long retention times to assure essentially complete burnout.
With all of the above operating on the "slow moving" refuse the emission of photo chemical oxidants and carbon monoxide is well under the statutory limits of the "major source" requirements. Several emission tests conducted at the Chicago ( Northwest) and Harrisburg installations have confIrmed the above. The particulate emission limits that the resource recovery facility would be required to meet are:
The SignifIcant deterioration limitations that apply are:
Particulate Matter
Annual Geometric Mean
24 Hr Maximum
Sulfur Dioxide
Annual Arithmetic Mean
24 Hr Maximum
3 Hr Maximum
Maximum Allowable
Increase
Ilg/m3
5 10
40 182 700
The electrostatic precipitator will operate to limit the emissions of particulate matter to levels that satisfy the above criteria and the low sulfur content of the fuel and proper atmospheric dispersion characteristics will operate to satisfy the sulfur emissi on criteria.
160
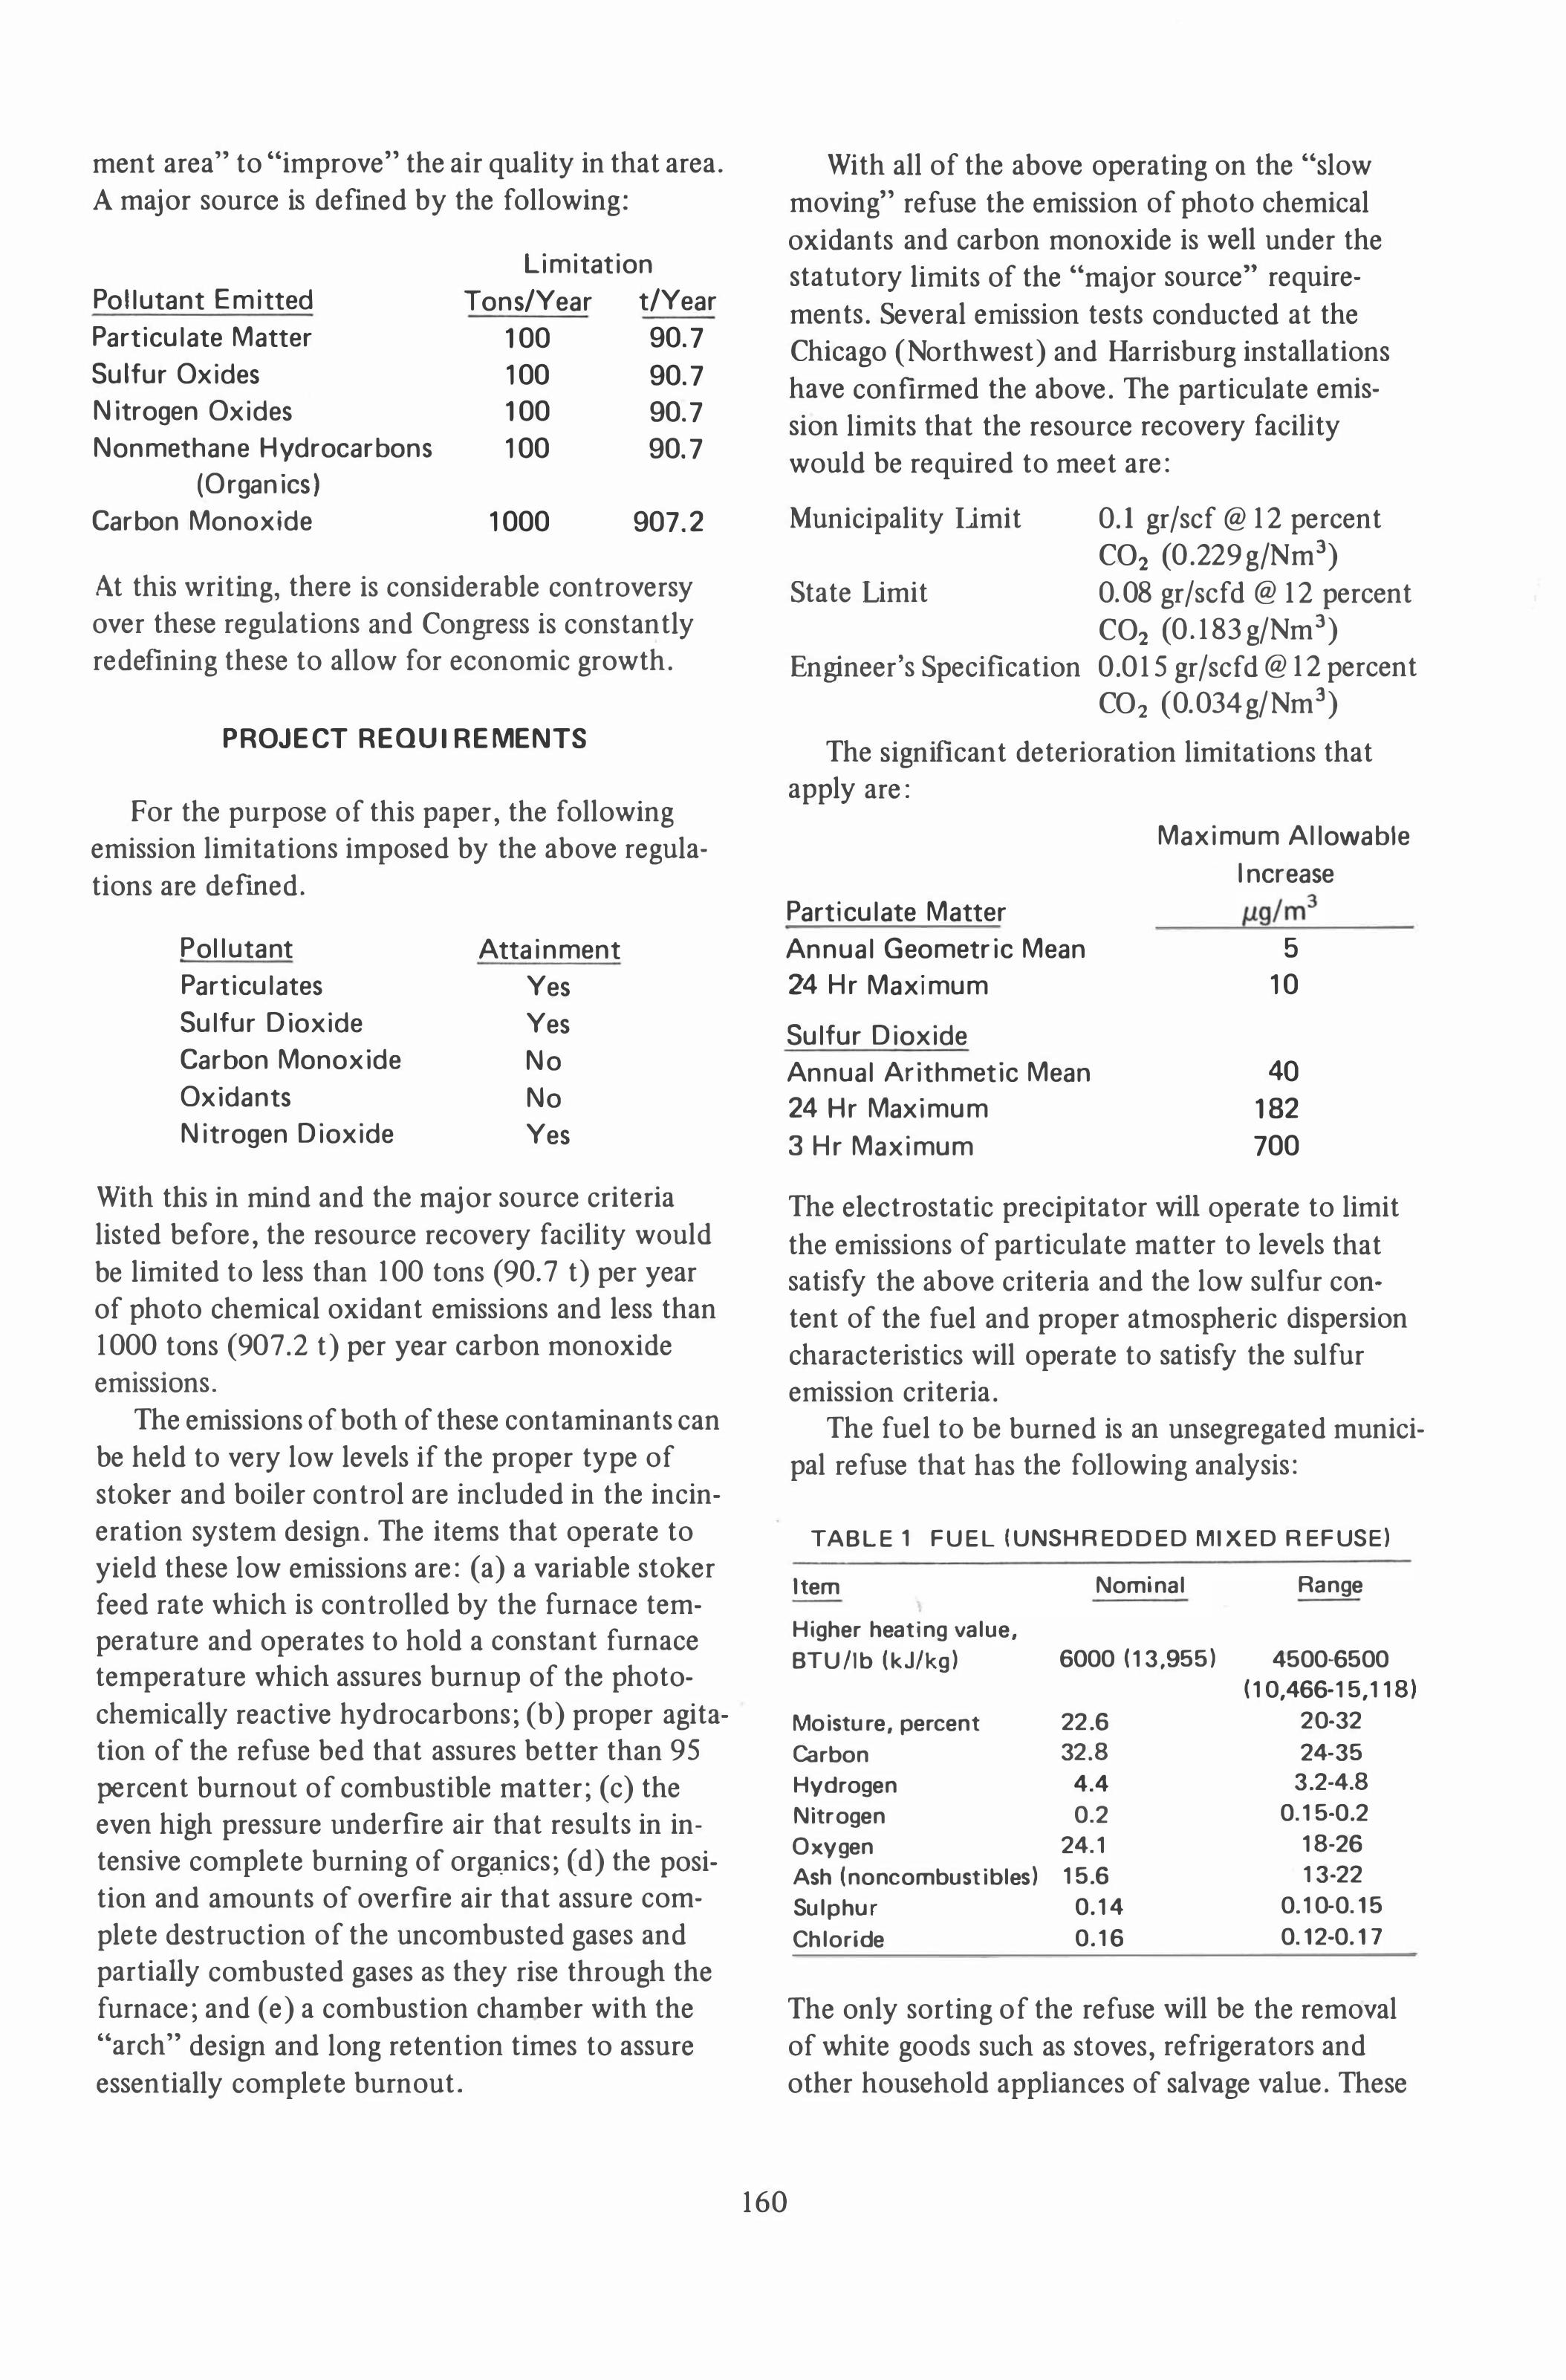
The fuel to be burned is an unsegregated municipal refuse that has the following analysis:
TABLE 1 FUEL (UNSHREDDED MIXED REFUSE)
Item
Higher heating value,
BTU!lb (kJ!kg)
Moisture, percent
Carbon
Hydrogen
Nitrogen
Oxygen
Ash (noncombustibles)
Sulphur
Chloride
Nominal Range
6000 (13,955) 4500-6500
22.6
32.8
4.4
0.2
24.1
15.6
0.14
0.16
(10,466-15,118)
20-32
24-35
3.2-4.8
0.15-0.2
18-26
13-22
0.10-0.15
0.12-0.17
The only sorting of the refuse will be the removal of white goods such as stoves, refrigerators and other household appliances of salvage value. These
will be removed prior to combustion and are not considered in the above analysis.
ADVANTAGES OF AN
ELECTROSTATIC PRECIPITATOR
There are many advantages of using an electrostatic precipitator to clean the exhaust gases. Several of these are mentioned in the literature [5-7].
For the convenience of the reader, some of these advantages are listed below:
1. Low wear due to no moving parts within the flue gas stream.
2. Automatic controls for consistent electrical operation.
3. Tolerant to large temperature fluctuations. 4. Ability to yield an invisible plume (clear
stack). 5. Low flue gas pressure drop. With these advantages and the inherent uniform
refuse feed rate of the reverse reciprocating stoker [7] that yields an excellent burnout and a nearly ideal low-dust (minimum combustible) content flue gas for collection, the use of an electrostatic precipitator is an excellent choice.
DETERMINATION OF DESIGN PARAMETERS
The selection of design parameters was based on 50 years past experience with municipal refuse burning facilities, many of which included selection, operation, maintenance and installation of electrostatic vrecipitators. The parameters follow:
1. Determination of the type of fuel. The fuel analysis was provided by the client. This expected analysis was investigated, and it was determined that the precipitator would have no difficulty with the particulates from this fuel.
2. To determine gas volume and temperature using the expected fuel analysis provided above, a series of combustion calculations were performed that yielded a stoichiometric gas volume. Because of inaccuracies in gas flow measurement by pitot tube, variable fuel composition, in leakage in negative pressure systems and temperature fluctuations in the flue gas stream, a margin or "safety factor" of 15 percent was used. * The design temperature for the flue gas was set by the stoker supplier and would be expected to rise by 12.5 percent during the course of operation of the unit between maintenance periods.
'See Appendix.
16 1
3. Determination of minimum precipitator requirements. These included gas velocities in the collecting plate area, minimum collection efficiency during an electrical malfunction, a model study for gas flow optimization, discharge and collecting electrodes, rappers and controls, electrical equipment controls and indicators, safety system and a "third party" field performance test.
METHOD OF DESIGN
A decision was made to have a "clear stack" in which no visible contaminant would appear from the stack when the system was operating. This was done to comply with the emission standard established by the Engineer's specified limit. A generally accepted emission loading that is invisible to the eye lies in the range of from 0.0 1 to 0.02 gr/ft3 [8].
The gas volume and composition were calculated from the fuel analysis by standard methods [9].
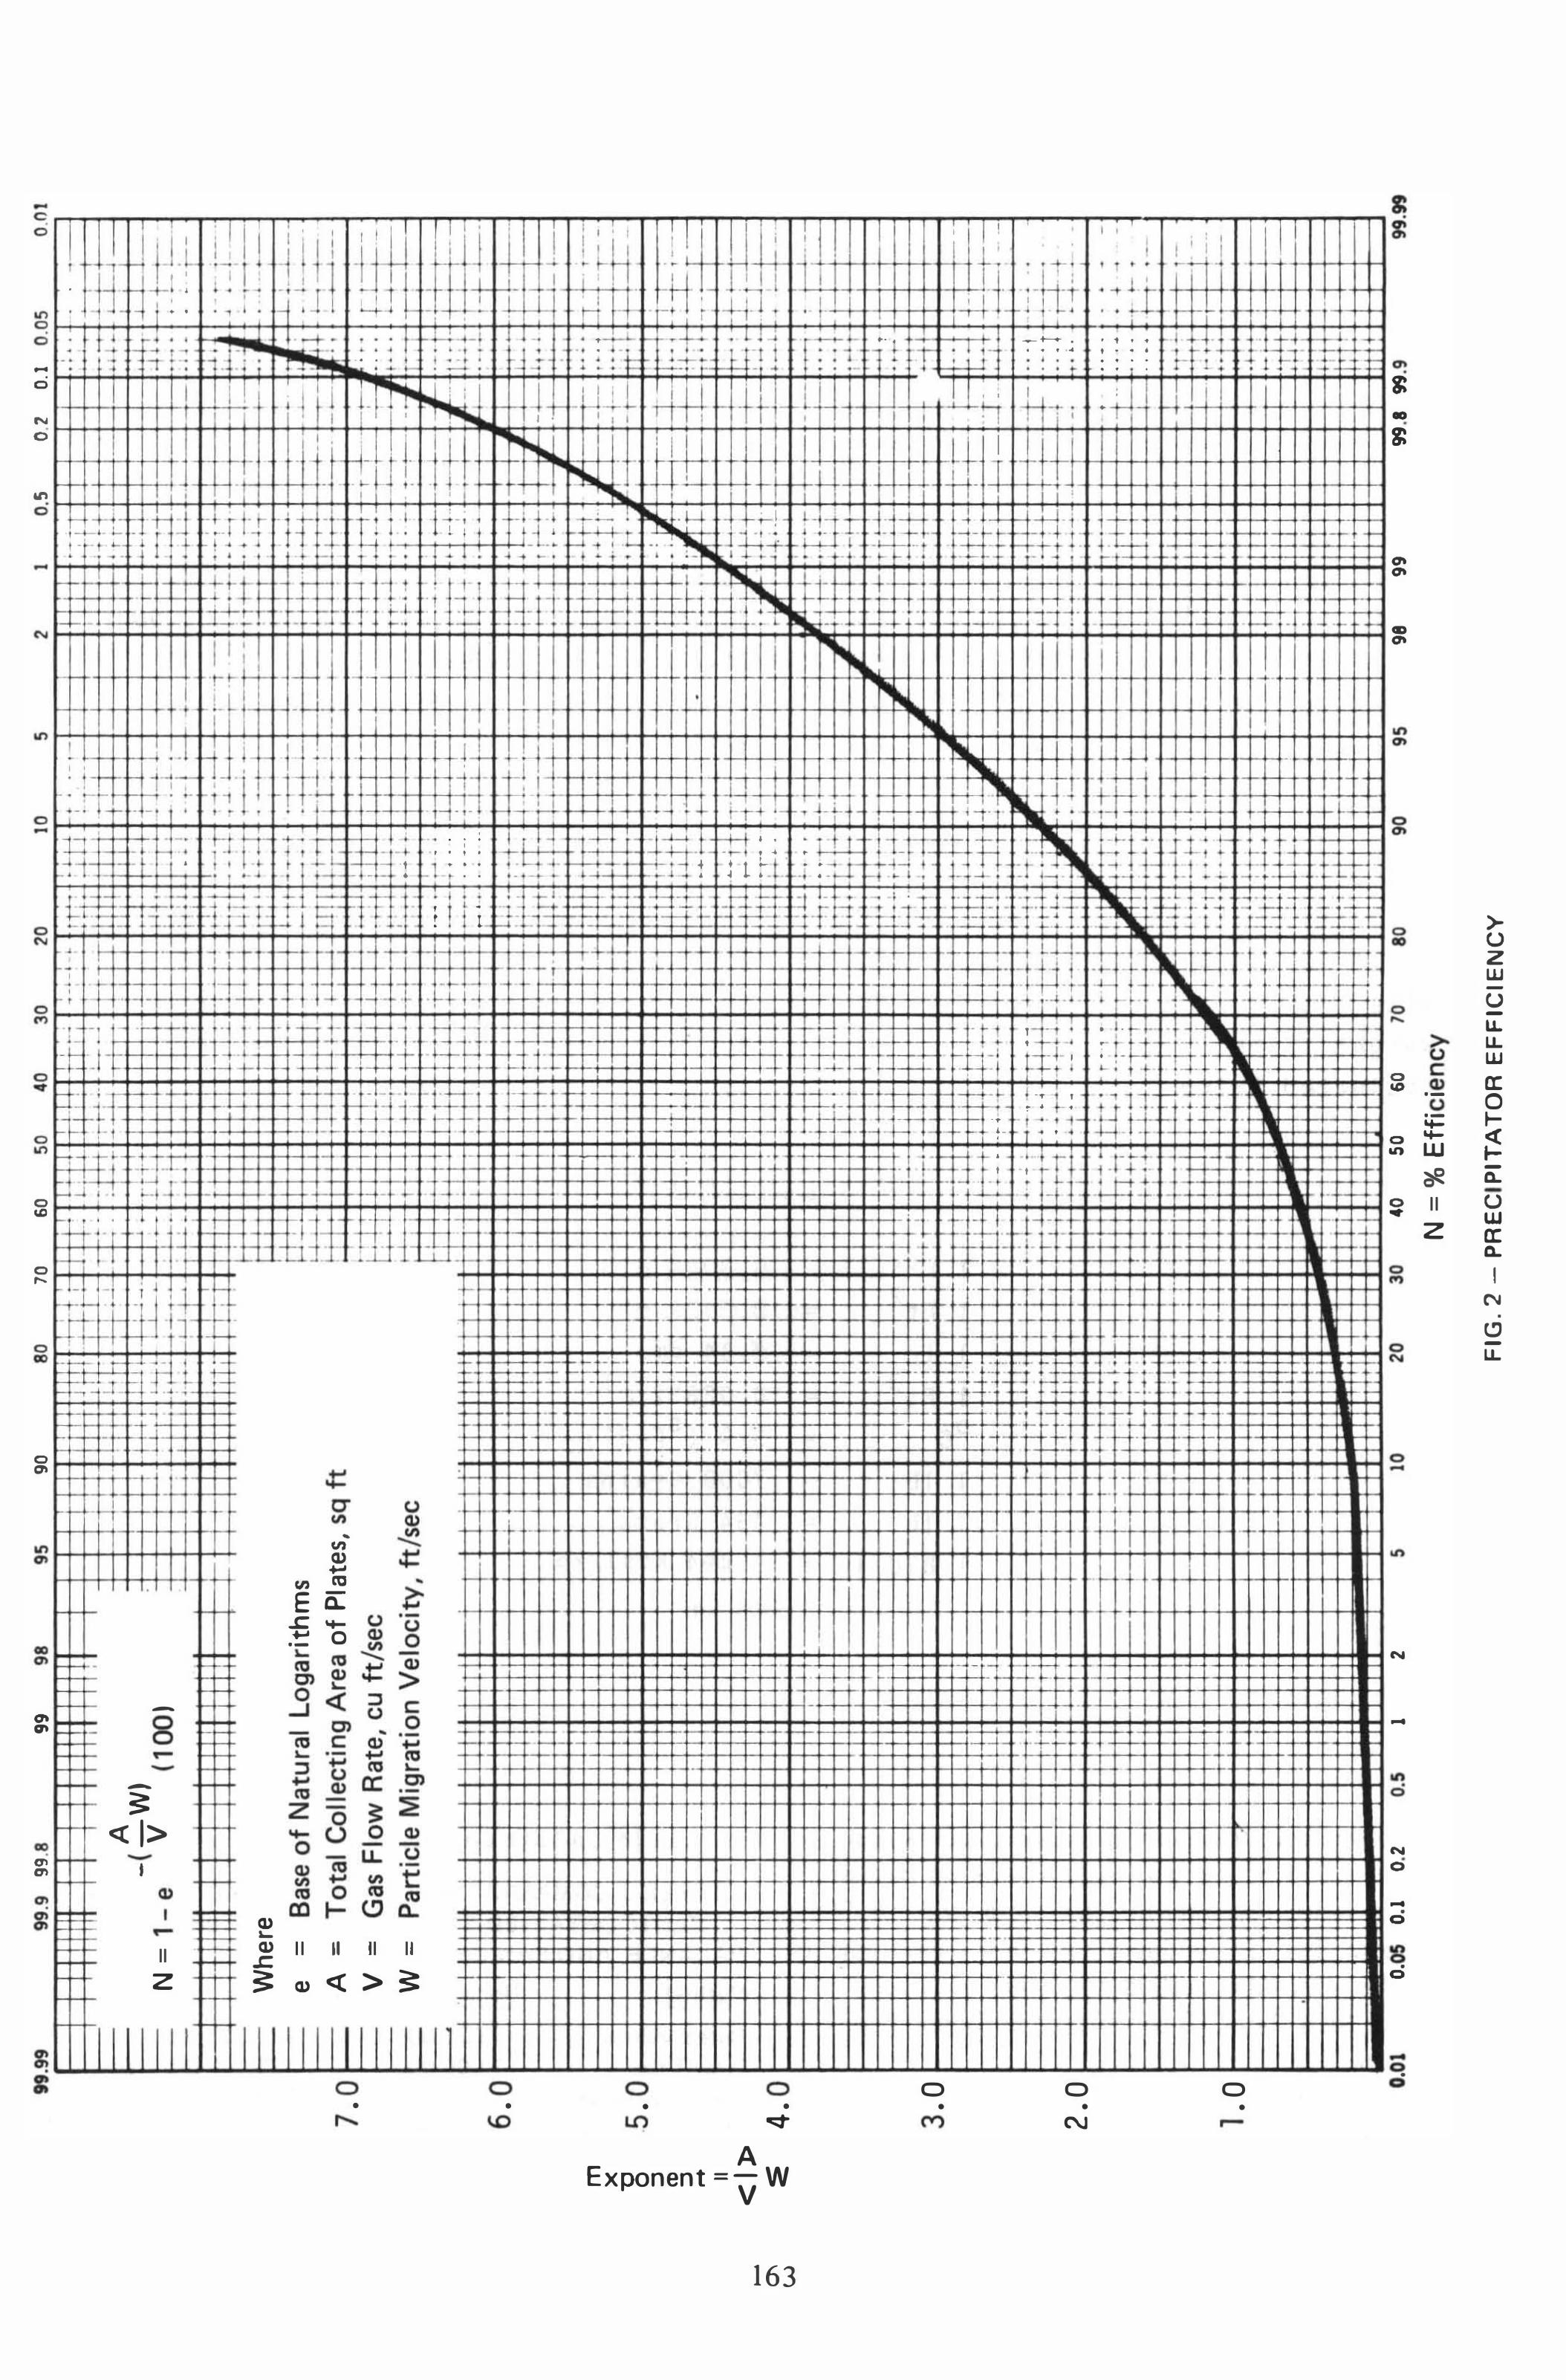
Using these efficiencies, dust loadings and gas volumes, the precipitator efficiency curve in Fig. 2
was entered to determine a minimum collecting surface area. The parameters used with this curve were taken from test data on similar installations and from [8] .
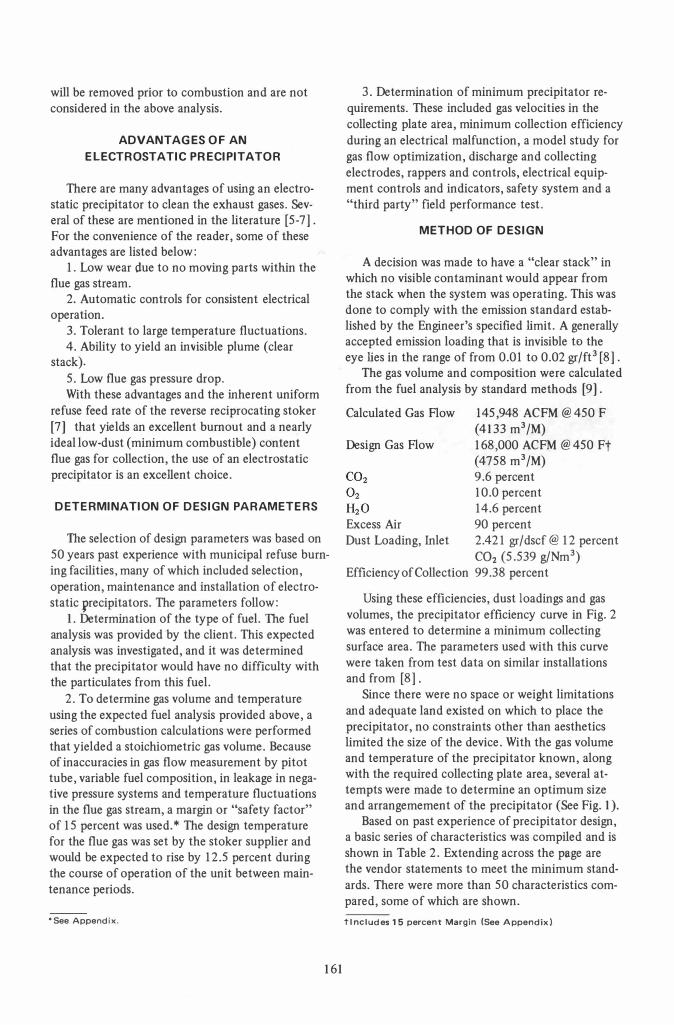
Since there were no space or weight limitations and adequate land existed on which to place the precipitator, no constraints other than aesthetics limited the size of the device. With the gas volume and temperature of the precipitator known, along with the required collecting plate area, several attempts were made to determine an optimum size and arrangemement of the precipitator (See Fig. 1).
Based on past experience of precipitator design, a basic series of characteristics was compiled and is shown in Table 2. Extending across the page are the vendor statements to meet the minimum standards. There were more than 50 characteristics compared, some of which are shown.
tlncludes 15 percent Margin (See Appendix)
,
•
SUMMARY
The evaluations of vendors in Table 2 shows their comparative adequacy in meeting the minimum standards. The minimum standards set were exceeded in almost every case. The difference in design and features were evaluated on a weightedaverage basis in which points were awarded for those characteristics judged to reflect conservatism, efficiency and reliability. The offerings of Vendors B and E were judged to be the best from an engineering standpoint. When the characteristic of evaluated price was applied, Vendor B emerged as the preferred Vendor.
APPENDIX PROVIDING TO L ERANCE IN
PRECIPITATOR GAS VOLUM E D ESIGN
There are several reasons for providing a tolerance in the amount of gas volume that enters a precipitator.
First is the problem of a varying fuel composition that will affect the quantity of flue gas. Presented below are some calculated flue gas weights
j
•
-•
FIG. 1 TYPICAL UOP INSTALLATION
ELECTROSTATIC PRECIPITATORS
ON LEFT
per pound of refuse, based on various heat content fuels for a recent project as:
Btu/lb
6000 5000 4700 3750
# Flue Gas/ # Refuse
9.33 7.07 6.47 4.62
These are at 90 percent excess air.
Second is the problem of inleakage in the negative pressure portion of the process. Based on selected results from the 1975 tests on the Chicago Northwest Units, an inleakage of from 1 percent to 10 percent can be expected (some of this may be attributable to measurement error).
Third, the problem of measuring error exists. There was, and is, a problem with the E P A Method 5 sampling train. This error problem is caused by the effect of the sampling probe on the pitot tube and thermocouple mounted together. Recently, the literature has been specific to this problem, with windtunnel tests showing a possible 15 percent error in gas volume measurements.
In line with the above discussion, refer to pp. 287 and 29 1 of Harry J. White's book on Industrial Electrostatic Precipitation [8] . On p. 288, Mr. White suggests that "In conducting gas flow measurements by the pitot tube method, to assume accuracies no better than about 10 percent for fairly good conditions. "
An example of these problems is illustrated by the following:
0.3048 mPS
0.0929 m 2
2.54 ern 0.02832 m3
5/9 ( oF-32 )
7000 Grains
454 Grams
0.494 keal/kg 454 kg
1. In [8] , a table appears and is presented below:
TABLE 3 COMPARATIVE GAS FLOW MEASURE
MENTS OBTAINED BY PITOT TUBE, CARBON
BALANCE, AND FAN CHARACTERISTICS METHODS
Method Boiler Steam Flow Gas Flow
Rated Values 920,OOO lb/hr 415,ooO cfm
Pitot Tube 1,000,000 523,000 (5 tests)
Carbon Balance 1,000,000 528,000 (5 tests)
Fan Characteristics 1,000,000 524,000
164
The purpose of the above table is to illustrate the discrepancy that can exist with pitot tube measuring versus "calculated" quantities.
2. Some actual test results taken from the Chicago Northwest Units:
TABLE 4 TEST RESULTS
Method
Rated Values
Pitot Tube 12/71
Pitot Tube 12/71
Pitot Tube 5/77
Boiler Steam Flow
110,000 Ib/hr
110,000
110,000
100,000
Gas Flow
94,027 ACFM
109,600 ACFM
107,600 ACFM
115,500 ACFM
The fourth reason is the known temperature rise in the flue gas as the boiler heat exchange surfaces become dirty. This 100 F to 150 F temperature rise will increase the gas volume significantly.
Based on the above four reasons and the supporting data, a tolerance of + 15 percent is reasonable to provide in electrostatic precipitator gas flow sizing.
REFERENCES
[1) Danielson, J. A., Air Pollution Engineering Manual,
Air Pollution Control District County of Los Angeles,
U. S. Dept. H.E.W., Cincinnati, Ohio, 1967.
[2) House of Representatives, 91 st Congress, 2nd Session,
Report No. 91-1783 December 17, 1970.
[3) Federal Register, Vol. 39, pg. 42510, December 5,
1974.
[4) Federal Register, Vol. 41, pg. 55524, December 21,
1976.
[5) Oglesby, S., Jr., A Manual of Electrostatic Precipitator
Technology, Vol. 2, Southern Research Institute,
Birmingham, Alabama, 1970.
[6) Bump, R. L., "The Use of Electrostatic Precipitators
on Municipal Incinerators in Recent Years," Proceed
ings of 1976 National Waste Processing Conference,
ASME, Boston, Massachusetts, p. 193, May 1976.
[7) Stabenow, G., "Performance of the New Chicago
Northwest Incinerator," Proceedings of 1972 National
Incinerator Conference, ASME, New York, New York,
p. 178, June 1972.
[8) White, H. J., Industrial Electrostatic Precipitation,
Addison-Wesley, Reading, Massachusetts, 1963.
[9) Steam, Its Generation and Use, Babcock & Wilcox,
38th Edition.
Key Words
Air Combustion Hydrocarbon Incinerator Particulate Matter Precipitator Regulations
165
Questions by
Question 1
Professor A. Buekens
University of Brussels
Large European municipal incinerators are
always fitted with electrostatic precipitators, the
maximum operating temperature of which is about
300 C. Due to boiler fouling the precipitator inlet
temperature generally increases from an initial temperature of, say, 240 C to the maximum opera
ting temperature; when this temperature is attained
the incinerator has to be shut down for boiler
cleaning.
Which modifications in construction mode and
material are required for attaining an operating
temperature not exceeding 540 C?
Question 2
In the paper no reference is made to HCI emis
sion. In Western Europe it is impossible to meet
HCI emission standards without supplementing the
E.s. precipitator with a wet scrubber.
Are there HCI-emission standards in the U.S.A.
and how do they affect the flue gas purification
problem?
AUTHORS REPLY
Question 1
A. We agree that large European municipal
incinerators are fitted with electrostatic precipita
tors. The boiler outlet flue gas temperatures do
vary with regard to boiler fouling and in general do rise with time between cleanings. Please refer to
166
the appendix to the paper where a tolerance in
design gas volumes takes into account the increase
in volume with temperature rise, and helps assure
the meeting of the guaranteed emission limits.
Since our designs for municipal solid waste
energy recovery units require the maximum energy recovered, we try to limit our flue gas emitted to the lowest practical temperature levels. These low
est levels are limited by considerations of heat
recovery and the corrosive nature of the flue
gases. When these are taken into account it is dif
ficult to justify designing the precipitator to
operate at higher levels, such as 540 C.
B. With regard to a change in materials or con
struction mode to meet higher operating tempera
tures, we wish to answer as follows: Normally the use of a mild steel such as ASTM
A-36 is used up to 400 C, then consideration is
given to other materials. The selection of the other
materials would require knowledge of:
1. Mode of operation
a. Continuous
b. Intermittent
c. Cleaning cycle
2. Insulation requirements
3. Flue gas composition
4. Operating pressure
5. Physical constraints In the event a low alloy corrosion resistant
material such as corten is required, then much the