2014 WM2014 Conference, March 2-6, 2014, Phoenix, Arizona, USA Integrating Decontamination Strategies into a Waste Estimation Support Tool for Radiological Incidents - 14324 Paul Lemieux U.S. Environmental Protection Agency Research Triangle Park, NC 27711 USA Timothy Boe Oak Ridge Institute for Science and Education Research Triangle Park, NC 27711 USA Phone: (919) 541-2482 Fax: (919) 5421-0496 Dan Schultheisz, Tom Peake U.S. Environmental Protection Agency Washington, DC 20460 USA Colin Hayes Eastern Research Group, Inc Morrisville, NC 26560 USA ABSTRACT In the planning and preparedness stages for a response to radiological contamination incidents, it is important to include waste management considerations when developing the decontamination/demolition/cleanup approach because waste management can impact the overall timeframe and cost of recovery. The U.S. Environmental Protection Agency’s (EPA’s) Waste Estimation Support Tool (WEST) is a novel application of the Federal Emergency Management Agency (FEMA) Hazus-MH software. The WEST enables users to estimate the characteristics, amount, and residual radioactivity of waste generated from remediation and cleanup activities after a radiological incident, including radiological dispersal devices, improvised nuclear devices, and nuclear power plant accidents. Using Geographic Information System (GIS) shapefiles that define the contaminated areas, the general building stock (GBS) inventories of Hazus-MH are queried using a standalone executable application capable of generating square footage and building count inventories based on user-defined building occupancy classes (taken from Hazus-MH’s list of building occupancy classes). The resulting GBS inventories are then used to calculate location-specific waste and debris as a function of user-defined decontamination and demolition approaches. Remediation strategies can be evaluated in terms of potential implications on cost, occupancy types, remediation timeline, volumes of waste generated, and level of effort. Results are viewable in a custom Excel-based graphical user interface. The WEST has been used to support waste management planning activities resulting from hypothetical radiological dispersal device (RDD) incidents for the Liberty RadEx National Level Exercise in 2010 and for the Wide Area Recovery and Resiliency Program in 2012. This paper will describe the recently released update to the WEST, which includes the ability to make decontamination and demolition 1
Transcript
2014 WM2014 Conference, March 2-6, 2014, Phoenix, Arizona, USA
Integrating Decontamination Strategies into a Waste Estimation Support Tool for Radiological Incidents - 14324
Paul Lemieux
U.S. Environmental Protection Agency Research Triangle Park, NC 27711 USA
Timothy Boe
Oak Ridge Institute for Science and Education Research Triangle Park, NC 27711 USA
Phone: (919) 541-2482 Fax: (919) 5421-0496
Dan Schultheisz, Tom Peake U.S. Environmental Protection Agency
Washington, DC 20460 USA
Colin Hayes Eastern Research Group, Inc Morrisville, NC 26560 USA
ABSTRACT In the planning and preparedness stages for a response to radiological contamination incidents, it is important to include waste management considerations when developing the decontamination/demolition/cleanup approach because waste management can impact the overall timeframe and cost of recovery. The U.S. Environmental Protection Agency’s (EPA’s) Waste Estimation Support Tool (WEST) is a novel application of the Federal Emergency Management Agency (FEMA) Hazus-MH software. The WEST enables users to estimate the characteristics, amount, and residual radioactivity of waste generated from remediation and cleanup activities after a radiological incident, including radiological dispersal devices, improvised nuclear devices, and nuclear power plant accidents. Using Geographic Information System (GIS) shapefiles that define the contaminated areas, the general building stock (GBS) inventories of Hazus-MH are queried using a standalone executable application capable of generating square footage and building count inventories based on user-defined building occupancy classes (taken from Hazus-MH’s list of building occupancy classes). The resulting GBS inventories are then used to calculate location-specific waste and debris as a function of user-defined decontamination and demolition approaches. Remediation strategies can be evaluated in terms of potential implications on cost, occupancy types, remediation timeline, volumes of waste generated, and level of effort. Results are viewable in a custom Excel-based graphical user interface. The WEST has been used to support waste management planning activities resulting from hypothetical radiological dispersal device (RDD) incidents for the Liberty RadEx National Level Exercise in 2010 and for the Wide Area Recovery and Resiliency Program in 2012. This paper will describe the recently released update to the WEST, which includes the ability to make decontamination and demolition
1
2014 WM2014 Conference, March 2-6, 2014, Phoenix, Arizona, USA
decisions based on building occupancy type (e.g., apply a certain type of decontamination technology to all single family houses). INTRODUCTION Radiological releases, whether intentional or unintentional, remain an ever-evolving threat [1]. Historically, releases of even small amounts of radioactive material have demonstrated detrimental effects, often dispersing over a wide area by a combination of natural and human-facilitated mechanisms in a relatively short period of time [2]. If such an event were to transpire, a massive response involving local, state, and federal resources may be necessary. Once response and investigative efforts have subsided, the arduous task of remediating the contaminated area would ensue [3]. Historically, planning efforts have focused primarily on immediate response or evacuation, often ignoring the large quantities of waste that would likely result from any decontamination efforts. For emergency planners and federal responders to scope out the waste and debris management issues resulting from a radiological response and recovery effort, it is critical to understand not only the quantity, characteristics, and level of residual contamination of the waste and/or debris but also the implications of response and cleanup approaches regarding waste generation. The formulation of waste estimates via traditional means is often time consuming and relies heavily on empirical data. By developing a standardized method for assessing site-specific conditions quickly (i.e., infrastructure, surface type, radionuclide activity) as a function of decontamination strategies, decision makers may gain a better understanding of scope, impact, and implications of radiological incidents. The EPA’s Waste Estimation Support Tool (WEST) is a novel application of the Federal Emergency Management Agency (FEMA) Hazus-MH software [4] that enables users to estimate the characteristics, amount, and residual radioactivity of waste generated from remediation and cleanup activities after a wide-area radiological incident, including radiological dispersal devices, improvised nuclear devices, and nuclear power plant accidents [5]. The WEST is novel because it uses the Hazus-MH software, which is normally used for natural disaster risk management (e.g., floods, hurricanes, earthquakes) and adapts it for use for radiological incident risk management. The WEST highlights how waste plays an important role in a remediation strategy. In spite of the primary focus on waste, the WEST is not limited to recovery operations. In fact, the WEST could be used successfully as a planning tool for resource projections, waste management strategies, and policymaking. The EPA continues to support further development of the WEST. Recent efforts were undertaken to rework a large portion of the WEST‘s program code, focusing particularly on how waste estimates are calculated, allowing for a more scalable solution that will enable future enhancements. In parallel with these efforts, additional features have been added to the WEST such as a new graphical user interface, multistate support, and Esri’s ArcGIS 10.x support. One of the features recently added to the WEST is the ability to assign decontamination and demolition to individual building occupancy classes (e.g.,
2
2014 WM2014 Conference, March 2-6, 2014, Phoenix, Arizona, USA
schools, residences). By utilizing the FEMA Hazus-MH general building stock (GBS) inventories, end-users can group up to 28 occupancy types (e.g., residences, businesses, schools, etc.) into ten categories. A specific decontamination strategy (i.e., distribution of decontamination technology or demolition) can then be applied to each category. This functionality will facilitate planning decisions based on the type of structure. METHODS The WEST is composed of an array of stand-alone applications and ArcGIS scripts [6]. These processes are integrated by means of a graphical user interface (GUI). The interface is used to create, edit, or delete user-defined scenarios. Upon creating a scenario, a wizard, consisting of a sequence of dialog boxes, is used to walk the user through the processes described below. Geospatial Analysis The WEST uses plumes (i.e., polygons) to define geographical areas representing various levels of contamination. These files are typically generated by the National Atmospheric Release Advisory Committee (NARAC); however, plume files can be created in dispersion modeling programs or even drawn manually in GIS applications. The WEST relies heavily on Esri’s ArcGIS to process these complex geometries, and ArcGIS often requires a specialist to operate. To mitigate this constraint, GIS scripts were developed to calculate the area of the plume automatically with minimal user input (mainly limited to file path information) and intersect its boundaries with census tracts that are later used to query infrastructure data from the FEMA Hazus-MH database [4]. When assessing contaminated areas spatially, there are two regions of concern: 1) the affected buildings; and 2) the surfaces between the affected buildings. The WEST characterizes the spaces between the buildings by analyzing overhead satellite imagery. In parallel with this process, the WEST accesses the Hazus-MH databases to identify and quantify properties (e.g., materials of construction, square footage) of affected buildings according to specific occupancy types, aggregated at the census tract level. The resulting data are saved in a series of files that represent the geospatial characteristics of the incident, which are then used by the Waste Spreadsheet to generate waste estimates. Waste Spreadsheet The WEST uses a Visual Basic for Applications (VBA)-based Microsoft Excel® spreadsheet that provides an interface for users to specify various required inputs, modify default parameters, and subsequently view the results. Upon opening the spreadsheet, the user is given the option of opening an existing scenario or creating a new one. When creating a new scenario, the user must establish three sets of parameters: 1) area of contamination, 2) radioactivity and elapsed time, and 3) decontamination strategies/technologies:
3
2014 WM2014 Conference, March 2-6, 2014, Phoenix, Arizona, USA
• Geospatial Data: this input represents the data generated by the geospatial analysis. The geospatial data contains information on plume boundaries, infrastructure, and outdoor surfaces detected. This input cannot be modified from within the spreadsheet (i.e., the information from the geospatial analysis is automatically transferred to the spreadsheet and thereafter cannot be modified for a given scenario).
• Time and Activity: users can define the radionuclide(s) deposited at various
locations (based on three deposition zone boundaries) from the incident epicenter at a given elapsed time since initial deposition. This information is typically given to a user from an external source (e.g., NARAC).
• Decontamination Strategy: users can specify the type of decontamination
technology to be used on various surfaces in each deposition zone or can choose to model the demolition of a fraction of user-specific occupancy types in any given zone (e.g., 30% of residences in Zone 1 could be designated for demolition). The decontamination technologies are derived from published operational data acquired by EPA through testing radioactive materials in a laboratory environment [7].
These three types of data can be used independently of each other. For example, a given Decontamination Strategy could be applied to any number of Geospatial Data sets. Once the demolition and/or decontamination parameters have been specified, the WEST then generates a scenario containing the amount and activity of contaminated waste that would be generated based on the parameters defined above. The waste estimates include building materials and ground surface materials, as well as the wastewater that is generated during decontamination activities. Optionally, results from the WEST can be subjected to sensitivity analysis using Microsoft Excel® add-ons such as Crystal Ball® to identify impacts of decisions on such output variables as amount/activity of waste, type of waste, or remediation costs. Time to Produce Results Significant advancements have been made in reducing the amount of time required to generate waste estimates, particularly in the process of generating the Geospatial Data. These advancements are attributed to the significant automation of data processing steps and the simplicity of the user interface. Using WEST Version 2.0, upon which this paper was based, approximately ten minutes from beginning to end are required to generate waste estimates, a considerable improvement in comparison to the earlier run times of 6+ hours. By not being time-constrained for replacing the Geospatial Data component of the waste estimation, a much more diverse set of scenarios can be analyzed.
4
2014 WM2014 Conference, March 2-6, 2014, Phoenix, Arizona, USA
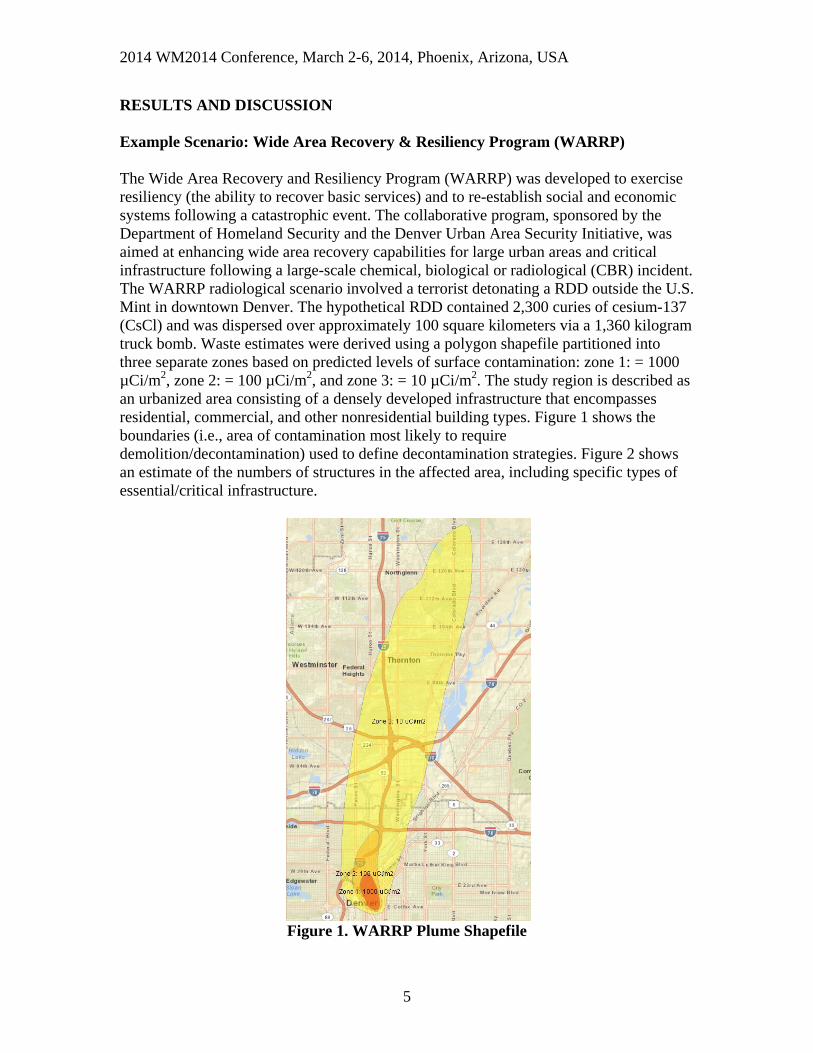
RESULTS AND DISCUSSION Example Scenario: Wide Area Recovery & Resiliency Program (WARRP) The Wide Area Recovery and Resiliency Program (WARRP) was developed to exercise resiliency (the ability to recover basic services) and to re-establish social and economic systems following a catastrophic event. The collaborative program, sponsored by the Department of Homeland Security and the Denver Urban Area Security Initiative, was aimed at enhancing wide area recovery capabilities for large urban areas and critical infrastructure following a large-scale chemical, biological or radiological (CBR) incident. The WARRP radiological scenario involved a terrorist detonating a RDD outside the U.S. Mint in downtown Denver. The hypothetical RDD contained 2,300 curies of cesium-137 (CsCl) and was dispersed over approximately 100 square kilometers via a 1,360 kilogram truck bomb. Waste estimates were derived using a polygon shapefile partitioned into three separate zones based on predicted levels of surface contamination: zone 1: = 1000 µCi/m2, zone 2: = 100 µCi/m2, and zone 3: = 10 µCi/m2. The study region is described as an urbanized area consisting of a densely developed infrastructure that encompasses residential, commercial, and other nonresidential building types. Figure 1 shows the boundaries (i.e., area of contamination most likely to require demolition/decontamination) used to define decontamination strategies. Figure 2 shows an estimate of the numbers of structures in the affected area, including specific types of essential/critical infrastructure.
Figure 1. WARRP Plume Shapefile
5
2014 WM2014 Conference, March 2-6, 2014, Phoenix, Arizona, USA
Figure 2. Estimated Affected Infrastructure
Decontamination Strategy Remediation by means of decontamination or demolition after a radiological incident is an extremely complex undertaking that often involves an array of evolving considerations and conditions (e.g., location and policy restrictions) that may affect the overall amount of waste and time to produce the desired outcome. The WEST accounts for these site-specific parameters by allowing the user to replace geospatial data (i.e., plume boundaries, infrastructure, and surface media), elapsed time, contamination data, and decontamination strategy when creating scenarios, if needed. This capability enables ever-changing parameters such as plume boundaries to be updated while maintaining decontamination plans or vice versa. Decontamination technologies vary greatly in application, efficacy, and amount (and activity) of waste produced. Concurrent with these considerations, the decision-making process may also consider other issues such as human health risks, availability of resources, and time required for application of a given technology. Based on these factors, users may apply either user-defined or pre-defined decontamination technologies including excavation and removal, strippable coatings, washing and cleaning, and various abrasive techniques such as scabbling. The selection of decontamination technologies will depend on the surface to which they are applied and the desired end state. The WEST allows two selections in which
6
2014 WM2014 Conference, March 2-6, 2014, Phoenix, Arizona, USA
decontamination technologies or demolition can be applied: 1) For infrastructure, the user can define decontamination or demolition percentages (i.e., percentage of buildings within a certain zone or of a certain type that are decontaminated or demolished) for all building types or specific to 28 occupancy types (e.g., hospitals or schools) and 2) decontamination percentages for outdoor and indoor surfaces (i.e., asphalt, concrete, soil, roofs, exterior walls, interior walls and floors). Users can define a “no decontamination option” or “demolish infrastructure” to simulate either blast damage or deliberate demolition operations. Based on the assumptions above, the WEST generates estimates that include:
• Contaminated material (e.g., the layer of radioactive material that must be removed from structures, roads, soil, etc);
• Residues from the decontamination technologies (e.g., removed strippable coatings, residues from abrasive surface removal); and
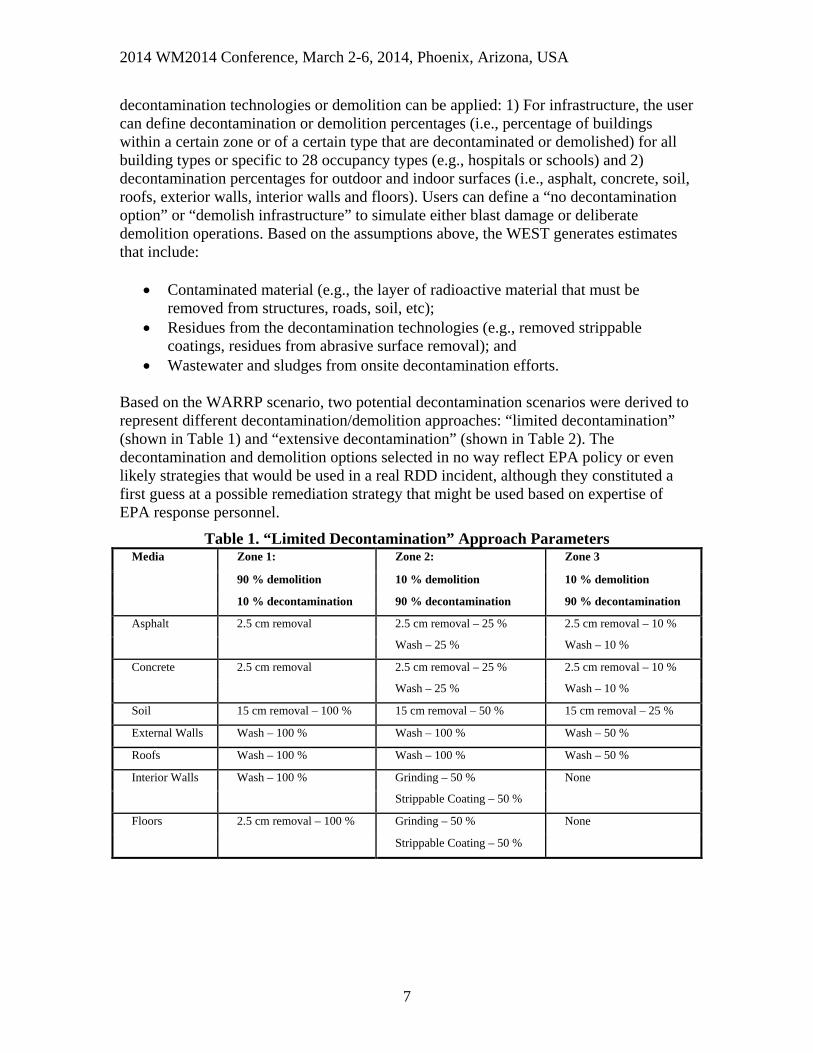
• Wastewater and sludges from onsite decontamination efforts. Based on the WARRP scenario, two potential decontamination scenarios were derived to represent different decontamination/demolition approaches: “limited decontamination” (shown in Table 1) and “extensive decontamination” (shown in Table 2). The decontamination and demolition options selected in no way reflect EPA policy or even likely strategies that would be used in a real RDD incident, although they constituted a first guess at a possible remediation strategy that might be used based on expertise of EPA response personnel.
Table 1. “Limited Decontamination” Approach Parameters Media Zone 1: Zone 2: Zone 3
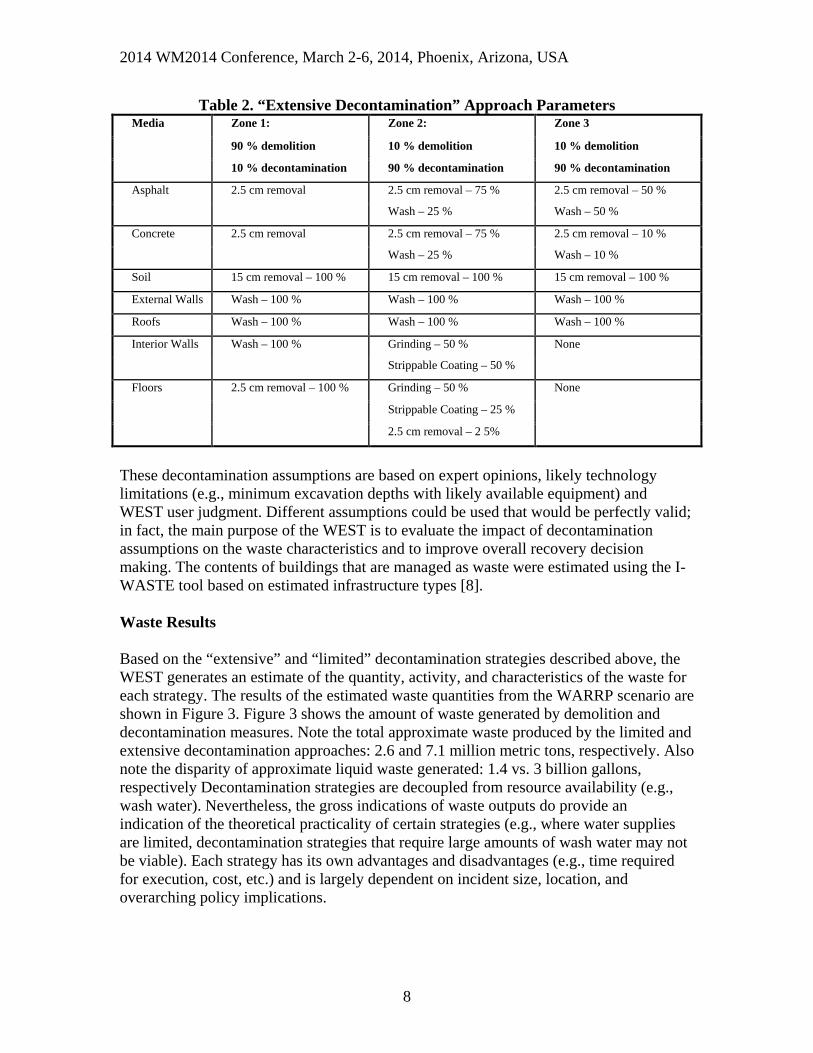
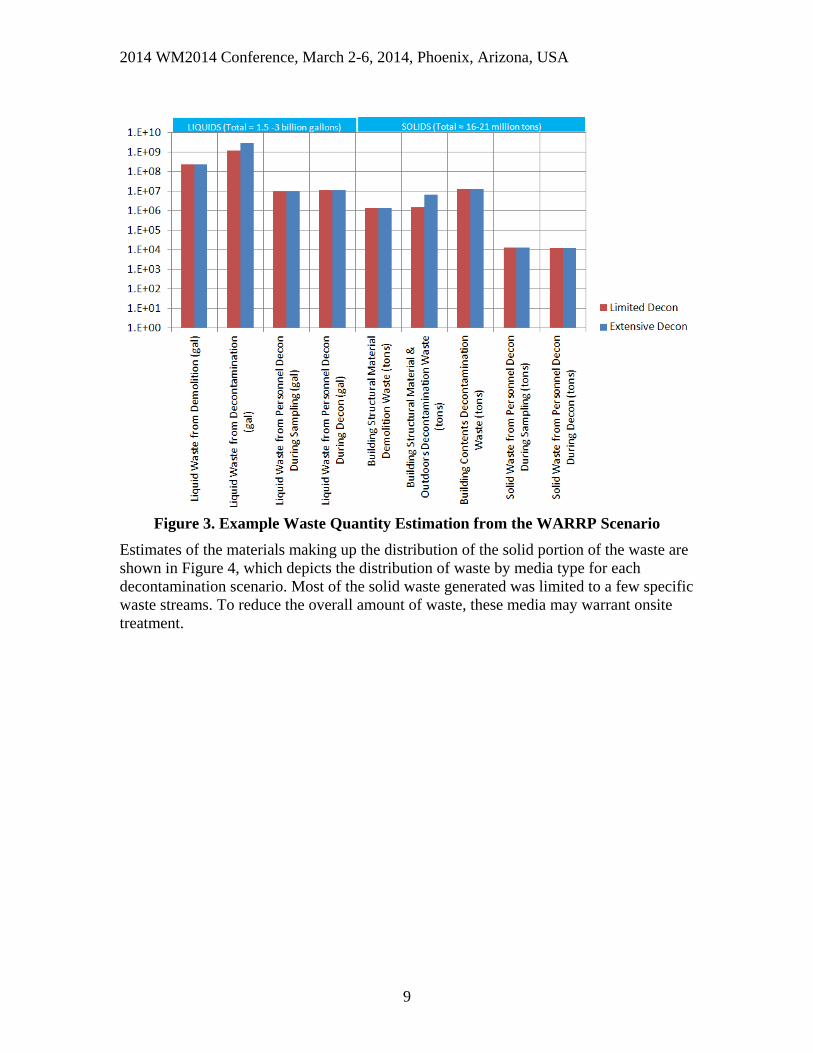
These decontamination assumptions are based on expert opinions, likely technology limitations (e.g., minimum excavation depths with likely available equipment) and WEST user judgment. Different assumptions could be used that would be perfectly valid; in fact, the main purpose of the WEST is to evaluate the impact of decontamination assumptions on the waste characteristics and to improve overall recovery decision making. The contents of buildings that are managed as waste were estimated using the I-WASTE tool based on estimated infrastructure types [8]. Waste Results Based on the “extensive” and “limited” decontamination strategies described above, the WEST generates an estimate of the quantity, activity, and characteristics of the waste for each strategy. The results of the estimated waste quantities from the WARRP scenario are shown in Figure 3. Figure 3 shows the amount of waste generated by demolition and decontamination measures. Note the total approximate waste produced by the limited and extensive decontamination approaches: 2.6 and 7.1 million metric tons, respectively. Also note the disparity of approximate liquid waste generated: 1.4 vs. 3 billion gallons, respectively Decontamination strategies are decoupled from resource availability (e.g., wash water). Nevertheless, the gross indications of waste outputs do provide an indication of the theoretical practicality of certain strategies (e.g., where water supplies are limited, decontamination strategies that require large amounts of wash water may not be viable). Each strategy has its own advantages and disadvantages (e.g., time required for execution, cost, etc.) and is largely dependent on incident size, location, and overarching policy implications.
8
2014 WM2014 Conference, March 2-6, 2014, Phoenix, Arizona, USA
Figure 3. Example Waste Quantity Estimation from the WARRP Scenario
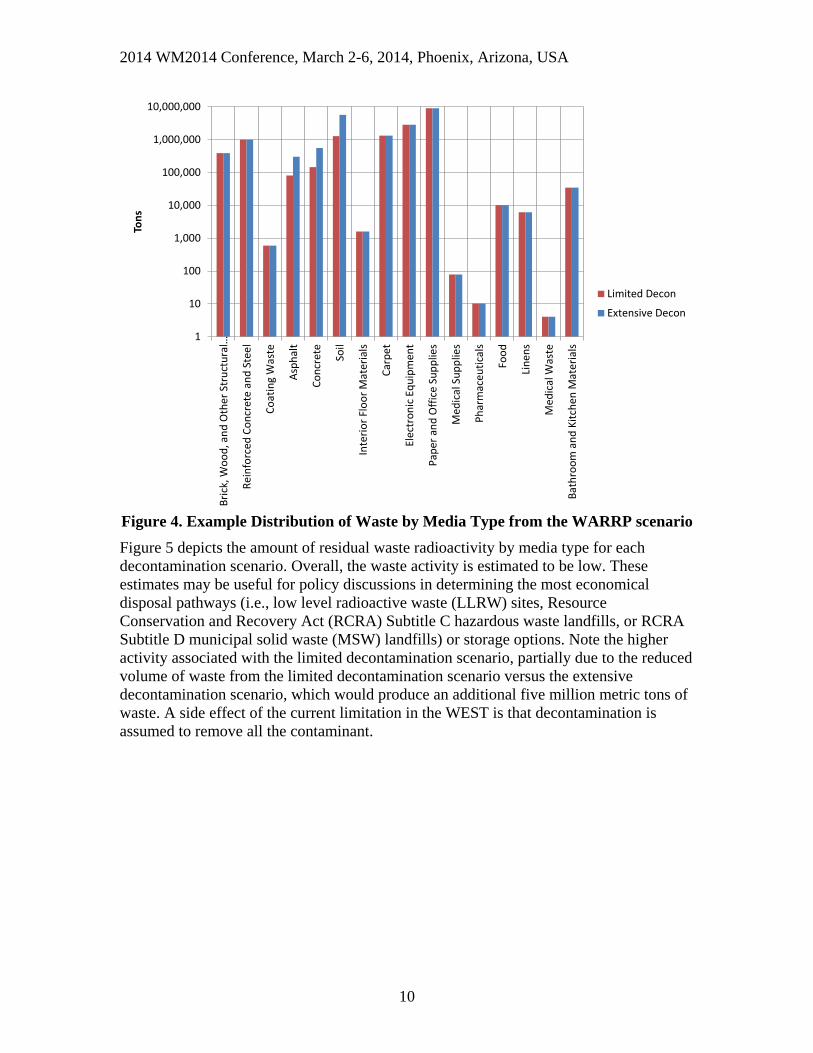
Estimates of the materials making up the distribution of the solid portion of the waste are shown in Figure 4, which depicts the distribution of waste by media type for each decontamination scenario. Most of the solid waste generated was limited to a few specific waste streams. To reduce the overall amount of waste, these media may warrant onsite treatment.
9
2014 WM2014 Conference, March 2-6, 2014, Phoenix, Arizona, USA
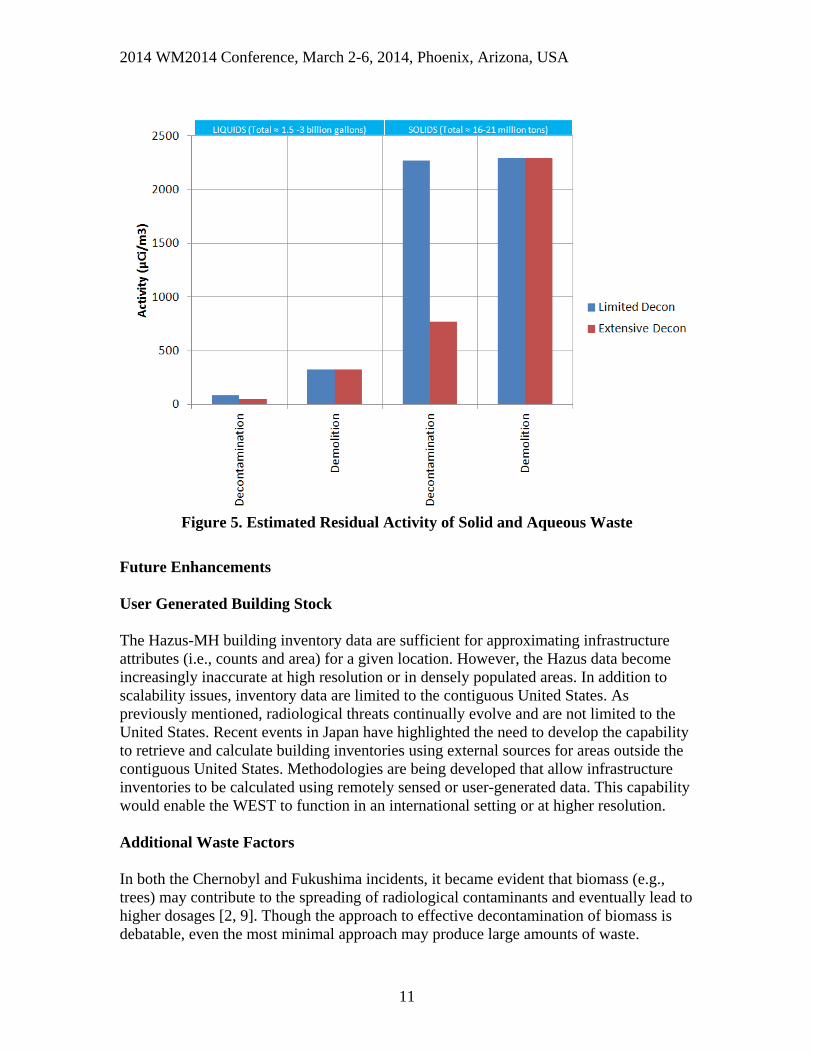
Figure 4. Example Distribution of Waste by Media Type from the WARRP scenario Figure 5 depicts the amount of residual waste radioactivity by media type for each decontamination scenario. Overall, the waste activity is estimated to be low. These estimates may be useful for policy discussions in determining the most economical disposal pathways (i.e., low level radioactive waste (LLRW) sites, Resource Conservation and Recovery Act (RCRA) Subtitle C hazardous waste landfills, or RCRA Subtitle D municipal solid waste (MSW) landfills) or storage options. Note the higher activity associated with the limited decontamination scenario, partially due to the reduced volume of waste from the limited decontamination scenario versus the extensive decontamination scenario, which would produce an additional five million metric tons of waste. A side effect of the current limitation in the WEST is that decontamination is assumed to remove all the contaminant.
1
10
100
1,000
10,000
100,000
1,000,000
10,000,000
Bric
k, W
ood,
and
Oth
er S
truc
tura
l…
Rein
forc
ed C
oncr
ete
and
Stee
l
Coat
ing
Was
te
Asph
alt
Conc
rete Soil
Inte
rior F
loor
Mat
eria
ls
Carp
et
Elec
tron
ic E
quip
men
t
Pape
r and
Offi
ce S
uppl
ies
Med
ical
Sup
plie
s
Phar
mac
eutic
als
Food
Line
ns
Med
ical
Was
te
Bath
room
and
Kitc
hen
Mat
eria
ls
Tons
Limited Decon
Extensive Decon
10
2014 WM2014 Conference, March 2-6, 2014, Phoenix, Arizona, USA
Figure 5. Estimated Residual Activity of Solid and Aqueous Waste
Future Enhancements User Generated Building Stock The Hazus-MH building inventory data are sufficient for approximating infrastructure attributes (i.e., counts and area) for a given location. However, the Hazus data become increasingly inaccurate at high resolution or in densely populated areas. In addition to scalability issues, inventory data are limited to the contiguous United States. As previously mentioned, radiological threats continually evolve and are not limited to the United States. Recent events in Japan have highlighted the need to develop the capability to retrieve and calculate building inventories using external sources for areas outside the contiguous United States. Methodologies are being developed that allow infrastructure inventories to be calculated using remotely sensed or user-generated data. This capability would enable the WEST to function in an international setting or at higher resolution. Additional Waste Factors In both the Chernobyl and Fukushima incidents, it became evident that biomass (e.g., trees) may contribute to the spreading of radiological contaminants and eventually lead to higher dosages [2, 9]. Though the approach to effective decontamination of biomass is debatable, even the most minimal approach may produce large amounts of waste.
11
2014 WM2014 Conference, March 2-6, 2014, Phoenix, Arizona, USA
Technologies are being explored to remotely sense and estimate the amount of biomass present in a given area. This capability would allow for decontamination strategies addressing biomass and eventually lead to increasingly accurate waste estimates. Other waste factors of interest include: vehicles, indoor waste, and waste generated by specific decontamination technologies. Incident Waste (I-WASTE) Decision Support Tool The Incident Waste (I-WASTE) decision support tool provides information on the characteristics and volumes of waste materials and potential secondary hazardous contaminants generated during an incident [8]. Directly coupling the WEST with I-WASTE would easily provide approximated indoor waste estimates for each specific occupancy type, leading to higher resolution waste estimates and ultimately a more informed decontamination strategy. Furthermore, location and contact information for potential treatment/disposal facilities, which is incorporated into I-WASTE, would facilitate time and cost integration of waste estimates. Cost and Logistical Support Estimating cost and logistics of the decontamination effort as well as the subsequent transport and ultimate disposal of waste has long been considered as an important focal point of future development. Though the detailed classification of waste is essential, some of the most consequential decisions to be made regarding wide area events are the cost and time of remediation. Answers to these questions are key to the foundation of waste management strategies. As a result, researchers are collaborating with local, federal, and international partners to aggregate cost and time attributes associated with orthodox decontamination technologies. These data, in addition to contributing factors such as transportation, equipment availability, and labor pool factors, a comprehensive cost and time estimate could be developed for remediating wide area events. Plotting Waste Results As technology evolves, so do the methods for displaying and communicating information. The recent emergence of web-based mapping platforms has heralded an intuitive way for projecting geospatially-enabled data. By uploading waste estimates to such a platform, maps could then be generated displaying information such as waste hotspots, critical infrastructure, transportation, and eventually transit-time estimates for waste disposal. Ultimately this enhancement will provide a method for distributing and displaying data using a web browser without the need for special software. CONCLUSION The WEST is a novel approach for estimating the quantity, activity, and characteristics of waste generated by a radiological incident. The WEST highlights the benefits of considering waste when selecting decontamination options and consequently provides means of identifying resource constraints, refining decontamination strategies based on
12
2014 WM2014 Conference, March 2-6, 2014, Phoenix, Arizona, USA
infrastructure, time, and radionuclide activity, and ultimately identifies a starting point for policy discussions. Recent updates add building occupancy-specific decontamination/demolition options, ArcGIS 10.x support, significant automation of data processing steps, and multi-state scenario support. Upcoming enhancements seek to improve functionality, adding powerful new features. DISCLAIMER The U.S. Environmental Protection Agency through its Office of Research and Development managed the research described here. It has been subjected to the Agency’s review and has been approved for publication. Note that approval does not signify that the contents necessarily reflect the views of the Agency. REFERENCES 1. Government Accountability Office, Combating Nuclear Terrorism: Preliminary
Observations on Preparedness to Recover from Possible Attacks Using Radiological or Nuclear Materials, 2009: Washington, DC.
2. Andersson, K.G., ed.,, Airborne Radioactive Contamination in Inhabited Areas. Vol. 15. 2009: Elsevier, Amsterdam, The Netherlands.
3. National Security Staff Interagency Policy Coordination Subcommittee, Planning Guidance for Response to a Nuclear Detonation, 2nd Edition, 2010.
4. FEMA. HAZUS-MH Version 1.4. 2010 [accessed 2010 October 14]; Available from: http://www.fema.gov/plan/prevent/hazus/.
5. U.S. EPA, Radiological Dispersal Device (RDD) Waste Estimation Support Tool Version 1.2, EPA/600/R-12/594, 2012.
6. Lemieux, P., J. Wood, D. Schultheisz, T. Peake, M. Ierardi, C. Hayes, and M. Rodgers. A First-Order Estimate of Debris and Waste Resulting from a Hypothetical Radiological Dispersal Device Incident in Proceedings of the WM 2010 Conference. 2010. Phoenix, AZ.
7. Drake, J., R. James, and R. Demmer. Performance Evaluation of Decontamination Technologies for Dirty Bomb Cleanup. in Proceedings of the WM 2010 Conference. 2010. Phoenix, AZ.
8. U.S. EPA. I-WASTE Decision Support Tool. 2013 [accessed November 5, 2012]; Available from: http://www2.ergweb.com/bdrtool/login.asp.
9. Bird, W. and J. Little, A Tale of Two Forests: Addressing Postnuclear Radiation at Chernobyl and Fukushima. Environ Health Perspectives, 2013 121(3): p. 78-85.