INTEGRATING GREEN RATING SYSTEMS: A CASE STUDY FOR FERRY TERMINAL STORMWATER PROJECTS By MICHAEL MARSHALL THOMPSON A thesis submitted in partial fulfillment of the requirements for the degree of MASTER OF SCIENCE IN CIVIL ENGINEERING WASHINGTON STATE UNIVERSITY Department of Civil and Environmental Engineering DECEMBER 2011
Transcript
INTEGRATING GREEN RATING SYSTEMS: A CASE STUDY FOR
FERRY TERMINAL STORMWATER PROJECTS
By
MICHAEL MARSHALL THOMPSON
A thesis submitted in partial fulfillment of
the requirements for the degree of
MASTER OF SCIENCE IN CIVIL ENGINEERING
WASHINGTON STATE UNIVERSITY
Department of Civil and Environmental Engineering
DECEMBER 2011
ii
To the Faculty of Washington State University:
The members of the Committee appointed to examine the
thesis of MICHAEL MARSHALL THOMPSON find it satisfactory and recommend that
it be accepted.
____________________________
Liv Haselbach, Ph.D., Chair
____________________________
Mike Wolcott, Ph.D.
____________________________
Cara Poor, Ph.D.
iii
ACKNOWLEDGMENTS
I would like to acknowledge myself for being incredibly awesome.
iv
INTEGRATING GREEN RATING SYSTEMS: A CASE STUDY FOR
FERRY TERMINAL STORMWATER PROJECTS
Abstract
By Michael Marshall Thompson M.S. Washington State University
December 2011
Chair: Liv Haselbach
Washington State Ferries (WSF) has unique challenges when it comes to dealing with
sustainability, particularly with stormwater pollution. WSF terminals are intermodal facilities, include
over water structures (trestles), and are close to the Puget Sound. These factors present difficulties
when (1) using sustainability rating tools, and (2) when mitigating stormwater runoff. Most developing
sustainability tools are use specific, and none specifically apply to ferry terminals. Stormwater pollution
from the terminals might affect environmentally sensitive species in Puget Sound. Conventional low
impact development practices (LID) for stormwater mitigation tend to promote dispersed practices,
which is difficult at terminals due to limited land availability and proximity to the water.
When considering sustainable construction, there are a multitude of different guides and rating
systems available, several of which may in part be related to WSF facilities from the marine side, at the
intermodal interface, for buildings and other infrastructure, and through upland transportation modes.
The five following rating systems were chosen as being representative for WSF: GreenLITES, LEED,
Sustainable Sites Initiative, the Port Authority of NY/NJ Sustainable Infrastructure Guidelines, and the
Marine Vessel Environmental Performance Assessment (MVeP). Integration of the five rating systems
v
and a proposed WSU Ferry Sustainability Guide with the Safety Management System (SMS) of the
agency was developed into a Green Rating Integration Platform (GRIP) through reorganization of the
systems and then incorporation into a spreadsheet presentation. Future work could expand the GRIP for
other intermodal applications, and to include regulations and standards, further helping WSF and other
agencies to make sustainable decisions.
Stormwater focused aspects of sustainability through LID were then investigated through two
innovative strategies proposed for the Vashon Island Terminal; (1) a reverse slope on the trestle with
capture and treatment landside, and (2) the use of a pervious concrete trestle overlay in conjunction
with high efficiency sweeping. Different design options were analyzed for each of these strategies, and a
decision support tool created relating design to water quality implications and other factors. Both
strategies were further analyzed using the GRIP to see what credits they would be eligible for in each of
Table 4.4: Summary of vault size for various design options ..................................................................... 56
Table 4.5: Percentage of pollutants on the trestle treated by each option ............................................... 59
Table 4.6: Hydrologic Soil Series for Selected Soils in Washington State (Ecology 2005) .......................... 61
Table 4.7: Runoff Curve Numbers for Selected Agricultural, Suburban, and Urban Areas (Ecology 2005) 62
Table 4.8: Required vault size for each design storm for upland area ....................................................... 63
Table 5.1: Summary of the three pervious concrete options presented ................................................... 70
Table 6.1: Possible credits for reverse slope option ................................................................................... 76
Table 6.2: Possible credits for pervious concrete overlay option .............................................................. 76
Table 7.1: Reverse slope decision support tool .......................................................................................... 80
x
Table 7.2: Pervious concrete decision support tool ................................................................................... 81
xi
LIST OF FIGURES
Figure 1.1: Side view of Kristar system at the Bainbridge Island terminal ................................................. 15
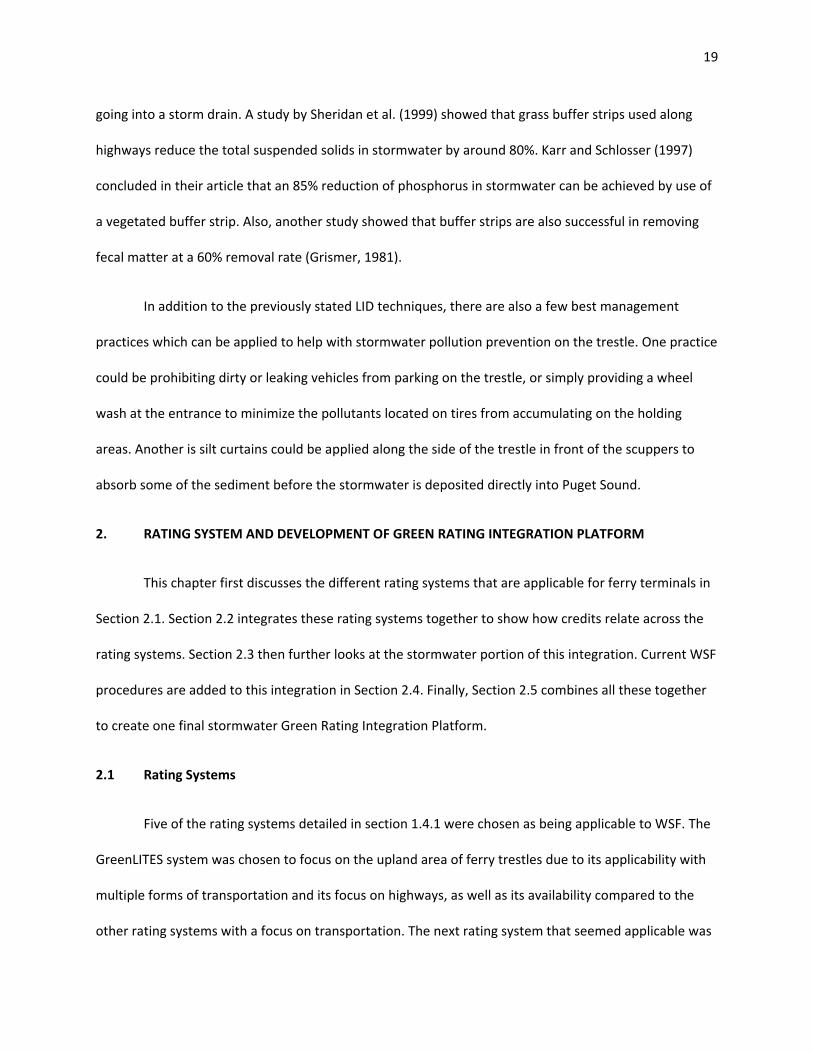
Figure 3.1: Looking east towards the Vashon Island terminal ................................................................... 34
Figure 3.2: Looking northwest towards the Vashon Island terminal ......................................................... 35
Figure 3.3: Western trestle partial replacement ........................................................................................ 37
Figure 4.1: Western Washington two‐year isopluvial (from: Ecology 2005) .............................................. 43
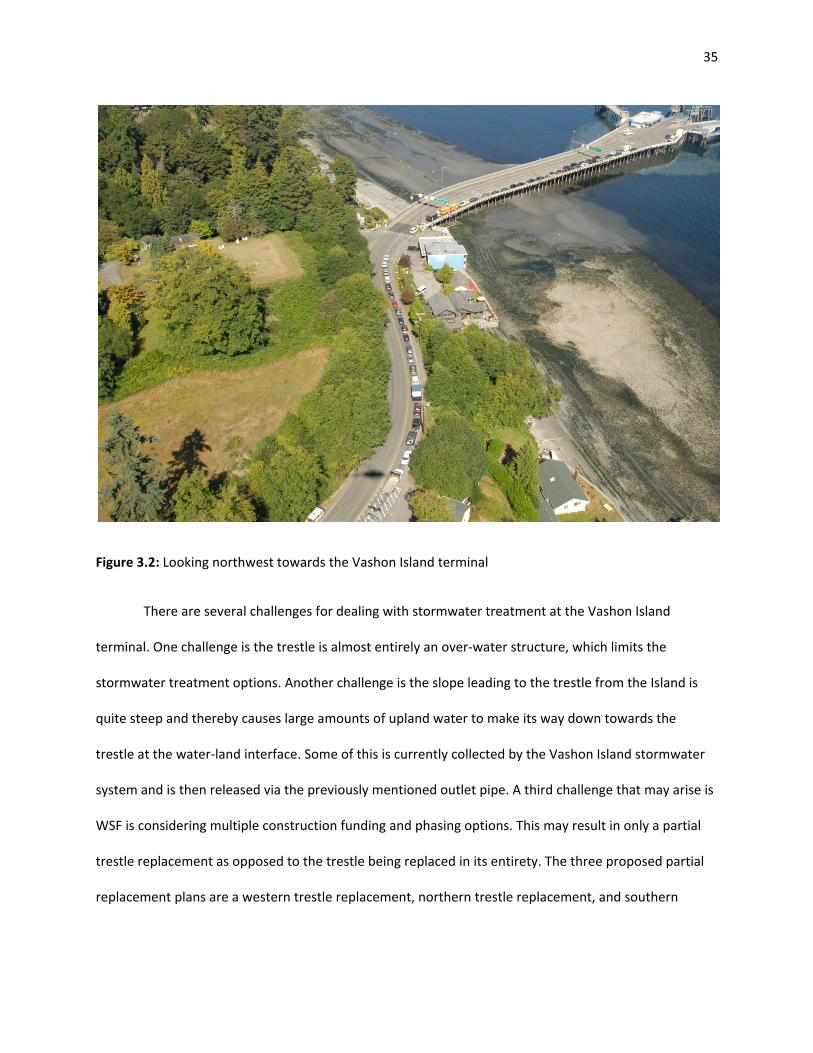
Figure 4.3: Reverse slope design for full replacement Vashon Island trestle ............................................ 47
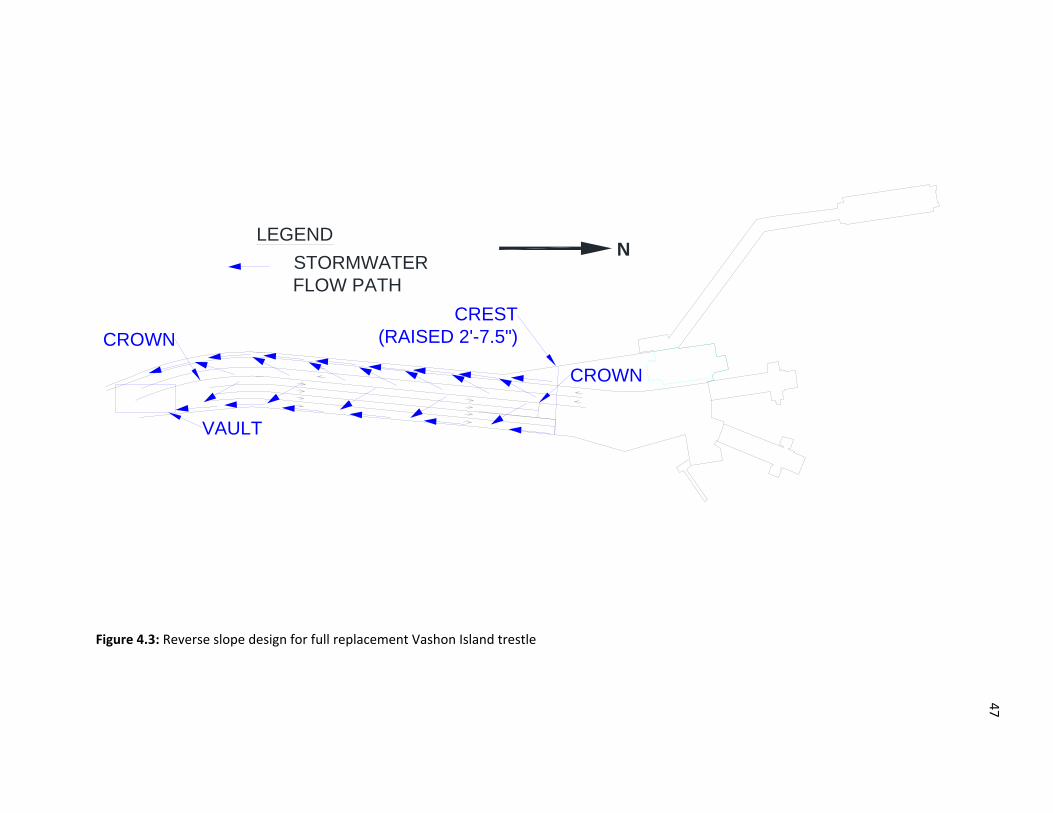
Figure 4.4: Reverse slope design for southern portion replacement of Vashon Island trestle .................. 50
Figure 4.5: The automobile passenger holding area on the Vashon Island terminal ................................. 53
Figure 4.6: Plan for partial replacement of the southern trestle area of the Vashon Island terminal with
the proposed extension .............................................................................................................................. 55
Figure 4.7: Topographic area (ArcGIS) ........................................................................................................ 60
Figure 5.1: Pervious concrete overlay over the entire trestle .................................................................... 67
Figure 5.2: Pervious concrete overlay for the holding lanes only .............................................................. 69
Figure 5.3: Pervious concrete overlay on three out of the four holding lanes .......................................... 71
xii
Dedication
This thesis is dedicated to myself because I’ve always wanted a thesis to be dedicated to me.
1
1. INTRODUCTION
1.1 Problem Statement
Washington State Ferries (WSF) is faced with the difficult challenge of treating the stormwater
which falls on the ferry trestles. Ferry terminals are generally comprised mostly of over‐water
structures, and are extremely close to the Puget Sound. These factors present difficulties when
attempting to treat stormwater runoff for pollutants. Some of the rain falls on the building roofs while
other rain falls on the paved areas of the trestle. The precipitation which lands on the trestles is usually
directed into Puget Sound via through drains on the deck. A few terminals are set up with special catch
basins which filter some pollutants out of the stormwater before releasing into Puget Sound. The rain
water which lands on the terminal buildings is caught by gutters and then deposited into the Puget
Sound by roof drains which do not go through any filter system. It is important that the stormwater is
treated as the Puget Sound contains many environmentally sensitive species that would be adversely
affects by the addition of pollutants into their environment.
Stormwater runoff is defined as water that flows over land and does not percolate into the
ground. Stormwater is generated by precipitation in the form of rain or snow. There are four different
mechanisms which can contribute to overland runoff. Runoff can occur if the precipitation rate is
greater than the speed which water can infiltrate into the ground, assuming that any available
depression storage has already been filled. This is especially likely in paved areas. Runoff can also occur
due to saturation excess when the soil is so saturated it cannot infiltrate any more stormwater. A third
cause of runoff is a high antecedent soil moisture level, forcing the soil to become more quickly
saturated than is typical. Finally, subsurface return flow can cause runoff by water running laterally
though the soil, saturating the soil and sometimes even becoming runoff, usually at a downhill location.
2
It is especially common for stormwater runoff to occur in urbanized areas with increased
impervious surfaces such as buildings and pavement where infiltration rates are close to zero. When
stormwater runoff occurs on impervious surfaces, it is most often routed through a curb and gutter
system and then deposited into a nearby water body. This runoff consists not only of stormwater, but
also contains debris, chemicals, sediments, and other pollutants picked up from the impervious surface.
These pollutants may degrade the quality of the water as it is discharged into the water body. As a
result, the Environmental Protection Agency (EPA) requires stormwater to be controlled and treated by
use of best management practices (BMPs) (EPA 2009).
BMPs include six minimum control measures which must be addressed. These include public
education, public participation, illicit discharge detection and elimination, construction site runoff
control, post‐construction runoff control, and pollution prevention/good housekeeping (EPA 2008). A
subset of BMPs used for post‐construction runoff control is the application of low impact development
(LID) techniques in stormwater control. LID uses features of the hydrologic cycle, such as infiltration,
evaporation, transpiration, ground storage, etc. This is done as close to the stormwater source as
possible and includes benefits such as watering the vegetation in the area and supporting groundwater
recharges. LID aims to manage stormwater for the purpose of keeping the local hydrologic cycle as close
to pre‐development conditions as possible (EPA 2011).
It is challenging for ferry terminals to apply many conventional LID practices because most LID
practices require the use of land while ferry terminals usually consist of mostly trestles, which are over‐
water structures. Due to the almost nonexistent distance between the stormwater source and body of
water into which it is deposited, the space is too limited for the use of most standard stormwater
filtering systems. As a result of this environment, it is necessary to examine different methods to reduce
pollution. This could include treatment, as well as prevention or entirely new LID techniques as well.
3
Common sources of stormwater pollutants at ferry terminals include leaks and sediments from
passenger vehicles on the paved areas, which are often required to wait for extended periods of time on
the trestle. Another common source of stormwater pollutants is from uncoated metals used in railings,
fencing, and building roofs. Uncoated metals are associated with high levels of zinc. Metals could be
coated and different roofing materials could be used to reduce pollution. Other possible sources of
pollutants include leaks from garbage facilities and hydraulic systems, animal fecal matter, sand and salt
used for deicing, and pest control agents.
In addition, WSF, which is a division of the Washington State Department of Transportation
(WSDOT), is challenged with addressing multiple environmental, social, and economic impacts relating
to its designs and operations with sustainability in mind. Due to this sustainability minded approach,
WSF is interested in incorporating green rating initiatives into the design and operations of ferry
terminals. Ferry terminals present a unique challenge because they are intermodal facilities
incorporating buildings, automobile, and marine vessels. Trestles can be built over land or water, and
are sometimes a combination of both.
In order to consider the use of LID at ferry terminals the concepts and goals of LID need to be
intermixed with ferry terminal design and operation practices. When considering sustainable
construction, there are a multitude of different guides and rating systems available. No rating system
specifically applies to the unique situation occurring at ferry terminals, but several can be related to
them in some form or fashion. While each of these rating systems may be helpful in some way, having to
examine each one individually for every situation could become overwhelming.
A common subject among green rating systems is stormwater. In addition, stormwater is also
associated with many environmental and social aspects of sustainability. It is useful to have a system
created which will allow one to examine guidelines over multiple rating systems with greater ease than
4
reading through each one separately. A format which could be used for this purpose was created and
will be presented later in this thesis with specific application to a more comprehensive LID stormwater
approach.
1.2 Proposed Steps and Objectives
Objective 1:
First, available rating systems should be examined to see what is available and what is applicable
to ferries. Currently there are a multitude of different rating systems which outline different low impact
development practices. In order to fulfill the proposed steps, a literature search will be done of rating
systems.
Objective 2:
These rating systems will be integrated in order to make them applicable for ferries. An outline
on a matrix for integrating LID practice decisions into other green design and operational goals of ferry
terminals will be developed.
Objective 3:
Next, for the purpose of this thesis, each rating system should be examined for the portions
which focus on stormwater pollution treatment and prevention. The stormwater aspects of the
integrated green rating systems will be detailed. Detail work will also be done on WSF’s Safety
Management System (SMS) and Stormwater Pollution Prevention Plan (SWPPP). This will make it
possible to integrate the green rating systems with the SMS and SWPPP provided by WSF.
5
Objective 4:
In addition, due to the unique combination of characteristics and challenges at WSF terminals,
novel LID prevention and treatment trains might need to be considered. As a result of the unique
circumstances surrounding stormwater and ferry terminals, it is important that creative approaches be
taken to the management of stormwater. This thesis is an investigation into two different strategies
which could be implemented at the Vashon Island Terminal located in Vashon, Washington. The two
strategies to be examined are reverse slope on the trestle with capture and treatment land side (reverse
slope‐land treatment) and the use of a treatment train on the trestle including pervious concrete and
high efficiency sweeping (pervious concrete/sweeping). Reverse slope is a technique suggested by WSF.
Objective 5:
Finally, these systems should be overlaid to relate to the stormwater practices that WSF already
has in place. Once the previously mentioned two approaches have been investigated, they can be
compared to various green rating systems to see what credits they may be eligible for.
1.3 Format of Thesis
The remainder of Chapter 1 in this thesis consists of a literature review. This literature review
will include several different rating systems which were analyzed to see if they are applicable to ferries,
fulfilling Objective 1. The literature review also includes a summary of the WSF SMS and SWPPP as well
as containing information about similar sites and current LID practices to lay the groundwork for
Objective 3.
Chapter 2 covers the selection of rating systems which best apply to ferry terminals and
integrates them together in fulfillment of Objective 2. The chapter goes on to look at the stormwater
6
guidelines of each of these rating systems and relates them to current WSF SMS procedures, creating a
Green Rating Integration Platform as discussed in Objective 3.
The third chapter gives background information on the example site used in Objective 4, the
Vashon Island terminal. The two strategies discussed in Objective 4 are analyzed in Chapters 4 and 5.
Chapter 4 looks at the reverse slope design and begins by giving some background information
on reverse slopes. The hydrological calculations are than presented to show how rainfall and runoff was
determined. This is followed by calculations of runoff from the trestle. The next section discusses water
quality calculations. Chapter 4 finishes up looking at landside calculations if the strategy was extended
to include treating water for both the trestle and the land.
The pervious concrete method is examined in Chapter 5. First, some background information is
given on pervious concrete’s pollutant removal potential. Then, three different options for using a
pervious concrete overlay on the trestle are discussed.
Objective 5 is achieved in Chapter 6 when the two strategies discussed in Chapters 4 and 5 are
analyzed by several green rating systems to see what credits they are eligible for. A section is devoted to
each the reverse slope method and the pervious concrete method.
The final chapter, Chapter 7, wraps up the thesis with a brief summary and recommendations.
1.4 Literature Review
The literature review is separated into four sections covering different topics. Section 1.4.1
discusses several different sustainability rating systems which have been examined. Section 1.4.2
describes procedures already in place at WSF, specifically the SMS and the SWPPP. Section 1.4.3 looks at
7
two similar sites; the SR 520 floating bridge and the Bainbridge Island terminal. Finally, Section 1.4.1
looks at LID practices which have been successfully used to reduce pollutants found in stormwater.
1.4.1 Sustainability Rating Systems
One of the most well known ratings systems is Leadership in Energy and Environmental Design
(LEED) for new construction and major renovation, which has been developed by the US Green Building
Council (USGBC 2009). This rating system applies mostly towards buildings on the land, making it useful
for the land side of a ferry terminal. LEED for retail is a subset of the LEED new construction system.
LEED retail is more consumer based and addresses parking issues as well as other additional criteria that
might fit well with WSF.
Another rating system, which was developed by the Green Building Initiative, is Green Globes
(GBI 2011). Green Globes easily applies to different project sizes and both new and existing buildings. It
has been specifically used for several public buildings. For ports, the most applicable sections are those
that address building design and maintenance and operations. However, the similarly applicable LEED
system is more commonly used in the United States.
Another possible rating system source is from the American Society of Heating, Refrigerating
and Air‐Conditioning Engineers (ASHRAE) set of standards. As the name suggests, ASHRAE is a good
source of energy system standards such as testing methods and performance criteria (ASHRAE 2011).
This could be applied to specific energy topics that WSF may need to address. ASHRAE standards are
also included in LEED.
The Sustainable Sites Initiative (SITES) is an interdisciplinary effort that provides guidelines for
sustainability in the areas of land design, construction, and management (SSI 2009). It focuses on how a
project can be sustainably beneficial when it is implemented into a community by enhancing social and
8
community aspects. When transferring the ideas presented in SITES to a WSF terminal, it is mainly
applicable to the land side. The SITES rating system seems to focus greatly on stormwater management
which is why it could be valuable for this study.
New York State Department of Transportation has a rating system known as GreenLITES,
designed to address multiple forms of transportation. GreenLITES lists different techniques used to
measure sustainability performance in addition to promoting stormwater best management practices
(BMPs), and possible areas of improvement in the planning, design, and construction phases. The main
areas of focus are sustainable sites, water quality, materials and resources, and energy and atmosphere
(NYDOT 2011). The tool is more readily applied to highways and may be difficult to apply to WSF.
GreenLITES use at WSF may be limited to the transportation network upland of the ferry terminal.
The Federal Highway Administration of the US Department of Transportation has its own
sustainability tool known as the Infrastructure Voluntary Evaluation Sustainability Tool (IN‐VEST). As of
this writing it is in the pilot test phase with version 1.0 scheduled to be released in 2012. This tool is
expected to be available nationally and currently has three main sections focusing on systems and
project planning, project development, and operations and maintenance (FHWA 2011). This tool is
mainly focused on state and highway systems but may apply to the interface at the terminal including
the upland roadway leading to the ferry terminal.
The Institute for Sustainable Infrastructure recently released version 1.0 of EnvISIon for
feedback. EnvISIon is expected to be approved and available for use in early 2012. According to their
announcement, EnvISIon evaluates the sustainability of a wide range of infrastructure projects vital to
our communities, to economic competitiveness, and to protecting the environment (ISI 2011).
9
Another land side application which focuses on roads and highways is the Greenroads rating
system. This system, like others, does a good job addressing stormwater treatment on roads which
could apply to the landside area of a ferry terminal. In addition to stormwater, Greenroads also focuses
on which materials would be more sustainable choices when constructing new projects (Greenroads
2011).
Another sustainability checklist referring to transportation was developed by Lochner and is
known as Sustainable Transportation Environmental Engineering and Design (STEED) guidelines. These
guidelines mainly cover roadways and separates the guidelines into the four stages processing, planning,
design, and construction (Lochner 2011). It would be difficult to relate the majority of the information in
these guidelines to WSF.
The State of Illinois has a guidance which lists practices that bring sustainable results to highway
projects known as the Illinois Livable and Sustainable Transportation (ILAST). It was developed by using
the NY State GreenLITES (IDOT 2010).
The International Organization for Standardization (ISO) has created the environmental series of
standards for the purpose of providing a framework for organizations when they are creating
environmental policy, plans, and actions (ISO 2011). This directly applies to WSF because the Safety
Management System (SMS) which WSF employs has incorporated the environmental management
system portion of ISO 14001 standards.
A good source for intermodal guidelines is the Port Authority of NY and NJ Sustainable
Infrastructure Guidelines. These guidelines were developed in 2006 for the purpose of addressing
projects that occur outside the building envelope (TPA 2010). Due to this intermodal approach, the
Sustainable Infrastructure Guidelines apply quite well to the WSF system, although it is not completely
10
comprehensive. However, the Sustainable Infrastructure Guidelines are currently still in draft status and
are still under development and review.
The Marine Vessel Environmental Performance Assessment (MVeP) which is under development
by the Society of Naval Architects and Marine Engineers (SNAME) applies to the waterside of WSF
(SNAME 2010). MVeP is expected to be the best set of guidelines for marine vessels and can be
implemented specifically for the ferries at WSF.
1.4.2 Current WSF Policies
Section 1.4.2 is further divided into two sections. Section 1.4.2.1 discusses the Safety
Management System (SMS) at WSF while Section 1.4.2.2 summarizes the purpose of the Stormwater
Pollution Prevention Plan (SWPPP) at WSF.
1.4.2.1 Safety Management System
WSF currently has a system in place which covers many best management practices. The safety
management system (SMS) is set up in such a way that one can pull out chapters as needed when the
appropriate situation arises. Some chapters of the SMS correspond well with the Stormwater Pollution
Prevention Plan (SWPPP) that WSF is currently applying for stormwater quality purposes. The chapters
that integrate into SWPPP are as follows:
DECK OPER 0170 &210 Transporting Livestock
DECK OPER 0200 Transporting Seafood
ENGR ENVN 0040 Sewage Pumping
ENGR ENVN 0050 Spill Response
ENGR ENVN 0060 Transfer of Hazardous/Potentially Hazardous Wastes
11
ENGR ENVN 0070 Oil Container Transfer and Disposal
ERM SAFE 0150 Ordering/Using Chemical Products
SMSM ENVN 0070 Transfer of Hazardous/Potentially Hazardous Wastes
SMSM ENVN 0100 Integrated Pest Management
SMSM ENVN 0110 Hazardous Materials Release
SMSM ENVN 0900 Solid Waste and Disposal Recycling
TERM EMER 0010 Emergency Response and Preparedness
TERM ENVN 0015 Hazardous Material Transport by Commercial Vehicles
TERM ENVN 0020 Hazardous Material Transport on Scheduled Trips
TERM ENVN 0025 Hazardous Material Charters
TERM ENVN 0030 Transfer of Hazardous/Potentially Hazardous Wastes
TERM ENVN 0035 Oil Container Transfer and Disposal
TERM ENVN 0040 Storm Drains and Scuppers
TERM ENVN 0050 Solid Waste and Disposal Recycling
TERM ENVN 0070 Spill Response
TERM ENVN 0080 Portable Spill Kits
TERM OPER 0030 Unique Loading and Off‐Loading Situations
TERM SAFE 0100 Housekeeping/Janitorial Supplies
TERM SAFE 0150 Ordering/Using Chemical Products
A table provided by WSF fully outlines how these SMS chapters integrate into the SWPPP. This table
can be found in Appendix A.
12
1.4.2.2 Stormwater Pollution Prevention Plan
The stormwater pollution prevention plan was created specifically for the following WSF terminals:
Anacortes
Bainbridge
Bremerton
Colman Dock (Seattle, Pier 52)
Edmonds
Fauntleroy
Mukilteo
Point Defiance
Southworth
Tahlequah
Vashon
The SWPPP covers different BMPs that have been or soon will be implemented at the previously
stated terminals. This was done to meet the requirements of the WSDOT Municipal Permit according to
the National Pollutant Discharge Elimination System (NPDES). This SWPPP is used as a training guide for
WSF employees on policies and procedures associated with stormwater management.
1.4.3 Similar Sites and Challenges
An example of managing stormwater on an over‐water infrastructure is the nearby State Route 520
floating bridge across Lake Washington. Washington State Department of Transportation (WSDOT)
recently developed alternatives for possible replacement of this bridge (WSDOT 2010). One of the
environmental concerns the SR 520 report focused on was the most effective stormwater treatment
13
available based on All Known, Available and Reasonable Technology (AKART). After initially examining 15
different technologies, four alternatives were selected for further investigation to see which one was
best applied. The four alternatives were:
Media filtration‐vaults
Catch basin media filtration
Modified catch basins/cleaning
High‐efficiency sweeping
The first three alternatives all make use of storing water for filtration underneath the bridge. In
many areas at this latitude storing water is accompanied with concerns about freezing possibilities.
However, due to the extremely close proximity to Lake Washington, freezing is not an issue when
storing water underneath the floating bridge. A ferry trestle on the Puget Sound is a similar situation in
this respect so the same solutions might be effectively applied at WSF.
The first alternative, media filtration‐vaults, focused on treating stormwater by the use of media
beds. These beds are stored horizontally on the deck underneath the highway. Different configurations
of this setup were attempted but all used a pre‐treatment to remove oil and grease followed by media
such as sand, pearlite, peat, and zeolite to treat major pollutants typically found in stormwater. The
media is periodically cleaned or replaced.
The catch basin media filtration alternative uses filters such as media pillows, filter bags, or
cartridges which are placed inside catch basins. These inserts are set up with overflow capabilities.
During high flows they will only treat the first flush of stormwater and allow the remaining flow to
bypass the filter so as to maintain an adequate draining speed. These require some maintenance in that
they must be replaced from time to time.
14
The third alternative is the modified catch basin sweeping and cleaning, including extra large catch
basins to increase the amount of sediments that can be trapped. Oil/grease trapping would occur due to
submerged outlets and large sumps would increase the residence time for sediments allowing for less
regular cleaning of the filters.
Finally, the fourth alternative refers to the Western Washington Stormwater Manual and its new
generation sweeping technology. This sweeping technology consists of a regenerative air sweeper and a
return vacuum. The sweeper blows air directly down onto the pavement while vacuuming up the air and
pollutants. This has been shown to reduce the dirt particles with a diameter of less than 250 microns by
25 to 50 percent (Sutherland 1998).
Of these four alternatives it was concluded that a combination of high‐efficiency sweeping and
modified catch basins and cleaning was the most applicable. Some benefits of this combination include:
It can provide an effective level of water quality protection for sediments and metals.
Its implementation is more visually apparent.
It takes advantage of the bridge’s flat gutterlines, which make it possible to retain sediments for
longer periods increasing the opportunity for their removal before they are discharged into
catch basins.
It does not have an unreasonable or unknown level of risk associated with operation and
maintenance—a characteristic of the other technologies.
Another example of stormwater treatment on a similar site can be seen at the WSF Bainbridge
Island terminal. It is at this terminal that the KriStar stormwater detention basin has been put in to treat
stormwater. The system is designed to capture and retain sediment, oils, and metals, reducing the total
discharge load. Data has shown that the system has been effective in removing pollutants associated
15
with stormwater runoff from the upland holding area. The Kristar system is made from polymeric
components and contains a polymer‐coated steel support screen which allows different media to be
used depending on the targeted pollutants. The system earned the General Use Level Designation from
the Washington State Department of Ecology (Kristar 2010). This system is an example of a type of
treatment/storage facility which could be implemented at other terminals where overland area is
available. A diagram illustrating the system setup at the Bainbridge Island terminal is shown in Figure
1.1.
Figure 1.1: Side view of Kristar system at the Bainbridge Island terminal
The Kristar stormwater vault collects rainwater running off of the holding area through the
already in place stormwater catch basins and pipes. After filtering out pollutants the water is than
released through a large pipe on the side of the hill. The hill is vegetated to allow the water to infiltrate
and take out other pollutants before entering the Puget Sound.
0+91.530+750+500+250+00
8
12
16
20
24
28
MHHWMHW
32
EXISTING GRADE
HIMALAYAN BLACKBERRY
26' @ 1% 18" SD
CB TYPE 2 48"Ø
4' @ 4% 18" SD
KRISTAR FILTER VAULT
PARKING LOT CURB
3' @ 4% 18" SD
CB TYPE 2 48"Ø
UPLAND DRAIN
16
1.4.4 LID practices
Several LID/BMP methods are applicable for ferry terminals. One of the possible LID techniques
that could be used is pervious pavement, which vertically infiltrates stormwater at the source or is used
as an overlay over existing pavement to filter the stormwater through horizontal flow. Pervious
pavement has the ability to store a significant amount of stormwater. This stormwater eventually
evaporates and does not contribute to runoff during smaller storm events. During larger events, the
runoff is significantly reduced (Rushton 2001; Battebo and Booth 2003; Bean et. al 2007). Due to the
tortuous pathways in pervious pavement, pollutants are also removed. In a study done by Barrett
(2008), he compared the stormwater pollutants from a typical impervious asphalt highway to the same
highway with a porous asphalt overlay. The study showed decreases in pollutant levels of 93% for Total
Suspended Solids (TSS), 36% for phosphorus, 52% for copper, 88% for lead, and 79% for zinc.
When land is available, an available LID technique is a bio‐retention pond or rain garden. These
are set up to retain water and allow stormwater pollutants to settle out and infiltrate over a period of
time. These are typically designed with an overflow system for large events, so that only the first flush is
treated.
Davis et al. (2003) did one of the first studies on the removal efficiency in bioretention ponds.
Synthetic runoff was applied to different bioretention areas and the effective removals were compared
between the two areas for the purpose of determining variability. The first area was in Greenbelt, MD
and resulted in a 16% retention rate for nitrate, 52% for Total Kjeldahl Nitrogen (TKN), 65% of total
phosphorus and 49% of total nitrogen. There was also over 95% retention of copper, lead, and zinc. The
second site looked at by Davis et al., in Largo, MD, had similar reduction rates for nitrogen and
phosphorous, but heavy metal retention rates ranged from 43% for copper to 70% for lead.
17
Dietz and Clausen (2006) constructed a replicate rain garden to treat roof runoff. The gardens were
constructed to hold one inch of runoff. The gardens were constructed in Haddam, CN and reduction
rates of all types of nitrogen ranged from 26% for TKN to 82% for ammonia. Phosphorous levels
increased.
Another field study was done by Rossen et al. (2006) to compare multiple LID designs.
Treatment strategies were uniformly sized to target a rainfall‐runoff depth equivalent to 90% of the
annual volume of rainfall. The pollutants examined in this study were total suspended solids, which was
reduced by 96%, and nitrate which was reduced by 27%.
Finally, Hunt et al. (2006) evaluated three different field sites with varying fill media type and
drainage configuration. The Greensboro, NC site resulted in a reduction in heavy metals between 81 and
99 percent with no reduction in nitrogen while the Chapel Hill, NC site resulted in reduction in nitrogen‐
based pollutants ranging from 13% for nitrate to 86% for ammonia. This data shows how the LID
techniques have a wide range of results depending on location and design. The results of the previously
stated studies are shown in Table 1.1.
Table 1.1: Summary of bioretention pollutant retention
Location TSS NO3‐N NH3‐N TKN TP TN ON Cu Pb Zn Reference
S‐2: Context Sensitive Solutions SSc2‐Community Connectivity SSp1.2‐Protect floodplain functions IS‐5: Protect Ecological Health Architecturally blend GM3.1‐Aquatic Life Impact
S‐3: Land Use Planning SSc5.1‐Protect or Restore Habitat SSp1.3‐Preserve wetlands IS‐6:Maintain Absorbent Landscapes Visitor center GM3.2‐Shore Protection
S‐4: Protect Wildlife Habitat SSc5.2‐Maximize Open Space SSp1.4‐Preserve endangered species IS‐8:Utilize Appropriate Vegetation Include guided tours AE6‐Ozone‐Depleting
S‐5: Protect Plant Communities SSc7‐Heat Island Effect SSc1.6‐Select sites in communities IS‐14: Mitigate Heat Island Effect Prevent flood damage
E‐5: Noise Abatement SSc8‐Light Pollution Reduction SSc1.7‐Accessible to public transit IS‐15:Minimize Light Pollution Allow change in activity
E‐6: Stray Light Reduction EAp3‐Refrigerant Management SVp4.1‐Control invasive plants IS‐16: Optimize Public Environments No ozone depleting substances
IEQc6‐Controllability of Systems SVp4.3‐Soil management plan Noise Pollution Prevention
IEQc7‐Thermal Comfort SVc4.5‐Preserve special status veg. Wildlife Considerations
IEQc8‐Daylighting and Views SVc4.6‐Daylighting and Views
SVc4.7‐Use native plants
SVc4.8‐Preserve native plants
SVc4.9‐Restore native plants
SVc4.12‐Reduce heat island effect
SVc4.13‐Reduce wildfire risk
HHc6.1‐Equitable site development
HHc6.2‐Equitable site use
HHc6.3‐Sustainability education
HHc6.4‐Protect historical places
HHc6.5‐Optimum site accessibility
HHc6.6‐Outdoor physical activity
HHc6.7‐Views of vegetation
HHc6.8‐Outdoor spaces
HHc6.9‐Reduce light pollution
E‐2: Reduce Electrical EAp2‐Minimum Energy Performance SVc4.10‐Minimize heating IE‐1: Optimize Energy Performance Produce renewable energy EE1.1‐Lighting
E‐3: Reduce Petroleum EAc1‐Optimize Energy SVc4.11‐Minimize cooling IE‐2:Electrical and Mechanical Systems Use waste heat from engine EE1.2‐HVAC
EAc2‐On‐site Renewable Energy OMc8.4‐Reduce energy consumption IE‐3: Utilize End Use Metering Use local material EE1.3‐Pump Systems
EAc5‐Measurement and Verification OMc8.5‐Use renewable energy IE‐4: Use On‐Site Renewable Energy Minimal embodied energy EE1.4‐Mechanical Equipment
EAc6‐Green Power IE‐5: Protect Ozone Layer Daylight harvesting EE1.5‐Hull/Propeller
IE‐6: Provide Alternative Fueling Stations High‐efficiency systems EE1.6‐Route Optimization
Individual control in offices EE1.7‐Vessel Speed
Automatic control in public EE1.8‐Energy Recovery
Automatically turn off lights EE1.9‐Hull Optimization
High reflectance EE2.1‐Other Fuels
EE2.2‐Renewable Energies
EE3‐Carbon Footprint
W‐1: Stormwater Management SSc6.1‐Stormwater Quantity Control Wp3.1‐Reduce landscape irrigation IS‐7: Utilize Pervious Pavement Emergency plan for spills WE1‐Oily Water
W‐2:BMPSs SSC6.2‐Stormwater Quality Control Wc3.2‐Reduce landscape irrigation IS‐9: Use Turfgrass Appropriately Oil separation equipment WE2‐Non‐Indigenous Species
WEp1‐Water Use Reduction Wc3.3‐Protect/Restore buffers IW‐1: Implement Stormwater BMPs Non toxic paint WE2.1‐Ballast Water/Sediment
WEc2‐Innovative Technologies Wc3.5‐Manage stormwater on site IW‐3: Reduce Use of Potable Water Prevent leaks WE3‐Sanitary Systems
WEc3‐Water Use Reduction Wc3.6‐On‐site water resources IW‐4: Utilize End Use Metering Reduce potable water WE4‐Solid Waste
Wc3.7‐Use stormwater for landscape IO‐1:Sustainable Landscape Maintenance Reduce city water WE5‐Incidental Discharges
Wc3.8‐Maintain water features IO‐2: Maintain Soil Quality Treat wastewater on‐site WE6‐Protection of Oil
OMp8.1‐Sustainable maintenance Implement LIDs GM2‐Hotel Water Use
Collect runoff/rainwater
Treat water on boat
Maintain ballast tanks
Exchanges off‐shore
M‐1: Reuse of Materials MRp1‐Recyclables MSp5.1‐Eliminate threatened wood IS‐10: Amend and Reuse Existing Soils Reduce waste due to activity GM1‐Materials
M‐2: Recycle content MRc1.1‐Building Reuse‐Exterior MSc5.2‐Maintain often IS‐11: Balance Earthwork Recycling dumpsters GM4‐Inventory Program
M‐3: Locally Provided Material MRc1.2‐Building Reuse‐Interior MSc5.3‐Design for deconstruction IM‐1: Use Recycled Materials Sort waste for recycling GM5‐Ship Recycling
Cc7.3‐Restore disturbed soils IC‐2: Protect Existing Natural Systems
Cp7.4‐Divert materials from disposal IC‐3:Transportation Management
Cp7.5‐Reuse soil IC‐4:Green Construction Equipment
Cp7.6‐Minimize emissions IC‐5: Reduce Noise and Vibration
IC‐6:Waste Management
IC‐7:Integrated Pest Management
Materials
Air Quality
Construction Phase
Energy
Water
Traffic/Parking
Community/Social
27
With this integration setup one can quickly see how the credits relate across rating systems. This
integration only shows the title of each credit, more detailed management practices of each credit for
the rating systems is located in Appendix B. This Green Rating Integration Platform currently relates
different green rating systems together and integrates in guidelines as well. Future work could be done
with the Green Rating Integration Platform to expand this integration to include regulations and design
standards, further helping WSF to make design, construction, and operations and maintenance
decisions. This will be further expanded upon in Chapter 7.
2.3 Stormwater Guidelines
For the purpose of this thesis, the focus is on stormwater treatment of ferry terminals. Focusing
on the water section of Table 2.2 and the stormwater credits within that section, Table 2.3 shows
stormwater guidelines across the green rating systems with additional practices below each rating
credit, integrated with the WSU Ferry Guidelines.
28
Table 2.3: Stormwater guidelines across multiple green rating systems
Upland Land Side Land Side Intermodal Intermodal Marine Side
GreenLITES LEED retail Sustainable Sites Initiative Port Authority WSU Ferry Guidelines MVeP W‐1: Stormwater Management SSc6.1‐Stormwater Quantity Control Wc3.3‐Protect/Restore buffers IS‐7: Utilize Pervious Pavement Emergency plan for spills WE1‐Oily Water
Stormwater retrofitting Maintain predevelopment rates Design to avoid disturbance Use pervious concrete, asphalt, pavers Oil separation equipment Use separating equipment
Eliminate non‐SW discharge Protect streams from erosion Re‐establish vegetated areas Use vegetated bioswales or ditches Non toxic paint Monitor discharge
Reduce impervious area SSc6.2‐Stormwater Quality Control Manage invasive plant species Utilize salt‐splashes at roadway edge Treat wastewater on‐site WE2‐Non‐Indigenous Species
W‐2:BMPSs Reduce impervious cover Wc3.4‐Rehabilitate streams Use structural soil to enhance percolation Implement LIDs WE2.1‐Ballast Water/Sediment
Use highly permeable soils Promote infiltration Remove stream modifications IS‐9: Use Turfgrass Appropriately Collect runoff/rainwater Ballast water treatment system
Use wet or dry swales Capture and treat stormwater Don't disrupt sediment transport Resilient, resistant, low‐maintenance veg. Treat water on boat Reduce NIS vector
Use sand filters or filter bag Wc3.5‐Manage stormwater on site Substitute ground covers for turfgrass Maintain ballast tanks WE2.2‐Hull Fouling
Minimize material pollutants Pervious paving WE6‐Protection of Oil
Reduce pollutant exposure to SW Sand filters Structural protection
Wc3.7‐Use stormwater for landscape Rain garden
Wc3.8‐Maintain water features IW‐2: Implement Rainwater Neutrality
Mimic natural environment Infiltrate stormwater
Maintain compatibility Mark storm drains
Estimate available rainwater IO‐2: Maintain Soil Quality
Collect/Reuse potable water Prevent soil pollution
Maintain as natural ecosystems Protect soil and minimize erosion
Biologically‐based water treatment Recycle organic waste
Manage snow/ice deicing or removal
Prepare a watering schedule
29
The WSU Ferry Guidelines section was expanded in a recent report developed by WSU for WSF
(Wolcott et al. 2011). The report detailed several different guidelines relating to stormwater on both the
landside and water side of the terminal. The additional techniques are divided into several categories for
both the landside and waterside and can be found in Tables 2.4 and 2.5.
30
Table 2.4: WSU Ferry Guidelines stormwater BMPs for landside of terminal
Fueling Landscape
Management
Treatment
System
Maintenance
Parking and
Storage
Roof/Building
Drains
LIDs
Emergency
plan for spills
PMP free of
pesticides
Oil/water
separator
Dispose
wastewater to
sewer
Analyze runoff
from buildings
Pervious
pavement
Slope fueling
pad
Use less toxic
pesticides
Clean regularly Sweep
regularly
Bio‐retention
ponds/swales
Spill
containment
pad
No pesticides
near water
Inspect and
repair
Oil removal
system
Constructed
stormwater
wetland
Roof over
fueling area
Mulch exposed
soils
Repair
promptly
Buffer strips
Prevent
sediment
discharge
Dispersion
Vegetated
roofs
Rainwater
harvesting
Path
disconnect
31
Table 2.5: WSU Ferry Guidelines stormwater BMPs for waterside of terminal
Loading and Unloading Maintenance of Vessels Mobile Fueling LIDs
Sweep areas Maintenance in a
covered area
Drip pan/pad Stormwater neutrality
Drip pans Store in a covered area Spill remedy kit Treatment
Marine Loading per
Coast Guard
Avoid toxic liquid
chemicals
Pollution prevention
Berm, slope or dikes
Curb along shoreline
Prevent pooling
2.4 WSF Stormwater Pollution Prevention Plan
WSF already has a Safety Management System in place which corresponds well with some elements
of the developing Stormwater Pollution Prevention Plan as detailed in Section 1.4.2. In the previously
mentioned table, provided by WSF and located in Appendix A, four activities relate well with stormwater
management. The four activities relating to water management covered in this table are:
Ramp Operations
Fuel and Hydrocarbon Use
Buildings & Grounds Operations and Maintenance
Dirt and Sediments
32
Each of these activities covers specific pollutant sources, lists possible BMPs, and states where the
activity is covered in the SMS. This information was reorganized as seen in Table 2.6 in order to help
ease the integration of current WSF practices with the above green rating systems.
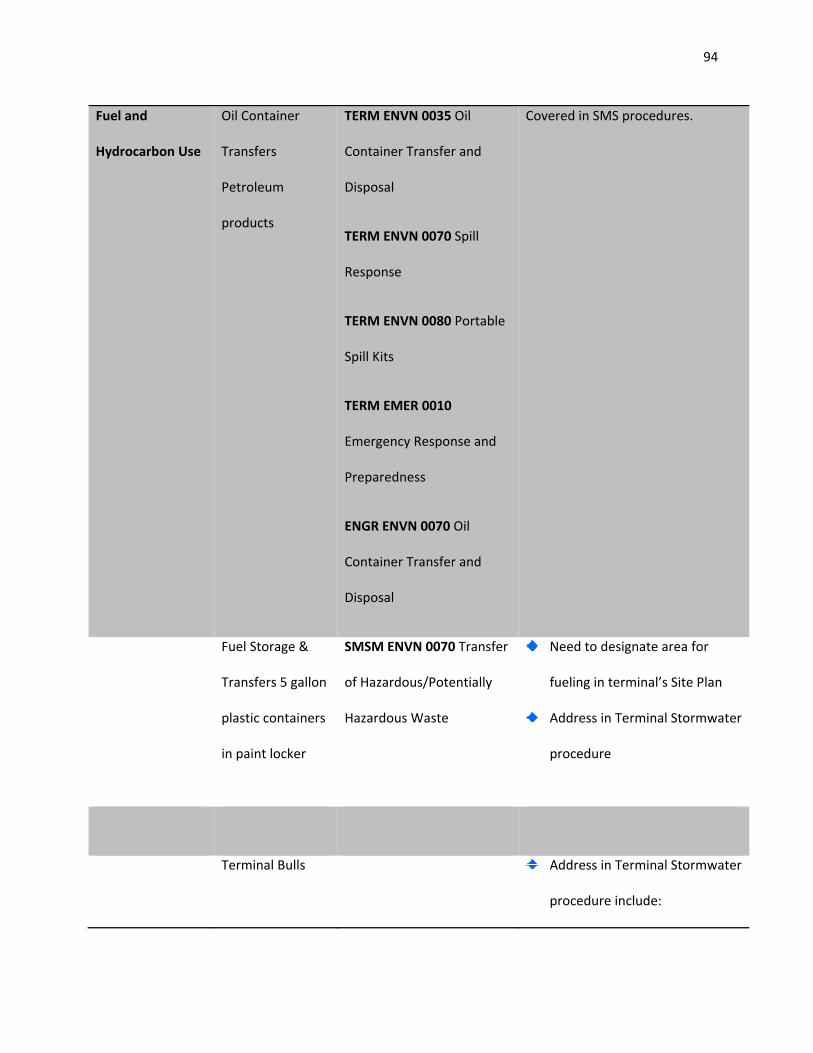
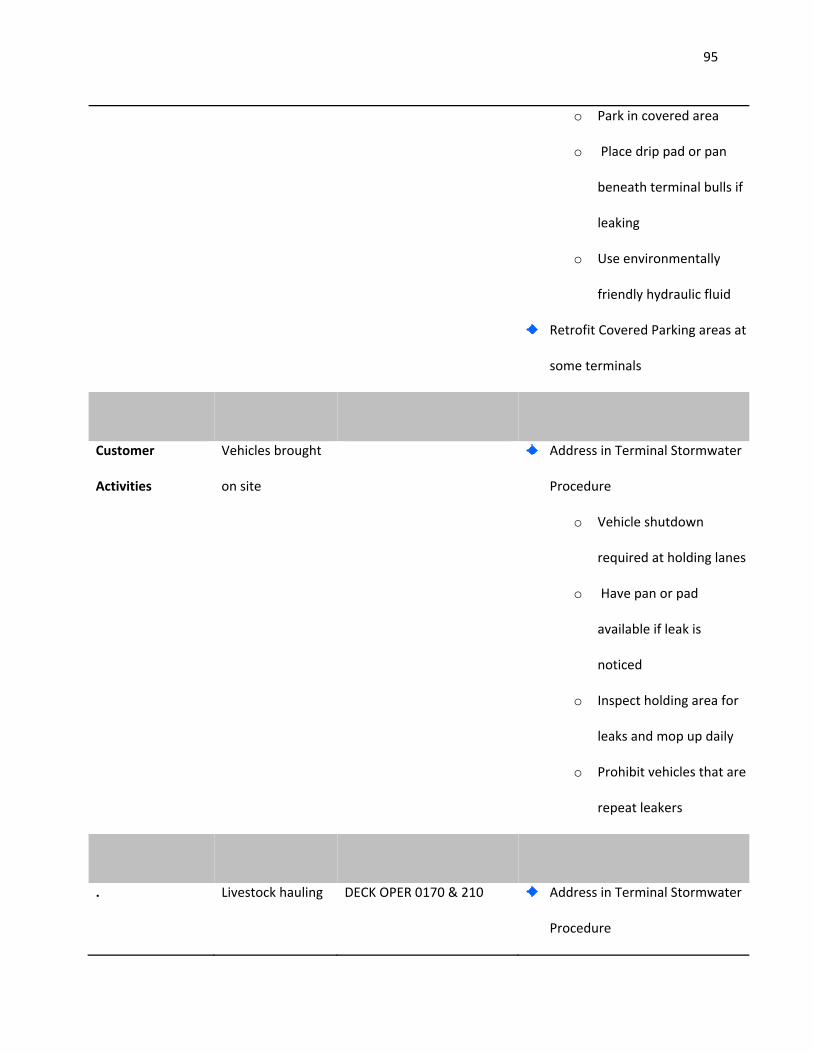
Table 2.6: WSF current water management guidelines
2.5 Green Rating Integration Platform
The SMS (Table 2.6) was then combined with the five rating systems (Table 2.3) and the updated
WSU Ferry Guidelines (Tables 2.4 and 2.5) into one table so that all information could be cross‐
referenced. The stormwater section of the green rating integration platform is shown in Table 2.7.
Activity BMP Pollutant Source Environmentally friendly hydraulic oils Hydraulic System and Cables Charge hose with potable water Sewage Transfers Hose
Oil Container Transfers Designated area Fuel Storage & Transfers Park in covered area Terminal Bulls Drip pan or pad
Environmentally friendly fuel
Retrofit covered parking
Use coated materials Roofs, Gutter, & Downspouts Use coated materials Galvanized fencing Weekly inspection Stormwater Catch Basins Yellow circle around drains
Integrated pest management Vegetation Management Use approved herbicides
Mechanical control preferred
Bioswale maintenance
Supplies elevated and covered Maintenance and Cleaning Environmentally friendly supplies
No dumping of cleaning waters
Use containment Painting Cover drains
Vacuum holding area quarterly Windblown & tracked in Weekly terminal stormwater inspection
Daily holding area inspection/mop up
Ramp Operations
Fuel and Hydrocarbon Use
Buildings & Grounds Operations and Maintenance
Dirt and Sediments
33
Table 2.7: Stormwater Green Rating Integration Platform with SMS and expanded WSU Ferry Guidelines
Upland Land Side Land Side Intermodal SMS SMS SMS Intermodal Marine Side
GreenLITES LEED retail Sustainable Sites Initiative Port Authority Activity BMP Pollutant Source WSU Ferry Guidelines MVeP W‐1: Stormwater Management SSc6.1‐Stormwater Quantity Control Wc3.3‐Protect/Restore buffers IS‐7: Utilize Pervious Pavement Environmentally friendly hydraulic oils Hydraulic System and Cables Fueling WE1‐Oily Water
Stormwater retrofitting Maintain predevelopment rates Design to avoid disturbance Use pervious concrete, asphalt, pavers Charge hose with potable water Sewage Transfers Hose Emergency plan for spills Use separating equipment
Eliminate non‐SW discharge Protect streams from erosion Re‐establish vegetated areas Use vegetated bioswales or ditches Oil Container Transfers Slope fueling pad Monitor discharge
Reduce impervious area SSc6.2‐Stormwater Quality Control Manage invasive plant species Utilize salt‐splashes at roadway edge Designated area Fuel Storage & Transfers Spill containment pad WE2‐Non‐Indigenous Species
W‐2:BMPSs Reduce impervious cover Wc3.4‐Rehabilitate streams Use structural soil to enhance percolation Park in covered area Terminal Bulls Roof fueling area WE2.1‐Ballast Water/Sediment
Use highly permeable soils Promote infiltration Remove stream modifications IS‐9: Use Turfgrass Appropriately Drip pan or pad Landscape Management Ballast water treatment system
Use wet or dry swales Capture and treat stormwater Don't disrupt sediment transport Resilient, resistant, low‐maintenance veg. Environmentally friendly fuel Pest Management Plan Reduce NIS vector
Use sand filters or filter bag Wc3.5‐Manage stormwater on site Substitute ground covers for turfgrass Retrofit covered parking Less toxic pesticides WE2.2‐Hull Fouling
Use oil/grit separators Consider entire hydrologic cycle IW‐1: Implement Stormwater BMPs Use coated materials Roofs, Gutter, & Downspouts No pesticides 100' to water Clean vessel exterior
Underground detention systems Minimize impervious cover Implement SW management plan Use coated materials Galvanized fencing Pesticide alternatives Use hull coating
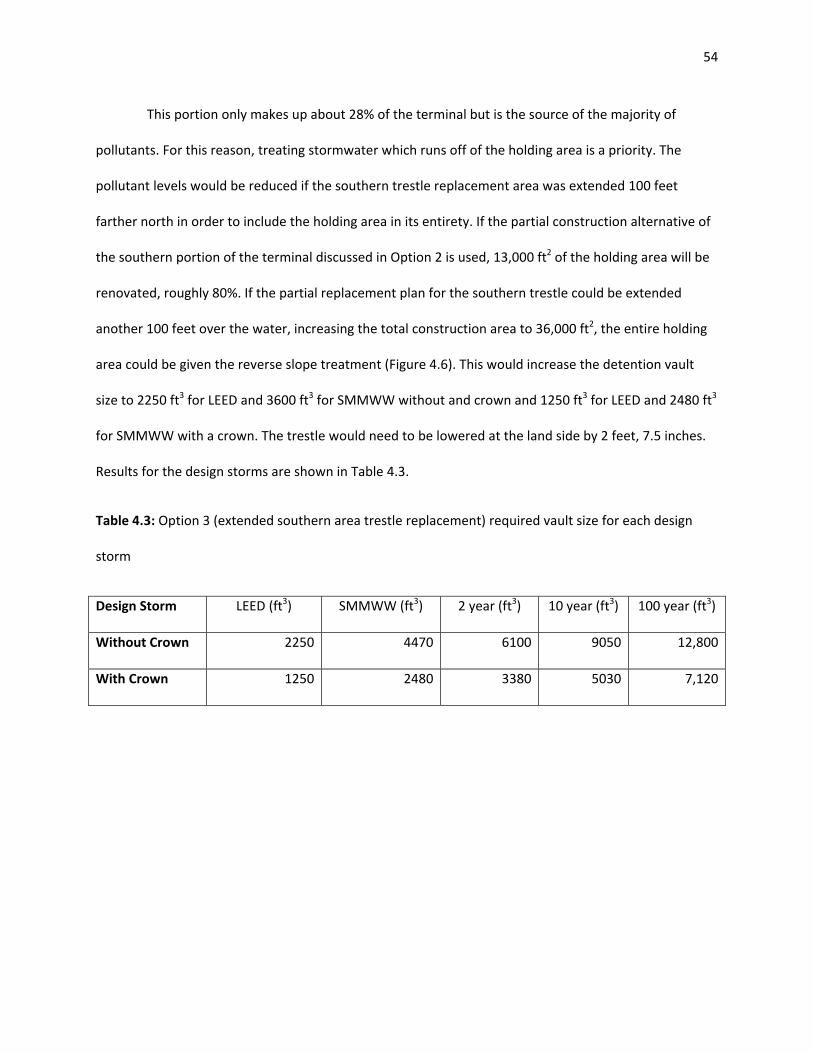
An interesting observation is the required vault size for the SMMWW guideline is much smaller
than the vault size for the LEED guideline. When calculating the vault sizes for the trestle the LEED
guideline indicated a smaller vault than the SMMWW guideline. The reason for this is the SMMWW
calculations take into account the maximum natural detention and other hydrological processes upslope
from the trestle for the landside contributions, while the LEED guideline is a uniform 0.75” of rainfall
over the entire area regardless of what the surface detention or other processes might be. This is more
apparent on the upland calculations due to the presence of forest land. When comparing these two
64
guidelines for the trestle portion of the runoff, all of the area is impervious, causing the potential
maximum natural detention to be quite small and therefore making the land surface impacts similar in
the two approaches. The SMMWW estimate is larger for the trestle side since a greater rainfall depth of
1.49” is based specifically on rainfall patterns in the local area.
5. PERVIOUS CONCRETE‐SWEEPING
This section covers an alternative LID design integrating a pervious concrete overlay for a
portion or all of the paved trestle areas in combination with high efficiency sweeping and possibly
special catch basin inserts. Background information is presented in Section 5.1 and three design options
are presented in Section 5.2.
5.1 Background
The pervious concrete method would also be implemented during replacement, and consists of
applying a pervious concrete overlay to the existing pavement which would allow for horizontal flow of
stormwater through the medium to modified catch basins on the edge of the pavement prior to
discharge into the Sound. The pervious concrete would undergo maintenance involving high efficiency
sweeping. Catch basins are optional depending on the water quality improvement and the future water
quality requirements imposed on WSF. Pervious concrete differs from traditional pavements in that it
allows surface water to run through the pavement instead of on top of the pavement. As the water runs
through the concrete, most pollutants remain on the surface of the pavement, which can later be
removed by use of sweeping. It has been shown that a porous asphalt overlay is successful in removing
total suspended solids, phosphorus, and heavy metals such as copper, lead, and zinc (Barrett 2008).
Similar results can be expected with pervious concrete. Research has shown that pervious concrete in
conjunction with pavement cleaning is successful in removing particulates from stormwater (Sansalone
65
2008). A study was recently performed in the Pacific Northwest comparing durability of permeable
pavement to impermeable pavement. After six years of daily parking use, there were no major signs of
wear. Nearly all of the stormwater infiltrated into the permeable pavement, reducing runoff to near
zero (Rushton 2001; Battebo and Booth 2003; Bean et. al 2007). Motor oil was detected in 89% of the
samples taken from the impervious pavement but was not found in any water that had been infiltrated
through the permeable pavement (Brattebo and Booth, 2003).
As noted in the aforementioned studies, it is expected that a significant portion of the oil and
grit pollutants from the pavements would be retained by the pervious concrete, although some oil and
solids would still run through the concrete and therefore might be additionally treated using an oil/grit
separator type of catch basin (EPA 2006). The pervious concrete method should also be combined with
high efficiency sweeping, similar to what was concluded in the SR 520 study, to help with the reduction
of dirt particles. Sweeping will also help to prevent the pervious concrete from clogging and losing
effectiveness (Tennis et al. 2004).
Pervious concrete does not have as much strength and durability as traditional concrete for
heavy vehicle loading. For this reason, it may be beneficial, and perhaps more economical, to
strategically determine the most optimum places where a pervious concrete overlay can be used. In
particular, it is important to limit usage in areas where trucks and heavy vehicles will be parked, or at
those locations, specially design the pervious concrete to be able to withstand heavier than average
vehicle loads. Pervious concrete can still be used in areas with heavy vehicle loads; it would just need to
be designed for that purpose.
One advantage of using pervious concrete as a stormwater management technique is that it can
work with all of the replacement staging strategies proposed by WSF. It is not necessary to replace the
entire trestle to implement pervious concrete. Pervious concrete can simply be overlaid onto the
66
existing structure on the trestle subject to appropriate loading validations or structural improvements.
Three different overlay options will be examined in Section 5.2. These three look at an overlay for the
entire trestle, the holding lanes only, and three of the four holding lanes, those expected to not have
significant truck traffic.
5.2 Options
This section examines three different pervious concrete overlay options. The options are an
overlay over the entire trestle, an overlay of just the holding lanes, and an overlay of three out of the
four holding lanes.
5.2.1 Option 1: Entire trestle overlay
Pervious concrete could be overlaid over the entire existing pavement, totaling 58,580 ft2. The
concrete would need to have a greater strength (usually depth) in areas of moving traffic or where
heavy vehicles may be parked for extended periods of time (Figure 5.1). This option has the advantage
of treating stormwater for pollutants throughout the entire trestle but has the disadvantage of a higher
cost. All three options are summarized in Table 5.1.
67
Figure 5.1: Pervious concrete overlay over the entire trestle
LEGENDN
HEAVY LOADINGAREA
68
5.2.2 Option 2: Holding lanes only
As previously mentioned, the holding lanes are the source of the highest pollutant loads. These
high pollutant loads are caused by vehicles being parked or idling at this location for extended periods of
time. As a result, the holding area should be the highest priority when treating stormwater for
pollutants. By overlaying pervious concrete on only the holding lanes, the efficiency of pollutants
treated versus area is as high as possible (Figure 5.2). When overlaying pervious concrete on all four
holding lanes, it may be necessary to specify one lane for heavy vehicles and use a thicker, stronger
pervious concrete for that lane. Using Equation 4.4 in Section 4.4, this option treats 66% of the
pollutants on the trestle (Table 5.1). Additionally, to provide insight into the amounts of pollutants
treated due to varying ‘hotspot’ factors, Table 5.1 also includes final results from varying the factor from
4 to 10.
69
Figure 5.2: Pervious concrete overlay for the holding lanes only
LEGENDN
PERVIOUS CONCRETE
70
5.2.3 Option 3: Three out of four holding lanes
A third option is applying a pervious concrete overlay to only three of the four holding lanes
(Figure 5.3). The fourth holding lane would then be used for all heavy traffic. In this option, a majority of
the heavy pollutant area is still treated and the pervious concrete will not have to be specially designed
for a heavy traffic load and is therefore the least expensive option. It is assumed that heavy vehicles
contribute the same amount of pollutants per area as the lighter vehicles. Using Equation 4.4 in Section
4.4, this option treats 49% of the pollutants on the trestle (Table 5.1).
Table 5.1: Summary of the three pervious concrete options presented
Options Total Pervious
Concrete Area (ft2)
Pervious Concrete Heavy
Loading Area (ft2)
Px/PT (%)
if FHS = 4
Px/PT (%)
if FHS = 5
Px/PT (%)
if FHS = 10
Entire trestle
overlay
58,580 28,190 100 100 100
Holding lanes
only overlay
16,310 4,080 61 66 79
Three holding
lanes overlay
12,230 0 46 49 60
71
Figure 5.3: Pervious concrete overlay on three out of the four holding lanes
LEGEND
NLARGE VEHICLEHOLDING AREA
PERVIOUS CONCRETE
72
6. GREEN RATING SYSTEM POINTS
This section will make use of the Green Rating Integration Platform to identify which credits in
each of the rating systems are met by the two designs discussed in Chapters 5 and 6. Both the reverse
slope and the pervious concrete alternatives will be examined by each of the four land side rating
systems (GreenLITES, LEED, SSI and PANYNJ) and the appropriate points and credits will be assigned in
each rating system for the design. The reverse slope credits are summarized in Section 6.1 and Table 6.1
and the pervious concrete credits are summarized in Section 6.2 and Table 6.2.
6.1 Reverse Slope
The reverse slope design meets the requirements for two credits in the GreenLITES system, W‐1
and W‐2. W‐1 is the first water quality credit and focuses on both volume and quality of stormwater
management. The reverse slope design is worth two points for this credit as long as it is accompanied by
a model which demonstrates how the design will reduce the pollutant loading into Puget Sound. Credit
W‐2 of GreenLITES is focused on the use of BMPs. Reverse slope also earns two points in credit W‐2 for
the stormwater detention basin which the stormwater is diverted to.
The LEED retail system credit which can be met is Sustainable Sites credit 6.2. This credit focuses
on quality control of stormwater and is worth one point. In order to meet this credit 90% of the average
annual rainfall must be treated and 80% of the total suspended solids (TSS) must be removed from the
stormwater. This can be proven if the detention system is designed according to state or local
performance standards or if monitoring data is available. Unfortunately, none of the options outlined for
reverse slope would precisely meet these requirements because less than 90% of the terminal is
treated, but with a credit interpretation for the water quality criteria as meeting the intent of the credit,
it might be met for the Option 1 (full replacement) without a crown or Option 3 (extended southern
73
portion) without a crown. Also, LEED also has a credit for innovative design processes and the reverse
slope technique may earn a point in that area.
Sustainable Sites Initiative’s water credit 3.5 focuses on managing stormwater on site and is
worth between five and ten points. To qualify for this credit the initial and final runoff rates as well as
the target water storage volumes need to be documented. Also, it must be shown that the release of
water from the detention basin will not harm the ecology or cause safety concerns. Finally, it must be
documented that the design does not negatively affect the Puget Sound. The reverse slope design
should meet all these requirements without a problem and therefore be eligible for the maximum
number of points.
Implementing stormwater BMPs falls under credit IW‐1 for the Port Authority of New York and
New Jersey Sustainable Infrastructure Guidelines. This credit is currently worth one point in New Jersey
and three points in New York. For sites large than ¼ of an acre, which the Vashon Island terminal is, the
post‐development flow of stormwater must be reduced and the quality improved. Also, the 2, 10, and
100 year storm events must be 50%, 75%, and 80% of pre‐construction rates respectively. Similar to the
LEED credit, the stormwater detention basin must reduce TSS by 80% and if the upland stormwater is
included the TSS must be reduced by 50%. Finally, all catch basins must be marked to inform the public
that they drain directly into the Sound. The reverse slope technique can be made to meet all of these
requirements.
6.2 Pervious Concrete
Pervious pavement also meets both credits W‐1 and W‐2 in the GreenLITES rating system. The
reduction in overall impervious area achieved by using pervious pavements is worth two points for
74
credit W‐1. All types of permeable pavement are also worth two points in credit W‐2 as an appropriate
BMP.
The LEED credit is also the same for both design methods. The sustainable site LEED credit 6.2
focuses on quality control of stormwater and is worth one point. In order to meet this credit 90% of the
average annual rainfall must be treated and 80% of the total suspended solids (TSS) must be removed
from the stormwater. This can be proven if monitoring data is available. This can be met only if the total
overlay option is met.
For the Sustainable Sites Initiative green rating program, the pervious concrete design is eligible
for two different credits. The water credit 3.5 focuses on managing stormwater on site and is worth
between five and ten points. To quality for this credit the initial and final runoff rates need to be
documented. Also, it must be shown that the water runoff will not harm the ecology or cause safety
concerns. Finally, it must be documented that the design does not negatively affect the Puget Sound.
Water credit 3.6 is worth between three and nine points and focuses on water quality. The first
requirement for Wc3.6 is all exterior materials used in the construction must be chosen in order to
minimize the amount of pollutants that stormwater will pick up. An example of this is coating railings
which are a source of zinc. Second, a site maintenance plan must be enacted to ensure the pervious
pavement continues to function correctly. This may involve sweeping. Finally, TSS must be reduced to 25
mg/L, which pervious concrete is expected to achieve. If 80% of stormwater on the site is treated 3
points are earned, 90% of the site gets 5 points, and 95% of the site earns eight points for credit Wc3.6.
This credit will only be eligible for the pervious overlay of the total site, and should earn eight points for
the credit.
Pervious concrete is eligible for two credits under the Sustainable Infrastructure Guidelines as
well. Credit IS‐7 is specifically awarded for the use of pervious pavement. One point is awarded if
75
pervious pavement is used for 25% of the hardscape, two points for 50%, and three points for 75%.
Pervious concrete may also achieve the requirements for credit IW‐1. This credit is currently worth one
point in New Jersey and three points in New York. For sites large than ¼ of an acre, which the Vashon
Island terminal is, the post‐development flow of stormwater must be reduced and the quality improved.
Also, the 2, 10, and 100 year storm events must be 50%, 75%, and 80% of pre‐construction rates
respectively. The stormwater quantity issue may not apply to the trestle because it is an over‐water
structure and the rain which falls on it would normally enter the Puget Sound. This exempts the trestle
from being subject to water quantity guidelines. Similar to the LEED credit, the TSS in the stormwater
must be reduced by 80%. Finally, all catch basins must be marked to inform the public that they drain
directly into the Sound. Due to the TSS requirements, this credit would only be achieved by the total
overlay option.
76
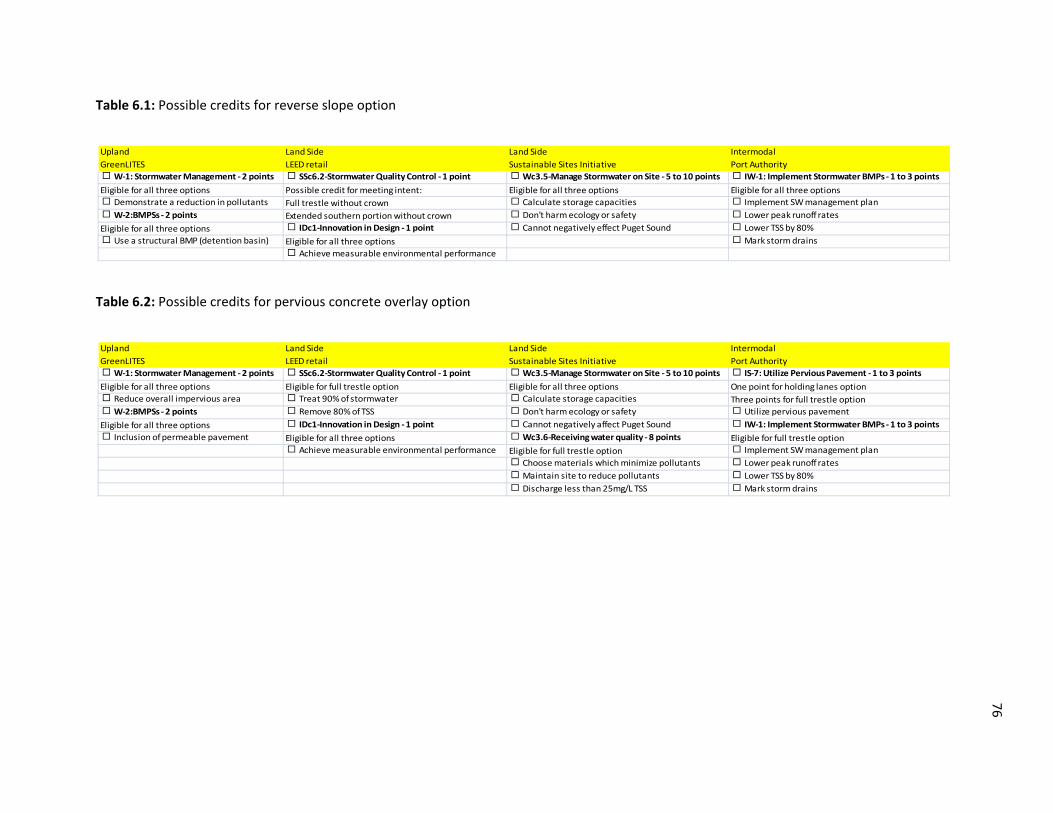
Table 6.1: Possible credits for reverse slope option
Table 6.2: Possible credits for pervious concrete overlay option
Upland Land Side Land Side Intermodal
GreenLITES LEED retail Sustainable Sites Initiative Port Authority W‐1: Stormwater Management ‐ 2 points SSc6.2‐Stormwater Quality Control ‐ 1 point Wc3.5‐Manage Stormwater on Site ‐ 5 to 10 points IW‐1: Implement Stormwater BMPs ‐ 1 to 3 points
Eligible for all three options Possible credit for meeting intent: Eligible for all three options Eligible for all three options Demonstrate a reduction in pollutants Full trestle without crown Calculate storage capacities Implement SW management plan
W‐2:BMPSs ‐ 2 points Extended southern portion without crown Don't harm ecology or safety Lower peak runoff rates
Eligible for all three options IDc1‐Innovation in Design ‐ 1 point Cannot negatively effect Puget Sound Lower TSS by 80%
Use a structural BMP (detention basin) Eligible for all three options Mark storm drains
Achieve measurable environmental performance
Upland Land Side Land Side Intermodal
GreenLITES LEED retail Sustainable Sites Initiative Port Authority W‐1: Stormwater Management ‐ 2 points SSc6.2‐Stormwater Quality Control ‐ 1 point Wc3.5‐Manage Stormwater on Site ‐ 5 to 10 points IS‐7: Utilize Pervious Pavement ‐ 1 to 3 points
Eligible for all three options Eligible for full trestle option Eligible for all three options One point for holding lanes option Reduce overall impervious area Treat 90% of stormwater Calculate storage capacities Three points for full trestle option W‐2:BMPSs ‐ 2 points Remove 80% of TSS Don't harm ecology or safety Utilize pervious pavement
Eligible for all three options IDc1‐Innovation in Design ‐ 1 point Cannot negatively affect Puget Sound IW‐1: Implement Stormwater BMPs ‐ 1 to 3 points
Inclusion of permeable pavement Eligible for all three options Wc3.6‐Receiving water quality ‐ 8 points Eligible for full trestle option Achieve measurable environmental performance Eligible for full trestle option Implement SW management plan
Choose materials which minimize pollutants Lower peak runoff rates
Maintain site to reduce pollutants Lower TSS by 80%
Discharge less than 25mg/L TSS Mark storm drains
77
7. SUMMARY AND RECOMMENDATIONS
A recap of how each objective was completed is provided in Section 7.1 followed by a summary
of the findings in Section 7.2.
7.1 Objectives
Objective 1:
A literature review was performed on several common green rating systems. Background
information was provided on 13 green rating systems which outline different low impact development
practices in Section 1.4.1.
Objective 2:
Five rating systems (GreenLITES, LEED retail, Sustainable Sites Initiative, Port Authority of NY/NJ
Sustainable Infrastructure Guidelines, and MVeP) were determined applicable for some portion of a
ferry terminal in Section 2.1. Combined, these five rating systems addressed the upland, landside,
intermodal, and waterside areas. These five rating systems were organized into seven categories set up
using previous work done by WSU. A matrix, titled Green Rating Integration Platform (GRIP), was
created integrating the LID practices of all five rating systems and previous WSU research, illustrating
how credits relate across rating systems as found in Section 2.2.
Objective 3:
Since the detailed focus of this thesis is stormwater treatment, each of the rating systems
stormwater credits was more thoroughly examined in Section 2.3. The WSU Ferry Guidelines section
was expanded to include current research and new BMP techniques recommended by WSU for WSF
specifically in the area of stormwater treatment in Section 2.4. The WSF safety management system was
78
examined and activities which related to stormwater were reorganized to fit into the previously
developed GRIP matrix. The GRIP was then further expanded to include stormwater credits from all five
rating systems, expanded WSU Ferry Guidelines, and the current WSF safety management system
procedures in Section 2.5 (Table 2.7).
Objective 4:
This thesis then goes on to examine the Vashon Island terminal as a case study with respect to
stormwater challenges and sustainability in Chapter 3. Two different LID strategies used to reduce
stormwater pollutant levels were examined. The reverse slope method was explained and three
different implementation options were presented in Chapter 4. Each of the options resulted in different
required vault sizes and different levels of pollutants which are treated. The reverse slope also
presented the possibility of treating stormwater running onto the terminal from Vashon Island as well as
treating stormwater runoff from the terminal itself. The pervious concrete method was then explained.
It also has three different design options presented which resulted in different construction areas and
levels of treated pollutants, as is presented in Chapter 5. Both of these strategies are further
summarized in decision support tools later in this Chapter 7.
Objective 5:
In Chapter 6, these two LID techniques are analyzed using the Green Rating Integration Platform
in order to relate them to sustainability tools. The GRIP shows which credits each strategy may be
eligible for and what points can be earned.
7.2 Findings
Stormwater runoff contains pollutants which may need to be treated before being discharged
into a water body. Due to the close proximity of ferry terminals to the Puget Sound, most common
79
treatment techniques cannot be easily implemented. Two possible stormwater treatment techniques
for use at the Vashon Island ferry terminal have been investigated. The first of these techniques are a
reverse slope of a portion of the paved trestle area, directing stormwater back towards the land where
it is collected in a stormwater detention vault and appropriately treated. The second technique uses a
pervious concrete overlay on certain portions of the paved areas of the trestle. The overlay would trap
and treat many of the pollutants at the source and might be used in combination with specialized catch
basins for additional treatment.
A summary of the size of the treatment facilities, the percent of pollutants treated based on the
trestle side pavement loadings for water quality volumes as related to the LEED and the SMMWW
standards for the reverse slope method are listed in Table 7.1. Also listed is the additional critical
criterion for the change in elevation of the trestle at the edge of the land (lowered distance), which may
or may not be feasible depending on water levels, etc. Also, the additional waters that the vault would
need to handle if landside runoff is also directed are included in the additional landside row in Table 7.1.
(Note that the LEED requirement does not address the hydrological processes upslope on the land and
therefore the SMMWW volume is more realistic.)
80
Table 7.1: Reverse slope decision support tool (assuming a hotspot factor of 5)