31
Integrating renewable generation in New Zealand Graeme Ancell Ancell Consulting Ltd New Zealand
Integrating renewable
generation in New Zealand
Graeme Ancell
Ancell Consulting Ltd
New Zealand
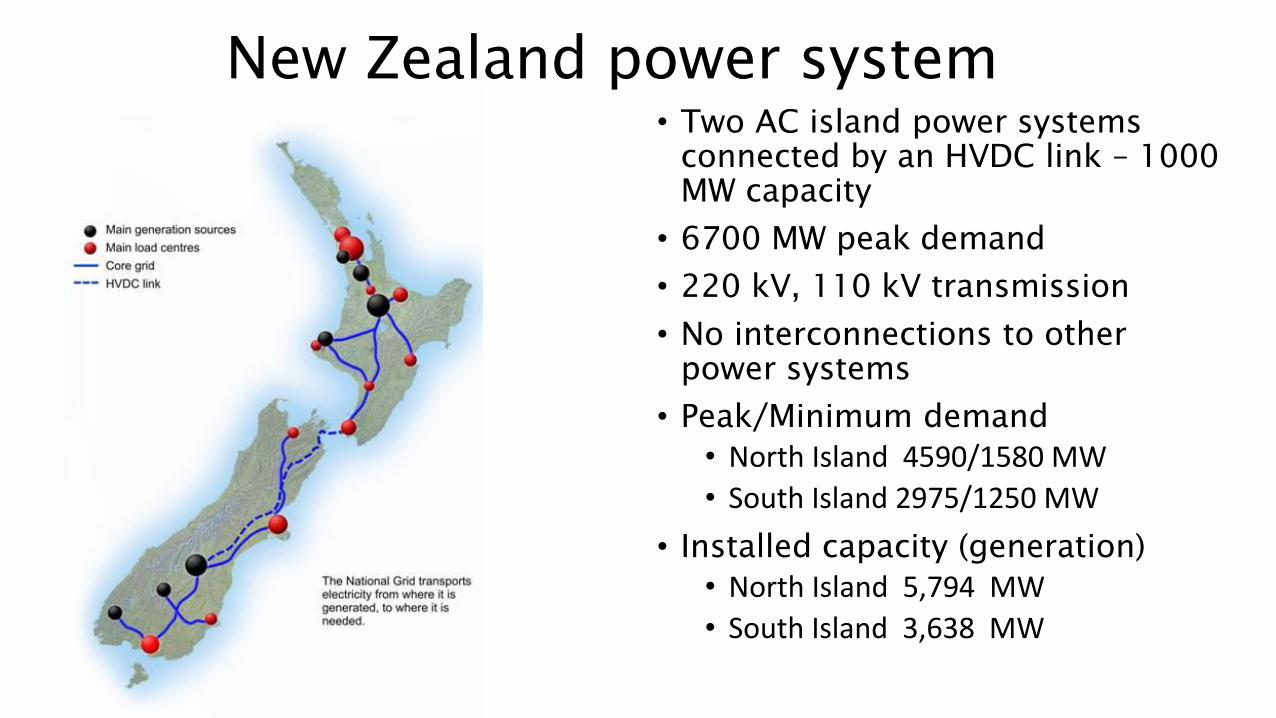
New Zealand power system
• Two AC island power systems
connected by an HVDC link – 1000
MW capacity
• 6700 MW peak demand
• 220 kV, 110 kV transmission
• No interconnections to other
power systems
• Peak/Minimum demand
• North Island 4590/1580 MW
• South Island 2975/1250 MW
• Installed capacity (generation)
• North Island 5,794 MW
• South Island 3,638 MW
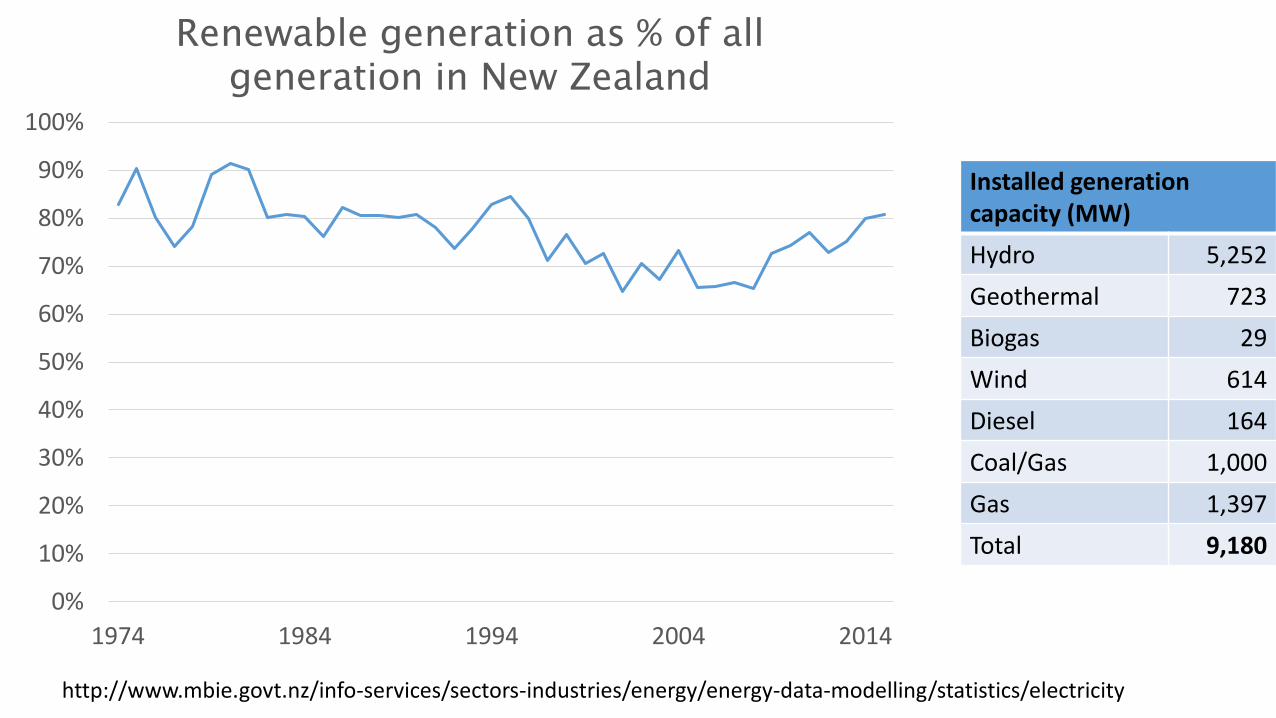
0%
10%
20%
30%
40%
50%
60%
70%
80%
90%
100%
1974 1984 1994 2004 2014
Renewable generation as % of all
generation in New Zealand
http://www.mbie.govt.nz/info-services/sectors-industries/energy/energy-data-modelling/statistics/electricity
Installed generation capacity (MW)
Hydro 5,252
Geothermal 723
Biogas 29
Wind 614
Diesel 164
Coal/Gas 1,000
Gas 1,397
Total 9,180
New Zealand Electricity Industry (i)
• Competitive wholesale
electricity market and
competitive retail market
• Five large generator-retailers dominate the market
• Separation of lines and retail
businesses
• One transmission company
• 27 distribution companies
• Some grid connected industrial customers
• Distribution companies can own some generation
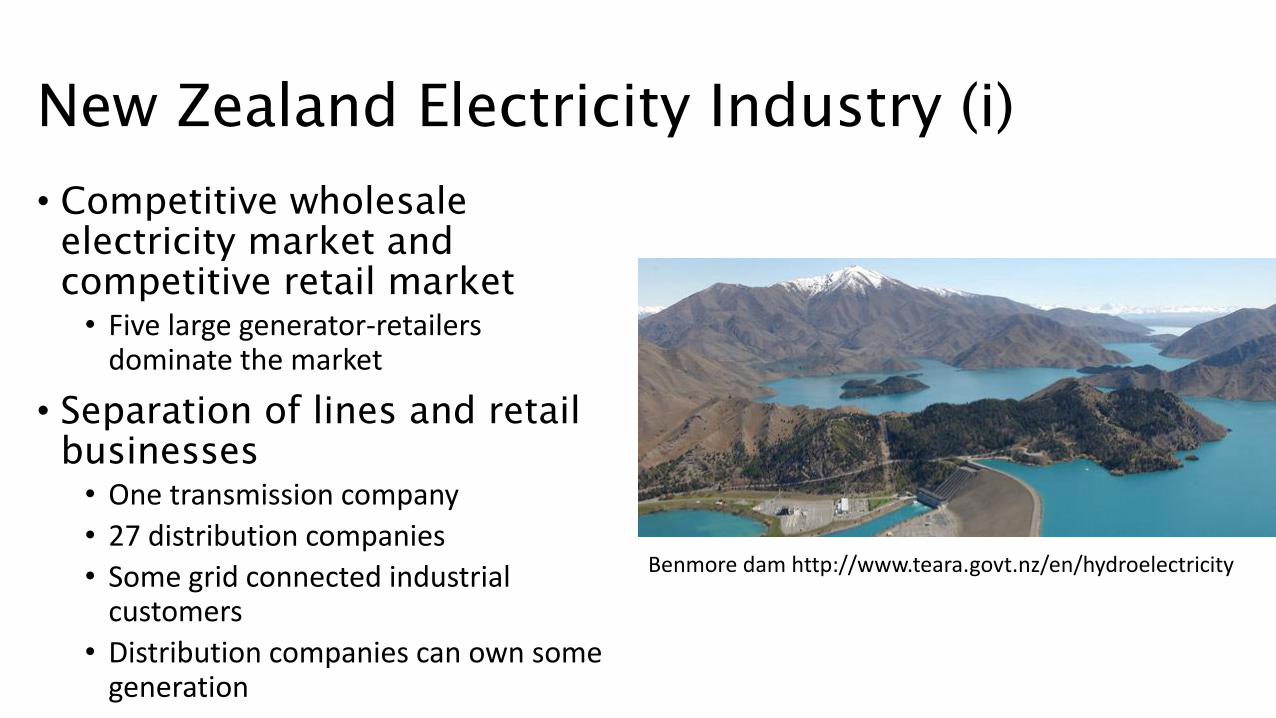
Benmore dam http://www.teara.govt.nz/en/hydroelectricity
New Zealand Electricity Industry (ii)
• Generation and retail
• Vertically integrated by location
• Partially privatised
• Transmission asset owner and
system operator
• Government owned
• Distribution
• Mix of Trust owned and Publicly owned
• Two regulators
• Electricity Authority
• Commerce Commission
Ownership
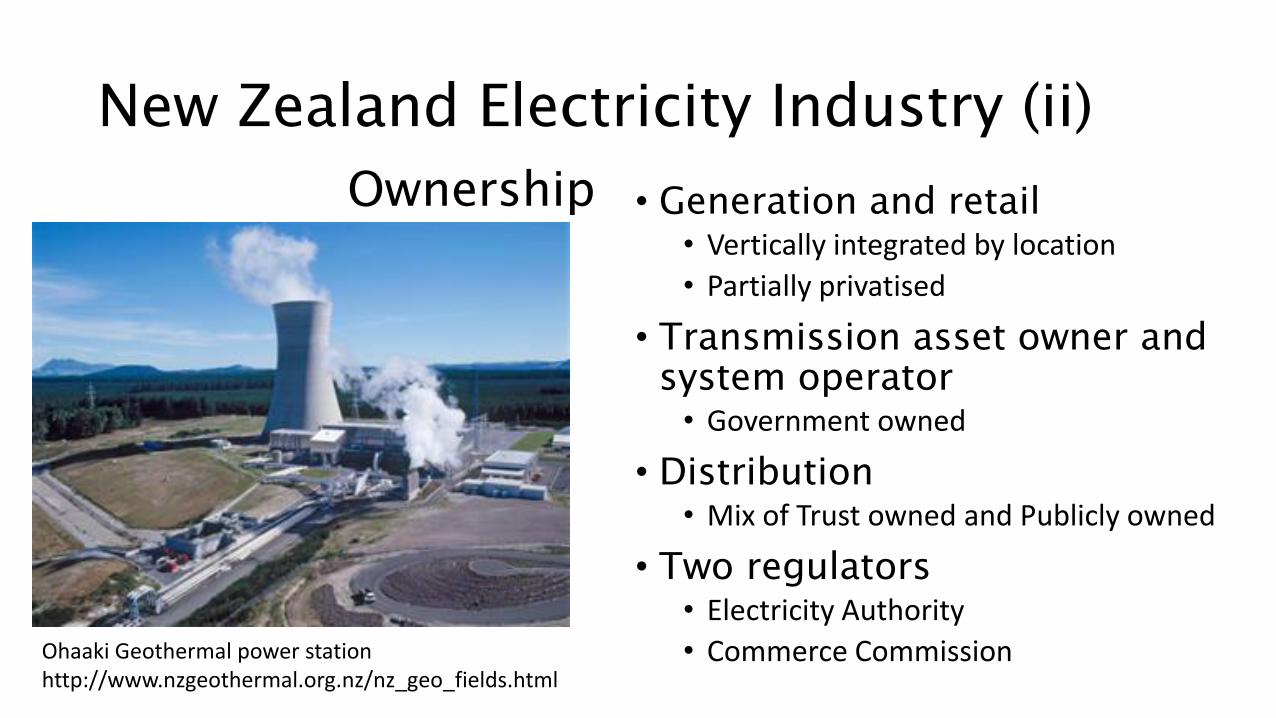
Ohaaki Geothermal power stationhttp://www.nzgeothermal.org.nz/nz_geo_fields.html
New Zealand Electricity Industry (iii)
Electricity Authority
• Oversees wholesale market
• Hires service providers for scheduling and dispatch, reconciliation, financial transmission rights
• Monitors industry adherence to rules and regulations
Commerce Commission
• Approves revenue proposals for transmission and distribution
• Monitors network performance for transmission and distribution
Electricity code (in legislation)
• Operation of wholesale market
• System operator obligations
• Asset owner performance obligations
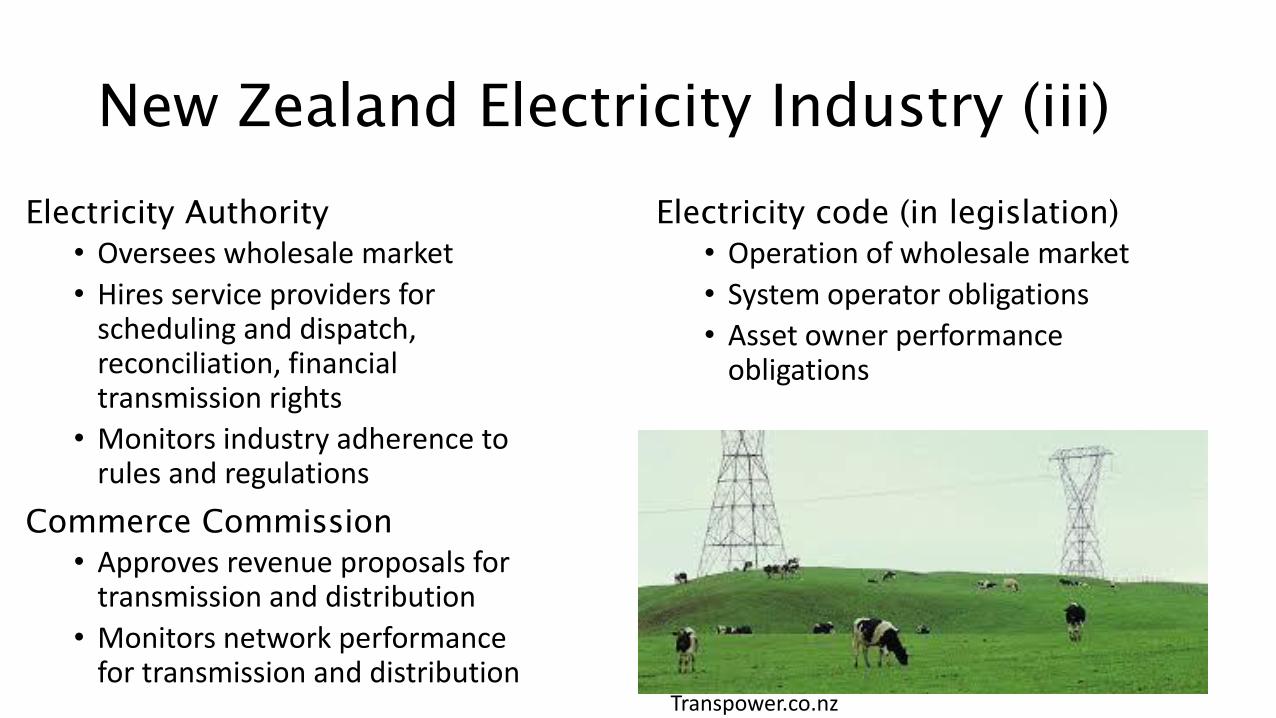
Transpower.co.nz
New Zealand Wholesale Market (i)
• Operating for 20 years
• Bid based security constrained economic dispatch
• Optimises energy and ancillary services costs
• Nodal pricing with >280 trading nodes
• 30 minute trading periods
• Re-dispatch every 5 minutes
• No AGC
• Nodal price – the system cost of increasing offtake at
the node by 1 MWh
• Nodal prices include costs of transmission losses and constraints
• Load pays the nodal price for electricity consumed from the grid
• Generation gets paid the nodal price for electricity injected into the
grid
• New generation location takes nodal price into account
• Build closer to load where there are higher prices
• Less likely to build in constrained regions
• Ongoing debate around having fewer price zones and having more
trading nodes
8
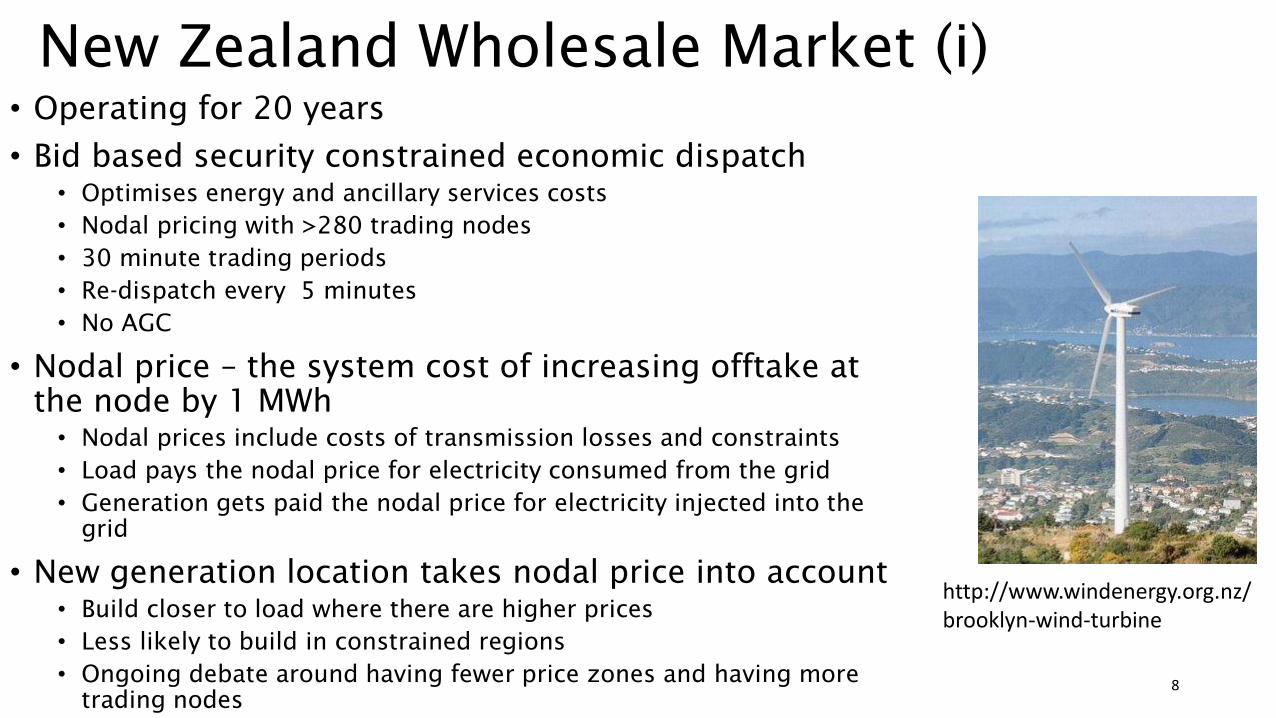
http://www.windenergy.org.nz/brooklyn-wind-turbine
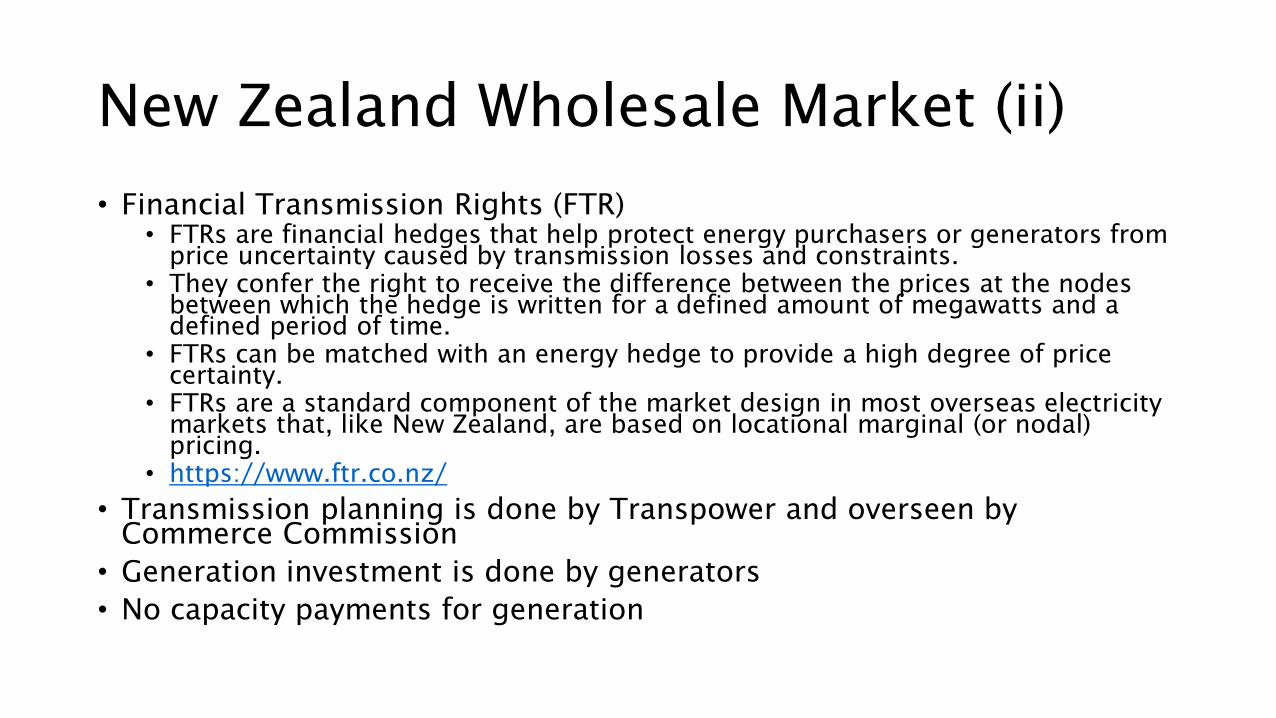
New Zealand Wholesale Market (ii)
• Financial Transmission Rights (FTR)
• FTRs are financial hedges that help protect energy purchasers or generators from
price uncertainty caused by transmission losses and constraints.
• They confer the right to receive the difference between the prices at the nodes
between which the hedge is written for a defined amount of megawatts and a
defined period of time.
• FTRs can be matched with an energy hedge to provide a high degree of price
certainty.
• FTRs are a standard component of the market design in most overseas electricity
markets that, like New Zealand, are based on locational marginal (or nodal)
pricing.
• https://www.ftr.co.nz/
• Transmission planning is done by Transpower and overseen by
Commerce Commission
• Generation investment is done by generators
• No capacity payments for generation
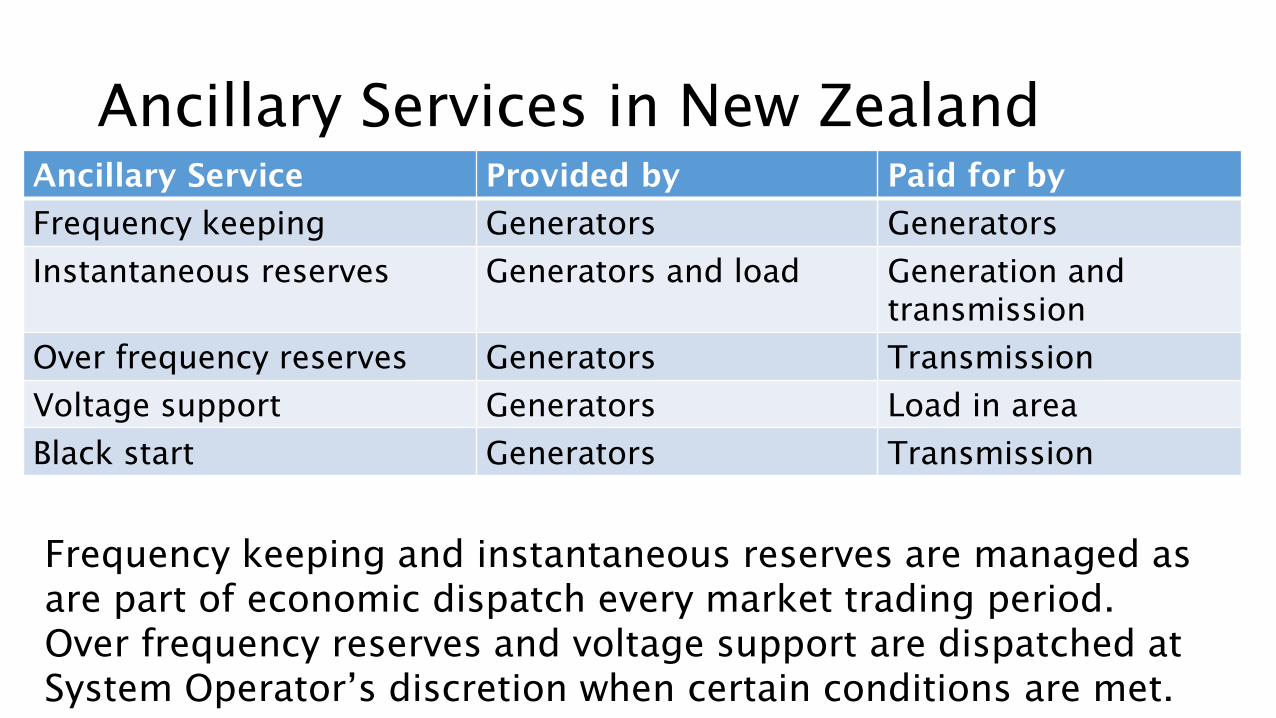
Ancillary Services in New Zealand
Ancillary Service Provided by Paid for by
Frequency keeping Generators Generators
Instantaneous reserves Generators and load Generation and
transmission
Over frequency reserves Generators Transmission
Voltage support Generators Load in area
Black start Generators Transmission
Frequency keeping and instantaneous reserves are managed as
are part of economic dispatch every market trading period.
Over frequency reserves and voltage support are dispatched at
System Operator’s discretion when certain conditions are met.
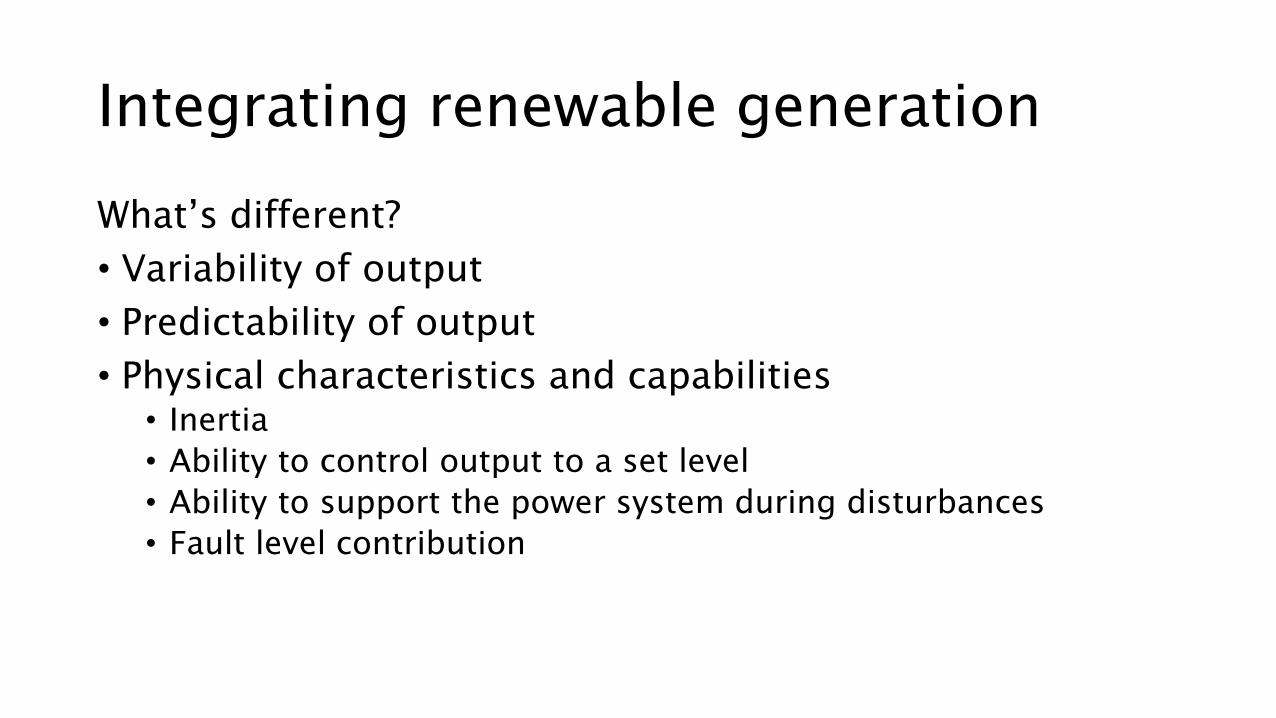
Integrating renewable generation
What’s different?
• Variability of output
• Predictability of output
• Physical characteristics and capabilities
• Inertia
• Ability to control output to a set level
• Ability to support the power system during disturbances
• Fault level contribution
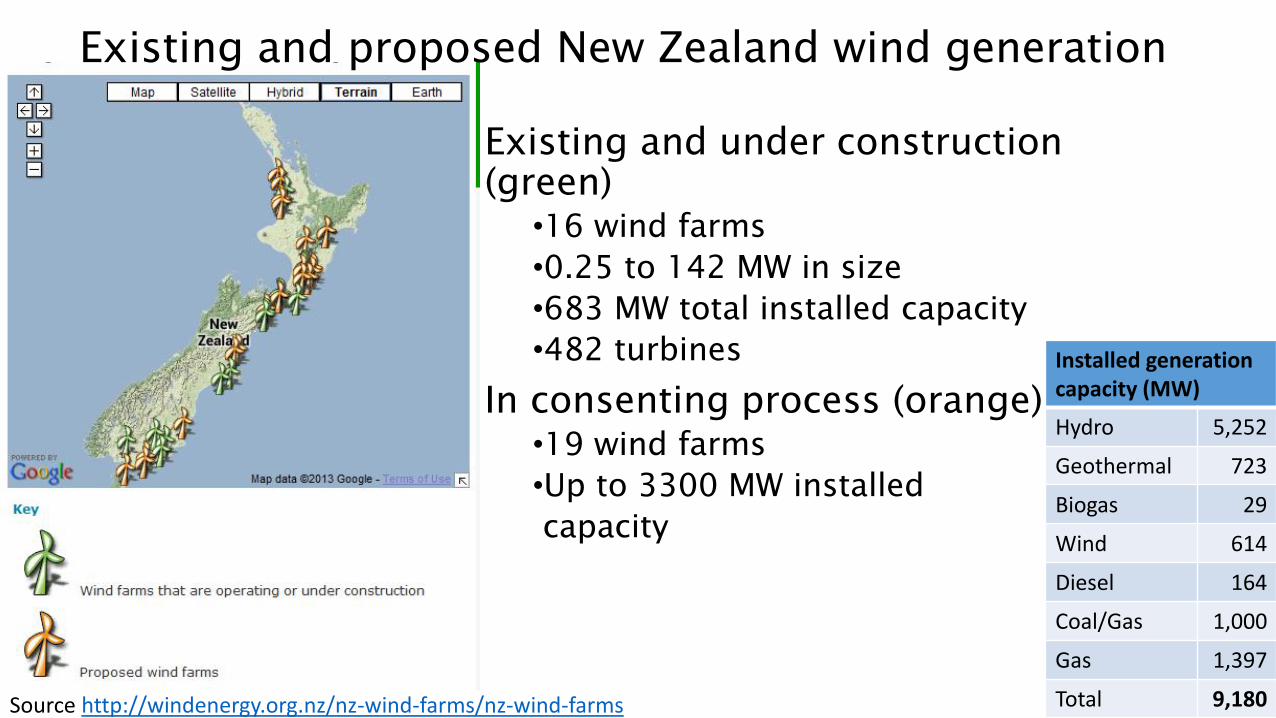
Source http://windenergy.org.nz/nz-wind-farms/nz-wind-farms
Existing and proposed New Zealand wind generation
Existing and under construction
(green)
•16 wind farms
•0.25 to 142 MW in size
•683 MW total installed capacity
•482 turbines
In consenting process (orange)
•19 wind farms
•Up to 3300 MW installed
capacity
Installed generation capacity (MW)
Hydro 5,252
Geothermal 723
Biogas 29
Wind 614
Diesel 164
Coal/Gas 1,000
Gas 1,397
Total 9,180
2050
2060
2070
2080
2090
2100
2110
2120
2130
00:0
0:00
00:0
1:40
00:0
3:20
00:0
5:00
00:0
6:40
00:0
8:20
00:1
0:00
00:1
1:40
00:1
3:20
00:1
5:00
00:1
6:40
00:1
8:20
00:2
0:00
00:2
1:40
00:2
3:20
00:2
5:00
00:2
6:40
00:2
8:20
00:3
0:00
00:3
1:40
Index
No
rth
Isla
nd
Lo
ad
0
10
20
30
40
50
60
70
80
Te A
pit
i
North Island load
Te Apiti output
Output variability
Te Apiti is a wind farm in the North Island with an installed capacity of 90 MW.
Wind generation
0
10
20
30
40
50
60
70
80
0 60 120 180 240
Time (minutes)
MW
Wind generation
0
10
20
30
40
50
60
70
80
0 60 120 180 240
Time (minutes)
MW
Wind generation
0
10
20
30
40
50
60
70
80
0 60 120 180 240
Time (minutes)
MW
Actual wind farm output, 90 MW installed capacity,
initial output at 40 MW
Affected Area Investigation
Pre dispatch processes
1: Effect of unpredictability of wind generation output on pre-dispatch processes
Dispatch processes
2: Effect of variability of wind generation output on dispatch processes
3: Effect of variability of wind generation output on asset loading
Power System Stability
4: Effect of wind generation capability on steady state voltage management
5: Effect of wind generation capability on management of frequency excursions
6: Effect of wind generation capability on voltage stability
7: Effect of wind generation capability on power system transient stability
8: Effect of wind generation capability on oscillatory stability
9: Effect of wind generation capability on dynamic voltage stability
Urgent further work• Wind generation forecast• Large change
management• SO tools and processes
Input into existing workstreamsFrequency keeping• Normal frequency
review• Cost allocation reviewEmergency management
Potential rule changes• Fault ride through capability• Voltage support
requirements• Frequency support
requirements• Instantaneous reserves cost
allocation
New Zealand wind integration studies
http://www.ea.govt.nz/about-us/what-we-do/our-history/archive/dev-archive/work-programmes/power-systems-and-common-quality/wgip/
How is the power system affected by
renewable generation?
• Increased uncertainty in scheduling
• Need forecasts for renewable generation• How much generation reserves need to be kept
• Increased uncertainty in dispatch
• Increased frequency of re-dispatch• Increased need for ancillary services
• Real time power system security may be affected
• Reduced resilience to disturbances• Reduced ability to control voltage
• Power system reliability and adequacy may change
• To what extent can renewable generation be relied upon to provide security of supply• Will renewable generation be there at times of electricity shortage
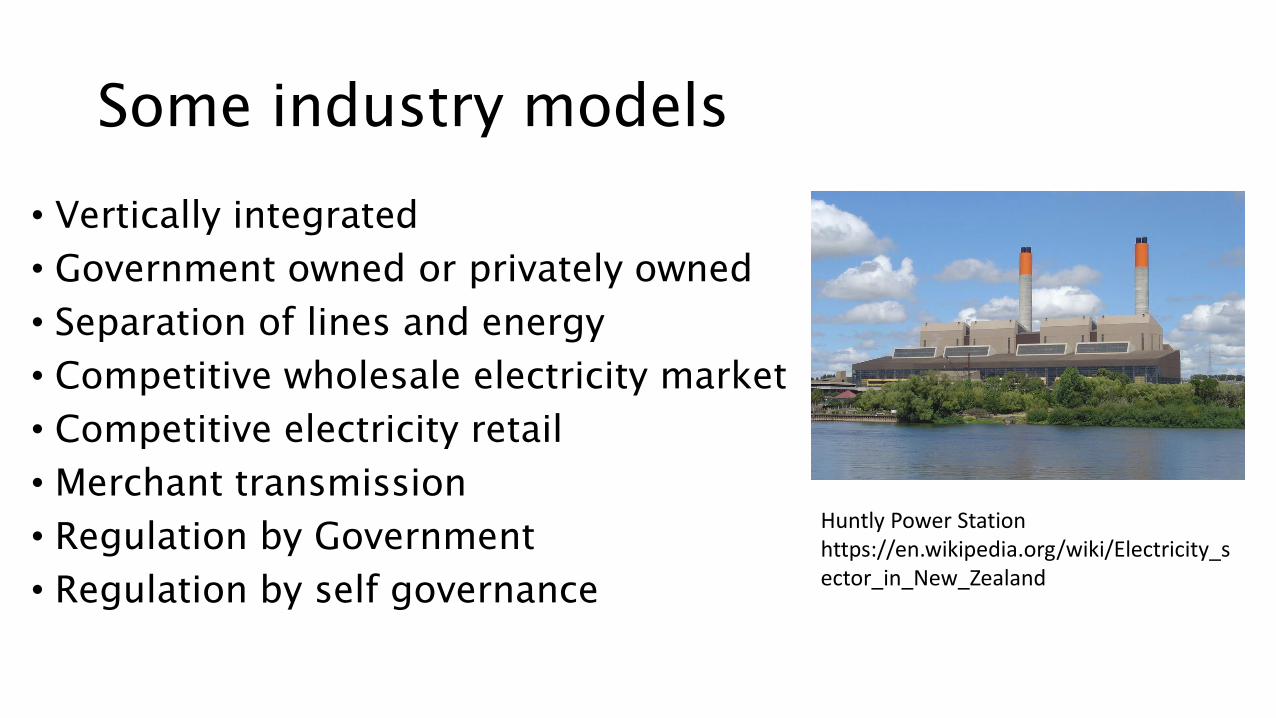
Some industry models
• Vertically integrated
• Government owned or privately owned
• Separation of lines and energy
• Competitive wholesale electricity market
• Competitive electricity retail
• Merchant transmission
• Regulation by Government
• Regulation by self governance
Huntly Power Station https://en.wikipedia.org/wiki/Electricity_sector_in_New_Zealand
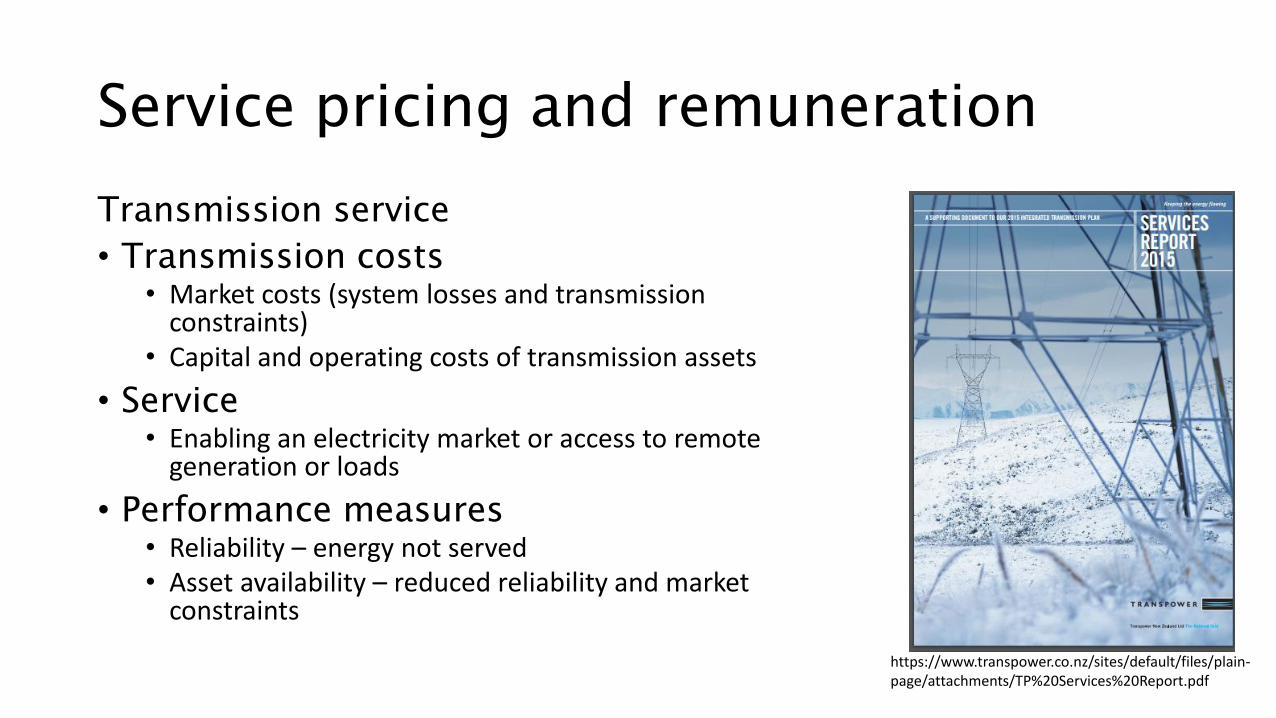
Service pricing and remuneration
Transmission service
• Transmission costs
• Market costs (system losses and transmission constraints)
• Capital and operating costs of transmission assets
• Service
• Enabling an electricity market or access to remote generation or loads
• Performance measures
• Reliability – energy not served• Asset availability – reduced reliability and market
constraints
https://www.transpower.co.nz/sites/default/files/plain-page/attachments/TP%20Services%20Report.pdf
Regulatory roles and responsibilities
• Market operation
• System operation
• Transmission asset owner
• Generation owners
• Distribution asset owners
• Distribution system operator
• Future, to coordinate distributed energy resources
• Regulator
• Allowed revenue and required performance of transmission and distribution• Oversight of market operation• Oversight of generation planning

End
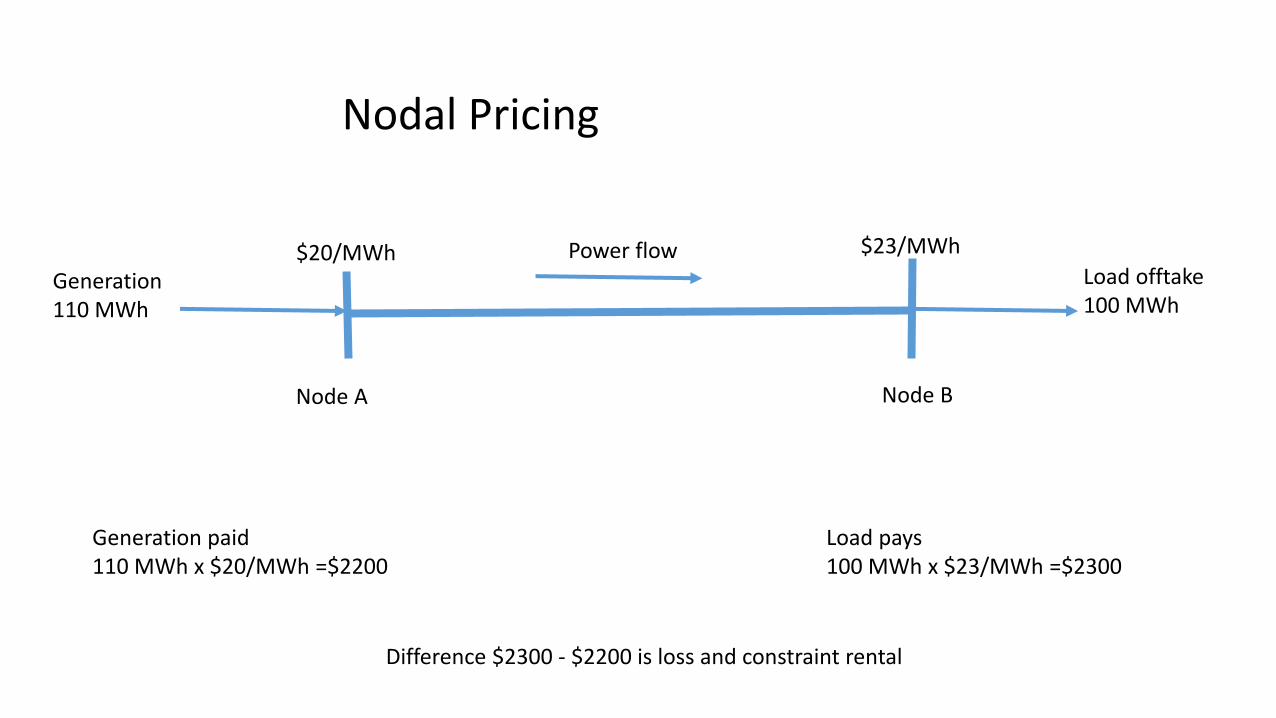
$20/MWh $23/MWhPower flow
Node A
Generation110 MWh
Load offtake100 MWh
Node B
Generation paid 110 MWh x $20/MWh =$2200
Load pays 100 MWh x $23/MWh =$2300
Difference $2300 - $2200 is loss and constraint rental
Nodal Pricing
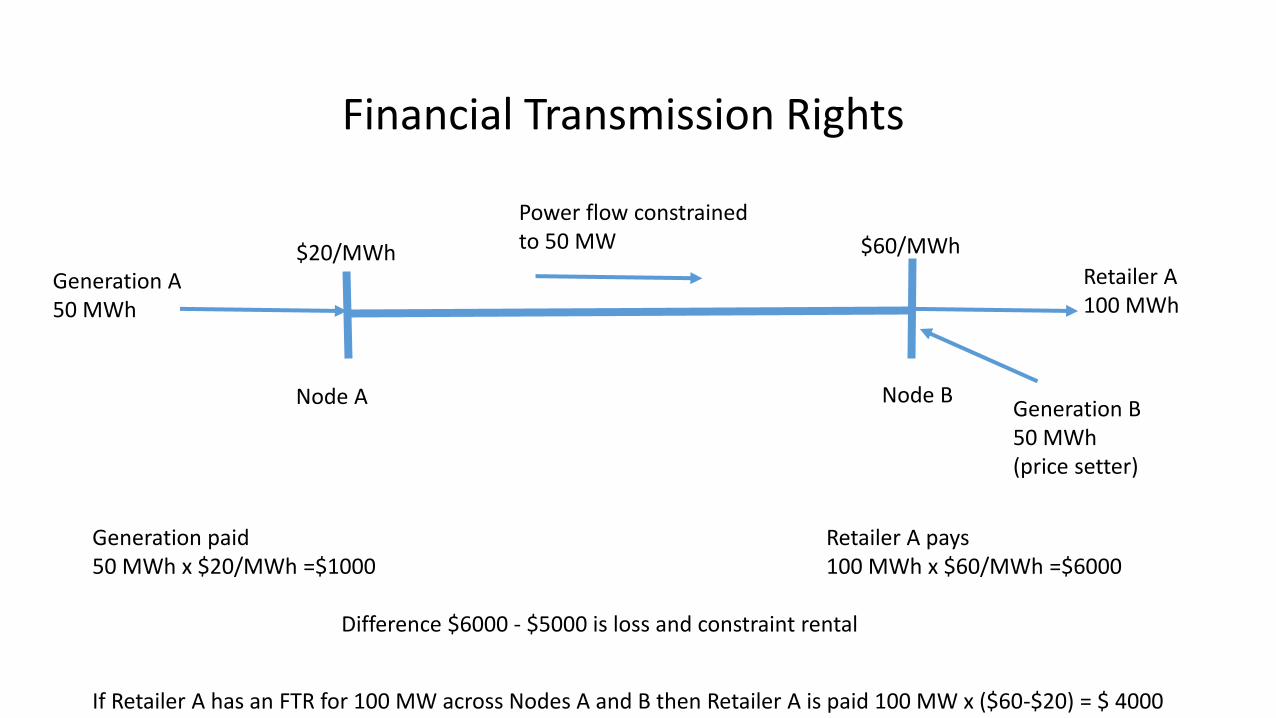
$20/MWh $60/MWh
Power flow constrained to 50 MW
Node A
Generation A50 MWh
Retailer A100 MWh
Node B
Generation paid 50 MWh x $20/MWh =$1000
Retailer A pays 100 MWh x $60/MWh =$6000
Difference $6000 - $5000 is loss and constraint rental
Financial Transmission Rights
Generation B50 MWh(price setter)
If Retailer A has an FTR for 100 MW across Nodes A and B then Retailer A is paid 100 MW x ($60-$20) = $ 4000
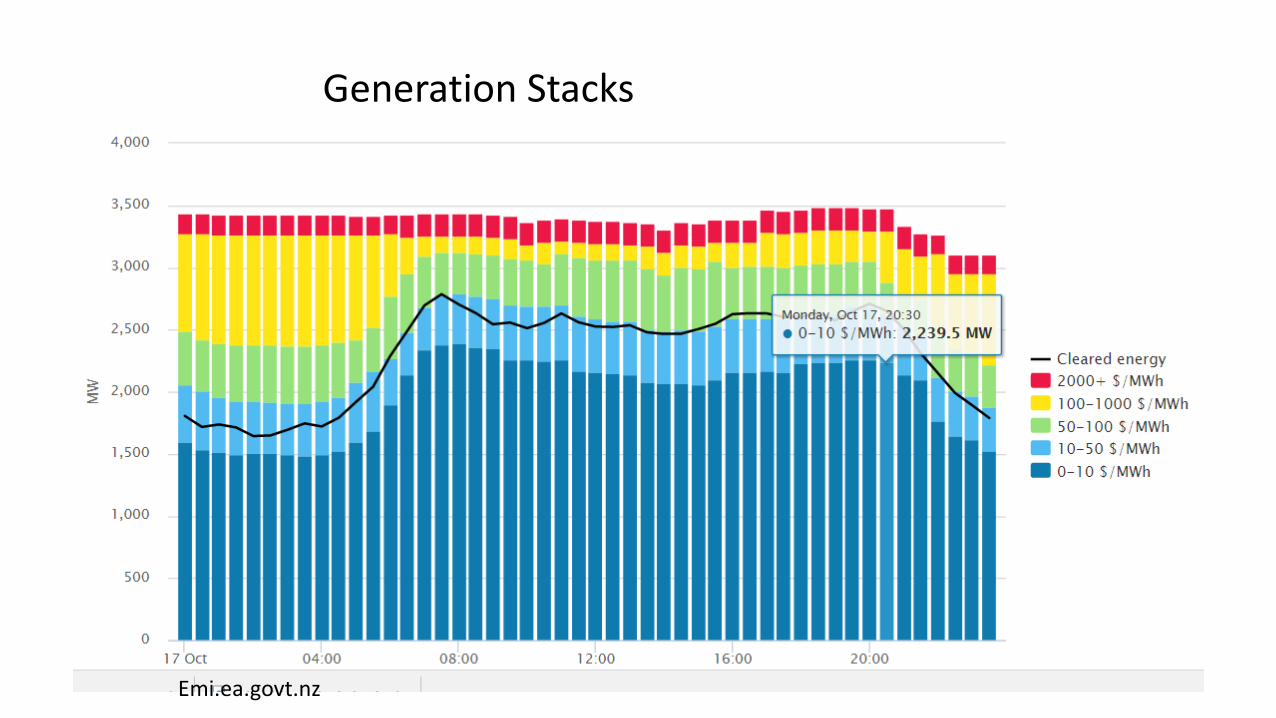
Generation Stacks
Emi.ea.govt.nz
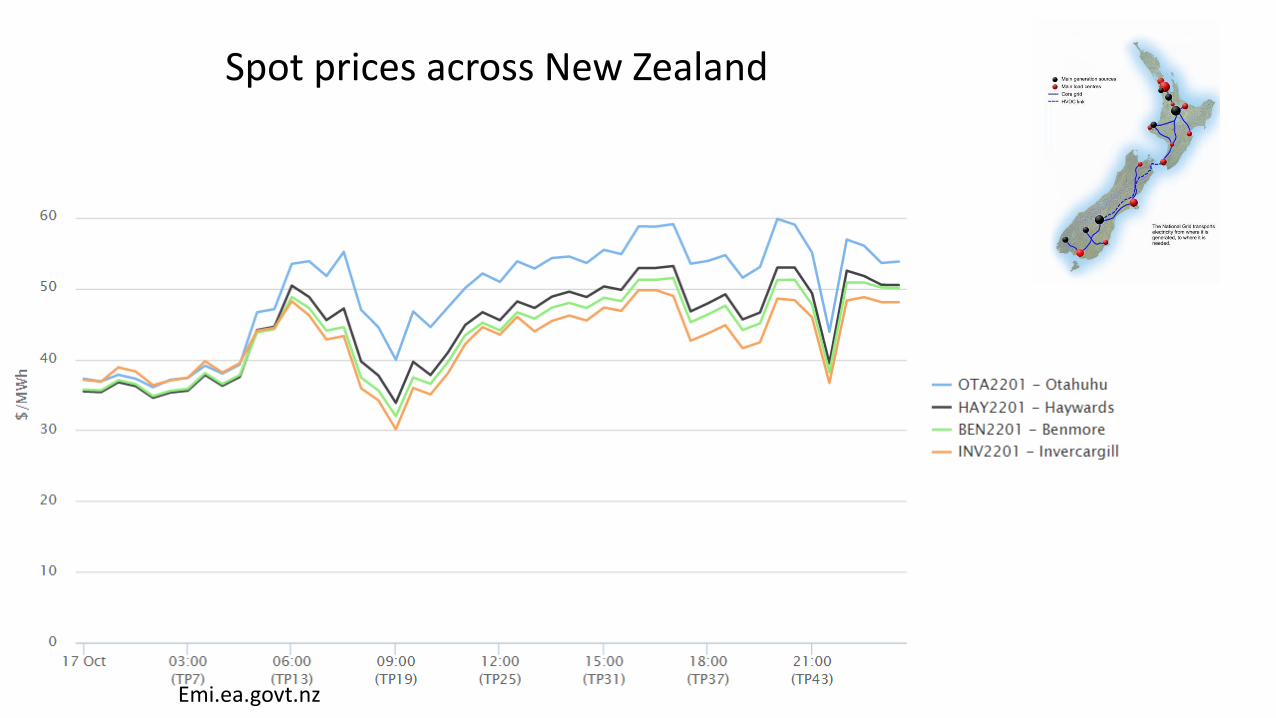
Spot prices across New Zealand
Emi.ea.govt.nz
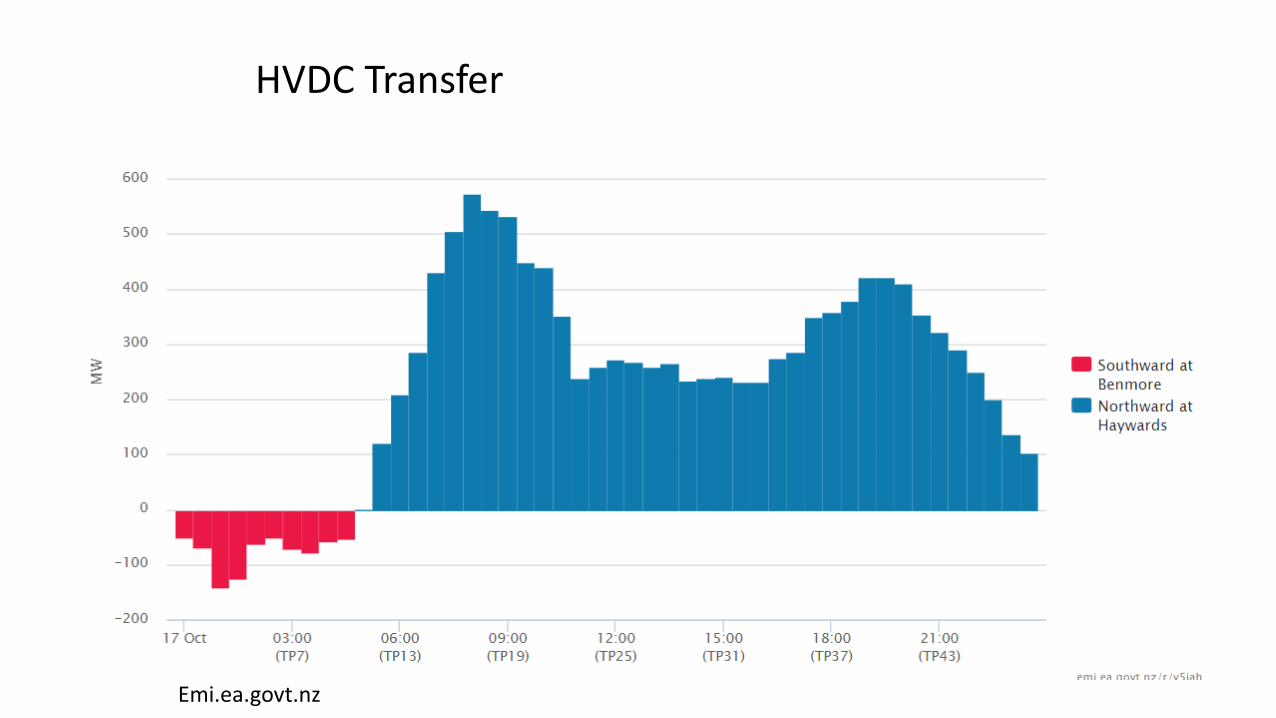
HVDC Transfer
Emi.ea.govt.nz
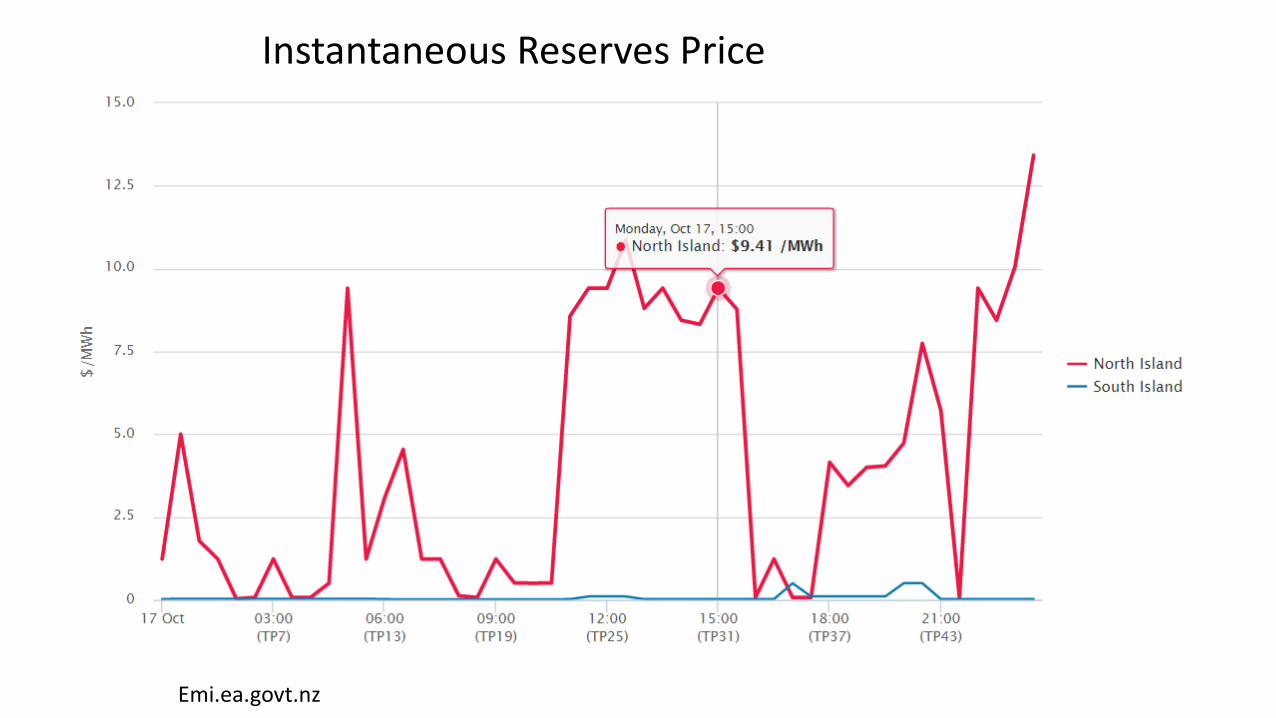
Instantaneous Reserves Price
Emi.ea.govt.nz
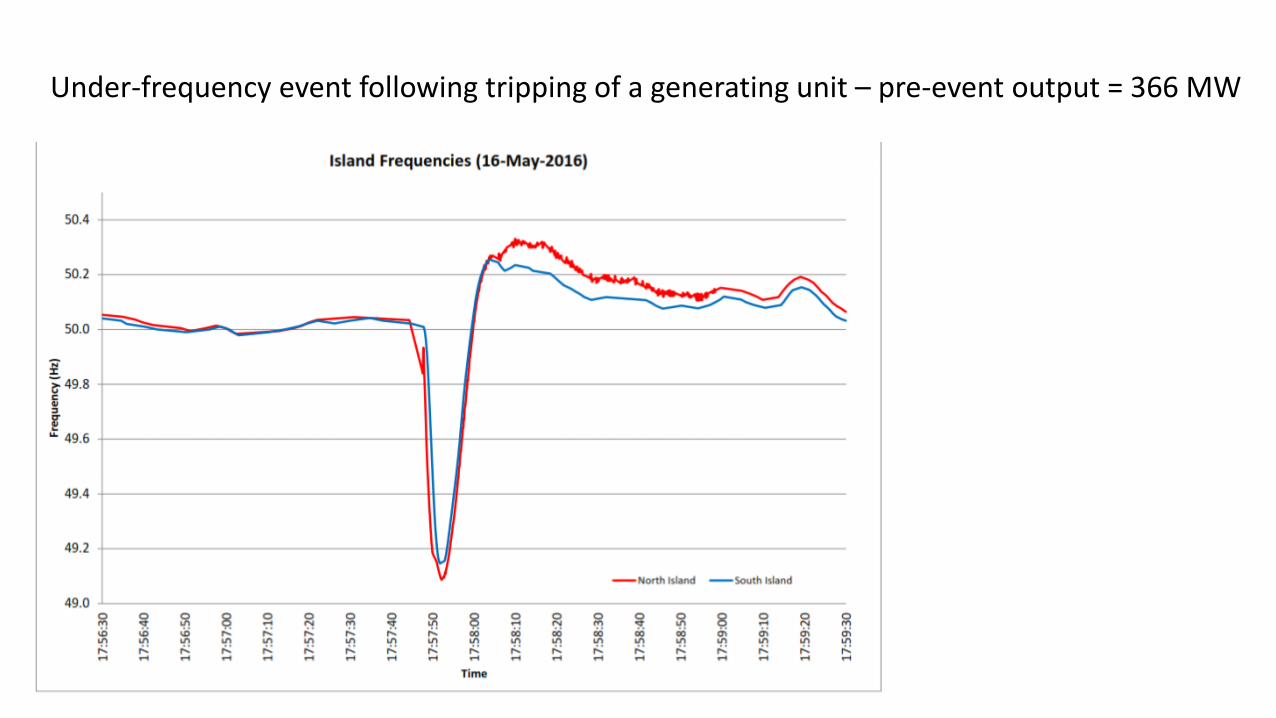
Under-frequency event following tripping of a generating unit – pre-event output = 366 MW
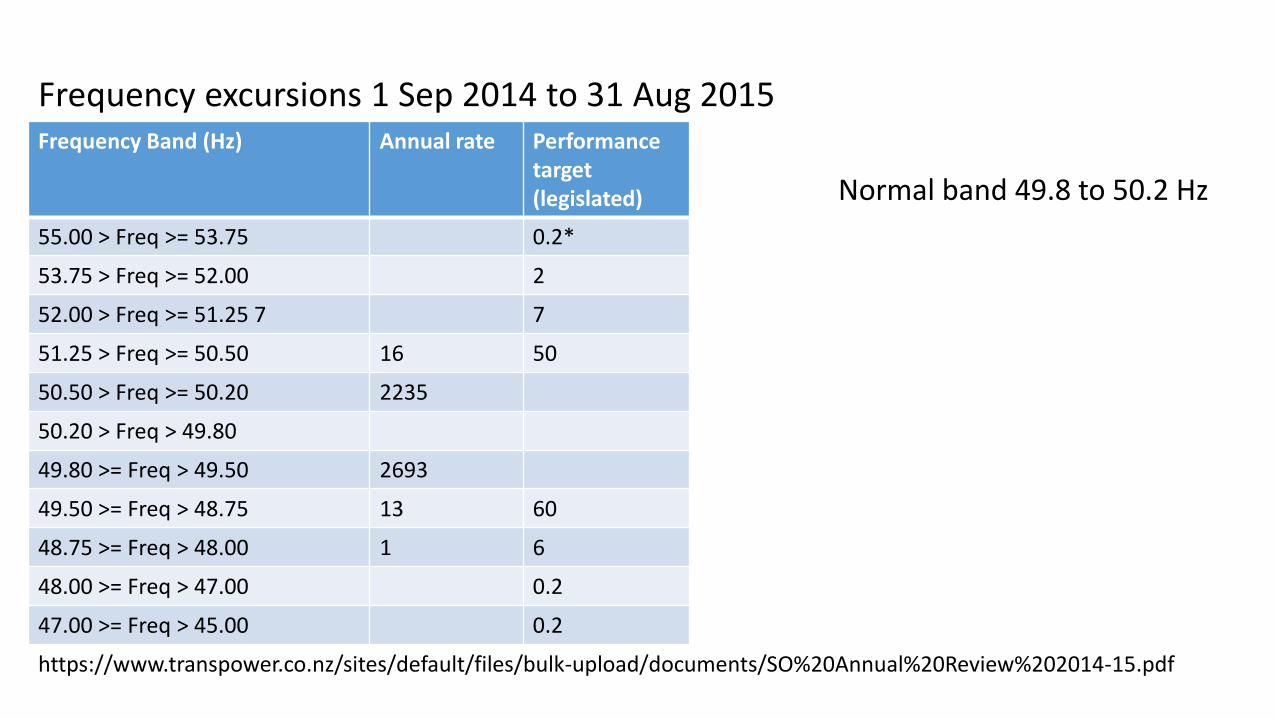
Frequency Band (Hz) Annual rate Performance target(legislated)
55.00 > Freq >= 53.75 0.2*
53.75 > Freq >= 52.00 2
52.00 > Freq >= 51.25 7 7
51.25 > Freq >= 50.50 16 50
50.50 > Freq >= 50.20 2235
50.20 > Freq > 49.80
49.80 >= Freq > 49.50 2693
49.50 >= Freq > 48.75 13 60
48.75 >= Freq > 48.00 1 6
48.00 >= Freq > 47.00 0.2
47.00 >= Freq > 45.00 0.2
Frequency excursions 1 Sep 2014 to 31 Aug 2015
https://www.transpower.co.nz/sites/default/files/bulk-upload/documents/SO%20Annual%20Review%202014-15.pdf
Normal band 49.8 to 50.2 Hz
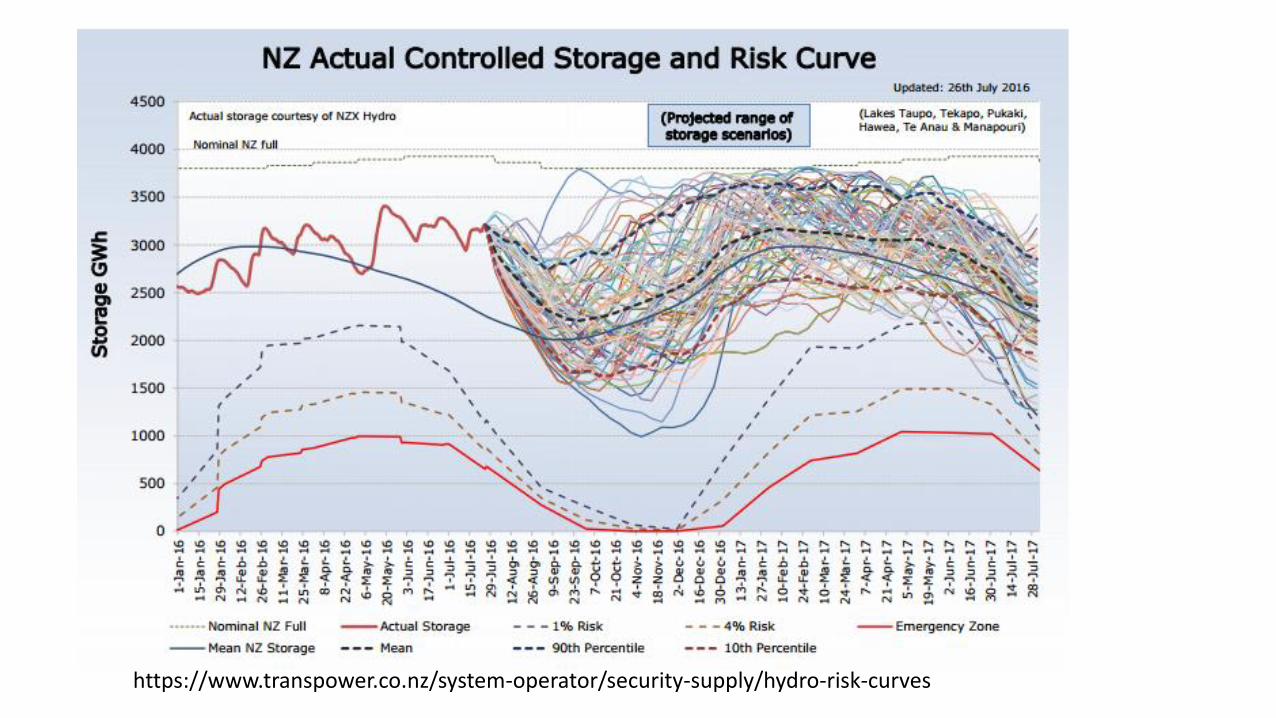
https://www.transpower.co.nz/system-operator/security-supply/hydro-risk-curves
Principles for regulation in New
Zealand
• Competition with contestable services
• Wholesale generation
• Retail
• Ancillary services
• Regulate non-contestable services
• Transmission
• Distribution
• Separation of lines and energy businesses
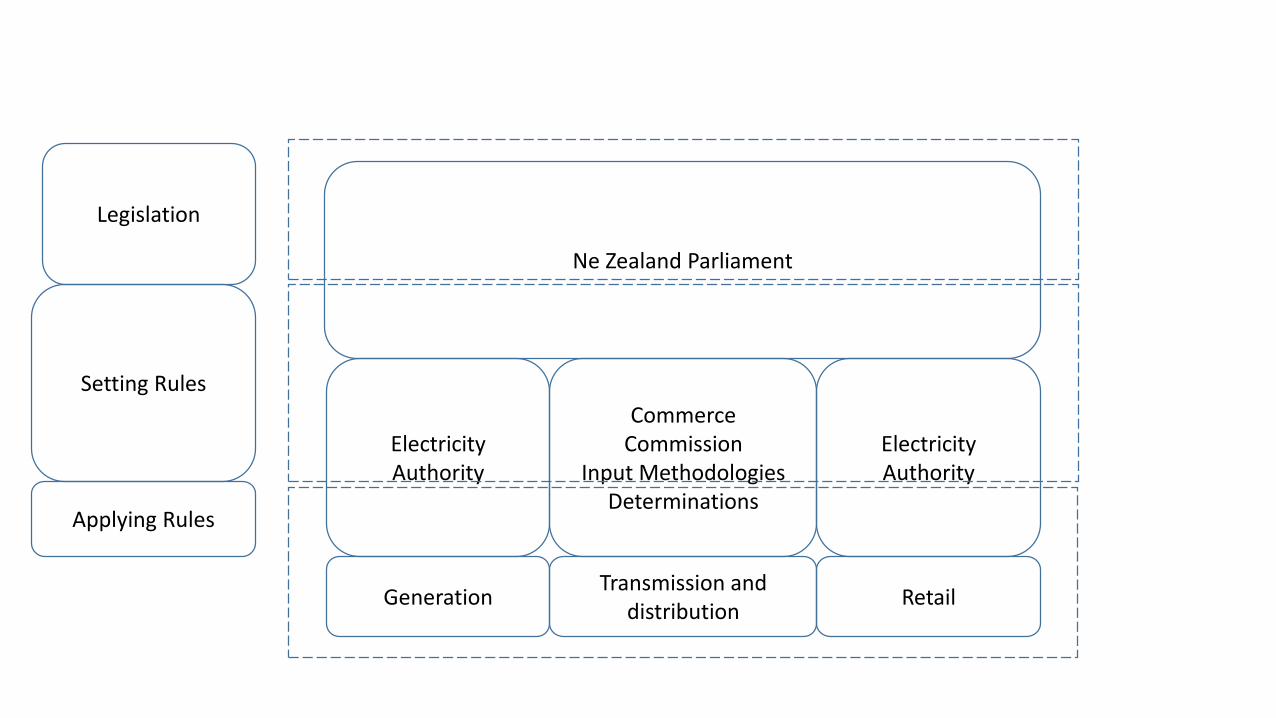
Ne Zealand Parliament
Commerce Commission
Input MethodologiesDeterminations
Electricity Authority
Electricity Authority
Generation RetailTransmission and
distribution
Setting Rules
Legislation
Applying Rules


