Integrating the North American Electronics Industry Supply Chain, The US-Mexico Distribution System and the Possible Benefits to the City of Phoenix. A report for the City of Phoenix July 2005 Prepared by RenéVillalobos, Ph.D. Melissa Restori Omar Ahumada Ricardo Vega Todd Lindquist Electronics Assembly Laboratory Arizona State University
Transcript
Integrating the North American Electronics Industry Supply Chain,
The US-Mexico Distribution System and the Possible Benefits to the City of Phoenix.
A report for the City of Phoenix
July 2005
Prepared by
René Villalobos, Ph.D.
Melissa Restori Omar Ahumada
Ricardo Vega Todd Lindquist
Electronics Assembly Laboratory Arizona State University
2
Executive Summary
This report presents the results of two different studies carried out by the Electronics Assembly Laboratory at Arizona State University for the City of Phoenix. The objective of the report is to present the reader with the a summary of the findings obtained from our work on this project.. The electronics industry represents an important component of the economy of Phoenix and the entire United States. For instance, according to NIST, the electronics industry accounts for nearly 11 percent of the U.S. GDP and 10 percent of all U.S. manufacturing jobs. Exports of U.S. electronics exceeded $164 billion in 2004 and total imports of electronics were more than $248 billion. From the Mexican perspective, for every ten dollars exported by Mexico, four dollars are generated by the electronics industry. To grasp the complementarily nature of the electronics industry in the USA and Mexico, it should be noted that more than half of the TV sets sold in the Unites States are assembled in Mexico (Blanco 1997), mostly in Northern Mexico. However, over 95 percent of the parts assembled into these sets are imported from or through the United States.
Nowadays, to survive the fierce global competition, a company has to excel in every aspect of
the life cycle of a product. Moreover, the products that are currently manufactured are closely tied with customer’s needs and wishes. This implies the necessity for close interaction and coordination throughout the supply chain. In this report, we explore the opportunities for the City of Phoenix in the emergence of a more integrated North American supply chain.
The report is divided in to two separate sections. The main objective of the study featured in
the first section is to unearth the benefits for Mexico and the US with the emergence of an integrated electronics industry, such as the establishment in the region of electronics packaging and design facilities. This study, entitled “Integrating the North American Electronics Industry Supply Chain” justifies the creation of an IC Packaging plant in North America (specifically in Mexico or the Phoenix Area) in an effort to improve the North American Electronics Industry Supply Chain, which was found to be lagging due to lack of integration. While the report is based on limited data, it shows that there are significant opportunities for Phoenix in a scenario where components for the consumption of the Mexican Electronics Assembly industrial base are produced in the region. A particularly attractive scenario is one where Phoenix would be home to development and incubator centers for companies producing for the newer, higher technology components. Under this concept, once the newly developed components are mature, their mass production would be transferred to Mexico.
The second section, “The US-Mexico Distribution System and the Possible Benefits to the
Phoenix Area” presents the results of a study which main objective is to assess the feasibility of Phoenix as a potential distribution point the US for products coming out Mexico. The central tenant is that Phoenix can be an important player in the overall distribution strategies for companies located in Mexico and whose final customer is in the US. In this study, we focused in two markets: the overall US population and the Mexican/Mexican-American population living in the USA. The study is based on a previous study that concluded that Reno, NV, Cincinnati, Ohio and St. Louis, Missouri were particularly good distribution points to reach the overall US population. One of the goals is to determine how Phoenix would fare against these cities, in particular with respect to the Hispanic and Mexican Market segments. The results show that Phoenix is in a very favorable position to service the Mexican and Mexican American populations in the USA and it is very competitive against Reno to service the Western portion of the overall US market.
3
Our research reveals that even though the distribution market has been based primarily in other cities closer to either the east or west coasts, Phoenix has the potential to operate as a major distribution center for Mexican-made products due to relatively low labor costs, above average infrastructure and most importantly a strategic location to serve the westernmost states of the United States. One of the challenges to make this proposition a reality is to have cost and time efficient land connections with the main manufacturing centers of Mexico, this includes having efficient rail and trucking trans-border transportation systems in place. In our opinion this is not the current situation since Phoenix is not part of the traditional US-Mexico cargo routes.
As part of the conclusions of the study, we recommend that the City of Phoenix aggressively
pursue the opportunities identified in this report. In particular, we propose that Phoenix enter a partnership with the leading semiconductor companies such as Intel, Freescale and On-Semiconductors to promote the partnership with the Mexican electronics assembly industry to entice companies to establish their operations in Phoenix under the business model identified. It is also recommended to reach out to ventures such as the newly announced Silicon Border Park in Baja California to explore joint venture with local companies in the area of electronics packaging.
Regarding the issue of Phoenix as a distribution center for Mexican companies it is
recommended that the city of Phoenix pursue partnerships with the Federal and State Governments in Mexico to officially make Phoenix the point of entry of products coming from Mexico into the US market. We also recommend that an additional study be undertaken to determine feasible strategies to develop efficient transportation links between Phoenix and the main manufacturing centers of Mexico. An immediate area of opportunity is to work with the Mexican ports as part of their overall strategy to service the US industry.
It is also recommended to expand and improve the current study, which was meant as an
exploration study.
4
1. Integrating the North American Electronics Industry Supply Chain
1.1 Problem Description 1.1.1 Overview 1.1.2 Current Deficiencies in the North American Electronics Supply Chain 1.1.3 Proposed Solution 1.1.4 Possible Benefits to the Phoenix Area 1.2 Background: Supply Chain Processes and Practices 1.2.1 Overview 1.3 Background: Electronics Industry in Mexico 1.3.1 Requirements for a Successful Semiconductor Plant Location 1.3.2 Recognized Weaknesses 1.3.3 Strengths and Current Initiatives 1.4 Description of a Packaging Plant in Mexico 1.4.1 Overview 1.4.2 Plant Characteristics, Costs and Cost Comparison within Mexico 1.4.4 Comparison with Malaysia 1.5 Analysis of Proposed Packaging Plant and Supply Chain 1.5.1 Overview 1.5.2 Assembly and Test Plant’s Competitivenes 1.5.3 Supply Chain’s Competitiveness 1.6 Potential Benefits for the City of Phoenix 1.6.1 Electronics Industry in Phoenix 1.6.2 Strengths and Opportunities 1.6.3 Possible Electronics Industry Project Extension 1.7 Conclusion
2. The US – Mexico Distribution System and the Possible Benefits to the Phoenix Area 2.1 Problem Description 2.1.1 Overview 2.1.2 Summary 2.1.3 Project Goal 2.2 Analysis of Dystribution System 2.2.1 Analysis 2.2.2 Product Description 2.2.3 Consumer Markets and Demand 2.2.4 Distribution Points 2.2.5 Plant Locations 2.2.6 Border Crossing 2.2.7 TransportaionModes 2.2.8 Analysis of Results 2.3 Potential Benefits for the City of Phoenix 2.3.1 Electronics Industry in Phoenix 2.3.2 Strengths and Opportunities 2.3.3 Possible Distribution Centers Project Extension 2.4 Phoenix and the Railroad Industry 2.4.1 Introduction to the Railroad industry 2.4.2 Relevance of Railroad Transportation to Phoenix 2.5 Conclusions
1. Integrating the North American Electronics Industry Supply Chain
1.1 Problem Description
1.1.1 Overview It has been noted in the past few years that the North American Electronics Industry relies
heavily on Asia for many of its vital processes. Research reveals the most common model for the supply chain of the electronics industry is one where North American companies conduct research, design and initial manufacturing in North American facilities. The manufacturing of components generally occurs in Asia and the final assembly is located all over the world to serve the local markets. However, recently China has developed into the main emergent market, with evolving manufacturing capabilities. This has changed the electronics’ supply chains dynamic, and increasing China’s share of the final product assembly (Figure 2).
The objective of the work that is summarized in the first section of this report is to study the
North American Electronics Industry’s current trade patterns and international business practices to identify areas of strategic opportunities for the city of Phoenix with a potential partnership with Mexico. We will focus our attention in the role that locations can play in the context of the North American supply chains in general. To justify the opportunities found, we will study the feasibility of a hypothetical integrated circuit packaging plant that would be potentially located either in Mexico or the Phoenix area, to achieve better supply chain integration.
1.1.2 Backround and Current Deficiencies of the North American Electronics Supply Chain
The electronics industry plays a vital role in the economy of many industrialized countries.
Although once the leader in electronics technology, the US has lost much of its competitiveness to Asia. Asia boasts cheap labor and tremendous government-sponsored financial incentives. Recent figures show that about three quarters of imports to Asia also originate in Asia, implying a strong and self-sufficient supply chain in the region. On the other hand, North America supplies only about 30% of its imports while depending on Asia for over 50%, a strong sign of North America’s lack of regional integration (See Figure 1). As it is implied by these figures, Asian companies tend to perform most processes within Asia. Only final assembly production usually takes place in different regions of the world to serve the local markets.
Figure 1. Commerce between different regions (Source: UN Comtrade) However, as we mentioned before, the most common model is for North American companies
to conduct all designing (of circuits, components and final products) and only the first part of semiconductor manufacturing (IC fabrication) in North American facilities. Furthermore, there is a growing trend as more and more companies either outsource IC fabrication to Asian foundries or relocate their plants (known as wafer FABs, or just FABs) to Asia (See Figure 2).
7
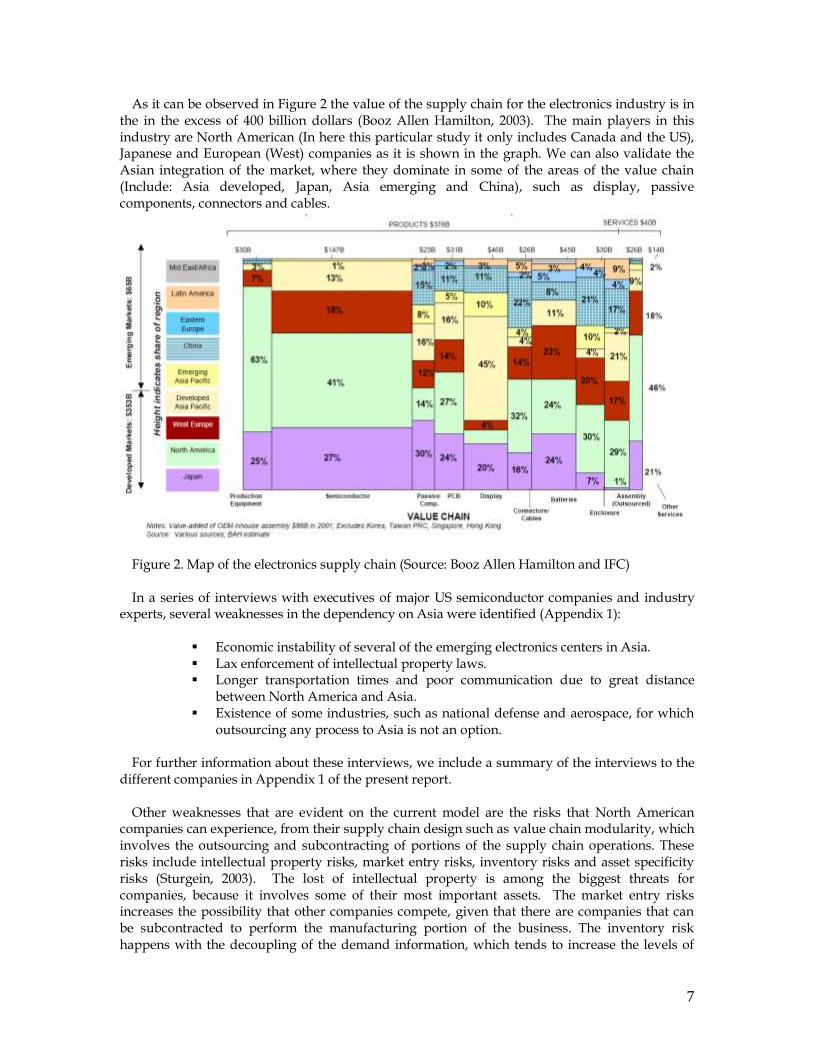
As it can be observed in Figure 2 the value of the supply chain for the electronics industry is in the in the excess of 400 billion dollars (Booz Allen Hamilton, 2003). The main players in this industry are North American (In here this particular study it only includes Canada and the US), Japanese and European (West) companies as it is shown in the graph. We can also validate the Asian integration of the market, where they dominate in some of the areas of the value chain (Include: Asia developed, Japan, Asia emerging and China), such as display, passive components, connectors and cables.
Figure 2. Map of the electronics supply chain (Source: Booz Allen Hamilton and IFC) In a series of interviews with executives of major US semiconductor companies and industry
experts, several weaknesses in the dependency on Asia were identified (Appendix 1):
Economic instability of several of the emerging electronics centers in Asia. Lax enforcement of intellectual property laws. Longer transportation times and poor communication due to great distance
between North America and Asia. Existence of some industries, such as national defense and aerospace, for which
outsourcing any process to Asia is not an option. For further information about these interviews, we include a summary of the interviews to the
different companies in Appendix 1 of the present report.
Other weaknesses that are evident on the current model are the risks that North American companies can experience, from their supply chain design such as value chain modularity, which involves the outsourcing and subcontracting of portions of the supply chain operations. These risks include intellectual property risks, market entry risks, inventory risks and asset specificity risks (Sturgein, 2003). The lost of intellectual property is among the biggest threats for companies, because it involves some of their most important assets. The market entry risks increases the possibility that other companies compete, given that there are companies that can be subcontracted to perform the manufacturing portion of the business. The inventory risk happens with the decoupling of the demand information, which tends to increase the levels of
8
inventory. The final risk comes from the dependence of big suppliers, which decreases the flexibility and bargaining power of manufacturers.
1.1.3 Electronics Industry in Phoenix It is a relatively simple task to state the case of the Electronics Industry in Arizona,
particularly in Phoenix. In a report entitled “Cyberstates” created by the American Electronics Association (AeA) in 2003 it was noted that more than half of Arizona’s exports (51%) fall in the high-tech electronics category, suggesting that Arizona’s electronics operations put it near the top echelons in the US, but also signifying a high dependency on this industry. The following figures further explain Arizona’s position in this important sector:
108,839 high-tech workers, ranked 18th nationwide. High-tech firms employ 58 of every 1,000 private sector workers in 2002,
ranked 17th nationwide. A high-tech payroll of $7.7 billion in 2001, ranked 18th nationwide. 5,814 high-tech establishments in 2001, ranked 18th nationwide.
Further more the Phoenix Metropolitan Area is the 12th largest cybercity in the nation. Phoenix
also boasts the 2nd largest semiconductor manufacturing employment in the nation. The entrepreneurial spirit and the technological capabilities are demonstrated by the City’s 2,300 high-tech establishments who employ 64 of every 1000 private sector workers (Cybercities, 2000).
With regards to the potential demand of electronic companies, our research reveals that 28% of
High Tech US Exports stay in North America and 9% of High Tech US Imports come in from Mexico or Canada and the rest comes from all over the world. On the other hand US High Tech Exports accounted for 171 billion dollars in 2003 (AeA, 2004).
As we will mention in the next section the electronics supply chain consists in many steps that
are performed by different companies to obtain the final finished products. One of the advantages of Phoenix is that many of these companies are currently established in the valley of the Sun, where we have semiconductor and packaging companies which represent around 40% of the total value added in the supply chain. However, most of the packaging companies are foreign companies, with the notable exception of Intel, who perform all of their packaging processes overseas. Even Intel does most of their packaging overseas, leaving in the Valley the R&D and the development of the production processes.
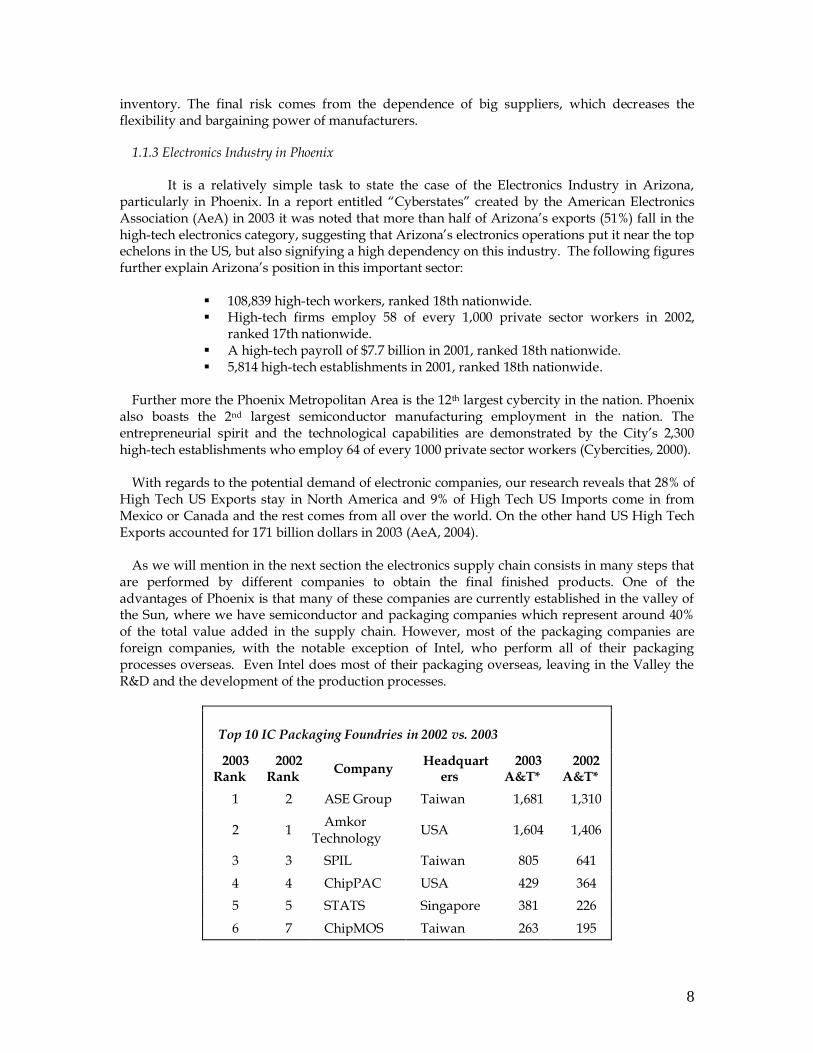
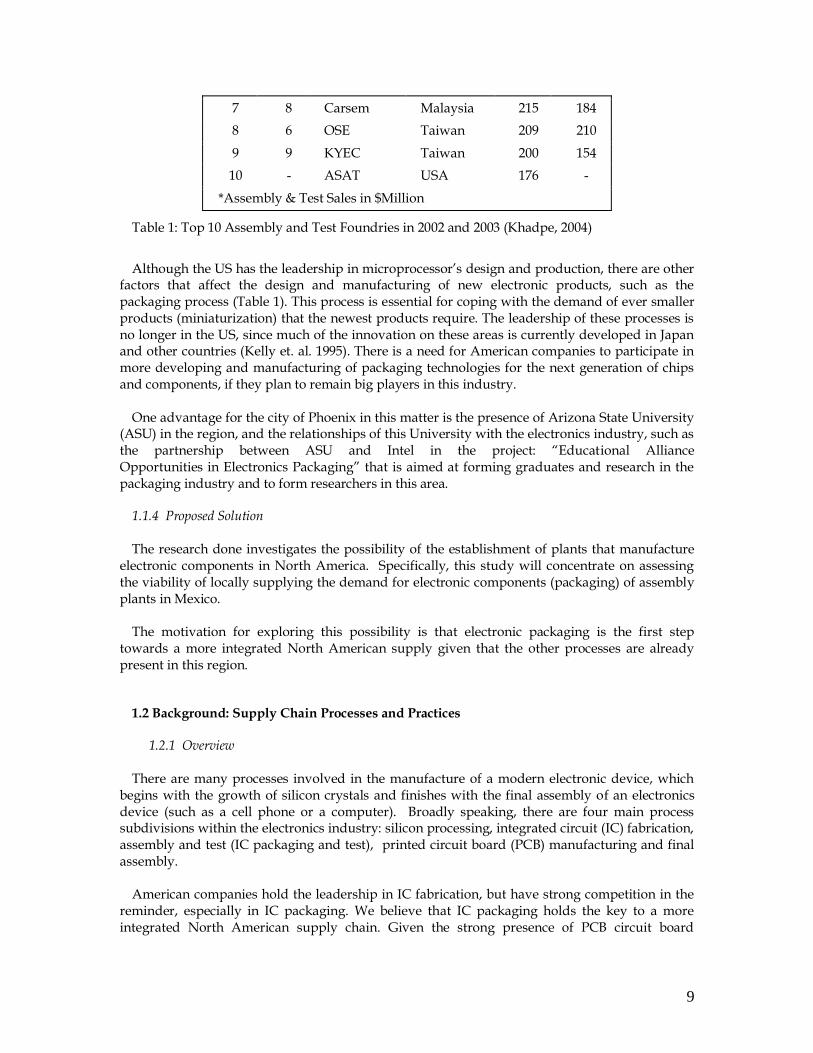
Top 10 IC Packaging Foundries in 2002 vs. 2003
2003 Rank
2002 Rank
Company Headquart
ers 2003
A&T* 2002
A&T*
1 2 ASE Group Taiwan 1,681 1,310
2 1 Amkor
Technology USA 1,604 1,406
3 3 SPIL Taiwan 805 641
4 4 ChipPAC USA 429 364
5 5 STATS Singapore 381 226
6 7 ChipMOS Taiwan 263 195
9
7 8 Carsem Malaysia 215 184
8 6 OSE Taiwan 209 210
9 9 KYEC Taiwan 200 154
10 - ASAT USA 176 -
*Assembly & Test Sales in $Million
Table 1: Top 10 Assembly and Test Foundries in 2002 and 2003 (Khadpe, 2004)
Although the US has the leadership in microprocessor’s design and production, there are other factors that affect the design and manufacturing of new electronic products, such as the packaging process (Table 1). This process is essential for coping with the demand of ever smaller products (miniaturization) that the newest products require. The leadership of these processes is no longer in the US, since much of the innovation on these areas is currently developed in Japan and other countries (Kelly et. al. 1995). There is a need for American companies to participate in more developing and manufacturing of packaging technologies for the next generation of chips and components, if they plan to remain big players in this industry.
One advantage for the city of Phoenix in this matter is the presence of Arizona State University
(ASU) in the region, and the relationships of this University with the electronics industry, such as the partnership between ASU and Intel in the project: “Educational Alliance Opportunities in Electronics Packaging” that is aimed at forming graduates and research in the packaging industry and to form researchers in this area.
1.1.4 Proposed Solution The research done investigates the possibility of the establishment of plants that manufacture
electronic components in North America. Specifically, this study will concentrate on assessing the viability of locally supplying the demand for electronic components (packaging) of assembly plants in Mexico.
The motivation for exploring this possibility is that electronic packaging is the first step
towards a more integrated North American supply given that the other processes are already present in this region.
1.2 Background: Supply Chain Processes and Practices 1.2.1 Overview
There are many processes involved in the manufacture of a modern electronic device, which
begins with the growth of silicon crystals and finishes with the final assembly of an electronics device (such as a cell phone or a computer). Broadly speaking, there are four main process subdivisions within the electronics industry: silicon processing, integrated circuit (IC) fabrication, assembly and test (IC packaging and test), printed circuit board (PCB) manufacturing and final assembly.
American companies hold the leadership in IC fabrication, but have strong competition in the
reminder, especially in IC packaging. We believe that IC packaging holds the key to a more integrated North American supply chain. Given the strong presence of PCB circuit board
10
assembly and final assembly in the region, and combined with the leadership in IC fabrication. There could be a more robust and self-reliable electronics industry in the North American region.
There are several reasons for the migration of the semiconductor electronics industry to Asia.
The first and most obvious is the lower cost of production that Asia offers. Boasting labor costs roughly 16 times cheaper than in the US (and 4 times cheaper than in Mexico) and lower utility costs, Asia has become a logical choice for building a FAB. Other influential factors are the highly competitive government financial incentives. It is not uncommon for companies opening FABs in Asia to receive a 15-year tax holiday. In addition, as Asia quickly becomes the largest consumer market for electronic products, North American companies feel pressured to establish a local presence in order to compete in the Asian market.
On top of these competitive factors there are other non-competitive factors that entice foreign
companies to invest in facilities in Asia. One particular case is the Chinese, where the government has instituted a value-added tax (VAT) rate of 17% on all imported integrated circuits (ICs) to the Chinese market, which started in the year 2000. This taxing policy gives a dramatic cost advantage to foundries located in china over comparable operation based elsewhere with respect to ICs sold in China (Howell et. al., 2003).
Despite this general tendency, wafer fabrication is still competitive in the US and there have
been cases of assembly and test plants operating successfully outside of Asia, one of these companies is currently operating in Mexicali, Mexico (Skyworks Solutions) and in other countries of Latin America such as Intel’s plant in Costa Rica.
1.3 Background: Electronics Industry in Mexico 1.3.1 Requirements for a Successful Semiconductor Plant Location
In the following sections, Mexico’s feasibility as a site for assembly and test will be addressed.
However, before discussing Mexico’s attributes, it is important to determine the characteristics that are important in selecting a location for an assembly and test plant. The cost factor is perhaps the most obvious of all, and many times, the single most important factor of all. However, there are other factors that are also very important in order to build a competitive plant. Ease of travel is essential for quick time-to-market and for reduced transportation times and costs. Likewise, a location that lacks enough skilled labor to support the plant is not feasible. Lastly, the distance to the customer is important for two main reasons. First, being close allows the company to provide better customer service (low lead times, quicker response to demand, etc…). Second, being close to the customer allows a design team to better understand the needs and likes of a particular geographic area.
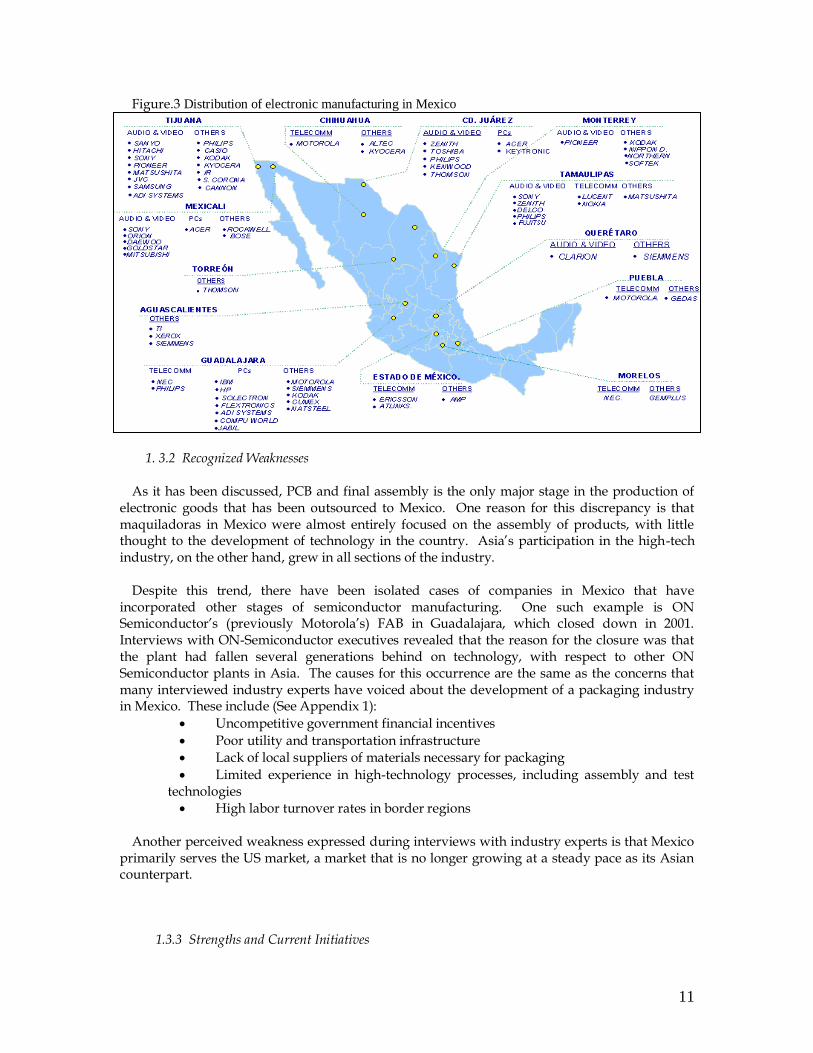
In Figure 3 we provide the geographical distribution of companies in the electronics industry.
The overwhelmingly majority of these companies are in the area of electronics assembly. These companies form clusters around border cities such as Cd. Juarez, Tijuana and Mexicali. Other clusters are formed around big markets such as the cities of Guadalajara, Monterrey and Mexico City.
Another benefit of considering Mexico as the site of the potential plant is the traditional
interdependence between the Mexican and American electronic industry. As it can be shown in Appendix 4 Mexico is the biggest customer of Arizona’s electronic industry. So the integration of the North American supply chain will bring tangible benefits for the companies located in Arizona.
11
Figure.3 Distribution of electronic manufacturing in Mexico
1. 3.2 Recognized Weaknesses As it has been discussed, PCB and final assembly is the only major stage in the production of
electronic goods that has been outsourced to Mexico. One reason for this discrepancy is that maquiladoras in Mexico were almost entirely focused on the assembly of products, with little thought to the development of technology in the country. Asia’s participation in the high-tech industry, on the other hand, grew in all sections of the industry.
Despite this trend, there have been isolated cases of companies in Mexico that have
incorporated other stages of semiconductor manufacturing. One such example is ON Semiconductor’s (previously Motorola’s) FAB in Guadalajara, which closed down in 2001. Interviews with ON-Semiconductor executives revealed that the reason for the closure was that the plant had fallen several generations behind on technology, with respect to other ON Semiconductor plants in Asia. The causes for this occurrence are the same as the concerns that many interviewed industry experts have voiced about the development of a packaging industry in Mexico. These include (See Appendix 1):
Uncompetitive government financial incentives
Poor utility and transportation infrastructure
Lack of local suppliers of materials necessary for packaging
Limited experience in high-technology processes, including assembly and test technologies
High labor turnover rates in border regions
Another perceived weakness expressed during interviews with industry experts is that Mexico primarily serves the US market, a market that is no longer growing at a steady pace as its Asian counterpart.
1.3.3 Strengths and Current Initiatives
12
An integrated North American supply chain using Mexico for assembly and test has the
potential of offering several advantages over the popular Asia-centric approach. For example, it could offer faster time-to-market for new products. The rationale behind this advantage is that it is not easy to transplant ideas developed in one part of the world to another. With the technical expertise available in North America, there is no question that technological advancements will continue to be developed in this part of the world. It is also obvious that much time and money are spent on the introduction of new products. Avoiding a language barrier and having the opportunity to quickly (and cheaply) meet in person are great advantages.
There are also other reasons why companies may want an alternative to manufacturing in Asia.
Some companies, like Intel, are concerned about concentrating all production in a single part of the world, especially in a region so far removed from the headquarters and with several unstable governments. Mexico, on the other hand, is a long-established dependable business partner to American companies.
A plan for an industrial park that will “represent the entire semiconductor supply chain” is
currently being considered on the Mexican side of the California border (in Mexicali, Baja California), and is known as Silicon Border. This “virtually self-contained city for IC design, manufacture and device integration” would consist of wafer FABs, packaging and testing facilities, materials manufacturers, equipment vendors, photomask shops and raw wafer manufacturing plants. The park is expected to encompass 10,000 acres and boasts:
Abundant natural resources – water and clean power
Advanced utility and access infrastructure
Specialized treatment, recycling, security and fire protection systems
On-site educational facilities
University-sponsored technical curricula
In addition, the Mexican federal government is offering highly competitive tax breaks (10-year tax holidays to semiconductor companies, the equivalent of up to $2 billion).
1.4 Description of a Packaging Plant in Mexico
We need to determine the competitiveness and the feasibility of locating and installing an
assembly and testing (Packaging) facility in Mexico. To this aim, we designed and configured a hypothetical facility, which would fabricate the type of chips with high demand in the Mexican and American markets. Another condition for this facility would require being competitive with its Asian counterparts. We describe in the next sections the development of this potential facility and its advantages and disadvantages to compete in the current electronics environment.
1.4.1 Overview
The key to the competitiveness of a packaging plant outside of Asia is to avoid directly
competing in Asia’s core competencies. Asia is traditionally associated with excellence in mass production of standardized goods. Asia has perfected these kinds of assembly lines and relies on both technological know-how and low costs, assets that are almost impossible to compete against (White, 2004). Thus, it was decided that the plant in Mexico would not compete with the high-volume IC packaging and test plants in Asia. Instead, the plant will concentrate on package types that fall into a low-volume, high-mix manufacturing design.
13
The two types of packages that are candidates for manufacture in the hypothetical plant are new packages (very high technology) or highly specialized packages with low demand. The production line is quite simple since it is based on the assumption of no product mix (that is, only one packaging type will be made, leaving the possibility for multiple types of components).
Much research went into trying to estimate the selling price of the components being made in the plant, but as it has been discussed, the type of component, and not the package type, dictates the value of the product. Thus, much like the cost of the integrated circuit in the raw materials category, defining a cost (and thus the revenue stream for the company) must be held off until future studies determine the complexity of the integrated circuit to be encapsulated in the assembly and test plant.
The approach we followed to avoid providing a detail demand and profit analysis, was to compare among the different potential locations in Mexico, and select the best among them. Later we compared the best plant located in Mexico against one located in Malaysia. For the purpose of our comparison we included the costs of installing an operating a plant such as capital costs and monthly operational costs.
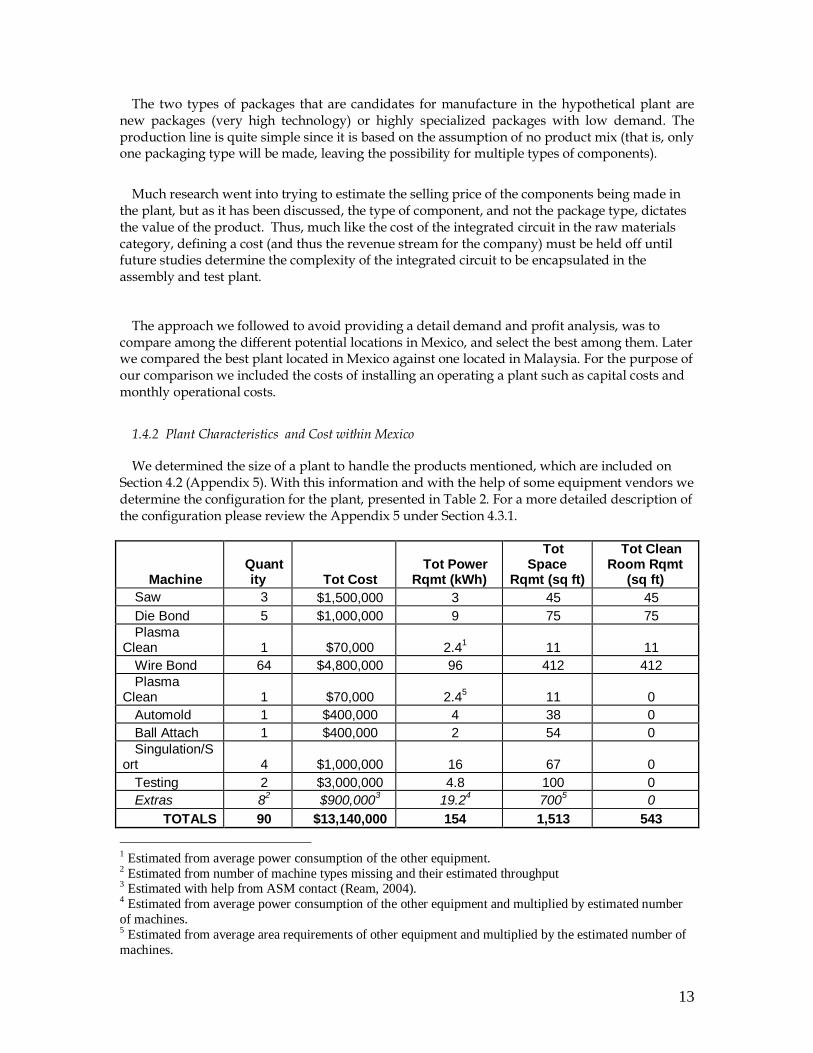
1.4.2 Plant Characteristics and Cost within Mexico
We determined the size of a plant to handle the products mentioned, which are included on Section 4.2 (Appendix 5). With this information and with the help of some equipment vendors we determine the configuration for the plant, presented in Table 2. For a more detailed description of the configuration please review the Appendix 5 under Section 4.3.1.
Machine Quantity Tot Cost
Tot Power Rqmt (kWh)
Tot Space
Rqmt (sq ft)
Tot Clean Room Rqmt
(sq ft)
Saw 3 $1,500,000 3 45 45
Die Bond 5 $1,000,000 9 75 75
Plasma Clean 1 $70,000 2.4
1 11 11
Wire Bond 64 $4,800,000 96 412 412
Plasma Clean 1 $70,000 2.4
5 11 0
Automold 1 $400,000 4 38 0
Ball Attach 1 $400,000 2 54 0
Singulation/Sort 4 $1,000,000 16 67 0
Testing 2 $3,000,000 4.8 100 0
Extras 82 $900,000
3 19.2
4 700
5 0
TOTALS 90 $13,140,000 154 1,513 543
1 Estimated from average power consumption of the other equipment. 2 Estimated from number of machine types missing and their estimated throughput 3 Estimated with help from ASM contact (Ream, 2004). 4 Estimated from average power consumption of the other equipment and multiplied by estimated number
of machines. 5 Estimated from average area requirements of other equipment and multiplied by the estimated number of
machines.
14
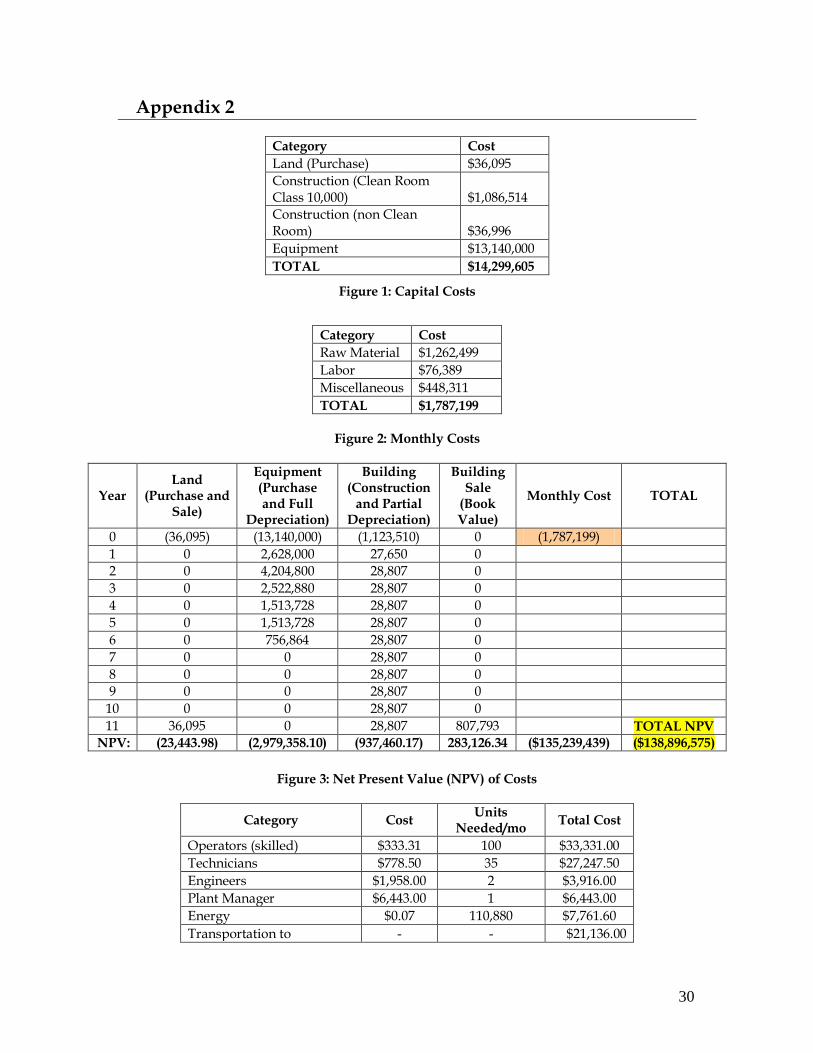
Table 2. Equipment totals for the plant Capital Cost With the information of the equipment required we calculated the two main components for
the capital investment, the equipment costs and the building. We determined the size of the building according the size of the equipments and the space necessary for the efficient flow of the operations. We calculated both of these costs assuming the size and the equipment requirements would be the same for the three sites in Mexico. In Appendix 2 we present the complete list of building costs, such as land, construction and others (See Figure 1).
Monthly Cost The costs we considered in this part of the study were: labor, materials, transportation and
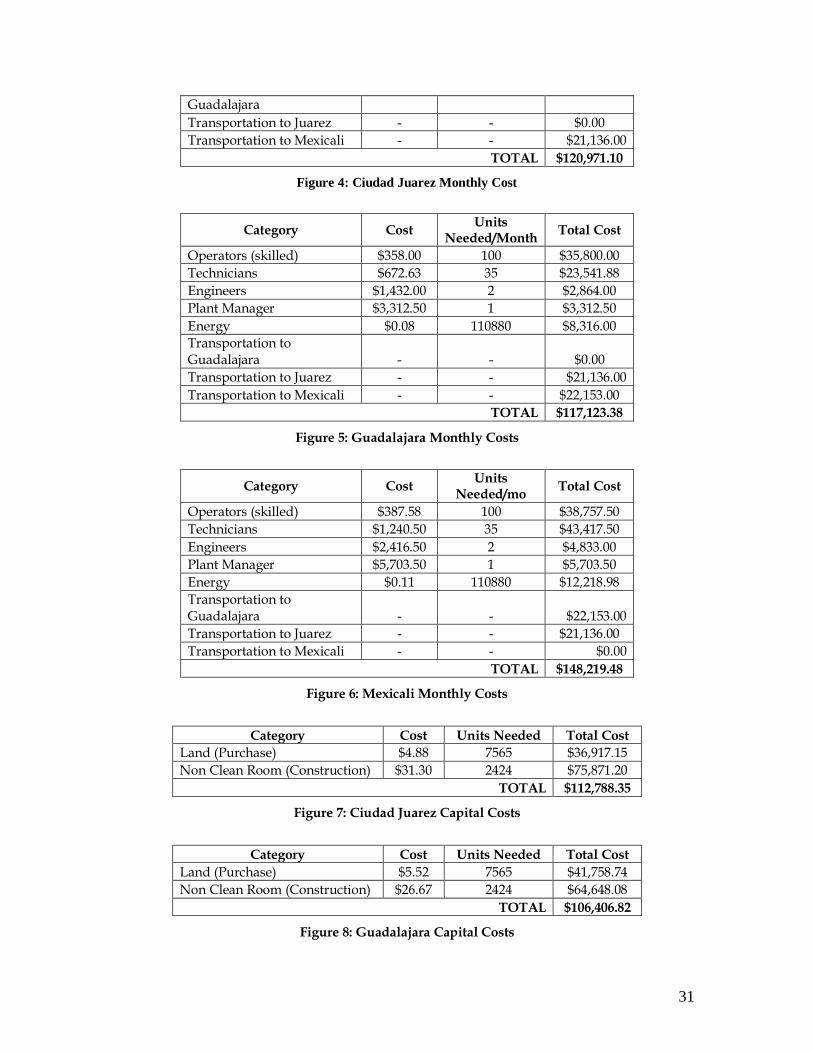
energy (See Figure 2 in Appendix 2). The operating costs were the main difference between the Mexican locations that we compared. The details of those costs are presented in the Figures annexed in Figure 4, 5 and 6 (Appendix 2).
The economic analysis for the project presented in Figure 3 of Appendix 2 presents the results of the net present value analysis of the costs associated with building and operating the plant for ten years. It is also assumed that the land can be sold at the end of the ten-year period for the same amount of purchase. Note that the monthly costs are not represented as cash flows to facilitate viewing. From the table, the total net present value of the cost of building and operating the plant for ten years is $138,896,575.
A more realistic example would include costs for upgrading equipment and expansion of the building, but that is beyond the scope of this analysis. The purpose is to present a rough estimate of the business venture.
1.4.2 Cost Comparison within Mexico and with Malaysia
Mexican Cities
The cities that were considered for the analysis are Mexicali, Ciudad Juarez and Guadalajara.
These locations were chosen because they are among the cities with the highest concentration of electronics companies. In addition, it is assumed that infrastructure and skilled labor availability are best suited in these areas for the electronics industry. Mexicali was chosen over Tijuana (which had a much greater concentration of electronics companies) because of the possible semiconductor industrial park (Silicon Border) planned for 2006.
Figures 4, 5 and 6 in Appendix 2 present data on the costs where there is a difference between
the cities. Because so many factors are involved in calculating transportation costs, many assumptions had to be made. These are:
Customers are equally distributed between the three cities. That is, the demand in each city, D, is 33.3% of the total monthly output of the plant (14,400,000 BGAs), or D = 4,666,667 BGAs per month.
Quantity per shipment, S, is 3000 BGAs and weighs 2.5 kg6
There will be D/S = 1,556 shipments per month per city.
6 The estimate is based on the shipping description of a smaller BGA by Fairchild Semiconductor. The
weight of the components were multiplied by 25 (the size factor between the Fairchild BGA and the
proposed BGA for this study. The weight of the reel containing the BGAs was multiplied by 5 (an
estimated size factor for the new reel).(Farchild Semiconductor, 2004)
15
Intercity transportation cost is negligible
Box weighs 2.5 kg. Two capital costs also differed between the three cities. These costs for each of the three cities
are presented in Figures 7, 8 and 9 in Appendix 2. The two other capital costs (equipment and clean room construction) were omitted since they are assumed to be equal in all cities within Mexico.
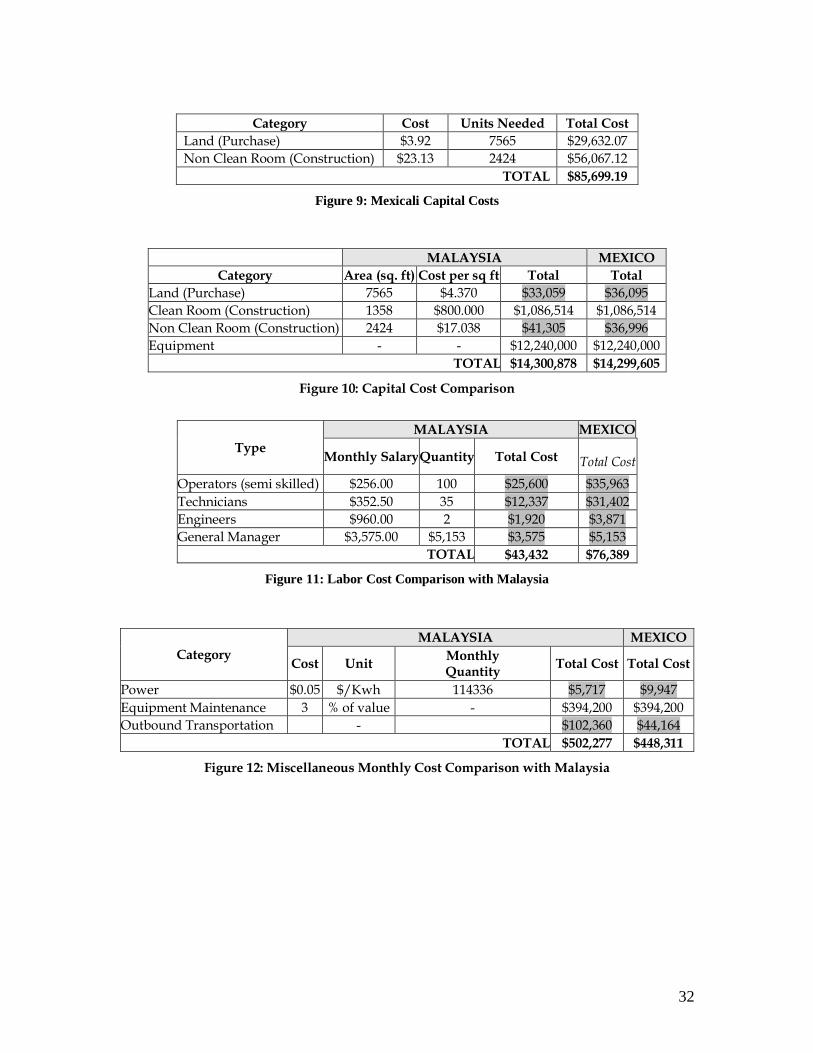
Malaysia In order to determine the competitiveness of the hypothetical plant in Mexico, it was
determined to analyze what the costs of this plant would be in Asia. Malaysia was because it is already home to several assembly and test plants (including Amkor, ASE and Fairchild Semiconductor). It should be noted, however, that costs for other countries in Asia could be very different. For example, South Korea is expected to have much higher costs while China is expected to offer lower costs.
Figures 10, 11 and 12 in Appendix 2 present the costs for the hypothetical plant in Asia
compared to those in Mexico. The figures show that two of the main reasons companies chose to operate in Asia are correct (lower labor and utility cost). However, the figures also support the idea that to serve the North American (namely Mexican) demand for components, the transportation costs cannot be ignored. It should be noted that, not surprisingly, capital costs are practically equivalent in both countries.
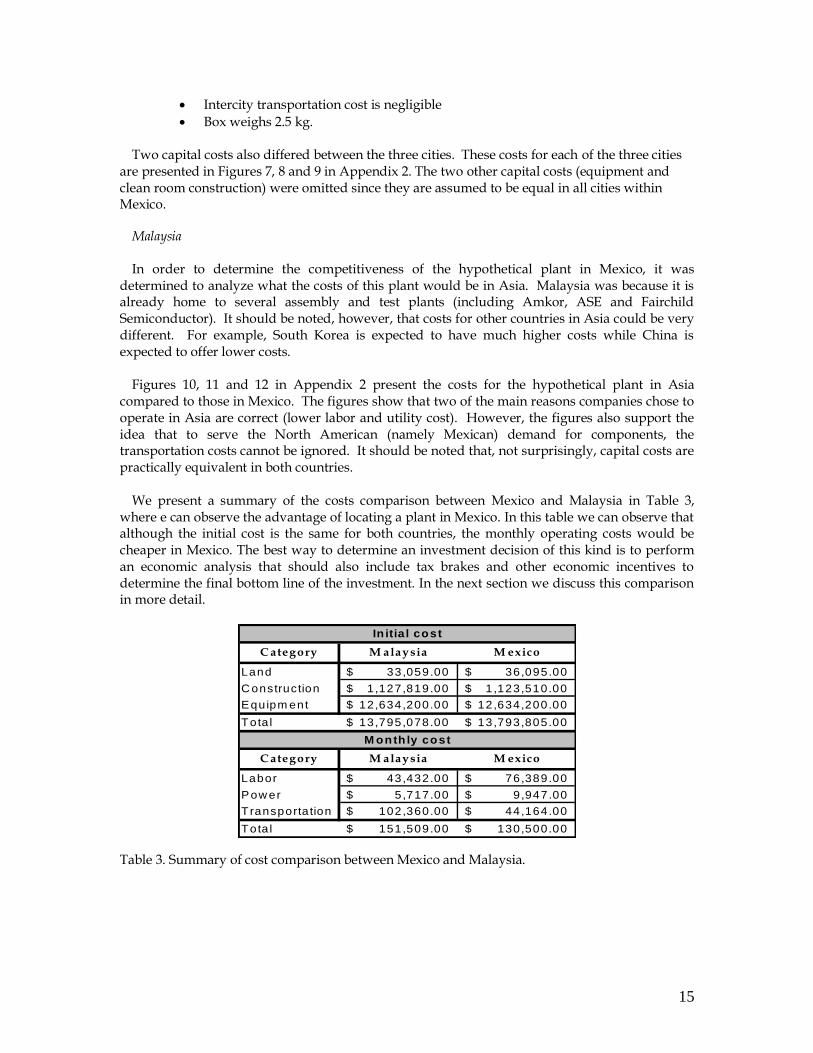
We present a summary of the costs comparison between Mexico and Malaysia in Table 3,
where e can observe the advantage of locating a plant in Mexico. In this table we can observe that although the initial cost is the same for both countries, the monthly operating costs would be cheaper in Mexico. The best way to determine an investment decision of this kind is to perform an economic analysis that should also include tax brakes and other economic incentives to determine the final bottom line of the investment. In the next section we discuss this comparison in more detail.
Table 3. Summary of cost comparison between Mexico and Malaysia.
C ategory M alaysia M exico
Land 33,059.00$ 36,095.00$
C onstruction 1,127,819.00$ 1 ,123,510.00$
Equipm ent 12,634,200.00$ 12,634,200.00$
Tota l 13,795,078.00$ 13,793,805.00$
C ategory M alaysia M exico
Labor 43,432.00$ 76,389.00$
Pow er 5,717.00$ 9 ,947.00$
T ransporta tion 102,360.00$ 44,164.00$
Tota l 151,509.00$ 130,500.00$
In itia l cost
M onth ly cost
16
1.5 Analysis of Proposed Packaging Plant and Supply Chain
1.5.1 Assembly and Test Plant’s Competitivenes It was hinted in the previous section that Mexico’s lower transportation costs more than made
up for the higher costs of labor and energy. The reader may remember in previous sections that many industry experts did not believe transportation would be a factor in the costs of an assembly and test plant. The reason for their conviction is that they were not considering serving only the Mexican market. Obviously, if both Asian and Mexican markets would have been served, Mexico’s outbound transportation costs would have increased considerably. However, the plant under consideration is one that would specialize in serving North American markets and thus, based on costs of operation, transportation and capital; it is economically preferable to locate such an assembly and test plant in Mexico.
Despite the favorable cost analysis, it is perhaps most important to address the need for
financial incentives. As was mentioned before, one of the primary concerns voiced by industry experts during interviews was the historically poor level of financial incentives offered by the Mexican government. ON Semiconductor even marks this factor as the principle reason for shutting down its plant in Guadalajara. Intel representatives also made it very clear that the main reason its newest assembly and test plant was awarded to Costa Rica instead of Guadalajara was the financial incentives and other government initiatives. Although still in the planning stages, Silicon Border advertises highly competitive incentives such as a 10-year tax holiday for companies within this industrial park. This offering is at least a good sign that the Mexican government is becoming more aggressive in its campaign to boost the Mexican electronics industry. However, until these offerings are official, there can be little hope for further growth of the semiconductor industry in Mexico.
1.5.2 Supply Chain’s Competitiveness It should be stressed that the plant-related costs do not form a complete basis for judging the
competitiveness of the proposed design for the integration of the North American electronics industry supply chain. It is necessary to look at the effects on the entire chain before drawing such conclusions. Because of the emphasis on the plant itself in the previous section, the reader may have forgotten that the principle purpose of an IC packaging plant in Mexico is not for its own profits but for the improvement of the entire North American semiconductor industry supply chain. This section will directly address the impact of the proposed plant on the entire supply chain.
One great benefit of the proposed plan is in the reduction of raw material lead times for the
Mexican electronic assembly industry. It has already been discussed that low travel time for the packages directly reduces the in-transit inventory costs and improves customer relations. However, there are also other benefits for the customers (final assemblers): low lead times allow for quick time-to-market for new products, a great advantage in today’s fast-paced consumer electronics market where the company that introduces a new product the quickest is the company that controls the market share. Although the exact effect of the lead times on the time-to-market of new products is hard to calculate and would depend on the product, there is an obvious and direct relationship between low lead times for raw materials and quicker time-to-market.
17
1.6 Potential Benefits for the City of Phoenix 1.6.1 Strengths and Opportunities Arizona has many strong points when it comes to its Electronics Industry. In particular, the
semiconductor industry has seen a fair amount of success in Phoenix. From packaging to manufacturing and testing design, the nation’s third leading state regarding semiconductor production (AeA) is still a feasible location for high-tech, low-volume operations.
One specific strength of Phoenix as a semiconductor design location is the partnership that is
under development between Arizona State University and leading semiconductor fabricator Intel Corp. Through an innovative collaboration between these two parties, students will be able to learn packaging principles and analysis tools through direct interaction with experts from Intel Corporation and renowned ASU faculty.
The City of Phoenix has an opportunity to further develop the existing high tech
manufacturing cluster in the area, specifically by strategically complementing its semiconductor industry. As was mentioned throughout the whole section, it is important to steer clear of Asia’s core competences; this report recommends that Phoenix focuses on the design of manufacturing and packaging operations for high-tech, low-volume operations that can later be sent to Mexico for larger scale production.
1.6.2 Possible Electronics Industry Project Extension This report represents a preliminary assessment of the viability of establishing IC packaging in
Mexico. Time constraints limited the amount of information that could be received and included in the report to estimate current lag times for components and the demand for different package types. Another limitation is that the companies that participated in the surveys did not have any information based on package type (only on component type). The following are some recommended research topics to expand the present study:
Research other business practices in electronic industry Overview of the Electronic Industry in Arizona Other areas of opportunity for Phoenix Obtain better information about the components demand Obtain better information about transportation costs Research the economic benefits of having a better integrated supply chain Outline of a potential packaging company in Phoenix focused for high tech components Compare a plant based in Phoenix with one based in other parts of the world
1.7 Conclusions
From the information we gathered from different sources such as academic journals, trade magazines and interviews with key stakeholders, we can conclude that the City of Phoenix has the opportunity of improving its standing in the electronic industry. We base this conclusion of the strong presence of this industry in Arizona, the advantages we presented in Section 1.6 and the information provided by the stakeholders. However, these opportunities should be accompanied with a better strategic plan and appropriate incentives. As we mentioned before the biggest growth in this industry has occurred on those countries and regions that encourage and nurture the development of these companies.
18
We also showed that there is a big room for improvement in the integration of the North American supply chain. This integration should benefit the three countries under the NAFTA agreement due to their interdependent industries and their individual capabilities that should make their electronics supply chain very competitive.
Based on the data presented in Section 1.4 we conclude that it is viable for an assembly and test plant to be located in Mexico to serve the demand of Mexican plants. In fact, the information presented in Appendix 5 has given evidence to support that the plant and the resulting supply chain would be competitive against the current Asia-centric supply chain, as long as the Mexican government offers financial incentives similar to those under consideration for the Silicon Border project (see Section 3.5 in Appendix 5). This type of investment could be the first step towards a more integrated supply chain between the US and Mexico, and more opportunities and strategic partnerships such as this one should be explored.
19
2. The US – Mexico Distribution System and the Possible Benefits to the Phoenix Area 2.1 Problem Description
2.1.1 Overview
The purpose of this project is to analyze the supply chain of goods produced in Mexico and
transported to the US, to be sold to the general market. Originally, a similar study concluded distribution center operations were not only feasible, but would result most competitive in the area close to Reno, NV. This study encapsulated the possibility of serving the general US population as well as the growing Mexican-American population.
Furthermore, our research reveals that even though the distribution market has been based
primarily in other cities closer to either the east or west coasts, Phoenix has the potential to operate as a major distribution center for Mexican-made products due to relatively low labor costs, above average infrastructure and most importantly a strategic location to serve the westernmost states of the United States.
2.1.2 Justification Since 1997, Mexico has become the second largest trading partner to the US. Currently there
are around 3,434 product-sharing facilities operating in Mexico, and around 50% of these facilities are located in non-border cities. Since a large portion of the goods produced in these product-sharing facilities must travel into the US, the selection of transportation systems, transportation routes and location of distribution centers are critical to reduce transportation costs.
2.2 Analysis of Distribution System
2.2.1 Analysis The analysis was done by creating a model of the distribution system that chooses the
routing options and transportation type for each shipment based on a set of rules and constraints, which then calculates the cost of that scenario. Using this model and changing the input levels, the wide range of outputs necessary to make conclusions about the distribution options were attained. The input levels that were altered during the analysis were the number of distribution centers, the distribution points used, the served marked, the demand level, the plant location, and the border crossing cost.
2.2.2 Product The product selected for this analysis was an electrical power strip. The power strips weigh
2.42 lbs each and measure 221 cubic inches (17” x 2” x 6.5”). This product was selected because it represents the very important electronic industry and the demand for the product is not significantly affected by geographical or ethnical differences throughout the US.
2.2.3 Customer Markets and Demand In the present study we consider two potential markets, the first one is the entire US
population and the second one is the Mexican-American population. The demand was calculated
20
using the most recent data from the census (2000). We tabulated the demand according to their 3-digit zip code in the US. The demand for the US population was set at three levels. Low; representing a plant that ships 10 truckloads of product per week to supply all the demand, Medium; representing a plant that ships 50 truckloads of product per week, and High; representing a plant that ships 200 truckloads of product per week (Vega, 2000). Demand for the Mexican-American population was created by applying a conversion factor, using the US population demand as a basis. With the information of the demand for both populations we assigned the demand to each 3-digit zip code.
2.2.4 Distribution Points
Because of the stated purpose of this project, which is determining Phoenix’s potential as a
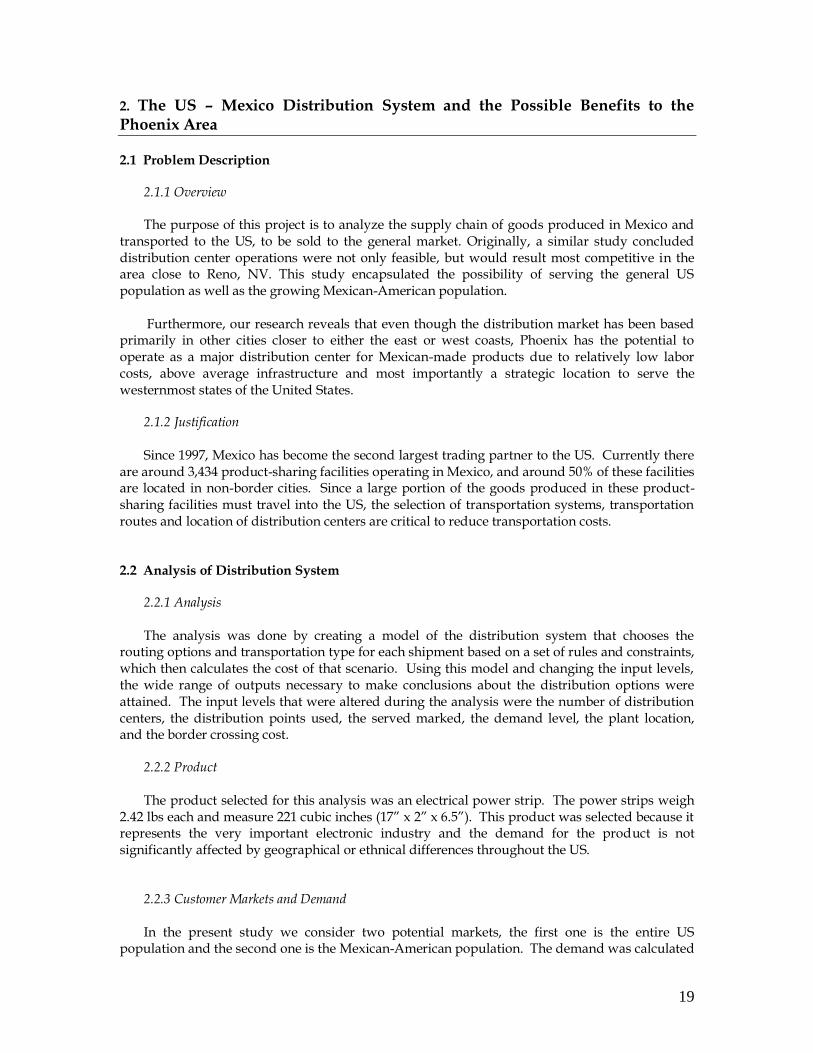
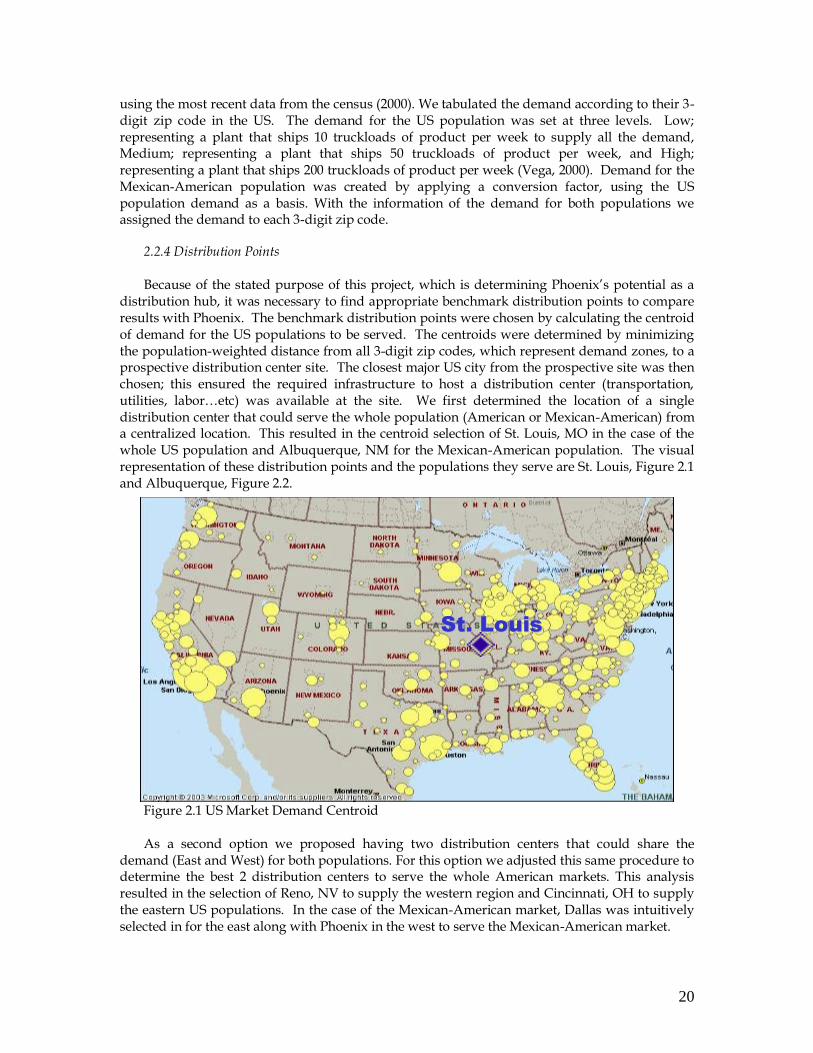
distribution hub, it was necessary to find appropriate benchmark distribution points to compare results with Phoenix. The benchmark distribution points were chosen by calculating the centroid of demand for the US populations to be served. The centroids were determined by minimizing the population-weighted distance from all 3-digit zip codes, which represent demand zones, to a prospective distribution center site. The closest major US city from the prospective site was then chosen; this ensured the required infrastructure to host a distribution center (transportation, utilities, labor…etc) was available at the site. We first determined the location of a single distribution center that could serve the whole population (American or Mexican-American) from a centralized location. This resulted in the centroid selection of St. Louis, MO in the case of the whole US population and Albuquerque, NM for the Mexican-American population. The visual representation of these distribution points and the populations they serve are St. Louis, Figure 2.1 and Albuquerque, Figure 2.2.
Figure 2.1 US Market Demand Centroid As a second option we proposed having two distribution centers that could share the
demand (East and West) for both populations. For this option we adjusted this same procedure to determine the best 2 distribution centers to serve the whole American markets. This analysis resulted in the selection of Reno, NV to supply the western region and Cincinnati, OH to supply the eastern US populations. In the case of the Mexican-American market, Dallas was intuitively selected in for the east along with Phoenix in the west to serve the Mexican-American market.
SStt.. LLoouuiiss
21
Figure 3.2 Mexican-American Market Demand 2.2.5 Location of the plants in Mexico The three plant locations (supply points) within Mexico analyzed were Juarez, Torreon, and
Mexico City. These sites were selected to represent Mexico’s different industrial regions. Juarez, located on the US border across from El Paso, was selected to represent industrial border cities and because it is one of the most important product-sharing centers in Mexico. Torreon was selected because it has the largest number of product-sharing facilities of a non-border city and it is also in a good proximity to both El Paso and Laredo, the main gateways to the US. Mexico City was selected to represent the large industrial cities in the interior of Mexico.
2.2.6 Border Crossing The border crossing points chosen in this analysis for truckloads crossing into the United
States were Nogales, El Paso, and Laredo. These points were selected for their location in proximity to the plants and possible distribution points, border capacity to accept traffic, and the availability of acceptable road infrastructure on each side of the crossing. The cost for bringing each shipment into the US equated to $175 under current NAFTA policies and $115 under the future NAFTA discount prices. The final results given in this analysis are given in terms of the future discount price.
2.2.7 Transportation Modes The transportation modes selected for shipments in this analysis were Truckload, Less than
Truckload, and Parcel Service. Truckload service consists of enlisting an entire truck to deliver a shipment. The rate for this service is $1 per mile with a capacity to carry 36,765 lbs of the product. This rate was used in the original study and the real trucking rate is significantly higher (around 1.3 $/mile). For the sake of simplicity we decided to use the original rate. However, we don’t expect to see significant changes in the results because of the use of this rate. Less than Truckload service consists of sending a shipment along with others with separate
Albuquerque
22
origins/destinations in a single truck. The trucking program Q-rate determined the rates for this service. The costs of the Parcel service prices were acquired from UPS freight service.
2.2.8 Analysis of the Results The results for supplying the entire US market with one distribution center are in Table 3.1.
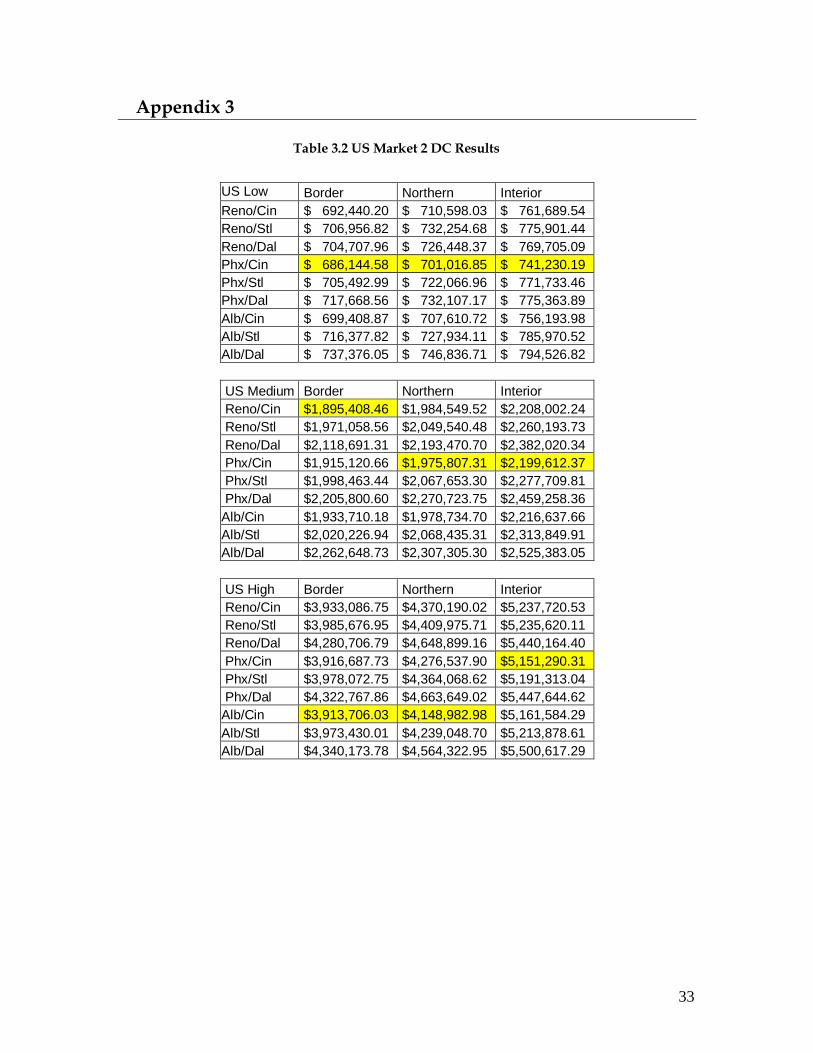
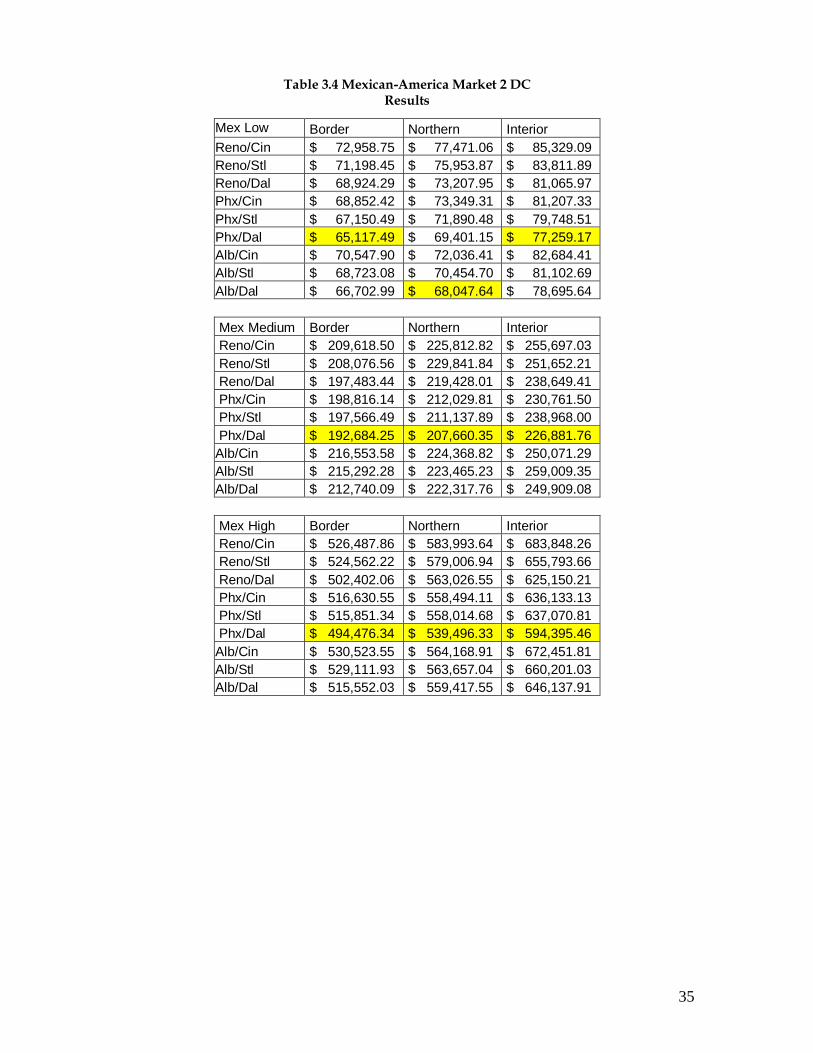
These results show that St. Louis is the best location for a distribution point for all levels tested in this analysis. The results for supplying the entire US market with two distribution centers are in Table 3.2 in Appendix 3. These results show that Cincinnati is always the preferred distribution point to use in supplying the eastern population, but depending on the levels in the analysis Phoenix is usually the preferred western distribution point, though there are scenarios where it would be beneficial to use Albuquerque or Reno instead. The results for supplying the Mexican-American market with one distribution center are in Table 3.3 in appendix 3. These results show that Phoenix is usually the preferred distribution point, but there are scenarios where it would be beneficial to use Albuquerque or Dallas, especially when the demand is high, since the Laredo crossing is usually closer from the supply and demand points. The results for supplying the Mexican-American market with two distribution centers are in 3.4 in Appendix 3. These results show that under all scenarios but one, it is preferred to use Dallas as the eastern distribution point and Phoenix as the western distribution point. In the exception, it is preferred to use Albuquerque for the western distribution point.
US Low Border Northern Interior
PHX $ 744,752.37 $ 789,173.50 $ 829,800.65
ALB $ 736,407.46 $ 754,840.86 $ 823,367.74
DFW $ 721,509.25 $ 738,416.90 $ 777,782.20
STL $ 708,200.13 $ 732,590.66 $ 773,368.18
US Medium Border Northern Interior
PHX $2,472,596.03 $2,608,557.20 $3,109,943.34
ALB $2,474,765.77 $2,517,530.50 $2,911,915.92
DFW $2,199,230.06 $2,377,479.00 $2,563,192.04
STL $1,959,300.74 $2,218,508.14 $2,429,117.34
US High Border Northern Interior
PHX $4,264,268.47 $4,731,503.93 $7,034,301.43
ALB $4,515,505.74 $4,741,952.46 $6,286,146.97
DFW $3,942,927.74 $4,403,239.78 $5,247,635.06
STL $3,622,809.17 $4,279,008.05 $5,146,238.75
Table 3.1 US Market 1 DC Results 2.3 Potential Benefits for the City of Phoenix 2.3.1 Distribution Industry in Phoenix
Phoenix as one of the main urban areas of the US has a large distribution industry that serves the requirements of the population for food, merchandises and its own manufacturing base. Recently large retailers such as Wal-Mart and Target have selected the Phoenix area for their regional distribution centers. This follows a trend from previous companies like Safeway in the food industry and Avnet in the electronics industry.
23
One of the current problems is that the balance between drayage costs (moving containers from the ports to an unloading location) and other costs (warehousing, labor, land) may still favor keeping these activities in Los Angeles. However, the balance is shifting towards places like Arizona that can provide less expensive land and labor. The benefits of this industry is that is labor intensive, providing hundreds of new jobs for every facility installed in the Valley, with usually good paying jobs. The distribution industry has also a positive outlook in terms of growth in the near future, which combined with the saturation of some of the neighboring cities, makes this industry a potential growth opportunity. 2.3.2 Strengths and Opportunities The City of Phoenix is strategically located to serve as a distribution point for the Mexican and Mexican American markets. Its location is also beneficial in the sense that it could be used as a distribution point to serve all the US population of west coast. New information provided by the recent trade flow study created for the Arizona Department of Commerce suggests that Phoenix might be even better positioned to serve as a distribution center that its geographical position suggests. Currently the Mexican government is aggressively pursuing the integration of its ports to centers of consolidation/distribution; this may represent a unique opportunity for Phoenix to partner up with the port of Guaymas to serve as a distribution point and/or multi-modal exchange point. This potential partnership depends on whether or not Phoenix is part of Arizona’s plans for multi-modal transportation. The trend for distribution centers is to serve a smaller area and become more numerous. This change is driven by the growth in the big box market. With stores like Target, Wal-Mart, Home Depot, Lowe’s, and others adding stores at a furious rate, more and more DCs are needed. Arizona has the potential to become the distribution center for Mexican-made (Maquila) products. Long Beach and San Diego have captured much of this activity, but Arizona has cost advantages that should make the State competitive to play this role. We should also consider traditional Mexican-made imports meant to be distributed to the Mexican population living in Arizona and possibly the entire US population of the west coast. 2.3.3 Possible Distribution Centers Project Extension
Expansion of the study of Phoenix as a Center of Distribution to include updated rates and its relationship with Guaymas
Expansion of the study todetermine feasible strategies to develop efficient transportation links between Phoenix and the main manufacturing centers of Mexico.
Study Phoenix as a center for multi-modal exchange in combination with the plans of the Mexican Ports as an alternative to Long Beach
Use a specific industry as a case study Extend the electronics industry study to specifically consider the silicon border project
and established local companies
24
2.4 Phoenix and the Railroad Industry 2.4.1 Introduction to the Railroad Industry The relative importance of rail transportation has been decreasing for the past 50 years, in terms of the value of the products transported. However, the ton-miles transported by this mode have been steadily increasing (Coyle, Bardi and Novack 2000). The main reason is the type of products typically transported by rail, which include products with high volume and weight, but with lower value. This trend in low value cargo has started to change with the growth of intermodal and international transportation. Intermodal transportation is the use of one or more transportation modes to deliver a shipment to their final destination. Intermodal transportation is the fastest growing part of the rail business, representing up to 10% of their gross revenue (Sussman, 2000). One of the most popular intermodal transportation services is the piggyback (Ballou, 2004), the movement of motor-carrier trailers on flat cars, thus combining rail and truck services. Other combinations of intermodal transportation with the railroad include: rail-truck, rail-water and rail-air. The other major factor that has increased railroad transportation is the demand for international transportation, which has had a tremendous growth in the last decades and it is expected to keep growing in the foreseeable future. The international trade is dominated by water carriers who transport 50 percent of the trade volume in dollars and 99 percent by weight. Air moves 21 percent of the value and the rest is transported by other means of transportation (Ballou, 2004). 80 percent of those shipments coming by water to the US are moved through the use of containers (Sussman, 2000). This container trade is expected to triple in the next 20 years (Stopford, 2000). The movement of containers to and from the ports usually requires the use of a railroad, since it is the most efficient mode of transportation for this type of cargo. 2.4.2 Relevance of Railroad Transportation to Phoenix
1. The gross of the international trade in manufactured products is performed by
containers, which are transported more efficiently by train. It is essential for Phoenix to be serviced by efficient of railroads if Phoenix wants to be an important player in the area of import/export, in particular with the Far East.
2. Increasing the container operations might benefit the present and future of manufacturing sites located in Phoenix. By providing the ability of moving shipments fluently.
3. At the present time most of the cargo that moves in Arizona bypasses our major cities. There could be an opportunity for adding value to some of that cargo before their final destination, especially for Phoenix. This might be achieved by converting Phoenix into a hub for cargo.
4. Rail links are not as constrained by weight or volume in comparison to road and air transportation. Providing a very flexible transportation mode for intercity communication and for international trade.
5. The benefits it will give to companies that rely a lot on the transportation of high volume materials, such as the aerospace industry. Which is one of the main industries that are now located in Phoenix, and one of the only ones that can not move that easily to Asia.
6. The use of railroads by big trucking companies such as Swift to increase the efficiency of their operations. Using railroads for the long haul part of the trip. This would increase the probability of converting Phoenix into a major multimodal hub.
25
7. Currently most of the cargo coming in and out of Phoenix is transported by road. By using the railroad to move containers and motor carriers equipment, relying less on trucks to move merchandise to and from the City of Phoenix. We could reduce the congestion of the main highways of Phoenix, particularly the I-10.
8. The advantage of transporting products by different transportation modes can increase the growth in the distribution and consolidation industry for the City of Phoenix. Again this would require converting Phoenix in a multimodal city with all the transportation facilities required to provide these services.
9. Phoenix must retain the ability of having a multimodal infrastructure and retain these capabilities. This will allow the efficient and economic transportation of goods, by allowing the use of the best transportation mode for each shipment. Reducing the costs of doing business in Phoenix.
10. The City of Phoenix should research the proper capacity required for each transportation mode. The interest should not only be on current operations, but on the possibility of handling the demand in the future. This would allow the proper development of the City and maintain its competitiveness in terms of infrastructure, cost of transportation and environmental conditions.
2.5 Conclusions
The results collected by this analysis show great potential for the Phoenix area to benefit from
being included into the supply train of goods coming to the US from Mexico. The best opportunities for Phoenix are its ability to serve the western portion of the US population, to serve the entirety of the Mexican-American population, or to serve the western portion of the Mexican-American population in a two-distribution center system. In these roles, Phoenix is the best option for a number of the scenarios tested, but for the rest of these scenarios, Phoenix is still among the top options.
To support the development of the distribution industry the City of Phoenix should improve
the infrastructure required for making the distribution operations feasible and efficient. These capabilities include the conserving and improving roads, railroads and multimodal facilities, which as we mentioned before are important for current and future transportation needs.
References American Electronics Association (AeA). Published May 2004. Consulted November 2004. http://www.aeanet.org/PressRoom/prrh_050104_ExportData.asp Ballou, Ronald H. (2004). Business Logistics/Supply Chain Management: planning, organizing and controlling the supply chain. Pearson Prentice Hall. Upper Saddle River, NJ. Bill White. Senior VP, ICS, Amkor Technology, Inc. Dave Lawton. Senior VP, Demand Management, Amkor Technology, Inc. Personal interview. June 23, 2004 Blanco H. Speech given during the opening of a Sony Plant by the Mexican Secretary of Commerce,
Tijuana, B.C., August, 1997. Booz Allen Hamilton (2003). Electronics Manufacturing in Emerging Markets. Washington D.C. Prepared for the International Finance Corporation.
26
Coyle, John J., Bardi, Edward J., Novack, Robert A. (2000) Transportation Fifth Edition. South-Western College. Cincinnati, OH. “FC-09A … Tape and Reel Data”. Fairchild Semiconductor. Nov. 2004 http://www.fairchildsemi.com/products/discrete/pdf/2x2_tr.pdf Howell, Thomas R., Bartlett, Brent L., Noellert, William A., Howe Rachel (2003). China’s Emerging Semiconductor Industry: The impact of China’s Preferential Value-added Tax on Current Investment Trends. Dewey Ballentine LLP for the Semiconductor Industry Association. Kelly, Michael J., Boulton William R., Kukowski, John A., Meieran, Eugene S., Pecht, Michael, Peeples, John W., Tummala Rao R. (1995) Electronic Manufacturing and Packaging in Japan. Japanese Technology Evaluation Center, Loyola College in Maryland. Khadpe, Subash Dr. “The Global Packaging Foundry Business 2003: Suppliers Are Revving Up for a Boom Year”. Chip Scale Review. May, 2004 www.chipscalereview.com/archives/0504/article.php?type=feature&article=f2 Stopford, Martin (2000). Defining the future of shipping markets. ITIC Forum 2000, London, England, October 2nd 2000. Sturgeon, Timothy J. (2003) Exploring the Risks of Value Chain Modularity: Electronics Outsourcing During the Industry Cycle of 1992-2002. Industrial Performance Center, Massachusetts Institute of Technology. Sussman, Joseph. (2000) Introduction to Transportation Systems. Artech House Inc. Norwood, MA. Don, Ream. Representative, ASM Pacific. Email correspondence. Sept. 29 – Nov. 15, 2004 United Nations Commodity Trade Statistics Database (UN Comtrade). Sept. 2004 http://unstats.un.org/unsd/comtrade/.
Appendix 1 Interview with ON Semiconductor ON Semiconductor, a Motorola spin off, is a leading global supplier of advanced
semiconductors for sophisticated electronics applications Reasons for closing its Guadalajara plant:
Not competitive against Asian plants (technology, costs) Lack of government incentives Lack of local suppliers
What it looks for in a location for a plant:
Ease of travel (getting in and out of plant) Availability of skilled labor Cost Proximity to clients
Interview with Intel Intel supplies the computing and communications industries with chips, boards, systems, and
software building blocks that are the "ingredients" of computers, servers and networking and communications products. Intel has presence in Phoenix and Guadalajara.
Factors considered when selecting a manufacturing site:
Supply chain density Infrastructure Logistics Business perception Technical expertise Country risk Operation Government Basic infrastructure Proximity to market Rate of return 10 year present value Sustainable operation Cost of operation Copyright laws Competitiveness Gap Education Infrastructure is key Score in multifactor model IT
Possible Areas of investment for the industry:
Consumer Product Design: Potential in Mexico and in US Packaging: Mainly in Asian countries Component design and final assembly: Potential in Mexico
Assets of Asia plants: Supply chain critical mass Maturity of the semiconductor industry Expected growth of the Asian market Incentives for the development of high tech industries and Fabs.
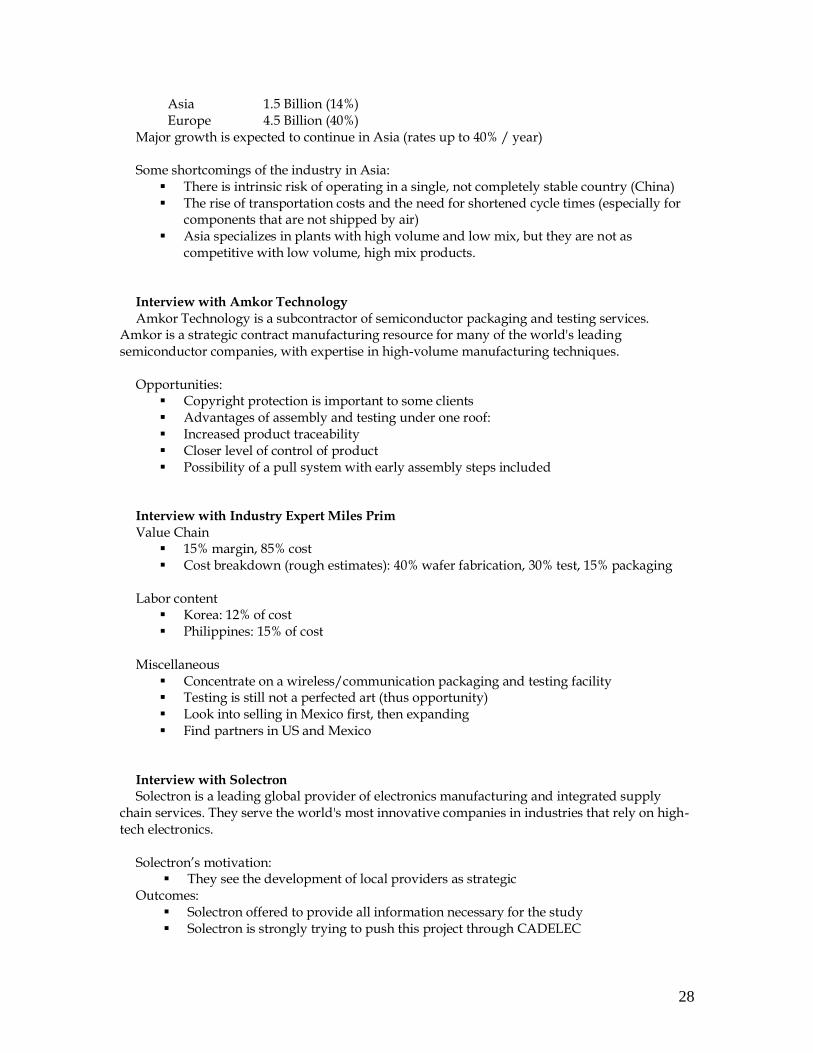
Interview with Avnet Avnet, Inc. is an industrial distributor of electronic components, enterprise network and
computer equipment and embedded subsystems. Serving customers in 68 countries, Avnet markets, inventories, and adds value to these products and provides supply chain management and engineering services.
Avnet Client Distribution (estimates):
N. America 5.0 Billion (45%)
28
Asia 1.5 Billion (14%) Europe 4.5 Billion (40%)
Major growth is expected to continue in Asia (rates up to 40% / year) Some shortcomings of the industry in Asia:
There is intrinsic risk of operating in a single, not completely stable country (China) The rise of transportation costs and the need for shortened cycle times (especially for
components that are not shipped by air) Asia specializes in plants with high volume and low mix, but they are not as
competitive with low volume, high mix products. Interview with Amkor Technology Amkor Technology is a subcontractor of semiconductor packaging and testing services.
Amkor is a strategic contract manufacturing resource for many of the world's leading semiconductor companies, with expertise in high-volume manufacturing techniques.
Opportunities:
Copyright protection is important to some clients Advantages of assembly and testing under one roof: Increased product traceability Closer level of control of product Possibility of a pull system with early assembly steps included
Interview with Industry Expert Miles Prim Value Chain
Concentrate on a wireless/communication packaging and testing facility Testing is still not a perfected art (thus opportunity) Look into selling in Mexico first, then expanding Find partners in US and Mexico
Interview with Solectron Solectron is a leading global provider of electronics manufacturing and integrated supply
chain services. They serve the world's most innovative companies in industries that rely on high-tech electronics.
Solectron’s motivation:
They see the development of local providers as strategic Outcomes:
Solectron offered to provide all information necessary for the study Solectron is strongly trying to push this project through CADELEC
29
Interview with Sanmina-SCI, Jabil
Sanmina-SCI provides end-to-end manufacturing solutions, delivering unsurpassed quality and support to large OEMs. Jabil Circuit is a global leader in the Electronic Manufacturing Services industry, offering innovative manufacturing and supply chain solutions to world leading electronics and technology companies across a broad range of industries. Outcomes:
Both showed interest in the project Both offered to provide data for the study
Silicon Border
“10,000-acre high-technology industrial park in development along the border” (Mexicali)
“Virtually self-contained city for IC design, manufacture and device integration o Wafer fabs o Assembly and test operations o Photomask shops o Equipment vendors o Materials manufacturers o Raw wafer manufacturing”