© 2
014 A
pp
lied R
esearc
h A
ssocia
tes,
Inc.
Curt A. Beckemeyer, P.E.
Sr. Vice President
Applied Research Associates, Inc. (ARA)
Integrating the Rolling Wheel Deflectometer (RWD)
into Pavement Management to Support
an Effective Pavement Preservation Program
© 2016 Applied Research Associates, Inc. 2
Presentation Outline
Background
Study Objectives and Purpose
Data Collection
Pavement Management Analysis
Findings
Conclusions
New Developments
© 2016 Applied Research Associates, Inc. 3
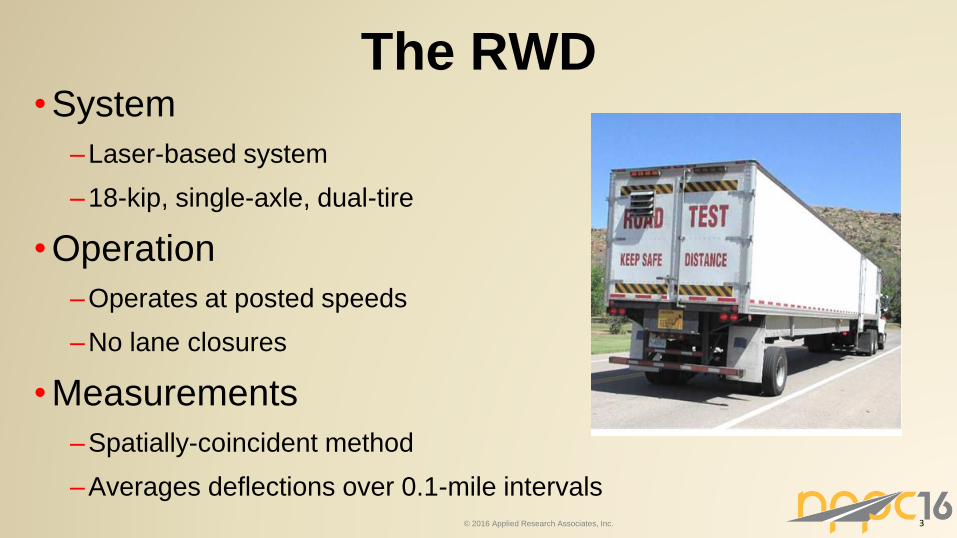
•System
–Laser-based system
–18-kip, single-axle, dual-tire
• Operation
–Operates at posted speeds
–No lane closures
• Measurements
–Spatially-coincident method
–Averages deflections over 0.1-mile intervals
The RWD
© 2016 Applied Research Associates, Inc. 4
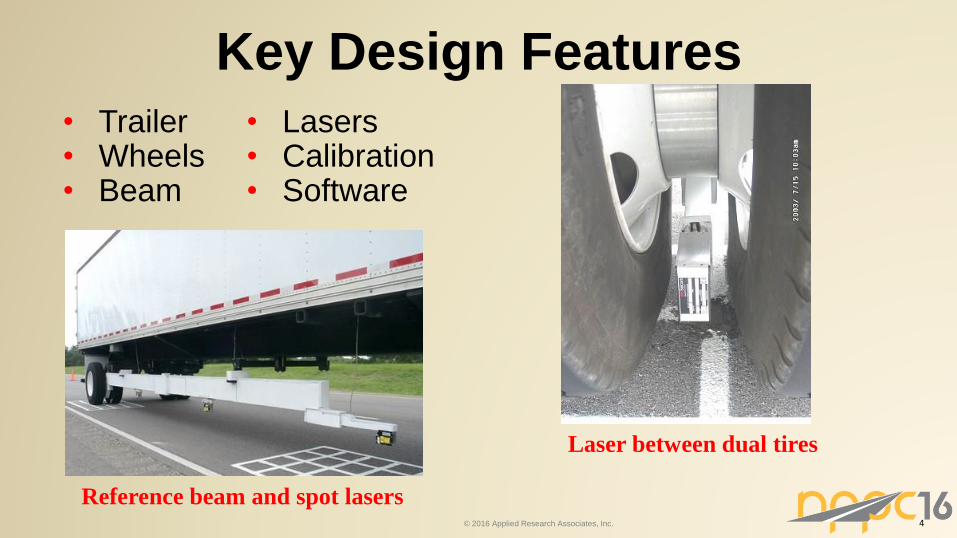
Key Design Features
• Trailer• Wheels• Beam
• Lasers• Calibration• Software
Laser between dual tires
Reference beam and spot lasers
© 2016 Applied Research Associates, Inc. 5
Spatially Coincident Methodology
D1 C1 B1 A1
D2 C2 B2 A2
Point 1
Point 2
L
1 meterAnchors
Anchors
A1, B1 and C1 establish the baseline for
comparison to B2, C2 and D2
© 2016 Applied Research Associates, Inc. 6
RWD Role in Pavement Management
Network-Level Project-Level
1,0
00
s o
f la
ne
-mile
s
Preservation
Rehabilitation
or
Reconstruction
FWD
Coring
Lab
Do
ze
ns
of
lan
e-m
ile
s
0
1
2
3
4
5
6
7
8
3+000 4+000 5+000 6+000 7+000 8+000 9+000 10+000
Chainage
IRI,
m/k
m
Left WP Right WP
PQI
IRI
RWD
Sample Deflection Profile
Station / Mile
RWD FWD
AC (Good)
PCC
AC (Fair)
AC (Good)
AC (Fair)
De
flecti
on
, m
ils
PCC
35
0
© 2016 Applied Research Associates, Inc. 8
FHWA Case Study - Oklahoma
• Evaluate the benefits of integrating RWD data into PMS
• Compare results with and without RWD data
– Treatment selection
– Costs
– Performance
© 2016 Applied Research Associates, Inc. 9
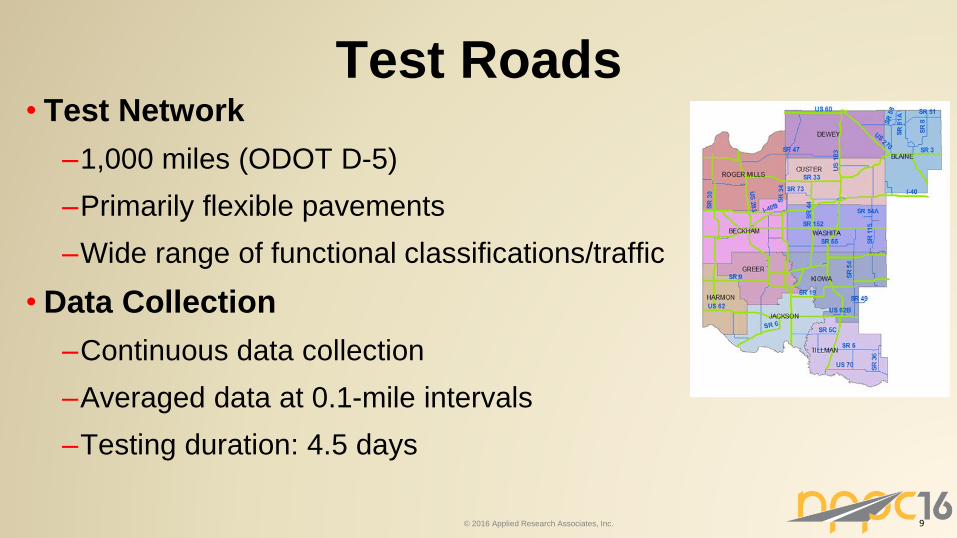
• Test Network
–1,000 miles (ODOT D-5)
–Primarily flexible pavements
–Wide range of functional classifications/traffic
• Data Collection
–Continuous data collection
–Averaged data at 0.1-mile intervals
–Testing duration: 4.5 days
Test Roads
© 2016 Applied Research Associates, Inc. 10
• Composition / Use
–Pavement age
–Layer types and thicknesses
–Classification, traffic (ADT)
Agency PMS Data
• Condition
–Pavement Quality Index (PQI):
Ride quality
Rutting
Distress
–Structural condition
FWD data (interstate only)
Structural rating (subjective)
© 2016 Applied Research Associates, Inc. 11
•Software
–Deighton software (dTIMS)
•Performance Modeling–Defined sectioning
–Performance models for each pavement type
•Decision Models–Decision trees → PQI, traffic, and structural condition
–3 Treatment categories → Preservation, rehab, replacement
Agency PMS Methodology
© 2016 Applied Research Associates, Inc. 12
•Evaluate multiple M&R treatment strategies
–Base strategy: PQI only
–Two modified strategies: add RWD data
•Compare results
–Costs
–Performance (in terms of PQI)
Approach
13© 2016 Applied Research Associates, Inc.
PQI Only – Treatment Matrix
REHABILITATION
Low
Traffic
Medium
Traffic
High
Traffic
PQ
I
88
75
55
80
65
35
REPLACEMENT
PRESERVATION
14© 2016 Applied Research Associates, Inc.
RWD #1 – Treatment Matrix
PQ
I
88
75
55
80
65
PRESERVATION
REHABILITATION
REPLACEMENT
Low Medium HighTraffic→RWD → L M H L M H L M H
15© 2016 Applied Research Associates, Inc.
RWD #2 – Treatment Matrix
80
60
88
75
65
55
45
Low Medium HighTraffic→
PRESERVATION
REHABILITATION
REPLACEMENT
RWD → L M H L M H L M H
© 2016 Applied Research Associates, Inc. 16
Results
Budget Scenario
Percent change in cost
(relative to “PQI Only” base case)
PQI
Only
RWD
Option 1
RWD
Option 2
Target PQI = 92 0.0% -10.6 % -11.5 %
© 2016 Applied Research Associates, Inc. 17
• RWD allows broader, more reliable use of pavement
preservation
–Identifies roads in GOOD & FAIR structural condition
–Prevent PP use on roads in POOR structural condition
•Cost savings can be significant
–In the range of 5 to 10%, in many cases
–Depends on agency’s current strategy and road conditions
Conclusions
© 2016 Applied Research Associates, Inc. 18
Recent Advancements in
RWD Technology
RWD-Vision (cameras vs lasers)
Cameras
LED LightsLED Lights
Lights
Between
Tires18-kip load
20© 2016 Applied Research Associates, Inc.
RWD-Vision, cont.
• Right Wheel Path - Laser RWD (old)
• Left Wheel Path – RWD-Vision (new)
High Speed LED based Flash
2 Camera Positions
Basic Methodology
Image 1 (undeflected pavement)
Undeflected Region
Methodology, cont.
Image 2 (same location as image 1, but under load)
Deflected
Region
Undeflected area
23© 2016 Applied Research Associates, Inc.
Stereo-Pair Image Processing
RWD-Vision deflection
profile along wheel path
centerlineRWD-Vision
deflection contour
(on pavement surface)
RWD-Vision
deflection
measurements
(in camera
images)
29.2 in
76 inches
96
in
ch
es
Area = 3.9 ft2
x
Pixels
Pix
els
Inches
24© 2016 Applied Research Associates, Inc.
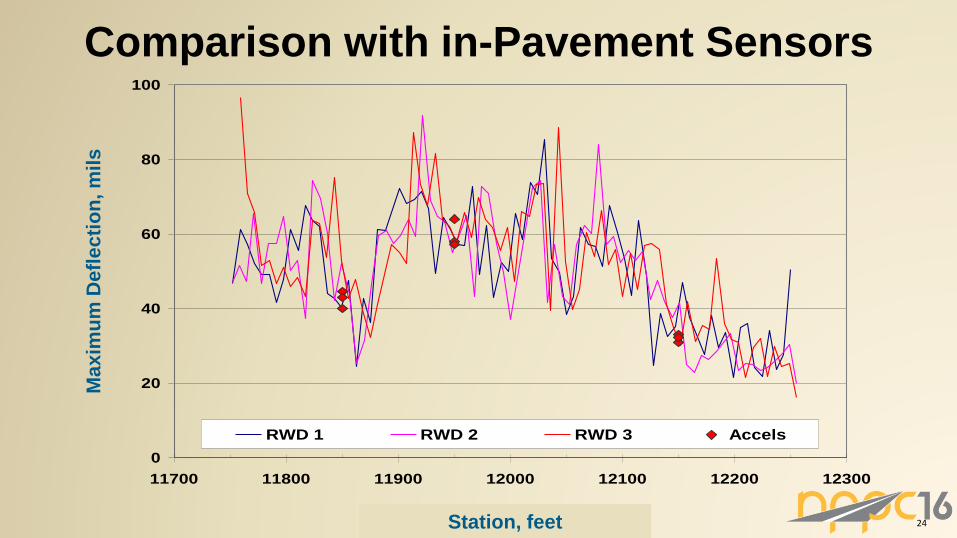
Comparison with in-Pavement Sensors
0
20
40
60
80
100
11700 11800 11900 12000 12100 12200 12300
RWD 1 RWD 2 RWD 3 Accels
Ma
xim
um
Defl
ec
tio
n, m
ils
Station, feet


![[OpenStack Days Korea 2016] Track4 - OpenStack with Kubernetes](https://static.documents.pub/doc/80x56/587004e91a28ab427f8b5cfd/openstack-days-korea-2016-track4-openstack-with-kubernetes.jpg)


