+ All Categories
Home > Documents > INTEGRATION AND OPTIMISATION OF BLASTING … AND OPTIMISATION OF BLASTING AND COMMINUTION PROCESSES...

INTEGRATION AND OPTIMISATION OF BLASTING … AND OPTIMISATION OF BLASTING AND COMMINUTION PROCESSES...

Date post: 29-Apr-2018
Category:
Upload: duongthien
View: 218 times
Download: 2 times
Share this document with a friend
20
INTEGRATION AND OPTIMISATION OF BLASTING AND COMMINUTION PROCESSES Sedat Esen, David La Rosa, Adrian Dance, Walter Valery, Alex Jankovic Metso Minerals Process Technology Asia-Pacific & South America, Brisbane, Australia ABSTRACT This paper presents the methodology for optimising blasting and comminution processes in terms of fragmentation developed by Metso Minerals Process Technology Asia-Pacific & South America (MMPT). The methodology is called Process Integration and Optimisation (PIO) and involves a number of steps: benchmarking, rock characterisation, measurements, modelling/simulation of blasting and comminution processes and where required, material tracking. The measurements collected while at site are combined with rock characterisation and definition of ore domains to model the complete process chain. These data are used to develop site-specific models of blast fragmentation, crushing, grinding and flotation. This allows customised blast patterns to be developed that optimise both crushing and grinding performance. For each domain, blast designs are recommended to generate the optimal fragmentation size for downstream processes. The objective is to minimise the overall cost for the entire process and the changes often have a positive impact on the mining operation. Process constraints such as wall stability, ore dilution, muckpile characteristics, size of mining equipment, size and installed power of crushing and milling equipment and other process bottlenecks are considered in the blast designs. This methodology has allowed many operations around the world to significantly increase their production: generating typically 5 to 20% higher concentrator throughput. A number of case studies will be discussed in this paper to describe the structured approach taken and demonstrate the benefits that are achievable. This paper will focus on the role of blasting in the optimisation of the entire mine to mill process chain and discuss elements of the PIO methodology: rock characterisation, fragmentation modelling and measurement, the relationship between fragmentation and mill throughput and material tracking.
Transcript

INTEGRATION AND OPTIMISATION OF BLASTING AND COMMINUTION

PROCESSES

Sedat Esen, David La Rosa, Adrian Dance, Walter Valery, Alex Jankovic

Metso Minerals Process Technology Asia-Pacific & South America, Brisbane, Australia

ABSTRACT

This paper presents the methodology for optimising blasting and comminution processes in terms of

fragmentation developed by Metso Minerals Process Technology Asia-Pacific & South America

(MMPT). The methodology is called Process Integration and Optimisation (PIO) and involves a

number of steps: benchmarking, rock characterisation, measurements, modelling/simulation of

blasting and comminution processes and where required, material tracking. The measurements

collected while at site are combined with rock characterisation and definition of ore domains to

model the complete process chain. These data are used to develop site-specific models of blast

fragmentation, crushing, grinding and flotation. This allows customised blast patterns to be

developed that optimise both crushing and grinding performance. For each domain, blast designs

are recommended to generate the optimal fragmentation size for downstream processes. The

objective is to minimise the overall cost for the entire process and the changes often have a positive

impact on the mining operation. Process constraints such as wall stability, ore dilution, muckpile

characteristics, size of mining equipment, size and installed power of crushing and milling

equipment and other process bottlenecks are considered in the blast designs.

This methodology has allowed many operations around the world to significantly increase their

production: generating typically 5 to 20% higher concentrator throughput. A number of case studies

will be discussed in this paper to describe the structured approach taken and demonstrate the

benefits that are achievable. This paper will focus on the role of blasting in the optimisation of the

entire mine to mill process chain and discuss elements of the PIO methodology: rock

characterisation, fragmentation modelling and measurement, the relationship between fragmentation

and mill throughput and material tracking.

INTRODUCTION

Fluctuations in Run-of-Mine (ROM) ore hardness and feed size distribution can have a significant

influence on crusher and mill performance. For some operations, where feed size to this equipment is

not well controlled, this can create significant problems with mill stability. The manipulation of the

ROM feed size, therefore creates opportunities to improve crushing and milling equipment

performance and efficiency. Examples include changes to blasting practices, ROM stockpiling, as well

as the optimisation of the crushing and grinding circuits.

Metso Minerals Process Technology Asia-Pacific & South America (MMPT) has developed and

proven a Process Integration and Optimisation (PIO) methodology and demonstrated the positive and

meaningful impact of this methodology as a whole. Broadly, an extensive characterisation and

definition of blasting domains is performed, based on the rock structure and strength of the entire ore

body. The energy during blasting is then better distributed to produce a muckpile that has an optimum

size distribution for each domain, the downstream process and product specifications.

The PIO methodology is based on mechanistic and forward analysis that involves the following steps:

a) Characterisation and definition of domains based on rock structure and strength. The

measurement techniques have been developed and perfected over many years to suit the reality

of operating mines in a production environment. As such, the techniques are practical and

statistically representative of the entire ore body. They are inexpensive and can be conducted

by the mines themselves, rather than relying on expensive tests conducted at specialized labs

(e.g. SAG Power Index, Drop Weight and SAG Mill Comminution tests), which will never be

done in a quantity to statistically represent the entire orebody.

b) Establishment of process constraints such as wall stability, environmental issues, presence of

water, ore dilution, muckpile characteristics, size of mining equipment, size and installed

power of crushing and milling equipment and other process bottlenecks.

c) Definition of the key downstream requirements and development of drilling/blasting strategies

for each domain to suit the defined downstream requirements (milling of ore or waste).

d) Use of proven software tools, predictive models and simulations in conjunction with mine and

plant personnel to establish optimum operating and control strategies to maximise overall profit

from the blast to the mill.

e) Implementation and monitoring of the defined integrated operating strategies (suitable blast

designs for each ore domain followed by respective optimal crushing and grinding strategies)

and establishment of standards, quality assurance and control mechanisms.

f) Analysis and management of data and results.

g) Long term implementation and maintenance of benefits obtained.

This methodology has been applied at more than 30 operations around the world to significantly

increase their production: generating typically 5 to 20% higher throughput and has been used for

optimisation of existing mining and milling processes as well as greenfield studies (Dance et al, 2006;

Jankovic et al, 2006; McCaffery et al, 2006; Powell et al, 2006; Renner et al, 2006; Tondo et al,

2006).

The steps detailed above are focused on the development of an integrated mining and milling

optimisation strategy to reduce the cost per tonne treated and to increase profitability of the operation.

Part of this strategy is to increase plant throughput with little or no capital investment, by optimising

rock breakage and fragmentation from blasting through crushing and grinding. This should result in:

• increased excavation and loading efficiencies;

• reduced ROM topsize allowing the Primary Crusher to achieve greater throughput while

operating at a smaller gap to produce a mill feed with a finer topsize;

• reduced SAG mill feed topsize and an increased proportion of fines (-10mm material) to

increase mill throughput with existing installed power;

• minimal adverse impacts such as wall damage, dilution, environmental nuisance (structural

damage and airblast).
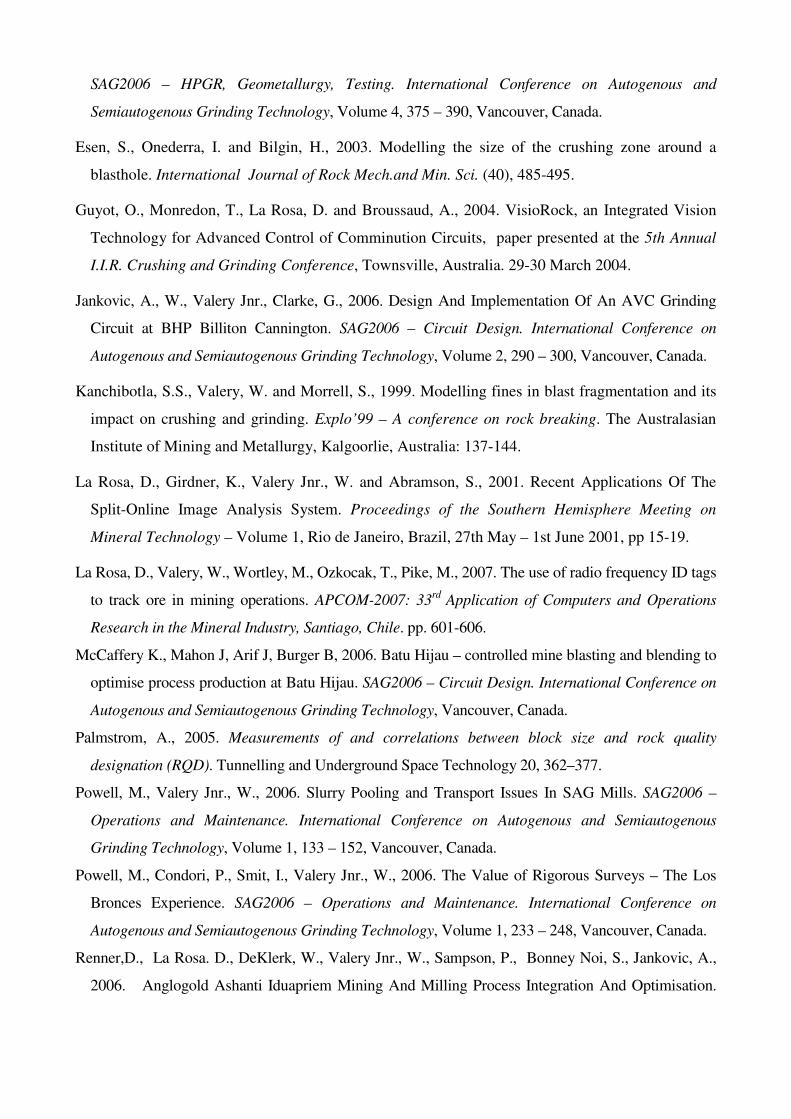
METHODOLOGY

Process Integration and Optimisation represents a wider application of optimisation than typical

mine to mill projects, as it can focus on any quality parameter of interest and not just feed size. That

being said, most projects are concerned with understanding how material properties affect mill

production and to subsequently increase mill throughput.

The methodology involves a number of steps: benchmarking, rock characterisation, measurements,

modelling/simulation and where required, material tracking. A PIO project is normally comprised

of a number of site visits over a few months. The first site visit establishes current operating

practices, and allows the collection of rock characterisation and blast fragmentation data as well as

process performance information. This is followed by modelling and simulation studies to

determine how to best exploit hidden inefficiencies. These recommendations are then followed by

further site visits to implement the changes, monitor the results and ensure that improvements are

maintained over time.

Benchmarking

The first step of a PIO project is to benchmark the current practices by auditing the operation and

control of the blasting, crushing, grinding and flotation processes. The quality of blast pattern

implementation is assessed and the resulting ROM fragmentation measured using image analysis

techniques. Crushing, grinding and flotation circuits are also surveyed and process control strategies

reviewed. All of these measurements allow mathematical models to be developed of the complete

process chain. These models are then used to simulate the impact of operational changes in the mine

and concentrator on the entire process.

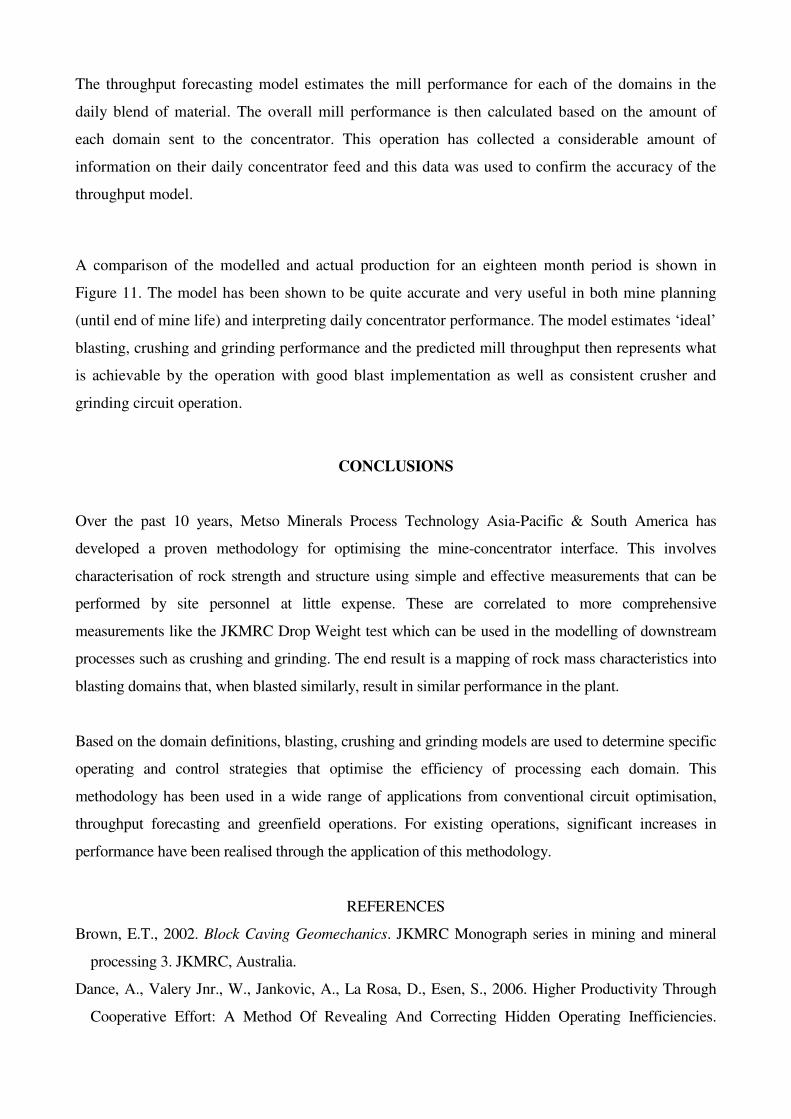
Rock characterisation

Fracture Frequency (FF) and Rock Quality Designation (RQD) give a good indication of the rock mass

structure, which in turn will drive the proportion of coarse material in the blast fragmentation. Fines

generation in the blast (material below a few millimetres) is mainly related to rock strength as well as

explosive/rock interaction. As the fine end of the ROM size distribution curve has a direct impact on

critical downstream processes, it is important to be able to accurately predict blast-induced fines so

they can be controlled and their benefits exploited.

It is important that for a rock strength test to be successfully used in this type of project, it should be

able to relate to both blastability and to high energy/impact breakage in crushers and mills. The rock

strength index should also generate a reasonable relationship with SAG mill specific power.

The Point Load Test is a well-known and widely used index to determine the rock strength. It is

commonly used as a quick and simple method to predict Unconfined Compressive Strength (UCS).

The test results in a Point Load Strength (Is) and Strength Anisotropy Index (Ia) of the rock sample. A

size correction is applied to the sample to yield the standard Is50 and Ia50 values, which correspond to

the Is and Ia values for 50mm diameter core. Rock samples may be in the form of core (diametral and

axial tests), cut blocks (block test), or irregular lumps (irregular lump test). The irregular lump test

offers the greatest convenience, as no sample preparation is required.

Due to the large number of Point Load tests that can be conducted on site over a relatively short period

of time by mining site personnel, they can be correlated with Drop Weight tests and used as a

production tool to assess the rock strength within individual blasts and ore blocks. Data collected at a

number of operations indicate that the Point Load Index can be related to Drop Weight test parameters,

which are used in the modelling of other comminution processes. As the Point Load tester is both

portable and easy to use, it allows mine personnel to carry out their own rock characterisation and

reduces the need for more accurate and expensive tests such as UCS, full Drop Weight or SMC tests.

FF or RQD help determine the in-situ block size which is used for the fragmentation modelling

purpose. Exposure mapping methods (spot mapping, lineal mapping, areal mapping) and core logging

methods could be used to collect rock mass discontinuity data (Brown, 2002). In the absence of data

collected using face exposure mapping method which gives more reliable information, RQD data could

be used. The use of RQD in estimating the block size has been given in detail by Palmstrom (2005).

A better understanding and characterisation of rock strength should help mining operations to develop

integrated blasting and comminution strategies to increase throughput, as well as blending strategies to

control variations in mill throughput. This methodology has been successfully applied at a number of

sites, including Newmont Batu Hijau, Phelps Dodge Candelaria, Codelco Andina and Mansa Mina

Projects in Chile, Antamina in Peru, RPM in Brazil and AngloGold Ashanti in Ghana.

Ideally, Point Load Index tests should be conducted on the drill core samples on which FF/RQD

measurements have also been conducted. Alternatively, Point Load tests of lump samples collected in

the pit can also be conducted to identify rock strength domains. Figure 1 shows an example of UCS

and RQD data collected at one of these mining operations.

Measurements

Another aspect of our methodology is the heavy reliance on measurement. If material size is the

quality parameter of interest, the first site visit is used to collect measurements of size: ROM

fragmentation, primary crusher product and mill feed. In addition, attempts are made to measure the

reduction in material size for different ore types or domains in order to calibrate the mathematical

models over a wider range of conditions.

Image analysis is used to measure blast fragmentation by collecting numerous photographs of the

muckpile as well as haul trucks dumping at the primary crusher. For measurements of crushing and

grinding circuit performance, surveys are performed to collect data on all the process streams.

When concentrator recovery and/or final product quality are the issues, surveys of the separation

circuits are performed as well.

On-line image analysis systems are heavily relied upon to determine the particle size distributions

of ROM, crusher product and SAG mill feed. These systems allow continuous collection of particle

size information and give a better measure of the variation in fragmentation than single images or

belt cuts can.

Modelling approach

The modelling methodology includes detailed analysis of drill core and/or lump sample data with

respect to rock structure (related to RQD or FF) and rock strength (related to Point Load Strength). The

ore fragmentation domains are mainly determined by these two criteria and not limited to only

lithological and/or alteration domains. The following additional data is also used to characterise intact

rock properties: density, Young’s Modulus, Uniaxial Compressive Strength and full or simplified Drop

Weight tests.

The model used by the authors consists of the following combined mechanistic elements (Figure 2):

• Blast fragmentation model

• Primary Crusher model

• Milling circuit model (SAG mill, ball mill, cyclone and pebble crusher models)

Fragmentation modelling

MMPT staff have been involved in developing fragmentation models for a number of years

(Kanchibotla et al, 1999; Onederra et al, 2004), as well as in the development of fragmentation

measurement methodologies and software (La Rosa et al, 2001; Guyot et al, 2004), and this has been

successfully used in many greenfield and existing mining operations to date. The blast fragmentation

model takes into account rock mass properties (density, structure and strength), explosive (type and

detonation parameters) and blast design parameters (blast hole diameter, bench height, burden and

spacing, subdrill, stemming length, charge length). It is a hybrid model consisting of the well known

Kuz-Ram approach and a specific fines predictive model. The fines model has been validated with full-

scale blast data collected to date. The fragmentation model has a comprehensive explosive database

and includes a non-ideal detonation model to predict the realistic explosive performance under any

blasting conditions (Esen et al, 2003). The modelling framework and model descriptions were given in

detail by Kanchibotla et al (1999), Esen et al (2003) and Onederra et al (2004).

Each of these variables has a natural variation (e.g. rock strength) and error (e.g. hole position)

associated with them. Therefore, a stochastic approach is taken in modelling blast fragmentation and

these variables are input with a mean and standard deviation.

This modelling approach uses Monte Carlo sampling followed by model simulation, and results in

envelopes of ROM size distributions. Monte Carlo sampling refers to the traditional technique for

using random or pseudo-random numbers to sample from a probability distribution. These techniques

are applied to a wide variety of complex problems involving random behaviour.

Each Monte Carlo iteration involves obtaining an estimate of the model input variables based on their

mean value and standard deviation. The ROM size distribution is then calculated using the model with

these randomly created input variables. This process is repeated a large number of times to obtain an

envelope of possible ROM size distributions based on the variation in input data. The ROM size

distribution envelopes are limited by the 5% and 95% confidence intervals and can be validated using

image analysis.

Comminution modelling/simulation

The models of the primary crusher and milling circuit are well-established and proven to accurately

predict steady-state behaviour of these units and have been incorporated in the JKSimMet simulation

program. Like all models there are some limitations in their application and it is important that these

are fully understood.

The output from the blast fragmentation model (ROM size distribution) becomes the feed to the

primary crusher model. The crusher model then generates a SAG mill feed size distribution which is

used by the grinding circuit to predict a range of operating conditions from SAG mill tonnage, power

draw, load to ball mill discharge size, circulating load, cyclone pressure and overflow size.

The measurements collected while at site are combined with the rock characterisation domains to

model the complete process chain. These data are used to develop site-specific models of blast

fragmentation, crushing, grinding and flotation. This allows customised blast patterns to be developed

that optimise both crushing and grinding performance. For each domain, blast designs are

recommended to generate the optimal fragmentation size for downstream processes. This may involve

an increase or decrease in energy level (or powder factor) depending on the rock characteristics of each

domain.

The objective is to minimise the overall cost for the entire process by distributing the energy required

sensibly and effectively where it is best applied. Near-field vibration measurements and models are

used to confirm that pit wall stability issues are considered in the blast designs. In addition, the

crushing and grinding models allow the impact of operational and control strategies to be investigated.

For example, the best closed-side-setting of the primary crusher, in terms of production and product

size, can be evaluated, as can the optimal target load in the SAG mill. These can be simulated using the

model of all the stages of comminution (blasting, crushing and grinding).

Measurement of ore flow through the production chain

It is of vital importance during benchmarking that the source of material being fed into the crushing

and grinding circuits is accurately known. In the past, assumptions have had to be made regarding the

movement of ore from the blast to ROM pads and stockpiles. Typical of these are first in/first out,

where it is assumed that ore is retained in a stockpile for a fixed period. Stockpiles can be difficult to

model, as they are both dynamic in nature before the grinding circuit, and static in the case of ROM

pads used for blending. Once material enters these storage areas, it can be difficult to keep track of a

particular parcel of ore. MMPT have developed a system, SmartTag™ which consists of ore block

markers based on hardened RFID (Radio Frequency ID) tags and associated detection hardware (La

Rosa et al., 2007). The system allows physical measurement of the movement of parcels of ore

through the mining process, from the blast through to the grinding circuit. The tags are either inserted

in the middle of the stemming column of each blasthole, or placed on the surface of the final muckpile.

Antenna on the crusher product or SAG mill feed detects the movement of the ore as it flows from the

blast to the downstream processes (Figure 3). This ensures that the spatial origin of material being

processed is accurately known at all times and ore properties that are critical to the operation of the

equipment in the crushing and grinding circuits can be tracked. The use of RFID tags in this manner

also allows the estimation of other operational parameters such as ore dilution, stockpile residence

times and segregation. It is envisaged that there will be a much larger application of this technology in

the mining industry in the future.

When a Dispatch system with high precision GPS is available, ore dilution and loss can be estimated

by correlating the time when the tag was detected with the truck dumping the tag into the crusher, and

then to the shovel location where the tag was excavated from. Figure 4 shows some movements

detected from a large South American operation. Tag movements of over 20 metres were recorded and

this had significant implications with regards to ore loss and dilution.

CASE STUDY 1 – The investigation of the powder factor - SAG mill throughput relation

using SmartTags™

A PIO project was conducted at a large copper mine and SmartTags were used to track ore from the

audited blast through to the SAG mill. While the ore was being processed, large swings in SAG mill

throughput were observed. Figure 5 shows SAG Mill throughput versus time with the arrival times

of tags superimposed.

In an attempt to correlate the 3D powder factor simulated by JKSimBlast with SAG mill

throughput, two time periods where chosen when the mill throughput was stable and low, and stable

and high, and when a number of tags were detected on the mill feed antenna. In Figure 5, the

darker, earlier tags are those that correspond to a low throughput of approximately 2400tph and the

lighter, later tags correspond to a high throughput of 3000tph. It should be noted that the tags shown

in Figure 5 represent both in-hole and surface tags.

The 3D powder factor was then imported into a visualisation package and the in-hole tags were

superimposed on the powder factor. For the purposes of this exercise only in-hole tags were

considered, as the original position of the tag can be directly related to each blast hole.

Figure 6 shows the location of the tags and the powder factor distribution in 3D. In Figure 6, the

hotter the colour, the higher the local powder factor, and it is possible that the higher mill

throughput was due, in part at least, to the fact that the holes were spaced closer than the rest of the

blast which increased the explosive energy imparted on the rock mass.

CASE STUDY 2 – Fragmentation Measurement and Modelling

Detailed blasting audits were conducted at number of mine sites, which included rock mass

characterisation, blast monitoring (Velocity of Detonation measurements, vibration, high-speed

camera, material tracking), fragmentation measurement and diggability. Table 1 summarises some of

the fragmentation measurement results obtained from operations. It is shown that all three mines have

variability in fragmentation and Mine 3 had the coarsest fragmentation and most variable P80. In

general, variable fragmentation is observed for the following main reasons:

• Issues in blast implementation (hole location, depth, charge length, stemming)

• Variability in rock properties

• Explosive performance (variations in VoD and density)

• Initiation accuracy

In Table 2, the current and alternative blast designs were given for a certain domain of Mine 2.

Three additional blast designs were reviewed for this specific domain with the 0.49kg/t powder

factor design (Design 1) being recommended. This blast design represents a 32% increase in

powder factor for the production holes and resulted in reduction in ROM P80 and increase in the

percent of material smaller than 1 inch. Wall-control techniques were suggested when blasting in

the vicinity of the final and interim walls. An example is given in Figure 7 in which pre-split and

buffer rows are included in the design. As shown in Figure 7, the powder factor decreased from

490g/t to 200-300g/t at the rear end of the blast. The design included the use of pre-splitting

technique and two rows of buffer blastholes (6 1/2”).

The impact of the change in blast design (current design into Design 1) on mill throughput was

simulated and mill throughput increases of 15 to 20% could be achieved if blasting and

comminution strategies are combined (i.e. finer ROM fragmentation and changes in primary crusher

and milling operating parameters). Blasting, crushing and grinding operational strategies were

reported to the mine (Dance et al, 2006).

A PIO Project was recently conducted at a large copper-zinc operation in South America. This

operation wanted to increase the throughput of a particular ore type that historically processed

between 2,300 and 3,300tph. The study revealed a number of opportunities for improving ROM

fragmentation through blast design changes including explosive selection, drill pattern and initiation

(sequence, delay timing selection). A trial blast was conducted on material containing this ore type

and resulted in significantly finer fragmentation. When processed exclusively in the concentrator,

the throughput increased by 50% to over 4,800tph. Trials are continuing at this site with further

refinements to the blast design to maintain this concentrator performance and optimise blasting

costs and control vibrations transmitted to the final wall.

Figure 8 shows an example showing the effect of SAG feed size on SAG mill throughput at a

copper mine where SAG mill feed size was measured by on-line image analysis system. SAG mills

require a certain ore feed size distribution to operate efficiently. This feed is supplied to the mill by

the primary crusher, which is also influenced by the size distribution achieved from blasting.

Significant effort has been spent at a number of operations to relate SAG mill throughput with SAG

mill feed size. Very good correlations have been obtained demonstrating that the finer the topsize

and F80 of the mill feed, the higher the mill throughput.

CASE STUDY 3 - THROUGHPUT FORECASTING

In this project, rock characterisation and blast domain definition were used to improve existing

throughput forecasting models developed by site personnel. The rock characterisation was based on

measurements of drillcore and the fragmentation and grinding models developed were calibrated to

site conditions using measurements collected while at site.

Based on measurements of Point Load Index and RQD taken from drillcore, the four lithological

groups (Volcanic, Diorite, Intermediate Tonalite and Young Tonalite) were divided into sub-

domains of similar properties (see Figure 9). Some of the domains were combined with adjacent

ones and the resulting rock characterisation map produced 16 distinct domains.

As discussed above, point load strength value can be correlated to JKMRC drop weight parameters

which are necessary to model the comminituion circuits. An example of such a relation is shown in

Figure 10. It is important to note that this database is site-specific and the relation between Is and

drop weight parameters should be established for each mine site.

For each of the 16 domains, a standard blast pattern was recommended. For flexibility, both high

and low powder factor designs were provided for each domain. The exclusive use of these designs

not only compensated for the different rock properties and stabilised the ROM fragmentation, it

resulted in crusher and mill performance that was more predictable by the model. In other words, by

minimising changes in the ROM size, the throughput model could more accurately predict

concentrator throughput. Deviations from the recommended blast designs would result in the model

over or underestimating mill production.

In addition to the blast fragmentation model, crushing and grinding circuit models were produced

with the output of one becoming the feed to the next as described in Figure 2. Following the flow of

data in Figure 2, ore characterisation and blast domain information were combined with the blast

design conditions into the fragmentation model. The resulting ROM size distribution was then fed

to the primary crusher model along with the rock properties. The primary crusher product size

distribution was then input into the grinding circuit model that allowed estimates of throughput,

specific energy requirements and final product size. In the future, it is expected to include a site-

developed grind/recovery model of flotation.

The throughput forecasting model estimates the mill performance for each of the domains in the

daily blend of material. The overall mill performance is then calculated based on the amount of

each domain sent to the concentrator. This operation has collected a considerable amount of

information on their daily concentrator feed and this data was used to confirm the accuracy of the

throughput model.

A comparison of the modelled and actual production for an eighteen month period is shown in

Figure 11. The model has been shown to be quite accurate and very useful in both mine planning

(until end of mine life) and interpreting daily concentrator performance. The model estimates ‘ideal’

blasting, crushing and grinding performance and the predicted mill throughput then represents what

is achievable by the operation with good blast implementation as well as consistent crusher and

grinding circuit operation.

CONCLUSIONS

Over the past 10 years, Metso Minerals Process Technology Asia-Pacific & South America has

developed a proven methodology for optimising the mine-concentrator interface. This involves

characterisation of rock strength and structure using simple and effective measurements that can be

performed by site personnel at little expense. These are correlated to more comprehensive

measurements like the JKMRC Drop Weight test which can be used in the modelling of downstream

processes such as crushing and grinding. The end result is a mapping of rock mass characteristics into

blasting domains that, when blasted similarly, result in similar performance in the plant.

Based on the domain definitions, blasting, crushing and grinding models are used to determine specific

operating and control strategies that optimise the efficiency of processing each domain. This

methodology has been used in a wide range of applications from conventional circuit optimisation,

throughput forecasting and greenfield operations. For existing operations, significant increases in

performance have been realised through the application of this methodology.

REFERENCES

Brown, E.T., 2002. Block Caving Geomechanics. JKMRC Monograph series in mining and mineral

processing 3. JKMRC, Australia.

Dance, A., Valery Jnr., W., Jankovic, A., La Rosa, D., Esen, S., 2006. Higher Productivity Through

Cooperative Effort: A Method Of Revealing And Correcting Hidden Operating Inefficiencies.

SAG2006 – HPGR, Geometallurgy, Testing. International Conference on Autogenous and

Semiautogenous Grinding Technology, Volume 4, 375 – 390, Vancouver, Canada.

Esen, S., Onederra, I. and Bilgin, H., 2003. Modelling the size of the crushing zone around a

blasthole. International Journal of Rock Mech.and Min. Sci. (40), 485-495.

Guyot, O., Monredon, T., La Rosa, D. and Broussaud, A., 2004. VisioRock, an Integrated Vision

Technology for Advanced Control of Comminution Circuits, paper presented at the 5th Annual

I.I.R. Crushing and Grinding Conference, Townsville, Australia. 29-30 March 2004.

Jankovic, A., W., Valery Jnr., Clarke, G., 2006. Design And Implementation Of An AVC Grinding

Circuit at BHP Billiton Cannington. SAG2006 – Circuit Design. International Conference on

Autogenous and Semiautogenous Grinding Technology, Volume 2, 290 – 300, Vancouver, Canada.

Kanchibotla, S.S., Valery, W. and Morrell, S., 1999. Modelling fines in blast fragmentation and its

impact on crushing and grinding. Explo’99 – A conference on rock breaking. The Australasian

Institute of Mining and Metallurgy, Kalgoorlie, Australia: 137-144.

La Rosa, D., Girdner, K., Valery Jnr., W. and Abramson, S., 2001. Recent Applications Of The

Split-Online Image Analysis System. Proceedings of the Southern Hemisphere Meeting on

Mineral Technology – Volume 1, Rio de Janeiro, Brazil, 27th May – 1st June 2001, pp 15-19.

La Rosa, D., Valery, W., Wortley, M., Ozkocak, T., Pike, M., 2007. The use of radio frequency ID tags

to track ore in mining operations. APCOM-2007: 33rd

Application of Computers and Operations

Research in the Mineral Industry, Santiago, Chile. pp. 601-606.

McCaffery K., Mahon J, Arif J, Burger B, 2006. Batu Hijau – controlled mine blasting and blending to

optimise process production at Batu Hijau. SAG2006 – Circuit Design. International Conference on

Autogenous and Semiautogenous Grinding Technology, Vancouver, Canada.

Palmstrom, A., 2005. Measurements of and correlations between block size and rock quality

designation (RQD). Tunnelling and Underground Space Technology 20, 362–377.

Powell, M., Valery Jnr., W., 2006. Slurry Pooling and Transport Issues In SAG Mills. SAG2006 –

Operations and Maintenance. International Conference on Autogenous and Semiautogenous

Grinding Technology, Volume 1, 133 – 152, Vancouver, Canada.

Powell, M., Condori, P., Smit, I., Valery Jnr., W., 2006. The Value of Rigorous Surveys – The Los

Bronces Experience. SAG2006 – Operations and Maintenance. International Conference on

Autogenous and Semiautogenous Grinding Technology, Volume 1, 233 – 248, Vancouver, Canada.

Renner,D., La Rosa. D., DeKlerk, W., Valery Jnr., W., Sampson, P., Bonney Noi, S., Jankovic, A.,

2006. Anglogold Ashanti Iduapriem Mining And Milling Process Integration And Optimisation.

SAG2006 – Operations and Maintenance. International Conference on Autogenous and

Semiautogenous Grinding Technology, Volume 1, 249 – 264, Vancouver, Canada.

Onederra, I., Esen, S. and Jankovic, A., 2004. Estimation of fines generated by blasting -

applications for the mining and quarrying industries, Transactions of the Institution of Mining

and Metallurgy, Vol 113, pp. A237-A247.

Tondo L.A., Valery Jnr. W., Peroni, R., La Rosa, D., Silva, A., Jankovic, A., Colacioppo, J., 2006.

Kinross’ Rio Paracatu Mineração (RPM) Mining And Milling Optimisation Of The Existing And

New SAG Mill Circuit. SAG2006 – Circuit Design. International Conference on Autogenous and

Semiautogenous Grinding Technology, Volume 2, 301 – 313, Vancouver, Canada.

Figure 1. Spatial UCS and RQD data.

Ore CharacterisationLithology zonesRock Strength - Point Load Index

- Drop Weight Test results- Work Indices

Rock Structure - Rock Quality, FF, Mapping

Blast Design

MMPT-AP Blast Fragmentation

Model

ROM Ore size Distribution

Blast Design

MMPT-AP Blast Fragmentation

Model

ROM Ore size Distribution

Grinding Circuit Model (JKSimMet and

MMPT-AP models)

Throughput

Final Grind Size

Grinding Circuit Model (JKSimMet and

MMPT-AP models)

Throughput

Final Grind Size

Primary Crusher Model (JKSimMet and

MMPT-AP models)

SAG Feed Size Distribution

1 10 100 1000

100

80

60

40

20

0

Particle Size (mm)

Primary Crusher Model (JKSimMet and

MMPT-AP models)

SAG Feed Size Distribution

1 10 100 1000

100

80

60

40

20

0

Particle Size (mm)

1 10 100 1000

100

80

60

40

20

0

100

80

60

40

20

0

Particle Size (mm)

Figure 2. MMPT modelling methodology.

Figure 3. Typical flow of blasted ore and the SmartTag™.

29.8m

14.3m

23.3m

24.6

m

12.3m

23.6m

25.5m32

.2m

17.7m

8.7

m

10.8

m

21.2

m

12.6

m

17.7

m

17.7

m

Tag initial position

Tag excavated position

Figure 4: Example of tag movements measured utilising dispatch systems.

1500

1700

1900

2100

2300

2500

2700

2900

3100

3300

3500

15-Jan 00:00 15-Jan 12:00 16-Jan 00:00 16-Jan 12:00 17-Jan 00:00 17-Jan 12:00

Time

Th

rou

gh

pu

t (t

ph

)

0

200

400

600

800

1000

1200

Tag

nu

mb

er

SAG Tonnage

Detected Tags

'Low' throughput 'High' throughput

Figure 5: SAG Mill throughput and tag arrival versus time.

Figure 6: Possible relationship between powder factor and mill throughput.

0.0 2.5 6.0 9.7 15.4

-20.0

-15.0

-10.0

-5.0

0.0

5.0

10.0

15.0

20.0

600 mm/s

Pr.. Row 1 Row 2 Row 3 Row 4 40g/t 250 290 390 430

0.0 2.5 6.0 9.7 15.4

-20.0

-15.0

-10.0

-5.0

0.0

5.0

10.0

15.0

20.0

600 mm/s

Pr.. Row 1 Row 2 Row 3 Row 4 40g/t 250 290 390 430

Heig

ht,

m

Row #Powder factor, g/t

Distance from crest, m0.0 2.5 6.0 9.7 15.4

-20.0

-15.0

-10.0

-5.0

0.0

5.0

10.0

15.0

20.0

600 mm/s

Pr.. Row 1 Row 2 Row 3 Row 4 40g/t 250 290 390 430

0.0 2.5 6.0 9.7 15.4

-20.0

-15.0

-10.0

-5.0

0.0

5.0

10.0

15.0

20.0

600 mm/s

Pr.. Row 1 Row 2 Row 3 Row 4 40g/t 250 290 390 430

Heig

ht,

m

Row #Powder factor, g/t

Distance from crest, m

Figure 7. Wall control blast design at Mine 2. Vibrations contours are at 600mm/s.

Figure 8. SAG feed size vs. throughput & specific energy (Dance et al, 2006).

Volcanic

Diorite

Intermediate

Tonalite

Young

Tonalite

RQD 0 - 30

RQD 30 - 60

RQD >60

RQD 0 - 30

RQD 30 - 60

RQD >60

RQD 0 - 30

RQD 30 - 60

RQD >60

RQD 0 - 30

RQD 30 - 60

RQD >60

V-FS

V-MM V-MH

V-CM V-CH

D-FS

IT-MH

YT-CH

V-FH

IT-MM

IT-CH

V-CS

D-FM

D-CHD-CS D-CM

PLI 0 - 3 PLI 3 - 6 PLI >6 HardnessHardness(Point Load Index)(Point Load Index)

HardnessHardness(Point Load Index)(Point Load Index)

Block Size Block Size (Rock Quality Designation)(Rock Quality Designation)Block Size Block Size (Rock Quality Designation)(Rock Quality Designation)

Ore TypeOre TypeOre TypeOre Type

Figure 9. Blast Domain Mapping (16 Domains).

Point load strength, MPa

Dro

p w

eight

par

amet

er

Point load strength, MPa

Dro

p w

eight

par

amet

er

Figure 10. Point load strength versus drop weight test parameter.

2,000

3,000

4,000

5,000

6,000

7,000

8,000

De

c-0

2

Fe

b-0

3

Ap

r-0

3

Ju

n-0

3

Au

g-0

3

Oc

t-0

3

De

c-0

3

Fe

b-0

4

Ap

r-0

4

Ju

n-0

4

Au

g-0

4

Oc

t-0

4

De

c-0

4

Fe

b-0

5

Ap

r-0

5

Ju

n-0

5

Au

g-0

5

Oc

t-0

5

De

c-0

5

Ma

r-0

6

Ma

y-0

6

Co

nc

en

tra

tor

To

nn

ag

e (

tph

)

Actual

Latest Model

Figure 11. Throughput Model Predictions.

Table 1. Summary of fragmentation (P80: 80% passing size) results.

UCS, MPa Burden x Spacing, m P80, mm

Mine 1 90 7.0 x 8.0 401 ± 224

Mine 2 172 6.0 x 8.0 374 ± 146

Mine 3 105 7.5 x 9.6 981 ± 328

Table 2. Current and proposed blast designs.

Design Hole

dia.,

(mm)

Burden x

Spacing

(m)

Explosive

Type

Powder

Factor

(kg/t)

Predicted

% -1 inch

Predicted

P80

(mm)

Current

design

311 6.0 x 8.0 Explosive1 0.37 24.5 374

Design1 311 5.9 x 7.4 Explosive2 0.49 30.6 289

Design2 279 5.3 x 6.6 Explosive2 0.52 31.3 258

Design3 241 4.5 x 5.72 Explosive2 0.55 32.3 225


Recommended