30
Integration of AASHTO 2002 and NJDOT PMS February 2003

Integration of AASHTO 2002 and NJDOT PMS
February 2003

AASHTO 2002 Guide(Mechanistic-Empirical)

Design Input Levels
Allows different levels of confidence in the design procedureAllows for different levels of design budgetsThe levels are:
Level 1 (Most Accurate) – Uses primarily measured dataLevel 2 – Uses primarily estimated input dataLevel 3 (Least Accurate) – Uses assumed input data

Overview of NJDOT PMS

NJDOT PMS Modules
Highway DatabaseDynamic SectioningSection Data ReportingM&R Analysis & OptimizationProject Design AnalysisEngineering Feedback Analysis

HPMA Data Attributes

Highway Data Browse

Highway Information
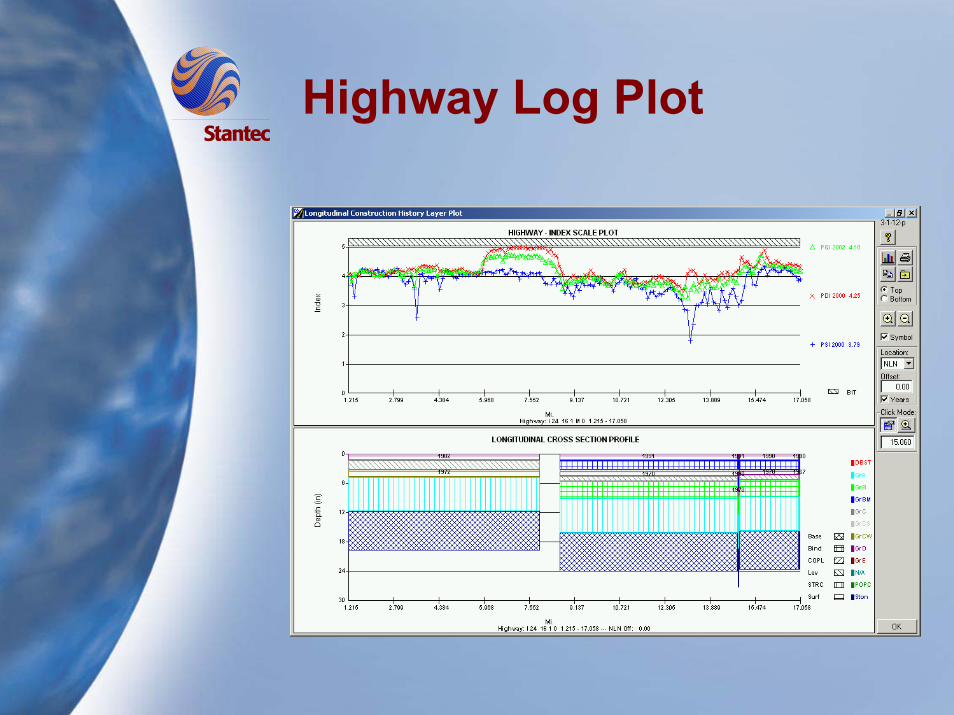
Highway Log Plot
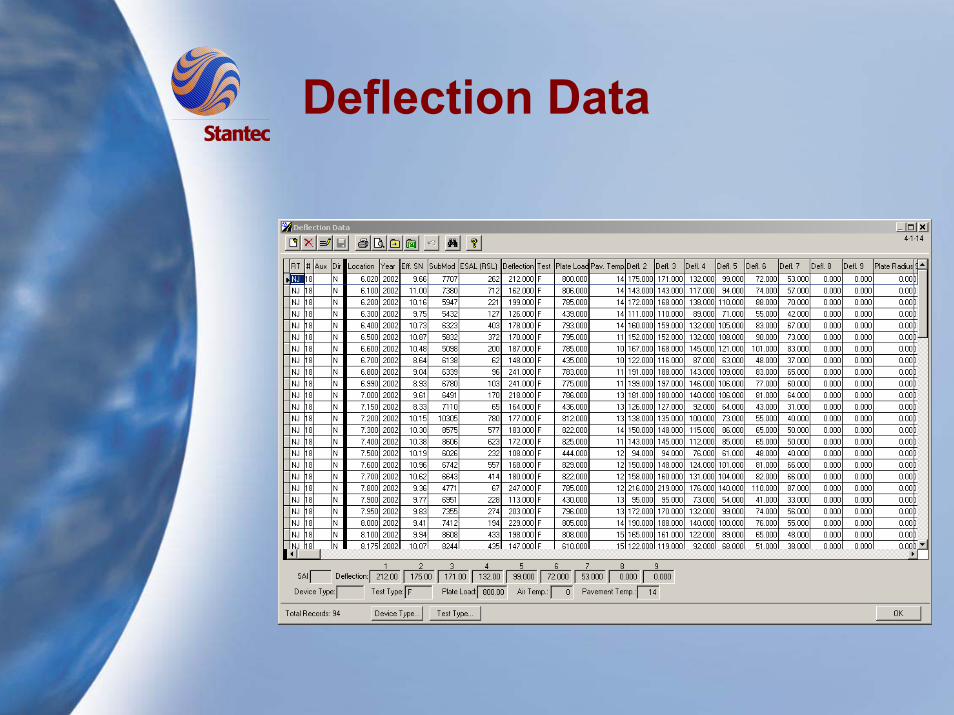
Deflection Data

Current Road Performance
HIGHWAY - RQI RANGE PLOT
Mi.
20.000 23.000 26.000 29.000 32.000 35.000 38.000 41.000 44.000 47.000 50.000
0.1-1.0
1.1-2.0
2.1-3.0
3.1-4.0
4.1-5.0
BC CO RC
Highway: I 295 0 0 N 0 20.000 - 50.000
1989
1990
1991
1992
1993
1994
1995
1996
1997
1998

Highway Performance

Index Prediction Example

Default Performance Models
ESAL 1 / SN 1
00.5
11.5
22.5
33.5
44.5
5
0 5 10 15 20Age (Years)
RQ
I
Mill 2" Overlay 4"
Mill 2" Overlay 6"
Mill 2" Overlay 2"
Overlay 2"
PartialReconstructionFullReconstruction
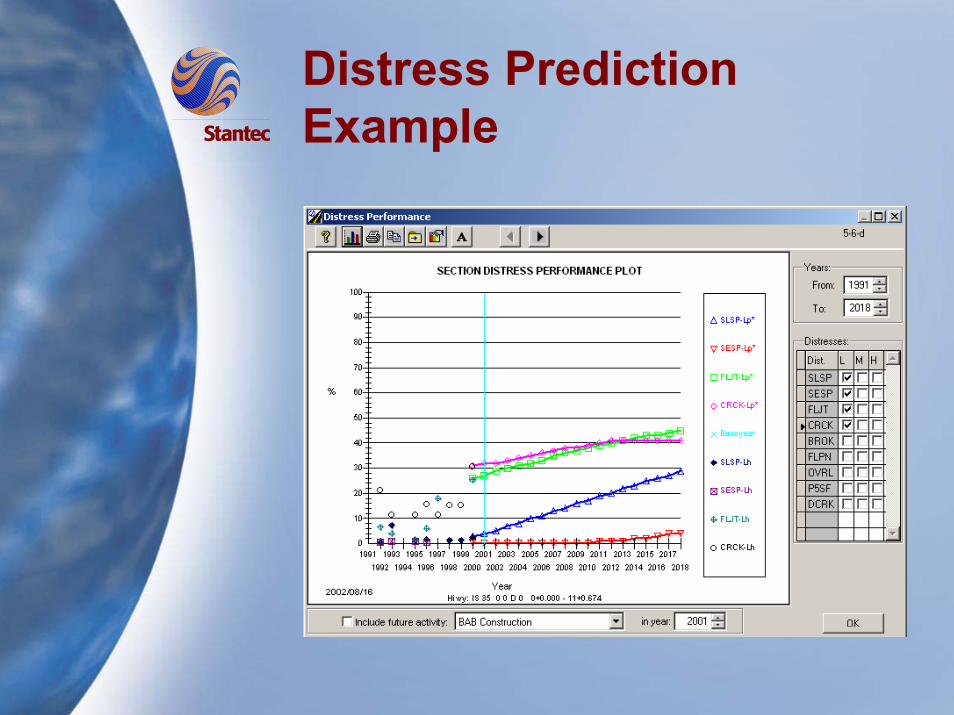
Distress Prediction Example

Highway Distress

Highway Images

Detailed Layer InformationMaterial properties can be stored to increase accuracy level of rehabilitation activitiesMaterial variability and reliability information can be accumulatedLayer thickness and variability information from as-built documents, coring, and non-destructive methods (GPR)

Highway Cross-Section

Highway Layer Graph

M & R Treatments

Project Design Analysis
Standard or Staged AlternativesDetailed User Delay Cost AnalysisLife Cycle Cost Analysis

Life Cycle Analysis (RQI)
PROJECT INDEX PERFORMANCE PLOT
RQIp
RQIh
RQI- 1
RQI- 2
RQI- 3
Prj Yr
Index
Year
0
1
2
3
4
5
2000 2006 2012 2018 20242003 2009 2015 2021 2027
1998/07/23 ID: Example-FWDS Seg #: 1 Yr: 2000 HWY: ST 29 B 26.300 - 30.800
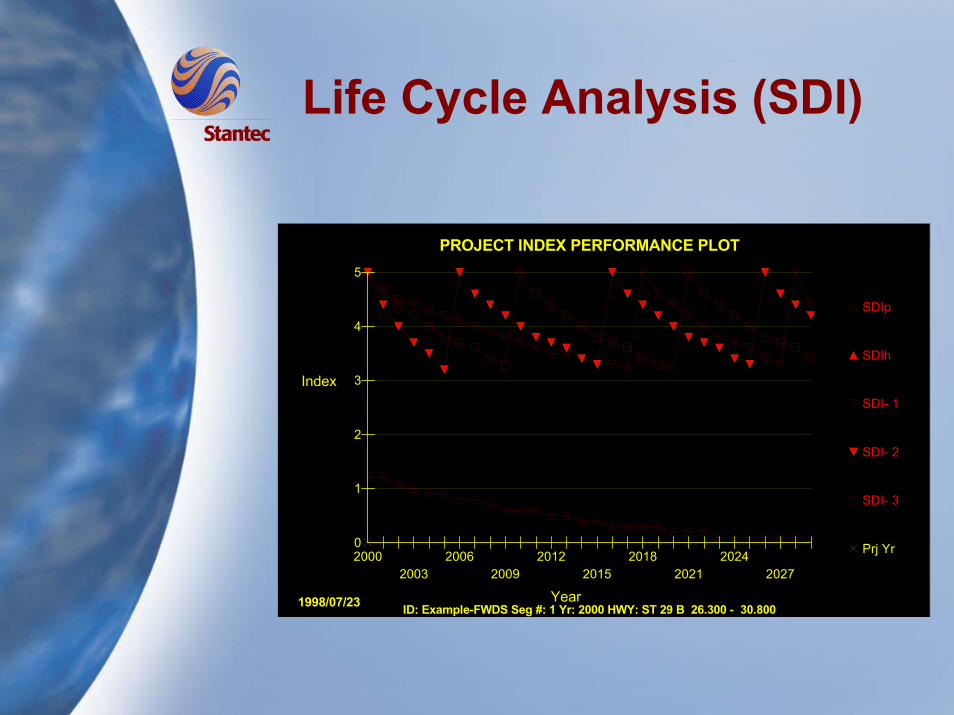
Life Cycle Analysis (SDI)
PROJECT INDEX PERFORMANCE PLOT
SDIp
SDIh
SDI- 1
SDI- 2
SDI- 3
Prj Yr
Index
Year
0
1
2
3
4
5
2000 2006 2012 2018 20242003 2009 2015 2021 2027
1998/07/23 ID: Example-FWDS Seg #: 1 Yr: 2000 HWY: ST 29 B 26.300 - 30.800
Feedback Analysis
Analysis of Historical DatabaseUpdate Prediction ModelsAnalyze Treatment EffectivenessTrack Work Programs

Index Prediction Models
Performance Prediction Models
0
2
4
6
8
10
0 5 10 15 20Age
Per
form
ance
ModelActual
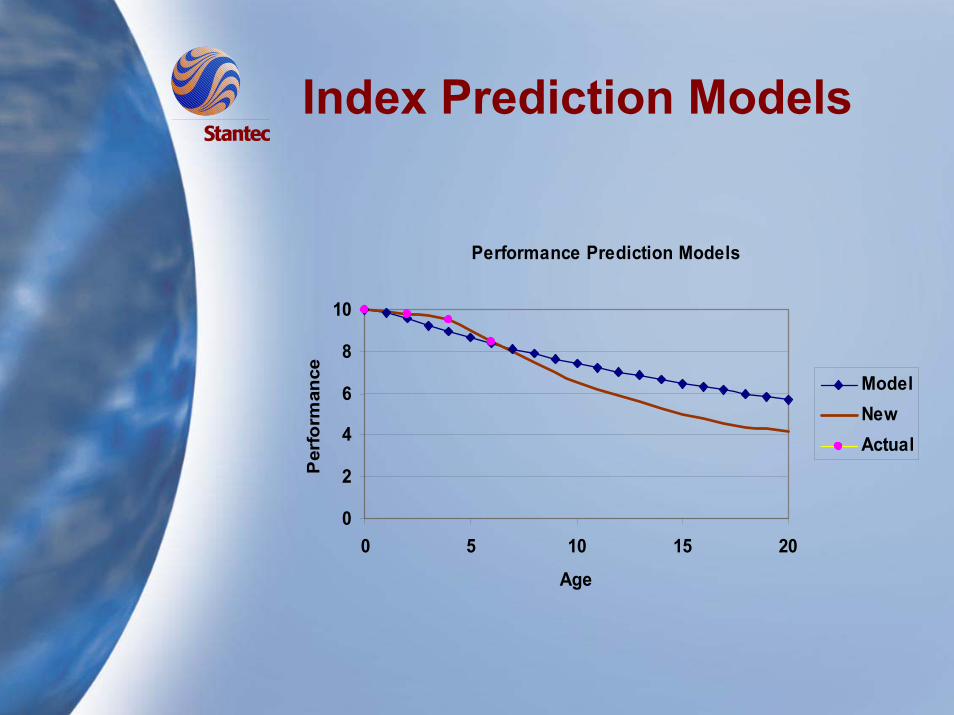
Index Prediction Models
Performance Prediction Models
0
2
4
6
8
10
0 5 10 15 20Age
Per
form
ance Model
NewActual

Index Prediction Models
Performance Prediction Models
0
2
4
6
8
10
0 5 10 15 20Age
Per
form
ance Original Model
Revised 1ActualRevised 2

Index Model Feedback

Thank You...


