1 2 3 4 5 29 Innovative Design BESSSB13 CALIFORNIA: Advancing Towards Net Zero. Pomona, California, USA. 2425 June 2013 Integration of Environmental Sensors with BIM Seven Case Studies KAREN KENSEK 1 , WINSTON KAHN 1 1 School of Architecture, University of Southern California, Los Angeles, USA ABSTRACT: This paper investigates the feasibility of connecting environmental sensors such as light, humidity, or CO2 receptors to a building information model (BIM). A base case was created in Rhino; using Grasshopper and Firefly, a simple digital model responded to lighting-levels detected by a photoresistor on an Arduino board. The case study was duplicated using Revit Architecture, a popular BIM software, and Dynamo, a visual programming environment, in an innovative application. Another case study followed a similar procedure by implementing the Revit API directly instead of using Dynamo. Then the process was reversed to demonstrate that not only could data could be sent from sensors to change the 3d model, but changes to parameters of a 3d model could effect a physical model through the use of actuators. It is intended that these virtual/physical prototypes could be used as the basis for testing intelligent façade systems before constructing full size mock-ups. Keywords: environmental sensors, BIM, building information model, visual scripting, Dynamo, intelligent facades 1. BACKGROUND Designers have sought both passive methods and active systems to have their buildings respond to changing environmental conditions. Many historic examples exist that show the use of passive methods using natural features to manage daylight, as evidenced at Mesa Verde, or mitigating seasonal heat variation by the use of shade and thermal mass in the southwest United States at Acoma (Knowles 1981). Active systems have also been incorporated, ranging from those that require direct occupant participation to those that are completely automated building systems with embedded computation. Despite past problems in actuating full size components, the concept of kinetic architecture is flourishing as an exercise in combining aesthetics with energy conservation practices, including daylight harvesting and solar heat gain avoidance (Fox and Kemp 2009). This requires what Fox and Kemp refer to as “environmental cognizance,” the ability to not only measure values such as temperature, humidity, sun location, solar radiation, rain, etc., but to also have a building be aware of these conditions and respond to those inputs. Intelligent building facades rely on the ability to respond to climatic data. In order to predict the future performance of building components, it is useful to initially create a virtual model and connect it to sensors to see if the responses of the components are appropriate. Visual scripting tools are one method for bridging the hardware/software gap between sensors and 3d modeling software. Some designers are effectively and enthusiastically using these tools to generate parametric, form-based solutions for buildings. At NBBJ, architects used Rhino and Grasshopper for the design of the Hangzhou Tennis Center. By defining the geometry of the structure in a visual scripting language, the architects could mathematically describe numerous formal variations in response to various tolerances (Miller 2011). Many comparable examples exist in the fields of architecture, construction, and academia due to the popularity of Grasshopper. This preference for Grasshopper could be attributed to the following: its direct relationship to Rhino, a popular 3d modeling program; a substantial group of independent developers who provide support and new components; its availability free of charge; and the development of tools such as DIVA used for performance evaluations (Rheinhart et. al. 2010). In one example, moveable light shelf angles were optimized for daylight availability. The designer
Transcript
1
2
3
4
5
29
Inn
ovativ
e D
esig
n
BESS-‐SB13 CALIFORNIA: Advancing Towards Net Zero. Pomona, California, USA. 24-‐25 June 2013
Integration of Environmental Sensors with BIM Seven Case Studies
KAREN KENSEK1, WINSTON KAHN1
1School of Architecture, University of Southern California, Los Angeles, USA
ABSTRACT: This paper investigates the feasibility of connecting environmental sensors such as light, humidity, or CO2 receptors to a building information model (BIM). A base case was created in Rhino; using Grasshopper and Firefly, a simple digital model responded to lighting-levels detected by a photoresistor on an Arduino board. The case study was duplicated using Revit Architecture, a popular BIM software, and Dynamo, a visual programming environment, in an innovative application. Another case study followed a similar procedure by implementing the Revit API directly instead of using Dynamo. Then the process was reversed to demonstrate that not only could data could be sent from sensors to change the 3d model, but changes to parameters of a 3d model could effect a physical model through the use of actuators. It is intended that these virtual/physical prototypes could be used as the basis for testing intelligent façade systems before constructing full size mock-ups. Keywords: environmental sensors, BIM, building information model, visual scripting, Dynamo, intelligent facades
1. BACKGROUND Designers have sought both passive methods and active systems to have their buildings respond to changing environmental conditions. Many historic examples exist that show the use of passive methods using natural features to manage daylight, as evidenced at Mesa Verde, or mitigating seasonal heat variation by the use of shade and thermal mass in the southwest United States at Acoma (Knowles 1981). Active systems have also been incorporated, ranging from those that require direct occupant participation to those that are completely automated building systems with embedded computation. Despite past problems in actuating full size components, the concept of kinetic architecture is flourishing as an exercise in combining aesthetics with energy conservation practices, including daylight harvesting and solar heat gain avoidance (Fox and Kemp 2009). This requires what Fox and Kemp refer to as “environmental cognizance,” the ability to not only measure values such as temperature, humidity, sun location, solar radiation, rain, etc., but to also have a building be aware of these conditions and respond to those inputs. Intelligent building facades rely on the ability to respond to climatic data.
In order to predict the future performance of building components, it is useful to initially create a virtual model and connect it to sensors to see if the responses of the components are appropriate. Visual scripting tools are one method for bridging the hardware/software gap between sensors and 3d modeling software. Some designers are effectively and enthusiastically using these tools to generate parametric, form-based solutions for buildings. At NBBJ, architects used Rhino and Grasshopper for the design of the Hangzhou Tennis Center. By defining the geometry of the structure in a visual scripting language, the architects could mathematically describe numerous formal variations in response to various tolerances (Miller 2011). Many comparable examples exist in the fields of architecture, construction, and academia due to the popularity of Grasshopper. This preference for Grasshopper could be attributed to the following: its direct relationship to Rhino, a popular 3d modeling program; a substantial group of independent developers who provide support and new components; its availability free of charge; and the development of tools such as DIVA used for performance evaluations (Rheinhart et. al. 2010). In one example, moveable light shelf angles were optimized for daylight availability. The designer
30
BESS-‐SB13 CALIFORNIA: Advancing Towards Net Zero. Pomona, California, USA. 24-‐25 June 2013
used DIVA and Daysim for daylighting calculations with Rhino and Grasshopper including Galapagos, a genetic algorithm component used for optimization. This study demonstrated that a kinetic façade system can contribute to better illumination levels in a space through daylight harvesting, in turn reducing the reliance upon artificial lighting systems and saving energy energy. (El Sheikh and Kensek 2011). However, Rhino itself is not a parametrically based modeling tool. Other researchers have experimented with using scripting or graphical algorithm editors to create a connection between parametric modeling and environmental simulation. One work in progress is the development of a parametric modeling based method for evaluating façade configurations for hot and humid climates (Velasco and Robles 2011). “Daren Thomas of the Professur für Gebäudetechnik, Institut für Hochbautechnik at the technical university ETH Zürich has published a Python Shell for Revit. It was implemented using IronPython and is used to automate the running of daily tests of a building energy analysis package” (Tammik 2011). As building information models (BIM) are often used by architects, being able to use visual scripting with it would be an advantage. 2. METHODOLOGY Seven case studies (six successful) were accomplished to demonstrate the feasibility of connecting environmental sensors to control a BIM and established that the process could go in both directions, from real models to virtual models and from digital models to physical models. 2.1 A simple model was created in Rhino and Grasshopper that reacted to values output by a photoresistor on an Arduino board. Arduino is a single chip microcomputer that executes programs created in the Processing programming language. One can use it to as a software interface, control system for robots, data recorder, kinetic responsive art installations, and other applications. Firefly was the interface between Grasshopper and the Arduino micro-controller.
2.2 The same simple model from the first case study was re-created in Autodesk Revit (a BIM software program). Dynamo was used as the link between Revit and the Arduino board. The photoresistor on the Arduino board output values that controlled parameters in Revit. Dynamo is designed to extend Revit's parametric modeling capabilities by adding a level of associativity that does not exist in the off-the-shelf application including driving parameters based on external inputs, such as sensors, or by data taken from an analysis. One can map the appropriate parameters and dynamically change each value with a value derived from the input source. Dynamo was developed as a plugin to Autodesk Revit using the Revit API and built using the Windows Presentation Framework. Dynamo's look and feel is influenced by a number of visual programming interfaces that have come before including MaxMSP, the Maya Hypergraph, and LEGO MINDSTORMS NXT, which is based on National Instrument’s LabVIEW. As a parametric modeling engine, Dynamo takes its inspiration from Bentley's Generative Components and McNeel's Grasshopper for Rhino. This was the first time that Dynamo was used by someone besides its creator, Ian Keough. This prototype add-in for Revit was used to manipulate family parameters within the project environment; specialized code was being generated at the time to complete the case studies. Since then, applications of Dynamo have been demonstrated by other people. 2.3 A more complex 3d model was created in Revit that better portrayed the potential of controlling a 3d architecture model from the output of a photoresistor. Unchanged from case study 2, the photoresistor on the Arduino board output values that changed the parameters of components in Revit with Dynamo as the connective software. 2.4 Similar to the previous case, a photoresistor’s changing values caused a response in a 3d digital model. In this case, there was also a simultaneous change in a 3d physical model. 2.5 Whereas the first three case studies used values from a photoresistor to control a Revit model, the fourth case study was designed so
1
2
3
4
5
31
Inn
ovativ
e D
esig
n
BESS-‐SB13 CALIFORNIA: Advancing Towards Net Zero. Pomona, California, USA. 24-‐25 June 2013
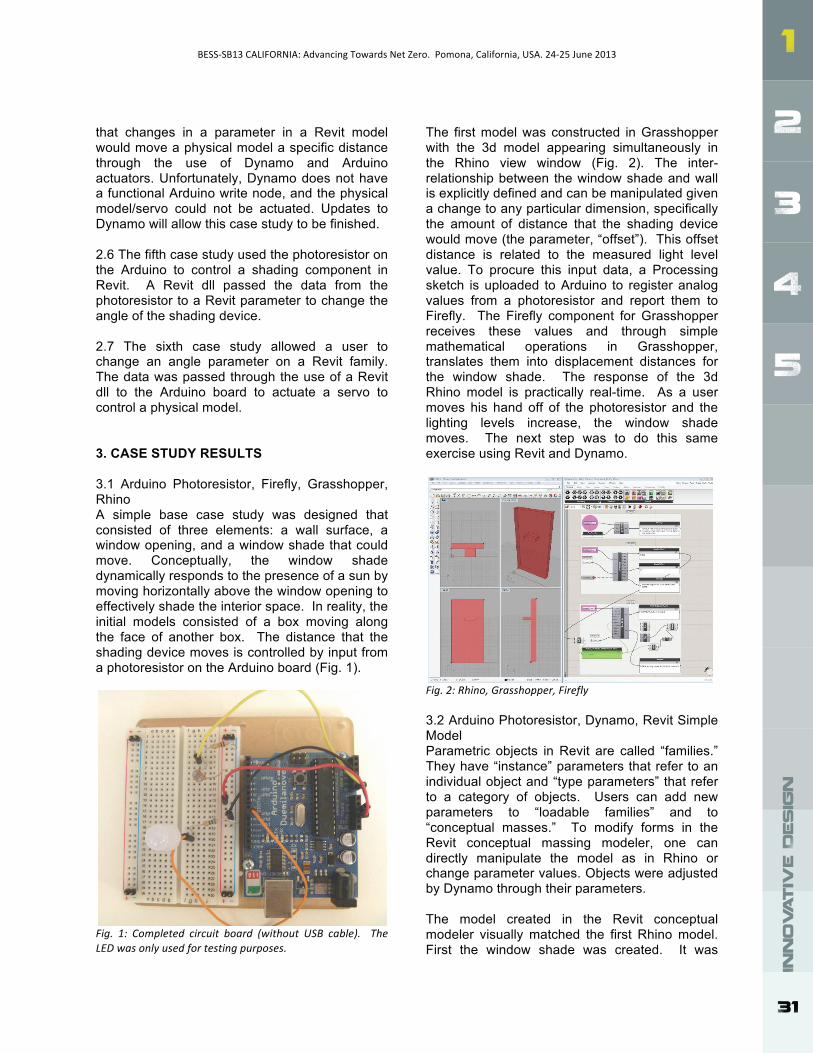
that changes in a parameter in a Revit model would move a physical model a specific distance through the use of Dynamo and Arduino actuators. Unfortunately, Dynamo does not have a functional Arduino write node, and the physical model/servo could not be actuated. Updates to Dynamo will allow this case study to be finished. 2.6 The fifth case study used the photoresistor on the Arduino to control a shading component in Revit. A Revit dll passed the data from the photoresistor to a Revit parameter to change the angle of the shading device. 2.7 The sixth case study allowed a user to change an angle parameter on a Revit family. The data was passed through the use of a Revit dll to the Arduino board to actuate a servo to control a physical model. 3. CASE STUDY RESULTS 3.1 Arduino Photoresistor, Firefly, Grasshopper, Rhino A simple base case study was designed that consisted of three elements: a wall surface, a window opening, and a window shade that could move. Conceptually, the window shade dynamically responds to the presence of a sun by moving horizontally above the window opening to effectively shade the interior space. In reality, the initial models consisted of a box moving along the face of another box. The distance that the shading device moves is controlled by input from a photoresistor on the Arduino board (Fig. 1).
Fig. 1: Completed circuit board (without USB cable). The LED was only used for testing purposes.
The first model was constructed in Grasshopper with the 3d model appearing simultaneously in the Rhino view window (Fig. 2). The inter-relationship between the window shade and wall is explicitly defined and can be manipulated given a change to any particular dimension, specifically the amount of distance that the shading device would move (the parameter, “offset”). This offset distance is related to the measured light level value. To procure this input data, a Processing sketch is uploaded to Arduino to register analog values from a photoresistor and report them to Firefly. The Firefly component for Grasshopper receives these values and through simple mathematical operations in Grasshopper, translates them into displacement distances for the window shade. The response of the 3d Rhino model is practically real-time. As a user moves his hand off of the photoresistor and the lighting levels increase, the window shade moves. The next step was to do this same exercise using Revit and Dynamo.
Fig. 2: Rhino, Grasshopper, Firefly 3.2 Arduino Photoresistor, Dynamo, Revit Simple Model Parametric objects in Revit are called “families.” They have “instance” parameters that refer to an individual object and “type parameters” that refer to a category of objects. Users can add new parameters to “loadable families” and to “conceptual masses.” To modify forms in the Revit conceptual massing modeler, one can directly manipulate the model as in Rhino or change parameter values. Objects were adjusted by Dynamo through their parameters. The model created in the Revit conceptual modeler visually matched the first Rhino model. First the window shade was created. It was
32
BESS-‐SB13 CALIFORNIA: Advancing Towards Net Zero. Pomona, California, USA. 24-‐25 June 2013
given two instance parameters: Light Level is a value from 0 to 255 that is received from the Arduino board; Offset Shade sets the distance of the shading device from the edge of the window based on Light Level. In a second file, the wall was created. The shading device family was inserted into the wall model. It was verified that the shading device was on the correct location on the wall, that it behaved properly based on changing the parameters values manually (a bit of tweaking took place here to convert the 0-255 values to reasonable distances), and that Arduino was providing data that Dynamo was receiving correctly. Once these nodes were connected, the shade was moved by Dynamo in Revit directly in response to the Arduino light level readings, although more slowly than in the first case study (Fig. 3).
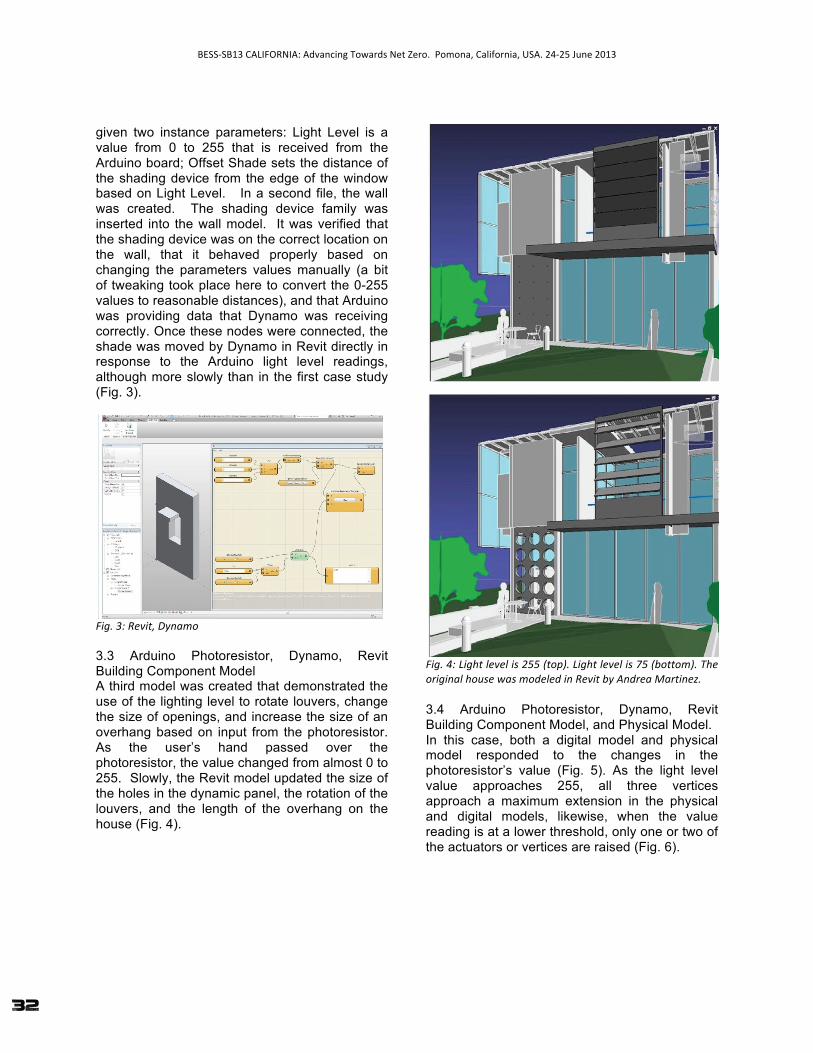
Fig. 3: Revit, Dynamo 3.3 Arduino Photoresistor, Dynamo, Revit Building Component Model A third model was created that demonstrated the use of the lighting level to rotate louvers, change the size of openings, and increase the size of an overhang based on input from the photoresistor. As the user’s hand passed over the photoresistor, the value changed from almost 0 to 255. Slowly, the Revit model updated the size of the holes in the dynamic panel, the rotation of the louvers, and the length of the overhang on the house (Fig. 4).
Fig. 4: Light level is 255 (top). Light level is 75 (bottom). The original house was modeled in Revit by Andrea Martinez. 3.4 Arduino Photoresistor, Dynamo, Revit Building Component Model, and Physical Model. In this case, both a digital model and physical model responded to the changes in the photoresistor’s value (Fig. 5). As the light level value approaches 255, all three vertices approach a maximum extension in the physical and digital models, likewise, when the value reading is at a lower threshold, only one or two of the actuators or vertices are raised (Fig. 6).
1
2
3
4
5
33
Inn
ovativ
e D
esig
n
BESS-‐SB13 CALIFORNIA: Advancing Towards Net Zero. Pomona, California, USA. 24-‐25 June 2013
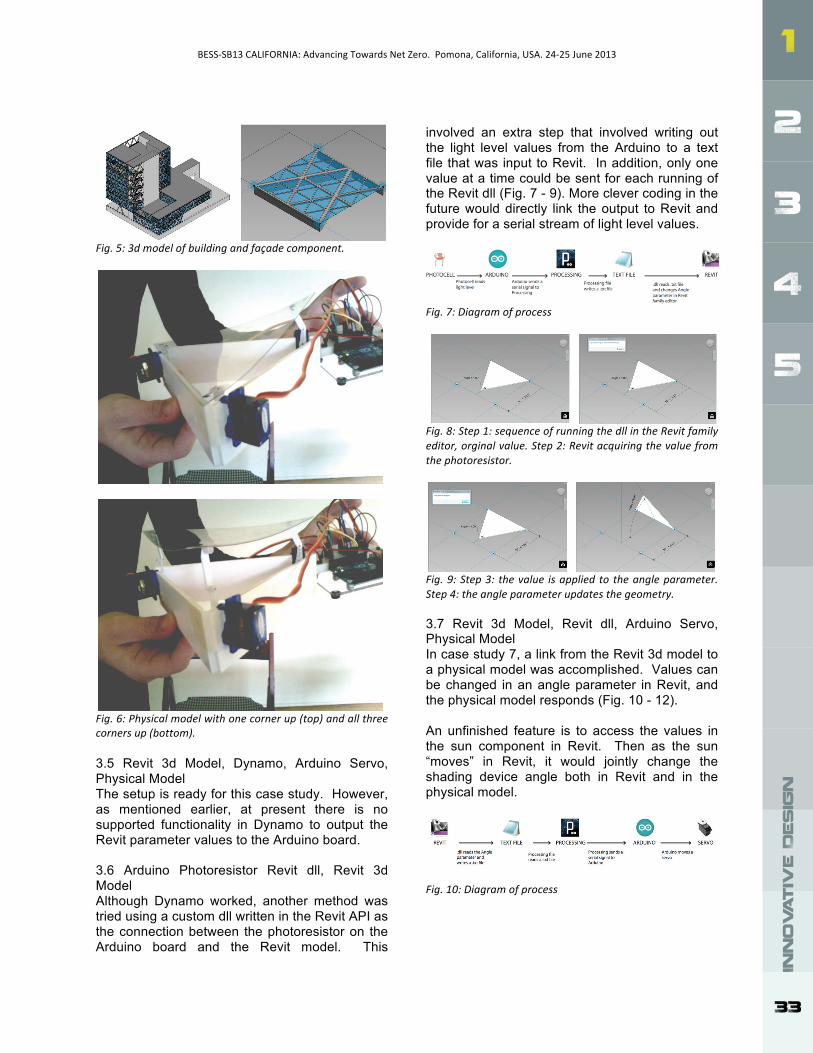
Fig. 5: 3d model of building and façade component.
Fig. 6: Physical model with one corner up (top) and all three corners up (bottom). 3.5 Revit 3d Model, Dynamo, Arduino Servo, Physical Model The setup is ready for this case study. However, as mentioned earlier, at present there is no supported functionality in Dynamo to output the Revit parameter values to the Arduino board. 3.6 Arduino Photoresistor Revit dll, Revit 3d Model Although Dynamo worked, another method was tried using a custom dll written in the Revit API as the connection between the photoresistor on the Arduino board and the Revit model. This
involved an extra step that involved writing out the light level values from the Arduino to a text file that was input to Revit. In addition, only one value at a time could be sent for each running of the Revit dll (Fig. 7 - 9). More clever coding in the future would directly link the output to Revit and provide for a serial stream of light level values.
Fig. 7: Diagram of process
Fig. 8: Step 1: sequence of running the dll in the Revit family editor, orginal value. Step 2: Revit acquiring the value from the photoresistor.
Fig. 9: Step 3: the value is applied to the angle parameter. Step 4: the angle parameter updates the geometry. 3.7 Revit 3d Model, Revit dll, Arduino Servo, Physical Model In case study 7, a link from the Revit 3d model to a physical model was accomplished. Values can be changed in an angle parameter in Revit, and the physical model responds (Fig. 10 - 12). An unfinished feature is to access the values in the sun component in Revit. Then as the sun “moves” in Revit, it would jointly change the shading device angle both in Revit and in the physical model.
Fig. 10: Diagram of process
34
BESS-‐SB13 CALIFORNIA: Advancing Towards Net Zero. Pomona, California, USA. 24-‐25 June 2013
Fig. 11: Parameter is 30 degrees in digital/physical models.
Fig. 12: Parameter is 45 degrees in digital/physical models. 4. DISCUSSION AND CONCLUSION Although the examples shown are simple, they prove that both workflows are successful: using a light sensor to drive parameters in a building information model and changing parameters in a 3d model to provide input for servos to move a physical model. Some difficulties were encountered, and the entire topic area of optimization was not explored in this case study. 4.1 Difficulties The interaction time in Dynamo/Revit is vastly slower than Grasshopper/Rhino. There were noticeable delays when the users moved their hands over the photoresistor. A primary challenge to overcome in the development of Dynamo is that of the speed of interactions with the database. Unlike Grasshopper, Dynamo has no concept of “volatile” geometry, that is, geometry that is visualized but does not get committed to the database until the user “bakes” it. For Grasshopper this provides a benefit in terms of the speed with which a workflow can be evaluated. In Dynamo, the evaluation speed of the workflow will always be tied to the speed with which its database transactions can be carried out. In addition, all geometry derived from a Dynamo workflow is “live,” having been already committed, which creates an inherent fragility as a user can then manipulate, or in the worst case, delete geometry directly in the Revit interface, subsequently breaking the workflow.
4.2 Optimization The Revit / Dynamo models demonstrated a method of dynamically re-positioning a design element in response to an environmental stimulus. The method was not predicated upon approaching optimization with regard to solar radiation values. However, a starting point for conceptualizing a more complex shading device could begin with an analytic process was previously demonstrated by a team at Perkins + Will. They were able to export model geometry created in Revit, test it against solar radiation data from Ecotect, and ultimately import that Excel spreadsheet data back into Revit -- effectively translating said values into instance parameter changes (Aksamija, et. al. 2011). Many projects have used Galapagos (an evolutionary optimization module) with Rhino, Grasshopper, and DIVA (simulation) for optimization of daylighting and energy savings. One recent example optimized window sizes for different climate zones and orientations by balancing daylight capture with increases in summer cooling loads (Geman, et. al. 2012). Many fewer examples exist for Revit as a module similar to Galapagos does not currently exist for Dynamo. However, other methods have been used to find optimal configurations. Dynamo has been used with Vasari/Revit to create an interactive feedback loop where the amount of solar radiation on the roof of a massing model is optimized by rotating the building (Fig. 13).
Fig. 13: Progression of images showing radiation analysis until local maximum was reached. (image courtesy of Matt Jezyk, Autodesk) http://wikihelp.autodesk.com/Vasari/enu/Community/Work_in_Progress/Dynamo_for_Vasari (last accessed 1-‐25-‐12). The Dynamo setup in Fig. 14 followed a similar sequence as the solar radiation project shown in Fig. 13. The Reverse Optimizer node replaced the Optimizer node and the Incrementer node influenced the increment parameter of the shade. The shade depth continued to increase in size
1
2
3
4
5
35
Inn
ovativ
e D
esig
n
BESS-‐SB13 CALIFORNIA: Advancing Towards Net Zero. Pomona, California, USA. 24-‐25 June 2013
until the radiation value on the window no longer decreased, thus optimizing the shade length.
Fig. 14: Progression of images showing radiation analysis until a local maximum was reached. (image courtesy of Tyler Tucker) 4.4 Future Work Although there is much to be done, we foresee two major next steps. One is focused on the interaction between environmental sensors and optimization algorithms to predict the changes that should be made to an interactive façade. An interesting subset of this would be to source data from real time weather feeds on the Internet such as Cosm. Another step is to construct a full size mock-up to see if it performs like the prototype hybrid virtual-real models. One known challenge to this is the up-scaling of power required to actuate larger servo drives, which in turn are moving significantly heavier construction materials. Micro servo-motors are powered through the Arduino board and operate with a maximum of five volts. In both cases, digital models would first be used to test the response of the systems. The long-term goal is to create cognizant building facades that optimize their performance based on current, historical, and weather predictions in an effort to reduce energy consumption. 5. ACKNOWLEDGMENTS Ian Keough, creator of Dynamo; Matt Jezyk, Autodesk; student researchers: Winston Kahn, Augustine Liu, Tyler Tucker
6. REFERENCES Aksamija, Guttman, Rangarajan, Meador, 2011. "Parametric control of BIM elements for sustainable design in Revit: linking design and analytical software applications through customization," Perkins + Will Research Journal, Vol. 03.01, 2011, pp. 32 - 45. El Sheikh, M. and Kensek, K., 2011. “Intelligent Skins: daylight harvesting through dynamic light-deflection in office spaces,” ARCC 2011 Conference Proceedings. Fox, M. and Kemp, M., 2009. Interactive Architecture, Princeton Architectural Press. Interactive buildings, pg. 109; environmental cognizance, pg. 117; entire book for an excellent overview of this subject. Knowles, R. L., 1981. Sun Rhythm Form. MIT Press, Cambridge, MA. Mesa Verde, pp. 11-13; Acoma, pg. 158. Miller, N., 2011. “The Hangzhou Tennis Center: a case study in integrated parametric design.” ACADIA Regional 2011: Parametricism: [SPC] Conference Proceedings (editors Cheon, Hardy, Hemsath), University of Nebraska-Lincoln College of Architecture, pp. 141- 148, pg. 143. Rheinhart, C.; Jakubiec, A.; Lagios, K.; and Niemasz, J. Email post to list-server [email protected], August 19, 2010. Tammik, J., 2011. http://thebuildingcoder.typepad.com/blog/2009/12/revit-python-shell.html, last accessed 3 November 2011. Also visit http://www.youtube.com/watch?v=IuVwn-U91Hc for a demonstration of it. Velasco, R. and Robles, D., 2011. “Eco-envolventes: a parametric design approach to generate and evaluate façade configurations for hot and humid climates,” eCAADe 29 Conference Proceedings, pp. 539 – 548. Wu, G., Kensek, K., and Schiler, M., 2012. "Studies in Preliminary Design of Fenestration: Balancing daylight harvesting and energy consumption," PLEA 2012.