Preliminary Plan for Freshwater Biodiversity Monitoring in the Gambia river basin Page1 INTEGRATION OF FRESHWATER BIODIVERSITY IN AFRICA’S DEVELOPMENT PROCESS: INFORMATION COLLECTION AND DEMONSTRATION SITES PRELIMINARY PLAN For the monitoring of FRESHWATER BIODIVERSITY IN THE GAMBIA BASIN Wetlands International Africa Rue 111, Zone B, Villa № 39B, BP.25581 DAKAR-FANN. SENEGAL [email protected]
Transcript
P r e l i m i n a r y P l a n f o r F r e s h w a t e r B i o d i v e r s i t y M o n i t o r i n g i n t h e G a m b i a r i v e r b a s i n Page 1
INTEGRATION OF FRESHWATER BIODIVERSITY IN AFRICA’S DEVELOPMENT PROCESS:
INFORMATION COLLECTION AND DEMONSTRATION SITES
PRELIMINARY PLAN For the monitoring of
FRESHWATER BIODIVERSITY
IN THE GAMBIA BASIN
Wetlands International Africa Rue 111, Zone B, Villa № 39B, BP.25581
3.1. Species and key habitats concepts .................................................................................................................. 6
3.2. Site selection criteria .............................................................................................................................................. 7
3.3. Species selection criteria ........................................................................................................................................ 7
4. PROPOSED SITES AND SPECIES TO BE MONITORED ............................................................... 8
4.1. Proposed sites to be monitored ....................................................................................................................... 8
4.2. Proposed species to be monitored ....................................................................................................................... 11
4.2.1. The crabs ......................................................................................................................................................... 11
4.2.2. The mollusks ................................................................................................................................................... 12
4.2.6. Fish ................................................................................................................................................................. 13
5. DATA COLLECTION .............................................................................................................................. 14
5.6. Fish ................................................................................................................................................................. 21
7.6. Fish ................................................................................................................................................................. 30
8. ACTORS AND PARTNERS INVOLVED IN THE MONITORING ............................................... 30
Ministry of Environment ........................................................................................................................................ 31
Universities and research institutions ................................................................................................................... 31
Local Collectivities .................................................................................................................................................. 31
Ministry of Environment ........................................................................................................................................ 31
Universities and research institutions ................................................................................................................... 31
Universities and research institutions ................................................................................................................... 31
Local Collectivities .................................................................................................................................................. 31
Figure 2: Monitoring sites within Senegal and Guinean Gambia Basin .............................................................................. 9
Figure 3: Monitonring sites within Gambia Gambian Basin ............................................................................................. 10
Figure 4: Monitoring sites within Guinean Gambia Basin ............................................................................................... 11
Figure 5: Freshwater crabs within the Gambia Basin ....................................................................................................... 12
Figure 6: Freshwater odonate within the Gambia Basin .................................................................................................. 13
Figure 7: Freshwater fish within the Gambia Basin .......................................................................................................... 14
P r e l i m i n a r y P l a n f o r F r e s h w a t e r B i o d i v e r s i t y M o n i t o r i n g i n t h e G a m b i a r i v e r b a s i n Page 5
1. RATIONALE AND BACKGROUND
Supported by Wetlands International, IUCN implemented a program entitled, "Integration of
freshwater biodiversity in Africa’s development process: information collection and demonstration
site.” The program’s overall objective is to assess the conservation status of freshwater species
across the African continent and ensure effective consideration and use of data related to this
biodiversity, both in decision making and implementation of development activities in Africa. This
program has two phases. The first phase focuses on the collection of information to assess the
conservation status of selected taxa on IUCN’s private list. The second phase is linked to the
implementation of a case study on The Gambia River basin demonstration site.
This program enables water resources managers and environmental planners to integrate
information on freshwater biodiversity in the development process. The specific objective is to
ensure that environmental planning for the development of water resources throughout Africa is
based on the integration of reliable data, on the status, distribution and ecological conditions of
freshwater biodiversity for priority taxonomic groups such as crabs, mollusks, odonata, water birds,
aquatic plants and fish. These various species represent a certain ecological and socio-economic
interest because of their multiple roles. They are part of man’s diet and many other species. They
also provide habitat and refuge for others such as aquatic plants. Mollusks, for example, are capable
of containing many toxic chemicals and thus participating in the water purification phenomena.
Together with odonata and birds, they represent bio-indicators of the ecological status of aquatic
habitats.
However, despite the diversity and importance of species and habitats, freshwater ecosystems are
facing strong pressure and disturbances linked to human activities, among others. To the contrary,
even though dam construction responds to meeting economic needs, it can cause a lot of damage to
aquatic species and their habitats.
The Organization for the Development of The Gambia River (OMVG) comprising The Gambia,
Guinea, Guinea Bissau and Senegal, envisions the construction of a dam on the Sambagalou site.
Based on impact studies undertaken, the construction of this dam will undoubtedly cause a loss of
habitat. However, it is sometimes possible to compensate this loss by the protection and
conservation of natural habitats.
P r e l i m i n a r y P l a n f o r F r e s h w a t e r B i o d i v e r s i t y M o n i t o r i n g i n t h e G a m b i a r i v e r b a s i n Page 6
It is in this context that Wetlands International Africa, in partnership with the IUCN-Species
Programme and the OMVG has agreed on the development and implementation of a monitoring
plan for freshwater ecosystems biodiversity in The Gambia basin. This monitoring will provide
important information on species and habitats and it represents an opportunity to document changes
that might occur in the habitats. Hence, this will enable us take the necessary preventive or adaptive
actions.
2. OBJECTIVE The overall objective of the plan is to ensure the use of information on freshwater biodiversity in
development programs. It aims specifically to follow the changing trends of considered taxa and
their habitats in The Gambia River basin.
3. METHODOLOGY
3.1. Species and key habitats concepts
The Gambia River basin hosts a great number of species and attracts many other species such as
birds. This is due to the many services it provides but also because of its diversity of habitats
(estuaries, marshes, swamps, mudflats, etc.). A habitat is a functional unit composed of different
species that interact between them. The species are of great importance in maintaining the balance
of habitats. These species, some of which are referred to as "keystone species", are essential in
maintaining one or more communities. A keystone species may well be regarded as a species whose
loss or elimination can cause a major change in the ecosystem. For instance, regarding plant
species, they provide food for some animal species which are keystone species. The importance of
keystone species is not illustrated by the size of their current population, but rather by the action
they undertake to maintain a given community. Their disappearance leads to significant changes in
the functioning of the ecosystem. Similarly, species that are prolific in nature and can be considered
as key species is particularly true for invasive species.
In conservation biology, the term bio-indicator species is used to refer to species whose presence or
change in their populations lead to changes in the environment or communities of other species.
Keystone species play a fundamental role in maintaining biodiversity. Therefore, these species may
act as biological indicators or bio-indicators and enable us to determine the state of the ecosystem.
Key habitats are habitats which are important so much so that their degradation or loss can affect
one or more communities. According to Branquart (2004) key habitats are forest habitats that have a
P r e l i m i n a r y P l a n f o r F r e s h w a t e r B i o d i v e r s i t y M o n i t o r i n g i n t h e G a m b i a r i v e r b a s i n Page 7
particularly high protective value (or wealth), because they host many rare and endangered species.
Key habitats deserve to benefit from specific protection measures as regards their high protective
value.
3.2. Site selection criteria
The selection of monitoring sites was made in preparation for the construction of the Sambagalou
dam. It is therefore essential to take into account during the course of this selection the catchment
area of the reservoir-- upstream and downstream of the dam. In addition, a site that will most likely
not be affected by the dam has been taken into account (a control site). Considering these different
positions, the selection of sites to be monitored is based on the following criteria:
o The site’s ecological importance
o The role of site in biodiversity conservation
o Species richness
o The presence of rare or endangered species
o Endemism areas or sites rich in endemic species
o The ecological peculiarity (single habitat type or compulsory habitat for species or a given
community).
3.3. Species selection criteria During the first phase of the West Africa freshwater biodiversity assessment five freshwater taxonomic groups were selected and assessed based on the IUCN red list criteria. The taxonomic groups chosen were: fishes, plants, mollusks, odonates (dragonflies) and crustacean. Based on the regional assessment results the same taxonomic groups assessment results were brought at the level of the Gambia basin in this second phase. The results were reassessed for gaps by the researchers of the four country of the basin ( Senegal, Gambia, Guinea and Guinea Bissau). From the assessment some species were selected for monitoring based on the following criteria :
Endemic species
Threatened species
Rare species
Characteristic species
Economically important species
Invasive species
Potentially invasive species
Species indicating the environmental status (e.g. pollution)
P r e l i m i n a r y P l a n f o r F r e s h w a t e r B i o d i v e r s i t y M o n i t o r i n g i n t h e G a m b i a r i v e r b a s i n Page 8
4. PROPOSED SITES AND SPECIES TO BE MONITORED
4.1. Proposed sites to be monitored
Senegal
Sites Rationale Xcoord Ycoord
Site of Bara Close to the reservoir site
Ford of Damantan
Data available
Accessible
Taxa: fishes, birds, plants, odonata, crabs and mollusks
681853 ,76 1442636 ,35
Confluence point of the Gambia Niokolo
Interesting habitat because of the changing levels of the Gambia river
680729 ,54 1440436,78
Confluence point of the Gambia Nieriko
Interesting habitat especially when the Gambia overflows
The Nieriko is permanent, but undergoes a dry period at times with the dam
Can be permanent
675636 ,48 1476535,31
Simenti pond
Habitat directly connected to the Gambia and an important habitat for wildlife
684981 1400659
Kountadala pond
Habitat directly connected to the Gambia and important habitat for wildlife and currently invaded by Mimosa pigra and Mytragina inermis
683367 1441236
Wouring pond
Permanent pond that is in the process of being colonized in some parts by Mimosa pigra.
Deeper pond where there is always water, important habitat for wildlife, there is even a spawning area
683465,938 1462519,85
Oudassi pond Interesting habitat especially when The Gambia river overflows
Nieriko is constant, but undergoes a dry period at times with the dam
Could be permanent
682850 1448089,714
P r e l i m i n a r y P l a n f o r F r e s h w a t e r B i o d i v e r s i t y M o n i t o r i n g i n t h e G a m b i a r i v e r b a s i n Page 9
Padan pond Important site when considering biodiversity conservation
Banthantity pond Important site when considering biodiversity conservation
Sambangalou site Important site because of the dam’s physical presence.
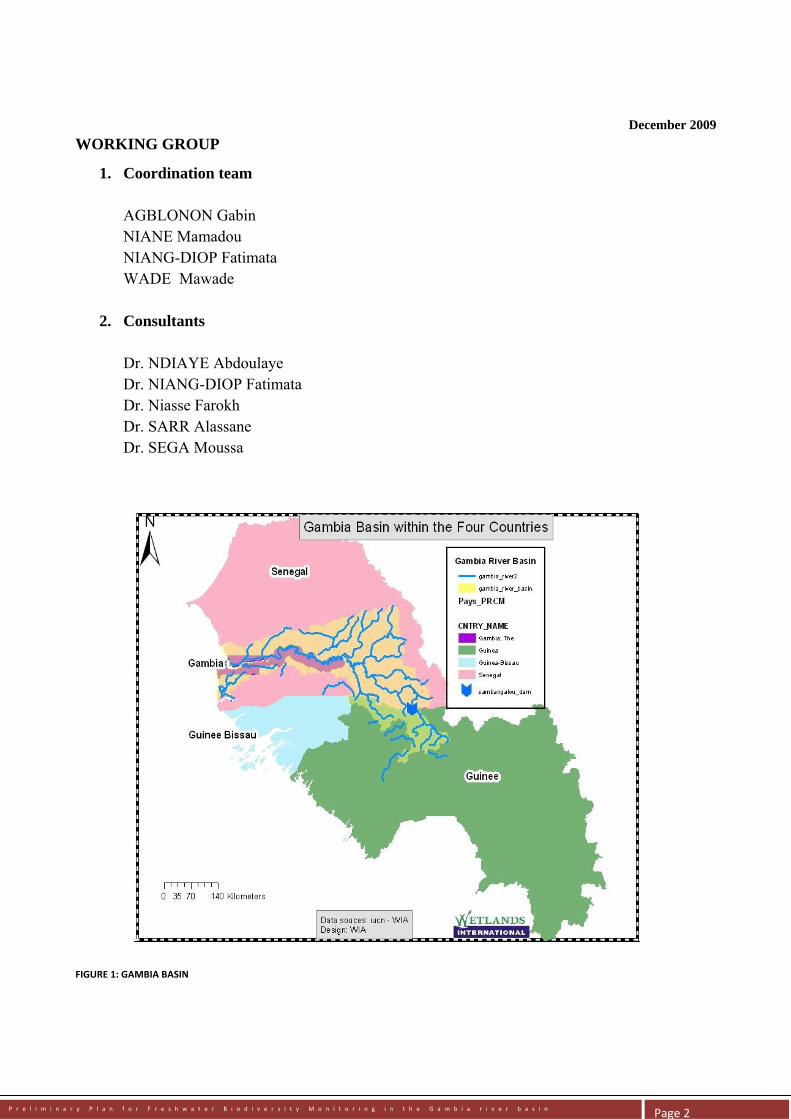
FIGURE 2: MONITORING SITES WITHIN SENEGAL AND GUINEAN GAMBIA BASIN
Gambia :
a. Lower River ecological site; area for fish breeding but also first Ramsar site
b. Central River Region, Reserve area (Manatee)
c. Upper River ecology; wet mountainous area,
d. Through the Fouta Djallon water.
P r e l i m i n a r y P l a n f o r F r e s h w a t e r B i o d i v e r s i t y M o n i t o r i n g i n t h e G a m b i a r i v e r b a s i n Page 10
NOTE: There will probably be two more very important species for biodiversity in the
lower-river region:
FIGURE 3: MONITONRING SITES WITHIN GAMBIA GAMBIAN BASIN
Guinea Republic :
a. Ecosystem sites where villages will be displaced: Kounsi in the CRD of Balaki;
b. Ecosystem sites where villages will be endangered: Théwiirè;
c. Home site: Pakaya (Mali urban commune district).
In the site selection process, the following areas were considered for better sampling:
Those that will be flooded;
Those that will suffer the future impact of the project;
Those that will host displaced people
Based on what is already stated above, Guinean experts selected four sites including two sites that will be flooded.
The 4 identified sites contain the following ecosystems: Freshwater; Shrub lands; Savanna; Mountain; Bowes
They are all located in the Bafing Faleme protected area and are rich in biodiversity.
Sites to be monitored in Guinea XCoord YCoord
1. Selected site to be flooded for surveys in Thiéwiré in Lébékéré rural development commune (CRD);
782354.07 1338809.07
2. Selected site to be flooded for surveys in Parabanta in the Balaki rural development commune (CRD);
192592.93 1344434.65
P r e l i m i n a r y P l a n f o r F r e s h w a t e r B i o d i v e r s i t y M o n i t o r i n g i n t h e G a m b i a r i v e r b a s i n Page 11
3. Selected site that will be affected by the project’s future impacts for surveys in Kounsi in Balaki rural development commune (CRD).
193178.67 1343228.76
4. Potential site to host the displaced Pakaya District in the urban commune of Mali which is the host site
814556.00 1340886.47
FIGURE 4: MONITORING SITES WITHIN GUINEAN GAMBIA BASIN
4.2. Proposed species to be monitored
4.2.1. THE CRABS Only two species of crabs were identified in The Gambia river basin. Potamonautes ecorssei was collected in Wouroli Gué (Haute-Guinée), in Sanyiki près du Niokolo-Koba, in Niokolokoba and in Doufouroum between Niokolo-Koba and Banganré, and into Gambia River (Monod, 1969). Liberonautes latidactylus was found in Gué de Wouroli, Niokolo-Koba and into Gambia River .
P r e l i m i n a r y P l a n f o r F r e s h w a t e r B i o d i v e r s i t y M o n i t o r i n g i n t h e G a m b i a r i v e r b a s i n Page 12
FIGURE 5: FRESHWATER CRABS WITHIN THE GAMBIA BASIN
Facing the ecological changes that are the consequence of hydro-power works in the Gambia basin, it becomes necessary to monitor the evolution of these two species. There might be a third species of small crab that are usually found in muddy environments.
4.2.2. THE MOLLUSKS Mollusks play an important role in the functioning of aquatic ecosystems. They are part of the diet
of several species of aquatic vertebrates, especially fish. The mollusk populations participate in
water treatment by inhaling many toxic substances (heavy metals, pesticides...).
Because of their low mobility and life span, they are strong indicators of their environment’s
ecological status.
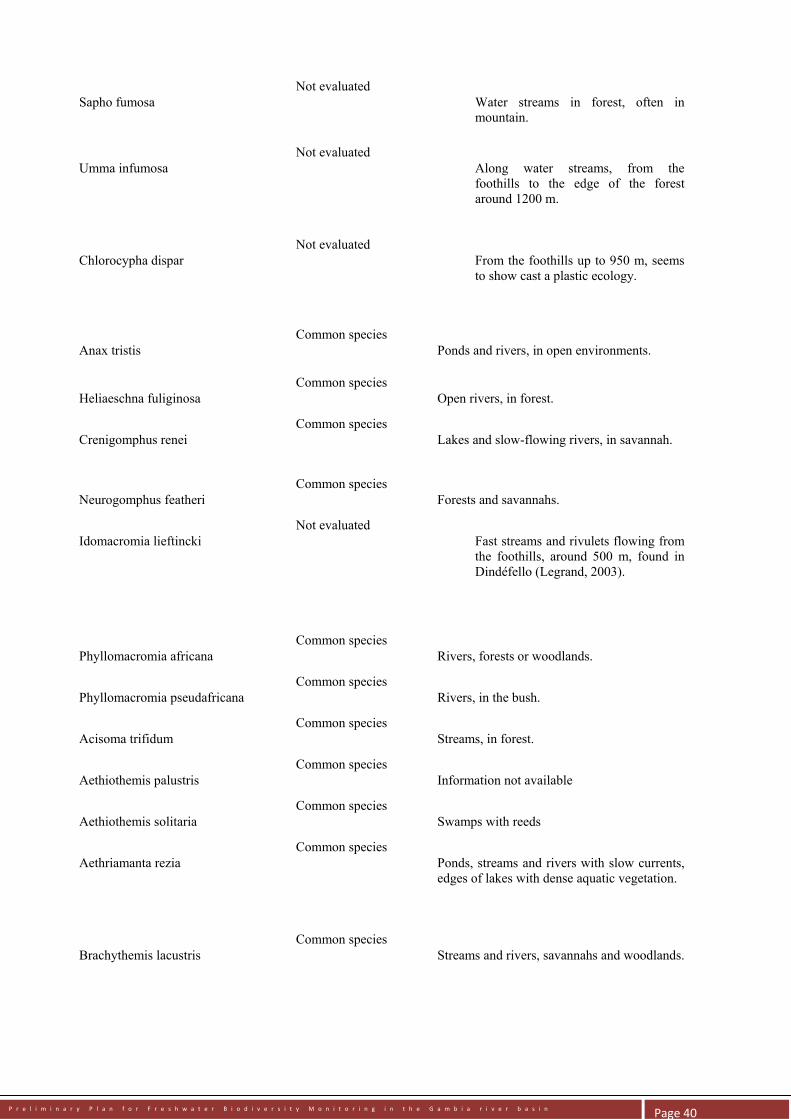
4.2.3. Odonata
The odonata represent a significant heritage but they also occupy an important place in the structure
and functioning of ecosystems and act as bio indicators on the quality of wetland habitats. The
odonata are a valid tool to evaluate the degradation of habitat quality and were used as indicator by
many authors.
We should however note that before undertaking the monitoring, it would have been wise to
conduct an inventory during at least two to three years to complete the available information in the
scientific literature on odonata wildlife in the basin. Such a study would enable to know the actual
autochthonous species that were mentioned and draw the odonata spectrum of the habitats.
P r e l i m i n a r y P l a n f o r F r e s h w a t e r B i o d i v e r s i t y M o n i t o r i n g i n t h e G a m b i a r i v e r b a s i n Page 13
FIGURE 6: FRESHWATER ODONATE WITHIN THE GAMBIA BASIN
4.2.4. BIRDS Water birds are defined as "a set integrating all taxonomic families, whose members are mainly birds who depend on wetlands for at least some part of their life cycle” (Rose & Scott 1994). These birds are excellent indicators on the status of habitats. Thus, we still agree that all surveyed species provide important information that contributes to the interpretation of results.
4.2.5. Plants
Aquatic plants play a very important role in aquatic ecosystems and more particularly in the
oxygenation and water purification ecological processes. They are also used as habitat and food for
animal species that live in these environments. For the human being, these aquatic plants are also
used in various manners. However, it should be mentioned that these plants can sometimes be
harmful, especially in cases where they proliferate at the expense of other species (invasive plants).
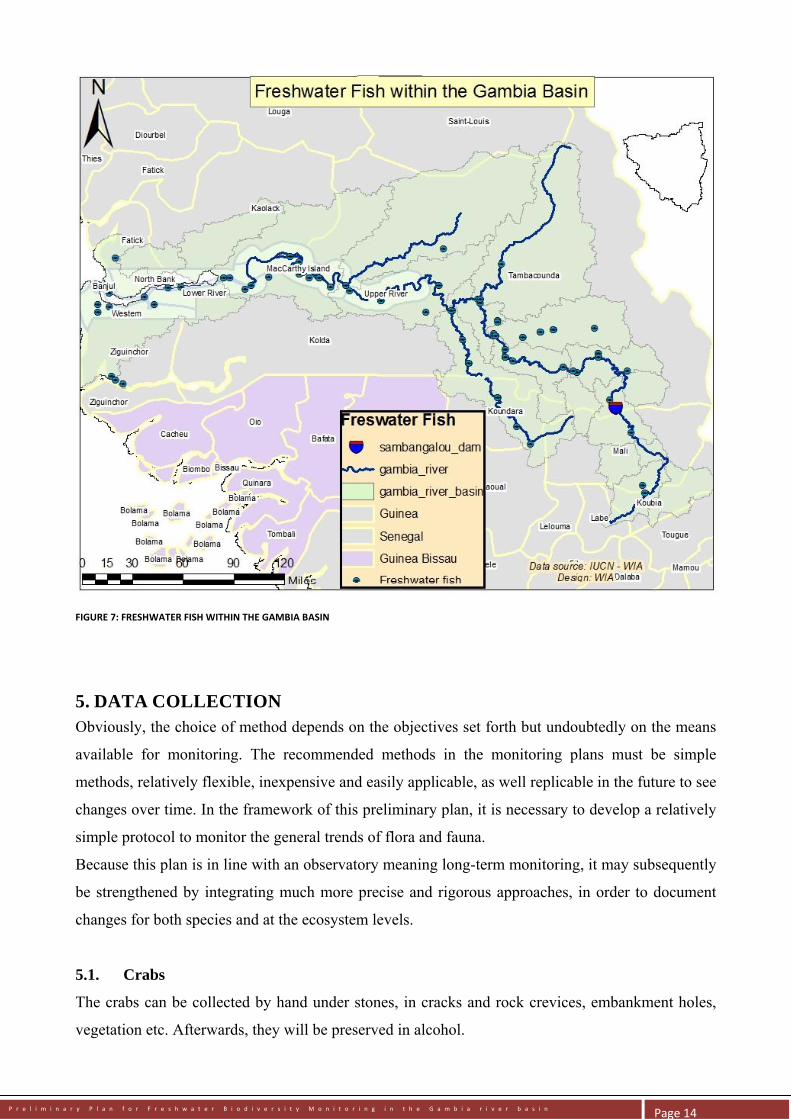
4.2.6. FISH
P r e l i m i n a r y P l a n f o r F r e s h w a t e r B i o d i v e r s i t y M o n i t o r i n g i n t h e G a m b i a r i v e r b a s i n Page 14
FIGURE 7: FRESHWATER FISH WITHIN THE GAMBIA BASIN
5. DATA COLLECTION Obviously, the choice of method depends on the objectives set forth but undoubtedly on the means
available for monitoring. The recommended methods in the monitoring plans must be simple
methods, relatively flexible, inexpensive and easily applicable, as well replicable in the future to see
changes over time. In the framework of this preliminary plan, it is necessary to develop a relatively
simple protocol to monitor the general trends of flora and fauna.
Because this plan is in line with an observatory meaning long-term monitoring, it may subsequently
be strengthened by integrating much more precise and rigorous approaches, in order to document
changes for both species and at the ecosystem levels.
5.1. Crabs
The crabs can be collected by hand under stones, in cracks and rock crevices, embankment holes,
vegetation etc. Afterwards, they will be preserved in alcohol.
P r e l i m i n a r y P l a n f o r F r e s h w a t e r B i o d i v e r s i t y M o n i t o r i n g i n t h e G a m b i a r i v e r b a s i n Page 15
5.2. Mollusks
The sampling protocol will take into account the main types of environments: ponds, streams,
tributaries and main river channel. Mollusks can be collected in a bucket (3 to 6 buckets per site),
by hand or using a dip net. The collected samples are passed through a 1 mm sieve. In the
laboratory, mollusks will be sorted, identified and counted.
In each prospection site, on-field measurements of physio-chemical parameters will be undertaken:
temperature, depth, bottom type, dissolved oxygen, salinity, nitrates and turbidity. These measures
will be carried out using a multi-parameter portable, a depth meter and a Secchi disk.
Parameters to record: the information that will be collected during the sampling
campaigns focuses on environmental conditions (temperature, salinity, conductivity,
dissolved oxygen, transparency, quantity of nitrates and phosphates, current strength, depth
and bottom type) and habitats or populations (to determine the species of and number of
collected mollusks, and the number of individuals collected per species).
Data analysis and treatment
First, the identified monitoring indicators (species richness and abundance) will be calculated.
Collected individuals will be identified until determining the species if possible in order to establish
the species richness (number of species) of each prospection site. If there is any doubt in
determining it, they will be sent to specialists. The species list will be established for each
prospection site.
A count of individuals collected per species will be conducted to determine the abundance of
species in the samples.
In a second phase, the Correspondence Factor Analysis (AFC) will be performed.
5.3. Odonata
5.3.1. Material to be used
Butterfly net
The butterfly net is made of a telescopic or fixed handle measuring approximately 1 to 2 m at the
end of which is attached a metal ring with a diameter of 30 to 50 cm provided with a pocket of
nylon, polyester or gauze that is more or less long and with various colors (white, green, black ...).
Kick net
P r e l i m i n a r y P l a n f o r F r e s h w a t e r B i o d i v e r s i t y M o n i t o r i n g i n t h e G a m b i a r i v e r b a s i n Page 16
The kick net is used to collect aquatic insects. It consists of a sturdy handle in one part, and a solid
iron or aluminum circle of about 30 cm in diameter, provided with a nylon bag inside an empty grid
of 800 to 300 microns, depending on the type.
Boxes to collect exuviae
Ringlets to collect Imagos
Flexible entomological pliers
Cyanide jar
Sorting trays
Digital Cameras
A digital camera, suited for close-up shooting, is strongly recommended.
Field Book
The field book is needed to record all information relating to the observation (names of the
observer(s), location, date, name of species, behavior, etc.).
5.3.2. Data collection
In each site, a number of stations will be identified according to the diversity of habitats. These
habitats can be i) stagnant water: ponds, lakes or open marshes, forest ponds, mountain lakes ii)
running water: streams and rivers with slow current, streams and rivers with troubled waters iii)
calm parts of large rivers and iv) terrestrial environments that can be quite far away from water
sources such as meadows, edges of woods, forest clearings.
Larvae, pupae and exuvia are being sought in aquatic habitat, more specifically in the water and
aquatic vegetation. Imagos will be sought on the vegetation that covers these areas and on the trees
and shrubs surrounding them.
In terrestrial environments that are more or less distant to aquatic habitats, adult in a maturing
process will be sought in the meadows, edges of woods and forest clearings where they can reunite.
Larvae and pupae
In the aquatic habitats, larvae and pupae are searched in the water and aquatic vegetation. The
collection is done with the use of the kick net.
P r e l i m i n a r y P l a n f o r F r e s h w a t e r B i o d i v e r s i t y M o n i t o r i n g i n t h e G a m b i a r i v e r b a s i n Page 17
After being mowed in the water, the content of the net is poured into a tray and is sorted by hand
with flexible entomological pliers. The larvae are put in a vial containing 70% ethanol with a label
bearing the date, place of harvest, habitat, geographic coordinates, and reference number. These
same data are reported in the field notebook.
Exuviae
The exuviae are searched on a band of approximately 50 cm on both sides of the bank along a
length that depends on the habitat’s size (approximately 8 to 80 m). The exuviae that are found are
then collected by hand, using a flexible entomological forceps and placed in the boxes provided for
this purpose (one or more boxes per habitat). Just like the larvae and pupae, exuviae is able to
determine the status of autochthonous species with certainty.
Imagos (adults)
The Odonata adults are sought in the surrounding water points but also on land more or less distant
from the aquatic habitats where adults in a maturation process meet. These are meadows, edges of
woods and forest clearings.
Imagos are captured with butterfly nets. The individuals captured after being mowed are gently
removed from the net pocket, avoiding holding them on their wings so as not to damage them. They
are then put into the cyanide jar, which kills them quickly. Once dead, they are placed in ringlets
with all the relevant reference (dates, collector’s name, harvest location, reference number, etc.).
When the insects are not treated immediately after being collected, one must dry them in the sun for
instance. Paradichlorobenzene can be put in the ringlets for better conservation.
Photographs of habitats and individuals (all ages) can usefully complete the information on the
species and their environments.
5.3.3. Data treatment and analysis
Harvests are put in tubes containing ethanol 70°. The identifications that can be done locally will be
done in the laboratory with the use of identification keys and/or with a comparison of reference
samples. In some cases, genitalia preparations are necessary for species identification. One will then
scour the genital parts to be mounted on a strip and compared them with the references.
The list of native species is derived from the identification of larvae, nymphs, exuviae and
individuals in mating.
P r e l i m i n a r y P l a n f o r F r e s h w a t e r B i o d i v e r s i t y M o n i t o r i n g i n t h e G a m b i a r i v e r b a s i n Page 18
However, it should be noted that with the changes of reproduction periods, one should regularly and
closely monitor over a period of two or three years to get an exhaustive list of targeted habitats
native species. We should also note that the odonata spectrum settlements depend on the list of
native species.
In the qualitative realm, one will need to compare the settlements’ populations on one hand and a
comparison of a settlement during the evaluation period (dry season and rainy season, from one
year to another).
In the quantitative realm, the averages of individuals/species captured according to various seasons
and years are compared. This will provide an indication on the populations’ evolution trend.
The counting of larvae and exuviae also give a good indication on the population size.
5.4. Birds
The distribution of water birds is closely linked to the availability of water and productivity of
wetlands. The Gambia basin, owing to the diversity of its habitats and resources, hosts a large
population of water birds. However, regular monitoring of these birds enables us to grasp their
distribution and population trends. It is within this framework that the count of water birds in Africa
(DOEA) can serve as reference to list the water birds already encountered in this basin. Moreover, it
is important to know the conservation status (good or bad) of these important bird sites; because the
smallest changes in these habitats may have serious consequences on bird populations. Thus, birds
are excellent bio-indicators of environmental change.
5.4.1. Data collection
Monitoring will occur periodically in the different sites. In each site, geo-referenced counting points
are selected and counting transects determined by the distance between two successive counting
points. For small population, individual counting will be made; an estimate is made for large
populations. Thus, for each identified bird species, the number of individuals is counted. The
comments will be recorded on a counting card (ref. attached species sheet). The parameters related
to habitat will be considered (ref. attached site sheet). This method enables the study of bird
populations periodic changes in the sites and species encountered in different habitats.
5.4.2. Data analysis
P r e l i m i n a r y P l a n f o r F r e s h w a t e r B i o d i v e r s i t y M o n i t o r i n g i n t h e G a m b i a r i v e r b a s i n Page 19
A database will be created to triangulate the bird records (species richness, abundance, dominance)
with different environmental parameters (vegetation, water level, human impacts).
5.5. Plants
For plants, monitoring can be done at different levels (on the physiognomic scale, across
communities or ecosystems, across populations or species or even at the genetic level. In the
context of this work, we limit ourselves to monitoring across ecosystems and species. The first
refers to the vegetation structure itself that can be appreciated through the physiognomy, which is
particular to a given plant community.
5.5.1. Data collection
Phyto-sociological methods are generally used to study aquatic plant communities. The transect
method is the most common. Transects are able to measure changes from one community to another
due to environmental gradients such as moisture. They are indicated by a stretched wire and
attached at both ends. Along these transects, frames measuring 1 m x 1 m will be installed using a
string and the angles will be marked with stakes. Data will be collected in these clearly defined
plots. As for the herbaceous, growing square will be used while for the high timber, 100 x 100
square meters with five 20 x 20 sub-squares will be used; Hence, this will create the floristic list and
species status as well as the environmental value of the ecosystems.
5.5.2. Parameters to collect
- It is important to geo-reference the sites and mark them in order to locate the sites for future visits.
- The water physio-chemical characteristics should be taken into account. These are namely pH,
oxygen and other chemical elements such as nitrates, phosphates, potassium, etc. that should be
measured.
- The floristic list: All species present in the plots will be listed. And those that will not be
identified in the field will be collected and subsequently identified using herbarium.
- Recovery: it is estimated using both the abundance (relative number of individuals of a species in
relation to the total number of individuals identified in the plot or frame) and dominance (covered
area, i.e. the projection on the ground of foliage coverage of all individuals of the targeted species).
This is found through the ratio of abundance-dominance determined by the Braun-Blanquet scale.
These factors vary based on the recovery.
P r e l i m i n a r y P l a n f o r F r e s h w a t e r B i o d i v e r s i t y M o n i t o r i n g i n t h e G a m b i a r i v e r b a s i n Page 20
Table: Factors of the Braun-Blanquet abundance dominance scale
Factors Recovery (R)
5 R > 75 %
4 50% < R <75 %
3 25 %<R<50 %
2 5 % <R<25 %
1 R <5 %
+ Rare
Note: Statement sheet: It is very useful to elaborate a statement sheet that includes the following:
- Date
- Location
- Transect orientation
- Number of transects
- Number of plots
- Species
5.5.3. Data analysis
For each species, the following parameters will be calculated: abundance, density, recovery,
dominance, frequency, relative frequency, relative dominance and importance value.
Abundance: the total number of individuals of each species in the total sample.
Recovery: the area occupied by individuals of a species. It is estimated using the projection on the
soil of the foliage coverage
Density: the number of individuals belonging to a species per area unit.
Relative density: the density of a species in relation to the density of all species.
Dominance: the area occupied (using the recovery) by a species in a settlement, per area unit.
Relative dominance: the area occupied by the species, using the recovery, in relation to the area
occupied by all species
P r e l i m i n a r y P l a n f o r F r e s h w a t e r B i o d i v e r s i t y M o n i t o r i n g i n t h e G a m b i a r i v e r b a s i n Page 21
Frequency: the distribution of a species in a settlement, i.e. the percentage of frames in the sample,
where one can find individuals of a species.
Relative frequency: the distribution of species in relation to the distribution of all species in the
sample
Important value: This is a composite index of relative density, relative dominance and relative
frequency which is the structural role of a species in a settlement. The important value is also used
to compare settlements between them, in terms of species composition and settlement structure.
VI = relative density + relative dominance + relative frequency
5.6. Fish
5.6.1. Data collection
Experimental fishing will be done by using a battery of gill nets measuring 10 to 40 mm on the side
of the basin and 10 to 60 mm on the estuary side. Fish caught during the campaign will be identified
to determine the species, measured and counted. The gender of individuals and the sexual maturity
stages of the main species will be determined. Longlines traps and lines will be used. A sensitivity
electronic balance weighing 1 gram should be used.
5.6.2. Data analysis and treatment
First, the identified monitoring indicators (species richness and abundance) will be calculated.
Collected individuals will be identified until determining the species if possible, in order to
establish the species richness (number of species) of each prospection site. If there is any doubt in
determining it, the individuals will be sent to specialists. The species list will be established for
each prospection site.
A count of individuals collected per species will be conducted to determine the abundance of
species in the samples.
In a second phase, the Correspondence Factor Analysis (AFC) will be performed.
6. MONITORING INDICATORS Monitoring indicators will highlight the changing trends of species and their habitats. The indicators
are relatively numerous and can even be composed of a species or group of species which presence
P r e l i m i n a r y P l a n f o r F r e s h w a t e r B i o d i v e r s i t y M o n i t o r i n g i n t h e G a m b i a r i v e r b a s i n Page 22
inform us on the environment’s characteristics or the influence of other factors on the environment.
These indicators should be simple and easily understood by the various groups that will be
responsible for the monitoring.
6.1. Crab monitoring indicators
To evaluate and monitor the quality of crabs’ key habitats, the following indicators may be used:
Average Biomass (B)
It is determined by area unit and it enables the distinguishing of the settlements’ spatial and
temporal variations
Abundance (A)
The abundance is determined by the number of individuals of a species
6.2. Mollusk monitoring indicators
The composition and structure of animal populations are directly influenced by environmental
conditions. Mollusks are proving to be good indicators to assess the status of habitats where they
grow. Their limited mobility prevents them from fleeing when there are disturbances in the
environment, which permits them to provide a reliable illustration of the environmental conditions
where they live, unlike fish and other mobile species.
Many studies showed that the installation of a freshwater reservoir supports the abundance of
mollusks with lentic affinity (Mollusques Gastéropodes pulmonés, et autres Bivalves)). In
addition, the reservoirs create the favorable conditions for the development of the plants which
constitute an excellent habitat for several mollusc species. The building of the dam and the other
related infrastructures could cause a fragmentation of the habitats regarded as one of the most
important factors of disappearance of the species. The reduction of the flood plains downstream
from the dam could cause the a reduction in the abundance of mollusks. After the construction of
the dams, the oxygenated running water are often replaced by calm waters. These new hydrological
conditions could be unfavourable to the mollusc species of running water such as Mutela dubia
dubia and Aspatharia dahomeyensis.
Several types of methods (univariate and multivariate) are used to analyze changes in mollusks’
population structure.
Because of their simplicity and simple calculation, some univariate methods have been preferred
over a long period of time. These techniques permit to characterize the communities’ general trends,
P r e l i m i n a r y P l a n f o r F r e s h w a t e r B i o d i v e r s i t y M o n i t o r i n g i n t h e G a m b i a r i v e r b a s i n Page 23
study their variations and deduct the underlying causes. However, they do not take into account the
species and do not consider changes in specific composition (Grall et al., 2006).
Being more sensitive than univariate methods in general, multivariate methods are relatively recent
because their use requires computer materials and specialized and powerful softwares (Grall et al.,
2006). However, they are much more complex compared to other techniques, they require
significant work on data preparation and processing and interpretation of results is often difficult,
limiting their use by developers (Grall et al., 2006).
For this study, we suggest the use of methods with one single descriptor that are easier to interpret.
Two measures could be used to evaluate the effects of hydraulic works on mollusks’ species:
1) Abundance of species determined by the number of individuals
The Abundance is determined by the number of individuals of a species in the sample.
2) Species richness (S)
The richness and abundance of bivalve mollusks can provide information on the general
quality of the ecosystem. The composition and the structure of the settlements directly reflect the
disturbances which the organism undergo. If the dam is effectively operating, the various reactions of the
species will be translated at the level of their abundance and number.
Facing changing of environmental conditions, the species will go through three types of reaction
according to their sensitivity (Grall et al., 2006):
The most sensitive will disappear
Because of their sedentariness (cannot flee), large the bivalves are very sensitive to the changes of the environmental physical conditions (pollution, turbidity, hydrology). These large bivalves are represented in the basin of Gambia by the following species:
The tolerant and opportunistic will take advantage of the newly introduced conditions and
develop themselves
It is also based on the model of Pearson and Rosenberg (1978) predicting that the more the
disturbance is strong the weaker the specific richness is
P r e l i m i n a r y P l a n f o r F r e s h w a t e r B i o d i v e r s i t y M o n i t o r i n g i n t h e G a m b i a r i v e r b a s i n Page 24
3) This pecies richness can be used to analyze the settlement’s taxonomic structure (e.g.
number of mollusks species). It is also able to distinguish spatial variations: the fauna
rich areas and poorer areas as well as temporal variations: the minimum and maximum
depending on seasons and stations (Grall et al., 2006). However, it contains a drawback
in that it is highly dependent on sample size (number of species sampled increases with
the surface sampled) and habitat type (species richness varies according to substrate
type, depth and salinity).
In addition to these two parameters, it would also be necessary to measure water physio-
chemical parameters given the importance they can have on the environment’s general
conditions and mollusks species distribution. These parameters are: temperature,
turbidity, depth, bottom type, dissolved oxygen, vegetation, content of nitrates and
phosphates.
6.3. Odonata monitoring indicators
the monitoring indicators are :
1. The diversity of autochtones Odonates habitats (spectrum odonatologic). This diversity, once
known, will make it possible to monitor the appearance or the disappearance of species in
relation to the implementation of the dam in the selected habitats.
2. The relative abundance of the populations during sampling (captured exuvies, individuals);
this indicator will make it possible to evaluate the population’s fluctuation of the species in
relation to the implementation of the dam.
3. 10. The larval odonatologic productivity will make it possible to evaluate the rate of
reproduction of the species to be monitored in the selected habitats.
3.4. Bird monitoring indicators
The indicators to monitor birds are:
Species richness
Abundance
Dominance
The environmental parameters (vegetation, water level, human impacts).
P r e l i m i n a r y P l a n f o r F r e s h w a t e r B i o d i v e r s i t y M o n i t o r i n g i n t h e G a m b i a r i v e r b a s i n Page 25
These parameters are important for bird monitoring. The Species richness gives the number of species found in the area before giving their status (endangered or not). The abundance linked to Species richness will give the trends of all species (stable, increasing, decreasing, or unknown. The dominance will give an idea of species or group of species which are dominant in different habitats. All these will be analysis according to environmental parameters such as vegetation fluctuation, water quality and quantity, pollution, and other human impacts. With the implementation of the dam the changes are expected to happen on those indicators for rhe bird to be monitored.
6.5. Plant monitoring indicators
The construction of the dam will induce probably some modifications in the ecosystem that’s why; it is important to elaborate indicators which can be used for the monitoring. Regular quantitative data concerning specific composition and species dynamic through these following parameters will inform about ecosystem changes.
The population size (species whose populations are decreasing or those whose populations
are prolific ;)
The abundance of species
The distribution of species
The change in floristic composition
The species richness
The presence of exotic species
6.6. Fish monitoring indicators
These indicators will be determined on two levels: species and habitats.
• For species, four metrics are taken into account:
Catch effort per unit (PUE) which indicates the relative abundance of species.
The average relative length of individuals. For each individual, we will calculate its length
in relation to the minimum (m) and maximum (M) observed for individuals of the same
species in all fisheries: (observed length-m) / (Mm). Individual values are then averaged per
fishing. The lower the value one can assume that the population consists of young
individuals, as it was also confirmed by the correlation which was observed during the
Garafiri dam impact study Garafiri (IRD-BCEOM-BRLI, 2003) between this variable and
P r e l i m i n a r y P l a n f o r F r e s h w a t e r B i o d i v e r s i t y M o n i t o r i n g i n t h e G a m b i a r i v e r b a s i n Page 26
the percentage of juvenile individuals in the settlement. This variable should increase if a
disturbance reduces the recruitment.
The relatively average condition factor. The condition factor (K = P/L3, P= body weight in
grams, L = length in cm) will be calculated for all individuals, then converted to relative
value given the maximum and minimum observed for each species in all fishing. Individual
values are then averaged per fishing. A low value corresponds to a low status of individuals
throughout the population.
The percentage of mature individuals: Proportion (%) of mature individuals by the total
number of individuals will be calculated. A low value may indicate a disruption of
reproduction.
• For habitats: One should note that many methods have been developed to quantify the impact of
disruptions that the streams on ecological systems experience. With regard to fish populations, an
approach that is increasingly used, including in the tropics is the index of biotic integrity (Index of
Biotic Integrity or IBI) developed first in North America (Karr 1981).
6.7. Fish monitoring indicators
These indicators will be determined on two levels: species and habitats.
• For species, four metrics are taken into account:
Catch effort per unit (PUE) which indicates the relative abundance of species. This metric is
based on the fact that in a disturbed realm the density of species is supposed to be less than
in an undisturbed one.
The average relative length of individuals. For each individual, we will calculate its length
in relation to the minimum (m) and maximum (M) observed for individuals of the same
species in all fisheries: (observed length-m) / (Mm). Individual values are then averaged per
fishing. The lower the value one can assume that the population consists of young
individuals, as it was also confirmed by the correlation which was observed during the
Garafiri dam impact study Garafiri (IRD-BCEOM-BRLI, 2003) between this variable and
the percentage of juvenile individuals in the settlement. This variable should increase if a
disturbance reduces the recruitment. Increase of this variable indicates that there is less
number of fish reaching the adult age.
P r e l i m i n a r y P l a n f o r F r e s h w a t e r B i o d i v e r s i t y M o n i t o r i n g i n t h e G a m b i a r i v e r b a s i n Page 27
Average length and average relative length are differents concepts; What is taken here into
account is the second one which give indications of rate of young individuals among the
population. The average length is another concept which indicate to what extend, i.e up to
what length. a species can grow up. Changing in average length may indicate overfishing
or a very poor biological productivity of an environnemnt as it has been documented for
two marine species, Galeoides decadactylus and Pseudotolithus senegalensis that showed a
shorter maximum length in the coast of Biafra than off Congo and Ivory Coast.
The relatively average condition factor. The condition factor (K = P/L3, P= body weight in
grams, L = length in cm) will be calculated for all individuals, then converted to relative
value given the maximum and minimum observed for each species in all fishing. Individual
values are then averaged per fishing. A low value corresponds to a low status of individuals
throughout the population.
The percentage of mature individuals: Proportion (%) of mature individuals by the total
number of individuals will be calculated. A low value may indicate a disruption of
reproduction, i.e., reproduction of species with low value is affected by the disturbance
• For habitats: One should note that many methods have been developed to quantify the impact of
disruptions that the streams on ecological systems experience. With regard to fish populations, an
approach that is increasingly used, including in the tropics is the index of biotic integrity (Index of
Biotic Integrity or IBI) developed first in North America (Karr 1981).
Index of Biotic Integrity
The originality of this index is to take into account certain descriptors (metric) reflecting the
functioning and diversity of fish populations and whose response to a disturbance of the
environment is already known. Such an index has been developed for the Konkoure basin in a
previous study (Hugueny et al 1996) and its effectiveness was tested during the impact study of the
pollution of a bauxite processing factory.
To calculate the IBI, one will use the same metrics as those defined for the Konkouré (Hugueny et
al 1996) in addition to indicators of condition, reproduction and recruitment:
‐ Metric 1: Number of species per fishing. This metric is based on the assumption that a
disturbed environment has fewer species than an undisturbed one because species intolerant
to disturbance (s) will not be there
P r e l i m i n a r y P l a n f o r F r e s h w a t e r B i o d i v e r s i t y M o n i t o r i n g i n t h e G a m b i a r i v e r b a s i n Page 28
‐ Metric 2: Number of Mormyrides species.
‐ Metric 3: Number of Cichlides species.
‐ Metric 4: Number of great benthic Siluriforms species.
‐ Metric 5: Percentage of individuals belonging to omnivorous species. The number of
omnivores is supposed to increase in disturbed environments where more specialized food
sources are rare or absent. Subsequently, the inverse of this metric is added to the final IBI
(see below).
‐ Metric 6: percentage of individuals belonging to invertivores species.
‐ Metric 7: percentage of individuals belonging to piscivorous species at an adult stage
without necessarily being strictly piscivorous.
‐ Metric 8: Total PUE (in numbers) per fishing. In a disturbed environment the species
density is supposed to be less than that observed in an undisturbed environment.
The metric 1 to 4 report on the settlement’s functional diversity determined by the number of
species found in different taxonomic categories. The underlying assumption is that a disrupted
settlement will be less diversified than a non-disrupted settlement.
Metrics from 5 to 7 take into account the trophic structure, with the underlying assumption that
individuals on a special diet will be disadvantaged compared to omnivores facing a disruption
affecting food resources.
After being centered and reduced (multiplied by -1 in the case of the metric 5) the other 8 metric are
added to form the IBI. Low IBI values are then interpreted as resulting from the possible action of
one or more environmental disturbances.
In addition to the initial metric, we took into consideration 3 additional features:
Relative average length of individuals
Relative average condition factor
The percentage of mature individuals.
These three variables are centered, reduced (multiplied by -1 in the case of the relative length) and
aggregated to the IBI which is more sensitive to disturbances that can be induced on the biology of
P r e l i m i n a r y P l a n f o r F r e s h w a t e r B i o d i v e r s i t y M o n i t o r i n g i n t h e G a m b i a r i v e r b a s i n Page 29
species (reproduction and condition). To be clearer these 3 metrics give indications on reproduction
(relative average length and percentage of mature individuals) and feeding condition (Relative
average condition).
Measurement of physio-chemical parameters:
To assess the quality of fish habitats, it would also be necessary to measure water physio-chemical
parameters on the following elements: dissolved oxygen, salinity, depth, temperature, nature of
substrate, nitrate, phosphate and toxic chemicals.
7. MONITORING FREQUENCY
Within the framework of the species monitoring, it is important to clearly describe the frequency of
the monitoring which is related to the time interval to which the data must be collected. The period
of collection constitutes a determining factor in the nature of the results which will be obtained.
Indeed, according to the species and according to the periods of the year (for example rainy and dry
season), there is important variations of biological information of the species. For each taxon, a
frequency of monitoring was described.
7.1. Crabs
Bi-annual (one in dry season and another one in rainy season) sampling campaigns will be
conducted to better understand the composition and distribution of species and the inter-season
variability in the relative abundance of different species
7.2. Mollusks
Bi-annual (one in dry season and another one in rainy season) sampling campaigns will be
conducted to better understand the composition and distribution of species and the inter-season
variability in the relative abundance of different species
7.3. Odonata
Sampling will be done during the dry and rainy seasons, once every three years.
7.4. Birds
For the first year, a bi-monthly sampling should be undertaken in all identified sites in order to see
the population dynamics according to the environmental parameters.
7.5. Plants
P r e l i m i n a r y P l a n f o r F r e s h w a t e r B i o d i v e r s i t y M o n i t o r i n g i n t h e G a m b i a r i v e r b a s i n Page 30
The first monitoring will be conducted twice a year in the different sites already identified. The first
will be conducted during the dry season between March and April, and the second towards the end
of the rainy season between September and October. After an initial visit which will serve as
baseline, the monitoring must continue every year in order to provide maximum information that
may help at some point to assess evolution trends of flora and aquatic and semi-aquatic vegetation.
7.6. Fish
The first exploratory mission to select monitoring sites (GPS positions) and collection of general
information on the environment must be undertaken. Afterwards, four quarterly sampling
campaigns will take place at significant periods of the seasonal hydrologic cycle of The Gambia
river
‐ August / September: characterizing the rainy season
‐ October / November / December: characterizing the end of the rainy season
‐ February / March / April: characterizing the dry season
‐ May / June / July: characterizing the beginning of the rainy season
8. ACTORS AND PARTNERS INVOLVED IN THE MONITORING
The actors of the four OMVG member countries will ensure monitoring. These actors will consist
of the Ministries in charge of the Environment, research institutions, local collectivities, NGOs,
community-based organizations that will monitor the field. These actors are supported by partners
such as OMVG, Wetlands International Africa and other NGOs.
PARTNERS
ORGANIZATION FOR THE DEVELOPMENT OF THE GAMBIA RIVER (OMVG)
WETLANDS INTERNATIONAL
International Union for the Conservation of Nature (IUCN)
ACTORS
GAMBIA
National Environmental Agency (NEA),
P r e l i m i n a r y P l a n f o r F r e s h w a t e r B i o d i v e r s i t y M o n i t o r i n g i n t h e G a m b i a r i v e r b a s i n Page 31
Ministry of Natural Resources and Environment
Department of Water Resources
Department of Lands and Surveys
Soils and Water Management Unit
Universities and research institutions
Local collectivities
African Union, FAO, GEF and USAID Office for the international coordination of the Fouta
Djallon
The Green Gambia (Gambia)
NGOs and actors from the civil society
GUINEA
MINISTRY OF ENVIRONMENT
UNIVERSITIES AND RESEARCH INSTITUTIONS
LOCAL COLLECTIVITIES
NGOs and structures working in the environment SECTOR
GUINEA-BISSAU
MINISTRY OF ENVIRONMENT
MINISTRY OF NATURAL RESOURCES AND ENERGY
UNIVERSITIES AND RESEARCH INSTITUTIONS
NGOS AND STRUCTURES WORKING IN THE ENVIRONMENT SECTOR
Local Collectivities
SENEGAL
Ministry of Environment, protection of nature, artificial lakes and retention basins
UNIVERSITIES AND RESEARCH INSTITUTIONS
LOCAL COLLECTIVITIES
NGOS AND STRUCTURES WORKING IN THE ENVIRONMENT SECTOR
P r e l i m i n a r y P l a n f o r F r e s h w a t e r B i o d i v e r s i t y M o n i t o r i n g i n t h e G a m b i a r i v e r b a s i n Page 32
REFERENCE/BIBLIOGRAPHY
A.C.C.T. (1983). - Contribution aux Etudes Ethnobotaniques et floristiques à Maurice - Médecine
traditionnelle et Pharmacopée. 209 p.
Albaret , J.J. 1982. Reproduction et fécondité des poissons d'eau douce de Côte d'Ivoire. Rev. Hydrobiol.
Trop. 15 (4): 347-371. Paris
AUBREVILLE A. (1950). - Flore Forestière Soudano-Guinéenne. Paris, Société d'Editions Géographiques,
Maritimes et Coloniales 17, Rue Jacob (Vie) 523 p.
AUBREVILLE A. (1959). - Flore Forestière de la Côte d'Ivoire. Deuxième édit. Révisée. Tome premier.
C.T.F.T. n° 15 Nogent-sur Marne (Seine). - France. 368 p.
BA A. T., MADSEN J. E. & SAMBOU B. (1998). - Guide de l'Herbier "DAKAER" AAU REPORTS 38,
100 p.
Barlow, C. & Wacher, T. (1997) A field guide to Birds of the Gambia and Senegal. Pica Press Ed. 400p.
BARTELS A. (1993). - Guide des plantes tropicales. Plantes ornementales, plantes utiles, fruits exotiques.
Ulmer 384 p.
Benech, V. 1990. Contribution à la connaissance de la reproduction de quelques espèces d’intérêt halieutique
dans le Delta central du Niger. Atelier IER/ORSTOM "Etudes halieutiques dans le Delta Central du Niger',
Bamako, novembre 1990, 17p.
BERHAUT J. (1967). - Flore du Sénégal. Deuxième édit. Clairafrique, 485 P.
BERHAUT J. (1971 - 1979). - Flore Illustrée du Sénégal, Tom. I -VI. Gouvernement du Sénégal, Ministère
du Développement Rural, Direction des Eaux et Forêts.
BROWN, D. 1994. Fresh water snails of Africa and their medical importance, 2nd ed. Taylor and Francis Ltd,
609 S., London
Cannings R. (2000). - Collecting Odonata (Dragonflies, including Damselflies). Polycope, 3p.
P r e l i m i n a r y P l a n f o r F r e s h w a t e r B i o d i v e r s i t y M o n i t o r i n g i n t h e G a m b i a r i v e r b a s i n Page 33
Chikou, A. Etude de la démographie et de l’exploitation halieutique de six espèces de poissons-chats
(Teleostei, Siluriformes) dans le Delta de lOuémé au Bénin. Thèse de Doctorat. Université de Liège-
Belgique. 2006
Clausnitzer V. (2003). - Dragonfly communities in coastal habitats of Kenya: indication of biotope quality
and the need of conservation measures. Biodiversity and Conservation 12: 333–356.
Cumberlidge, N. 1999. The freshwater Crabs of West Africa. Family Potamonautidae. pp. 1-320, Faune et
Flore Tropicales 35, ORSTOM, Paris.
DAGET, J. 1961. Le parc national du Niokolo-koba. II Mollusques d’eau douce. Mém. I.F.A.N., Dakar, 62,
2: 13-29
Daget, J. 1962. Les poissons du Fouta Dialon et de la Basse Guinée. Me". I.F.A.N., 65, 210 pp.
DAGET, J. 1998. Catalogue raisonnée des Mollusques bivalves d’eau douce africains. - O. R. S. T. O. M.,
Paris
De Vos, L. & C. Lévêque. 1983. Etude systématique et morphologique du genre Eutropius en Afrique de
l'Ouest. Rev. Zool. afi-., 97 (3) : 469-532.
Diagana, C. H. & Dodman, T. (2006) Les Dénombrements des Oiseaux d’eau en Afrique (DOEA) 2002-
2004. 323p.
DIAW, O. T. & VASSILIADES, G. 1987. Epidémiologie des schistosomes du bétail Sénégal. - Revue Élev.
Méd. vét. pays trop. 40: 265-274
DIAW, O.T. 1992. Epidémiologie des Trématodes du Bétail et étude des Mollusques hôtes intermédiaires
dans le département de Tambacounda. Rapport de synthèse
Diouf, P.S. 1996. Les peuplements de poissons des milieux estuariens de l'Afrique de l'Ouest: L'exemple de
l'estuaire hyperhalin du Sine-Saloum. Thèse présentée à L'Université de Montpellier II pour l'obtention du
Diplomede Doctorat.
Dodman, T. & Diagana, C. H. (2003) Les Dénombrements des Oiseaux d’eau en Afrique (DOEA) 1999-
2001. Wetlands International Global Series N°16. 368p.
Doucet G., (2007). - Les Odonates des tourbières de Haute-Saône (70) : Recherche des différents cortèges et
caractérisation des habitats larvaires. Exemple de la leucorrhine à gros thorax, Leucorrhinia
pectoralis (Chapentier, 1825). Quelle méthode pour un suivi en routine de ces milieux ? Espace
Naturel Comtois O.P.I.E. Franche-Comte, 61 p.
Durand, J. R. & Lévêque, C.1980- Flore et Faune aquatiques de l'Afrique Sahelo-soudanienne, ORSTOM
Paris, 389p.
P r e l i m i n a r y P l a n f o r F r e s h w a t e r B i o d i v e r s i t y M o n i t o r i n g i n t h e G a m b i a r i v e r b a s i n Page 34
Emms, C. and Barnett, L.K. 2006. Gambian biodiversity: A provisional checklist of all species recorded
within The Gambia, West Africa, part three: fungi and plants, 4th version.
Entsua-Mensah, M. 1996. Threats to Freshwater Fishery Resources. Proceedings of Workshop on
Biodiversity. Legon.
Erich Haber . 1997 - Guide de surveillance des plantes exotiques et envahissantes, National Botanical
Services 604, avenue Wavell, Ottawa (Ontario) Canada K2A 3A8, Le Réseau d'évaluation et de surveillance
écologiques
Ministère de l'Environnement du Canada
GERLING C. (1982). - Guide de terrain des ligneux sahéliens et soudano-guinéens. Université Agronomique
de Wageningen, Pays-Bas. 340 p.
GRALL, J., COÏC, .N. 2006. Synthèse des méthodes d’évaluation de la qualité du benthos en milieu côtier.
2006 – REF. Ifremer DYNECO/VIGIES/06-13/Rebent
GRETILLAT, S. 1961. Epidémiologie de la bilharziose vésicale au Sénégal Oriental. Observations sur
l’écologie de Bulinus guernei et de Bulinus senegalensis. - Bull. Wld. Hlth. Org. 25: 459-466
Heather E. W., McCullough, J. et Diallo, M. 2006. Un inventaire biologique rapide de la préfecture de Boké
dans le nord-ouest de la Guinée. Bulletin RAP d’évaluation Rapide 41.