R ESEARCH ARTICLE doi: 10.2306/scienceasia1513-1874.2009.35.170 ScienceAsia 35 (2009): 170–177 Integration of land evaluation and the analytical hierarchical process method for energy crops in Kanchanaburi, Thailand Kanlaya Tienwong a,* , Songkot Dasananda a , Chalie Navanugraha b a School of Remote Sensing, Institute of Science, Suranaree University of Technology, Nakornratchasima 30000, Thailand b Faculty of Environment and Resource Studies, Mahidol University, Nakornpathom 73000, Thailand * Corresponding author, e-mail: [email protected]Received 9 Sep 2008 Accepted 18 Feb 2009 ABSTRACT: The main objective of this study is to evaluate the land suitability for cultivation of some economically important energy crops, which are sugarcane and cassava, in Kanchanaburi province, Thailand. To achieve this goal, multi- criteria decision making (MCDM) integrated with the 1976 FAO framework for crop plantation was used to assess suitable areas for growing these crops. Several biological and economical factors involved in the analysis were selected based on the FAO framework and experts’ opinions. Their data were kept, displayed, and used as individual and combined GIS layers. Each factor received a weight and a score which represented its relative importance in the suitability evaluation by using the analytical-hierarchical process method which is one of the widely used MCDM techniques. A land suitability map for each crop selected was produced based on the linear combination of weight and rating score of each factor involved and classified into 4 suitability classes according to the FAO standard. The proportion of the area highly suitable or moderately suitable for cultivation of sugarcane was 52%, and for cultivation of cassava, 45%. Only a small percentage of the area was not suitable. Typically, the most suitable areas for both crops were located in the eastern and lower part of the province having highly fertile soil and abundant water resources available therein. It was also found that most parts of the suitable area of both crops were located in the existing agricultural land (but being used for other crops/plants). KEYWORDS: multi-criteria decision making, GIS, sugarcane, cassava INTRODUCTION It is clear that the energy crisis has spread all over the world as the price of petroleum has dramatically increased in recent years. One possible solution to ease this problem is to find renewable energy source such as ethanol as an alternative to petroleum. Ethanol is a liquid obtained from biomass of agricultural raw materials. Typically, two of the most popular crops for producing ethanol are sugarcane and cassava because they are cheaper than other candidate crops. As a result, the Thai government has recently issued a new policy in order to increase production of these two crops to meet growing demand in the energy market. The main objective of this study is therefore to find suitable areas for cultivating these crops efficiently. The land evaluation method is the systematic as- sessment of land potential to find out the most suitable area for cultivating some specific crop. Theoretically, the potential of land suitability for agricultural use is determined by an evaluation process of the climate, soil, water resources, topographical, and environmen- tal components under the criteria given and the under- standing of local biophysical restraints 1 . At present, this process could be done efficiently and conveniently by using multi-criteria decision making (MCDM) in- tegrated with a geographic-information system (GIS), which is an essential tool in storage, management, and analysis of spatial and non-spatial data. In the process, data of all selected factors (for each crop) are kept, displayed, and managed as individual or combined GIS layers which make them convenient to be analysed together spatially. Each factor (or criterion) is given a specific weight, which represents its relative importance in the suitability evaluation, by using some MCDM techniques like multi-criteria evaluation (MCE) or analytical hierarchical process (AHP). Each criteria weight could be multiplied with its associated criteria suitability rating (or score) for each land mapping unit and the results (from all factors) could be summed to produce a suitability score for each land unit of the final suitability map www.scienceasia.org
Transcript
R ESEARCH ARTICLE
doi: 10.2306/scienceasia1513-1874.2009.35.170
ScienceAsia35 (2009): 170–177
Integration of land evaluation and the analyticalhierarchical process method for energy crops inKanchanaburi, ThailandKanlaya Tienwonga,∗, Songkot Dasanandaa, Chalie Navanugrahab
a School of Remote Sensing, Institute of Science, Suranaree University of Technology,Nakornratchasima 30000, Thailand
b Faculty of Environment and Resource Studies, Mahidol University, Nakornpathom 73000, Thailand
ABSTRACT : The main objective of this study is to evaluate the land suitability for cultivation of some economicallyimportant energy crops, which are sugarcane and cassava, in Kanchanaburi province, Thailand. To achieve this goal, multi-criteria decision making (MCDM) integrated with the 1976 FAO framework for crop plantation was used to assess suitableareas for growing these crops. Several biological and economical factors involved in the analysis were selected based on theFAO framework and experts’ opinions. Their data were kept, displayed, and used as individual and combined GIS layers.Each factor received a weight and a score which represented its relative importance in the suitability evaluation by using theanalytical-hierarchical process method which is one of the widely used MCDM techniques. A land suitability map for eachcrop selected was produced based on the linear combination of weight and rating score of each factor involved and classifiedinto 4 suitability classes according to the FAO standard. The proportion of the area highly suitable or moderately suitablefor cultivation of sugarcane was 52%, and for cultivation of cassava, 45%. Only a small percentage of the area was notsuitable. Typically, the most suitable areas for both crops were located in the eastern and lower part of the province havinghighly fertile soil and abundant water resources available therein. It was also found that most parts of the suitable area ofboth crops were located in the existing agricultural land (but being used for other crops/plants).
It is clear that the energy crisis has spread all overthe world as the price of petroleum has dramaticallyincreased in recent years. One possible solution toease this problem is to find renewable energy sourcesuch as ethanol as an alternative to petroleum. Ethanolis a liquid obtained from biomass of agricultural rawmaterials. Typically, two of the most popular crops forproducing ethanol are sugarcane and cassava becausethey are cheaper than other candidate crops. As aresult, the Thai government has recently issued a newpolicy in order to increase production of these twocrops to meet growing demand in the energy market.The main objective of this study is therefore to findsuitable areas for cultivating these crops efficiently.
The land evaluation method is the systematic as-sessment of land potential to find out the most suitablearea for cultivating some specific crop. Theoretically,the potential of land suitability for agricultural use isdetermined by an evaluation process of the climate,
soil, water resources, topographical, and environmen-tal components under the criteria given and the under-standing of local biophysical restraints1. At present,this process could be done efficiently and convenientlyby using multi-criteria decision making (MCDM) in-tegrated with a geographic-information system (GIS),which is an essential tool in storage, management,and analysis of spatial and non-spatial data. In theprocess, data of all selected factors (for each crop)are kept, displayed, and managed as individual orcombined GIS layers which make them convenientto be analysed together spatially. Each factor (orcriterion) is given a specific weight, which representsits relative importance in the suitability evaluation,by using some MCDM techniques like multi-criteriaevaluation (MCE) or analytical hierarchical process(AHP). Each criteria weight could be multiplied withits associated criteria suitability rating (or score) foreach land mapping unit and the results (from allfactors) could be summed to produce a suitabilityscore for each land unit of the final suitability map
later using the GIS overlay technique.There have been a number of studies that have
employed the above methods. Ceballos-Silva andLopez-Blanco1 applied the MCE approach to delin-eate suitable areas for maize and potato crops inToluca, Central Mexico. Relevant criteria for cropsand suitability levels were defined according to FAOstandards, and criteria maps were introduced in theMCE algorithm to obtain a suitability map for eachcrop. Prakash2 studied land suitability analysis forrice in the Dehradum district, India. The parame-ters for evaluation included soil, climate, irrigationarea, and some socio-economic data (markets andinfrastructure). In that study, the AHP technique wasintegrated with fuzzy logic to determine suitable areafor the crop. Thapa and Murayama3 used the AHPtechnique to evaluate land suitability for peri-urbanagriculture in Hanoi city. The results showed that thistechnique could be very effective in helping policymakers to carry out a rapid assessment of the land.In addition, Boonyanuphap et al4 assessed suitableareas for banana plantation in Phitsanulok province,Thailand using several combined factors. After that,the suitable area obtained was overlaid with a currentland use map to find new possible sites for bananaplantations in that province.
DATA AND METHODS
Study area
The study area is Kanchanaburi province which coversan area of 19 483 km2 and is divided into thirteendistricts. The topography of Kanchanaburi is a com-bination of mountain ranges, valleys, and river plains(Fig. 1). The northern and western parts are mostlycovered with mountain, there is undulating land inthe northeast, and the far east and the south areriver plains. Important water resources found in theprovince are four dams and three main rivers. Thelocal climate is tropical savannah, like most areas inCentral and Northern Thailand.
There are 51 classified soil types in Kanchanaburiwhich fall into 14 great soil groups. These soil groupsare formed from various soil parent materials, i.e.granite, limestone, and sandstone shale which can beweathered in place or transported by flood. Only35% of the provincial area is not protected forestsor conservation zones and can therefore be used fordoing agriculture. Within this area, the most predom-inant soil groups found are paleustalfs and paleustultswhich occupy about 31.5% and 30.7% of the area,respectively, spreading in the east, west, and south.
SAI YOK
SRI SAWAT
SANG KABURI
THONG PHA PHUM
BO PHLOI
LAOW KWAN
NONG PHU
MUANG KANCHANABURI
THAMUANG
HUAI KRACHAO
DANMAKHAM TIA
PHANOM THUAN
420000
420000
450000
450000
480000
480000
510000
510000
540000
540000
570000
570000
1540000
1540000
1570000
1570000
1600000
1600000
1630000
1630000
1660000
1660000
1690000
1690000
1720000
1720000
0 9 18 27 364.5
km
High : 1745
Low : 63
Water Resource
Fig. 1 Topography map of Kanchanaburi province, Thai-land.
Data sources
The data used in this study were collected from avariety of sources. Firstly, the primary data from thefield survey were collected through observation andquestionnaires answered by experts in the field foridentifying factors that are important for sugarcaneand cassava planting in Kanchanaburi province. Also,a Lansat-5 TM satellite image from 2006 was used forland use/cover (LUC) classification along with GPSdata, digital maps, and statistical data.
For land suitability evaluation, 9 factors (in theform of 9 GIS-based layers) were used for sugarcaneand 10 for cassava. These factors were chosen ac-cording to 1976 FAO framework6 and professionalopinions given by 20 experts in this field throughquestionnaires distributed. The physical factors weretopography (slope), climate (annual rainfall, tempera-ture), soil potential and water supply (distance fromwater body, stream or rivers, irrigation zone). Thesocio-economic factors were the distance from mainroad and the distance from sugar factories, or the dis-tance from cassava chip point, the cassava modifyingfactory.
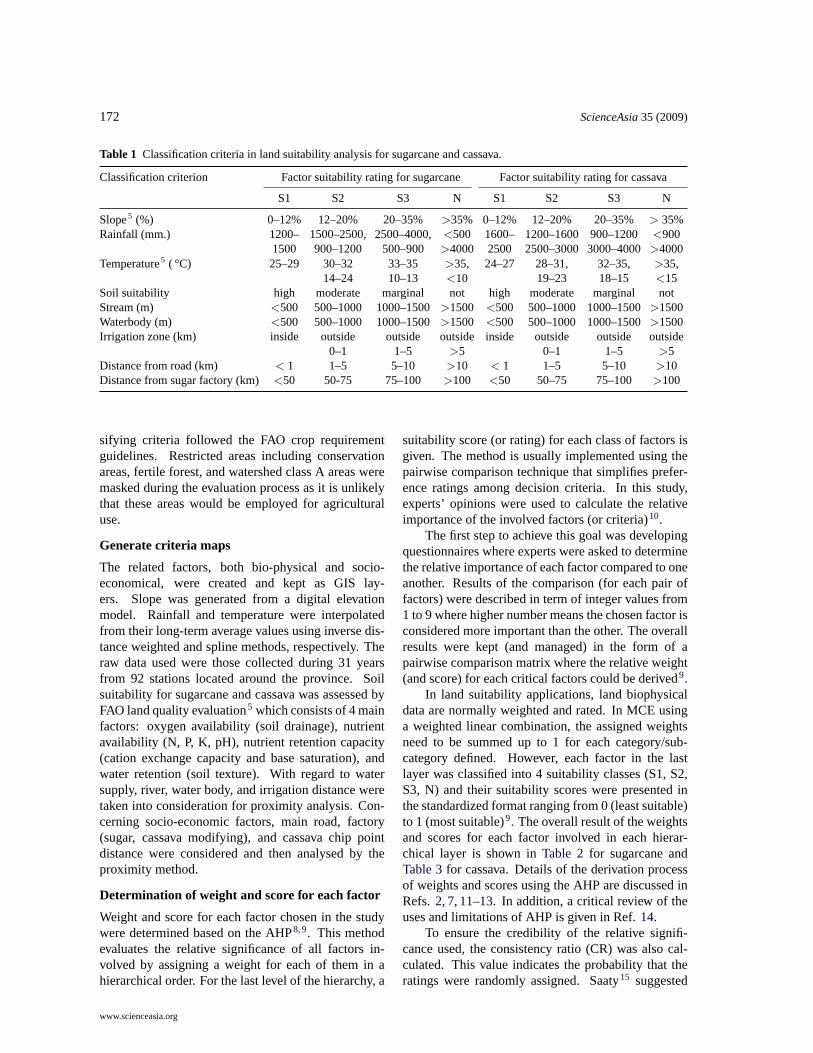
The degree of suitability of each factor for eachland unit studied was classified as highly suitable (S1),moderately suitable (S2), marginally suitable (S3),or not suitable (N), as seen inTable 1. The clas-
sifying criteria followed the FAO crop requirementguidelines. Restricted areas including conservationareas, fertile forest, and watershed class A areas weremasked during the evaluation process as it is unlikelythat these areas would be employed for agriculturaluse.
Generate criteria maps
The related factors, both bio-physical and socio-economical, were created and kept as GIS lay-ers. Slope was generated from a digital elevationmodel. Rainfall and temperature were interpolatedfrom their long-term average values using inverse dis-tance weighted and spline methods, respectively. Theraw data used were those collected during 31 yearsfrom 92 stations located around the province. Soilsuitability for sugarcane and cassava was assessed byFAO land quality evaluation5 which consists of 4 mainfactors: oxygen availability (soil drainage), nutrientavailability (N, P, K, pH), nutrient retention capacity(cation exchange capacity and base saturation), andwater retention (soil texture). With regard to watersupply, river, water body, and irrigation distance weretaken into consideration for proximity analysis. Con-cerning socio-economic factors, main road, factory(sugar, cassava modifying), and cassava chip pointdistance were considered and then analysed by theproximity method.
Determination of weight and score for each factor
Weight and score for each factor chosen in the studywere determined based on the AHP8,9. This methodevaluates the relative significance of all factors in-volved by assigning a weight for each of them in ahierarchical order. For the last level of the hierarchy, a
suitability score (or rating) for each class of factors isgiven. The method is usually implemented using thepairwise comparison technique that simplifies prefer-ence ratings among decision criteria. In this study,experts’ opinions were used to calculate the relativeimportance of the involved factors (or criteria)10.
The first step to achieve this goal was developingquestionnaires where experts were asked to determinethe relative importance of each factor compared to oneanother. Results of the comparison (for each pair offactors) were described in term of integer values from1 to 9 where higher number means the chosen factor isconsidered more important than the other. The overallresults were kept (and managed) in the form of apairwise comparison matrix where the relative weight(and score) for each critical factors could be derived9.
In land suitability applications, land biophysicaldata are normally weighted and rated. In MCE usinga weighted linear combination, the assigned weightsneed to be summed up to 1 for each category/sub-category defined. However, each factor in the lastlayer was classified into 4 suitability classes (S1, S2,S3, N) and their suitability scores were presented inthe standardized format ranging from 0 (least suitable)to 1 (most suitable)9. The overall result of the weightsand scores for each factor involved in each hierar-chical layer is shown inTable 2 for sugarcane andTable 3for cassava. Details of the derivation processof weights and scores using the AHP are discussed inRefs.2,7,11–13. In addition, a critical review of theuses and limitations of AHP is given in Ref.14.
To ensure the credibility of the relative signifi-cance used, the consistency ratio (CR) was also cal-culated. This value indicates the probability that theratings were randomly assigned. Saaty15 suggested
that if the CR is smaller than 0.10 then the degree ofconsistency is fairly acceptable. But if it is larger than0.10 then there are inconsistencies in the considera-tion, and the AHP may not yield meaningful results.Brief details of the CR calculation are given in Refs.11,13.
The AHP weights were calculated using Mi-crosoft Excel. The values of the CR were alsocalculated and found to be 0.06 for sugarcane and 0.01for cassava, which are acceptable for using the AHP.
Land suitability assessment
Land suitability maps were made using the GISoverlay technique available in ARCGIS 9.2 wherespatial data of each factor were kept and displayedas GIS spatial layers (9 layers for sugarcane and 10layers for cassava). The total suitability scoreRs foreach land unit (i.e. each raster cell in the map) wascalculated from the linear combination of suitabilityscore obtained for each factor (or criterion) involved:
N 0.097Socio- 0.292 Market 1 Distance 0.323 0.094 S1 1economic from S2 0.425
cassava S3 0.222chip point N 0.089Distance 0.158 0.046 S1 1from modify S2 0.442cassava S3 0.225factories N 0.089
wheren is the number of factors,Wi is the multipli-cation of all associated weights in the hierarchy ofithfactor (as seen in Tables2 and3) andSi is the ratinggiven for the defined class of theith factor found onthe assessed land unit1,17.
The total suitability scores from each land unithad a score ranging between 0 to 1 and were assem-bled to create land suitability map for each selectedcrop. Data in the maps were divided to represent4 suitability classes according to the FAO frame-
The obtained suitability map was applied to real culti-vation practice to find areas where sugarcane and cas-sava could be cultivated more in the future by cross-tabulating with land use/cover (LUC) map for 2006.The LUC map for 2006 was derived from a Landsat-5
TM image taken on 3rd February 2006 and using 453-RGB combination. The supervised classification wasemployed using maximum likelihood. There were 12LUC classes presented in the map.
RESULTS AND DISCUSSION
Classified land suitability maps
From the suitability maps obtained, as seen inFig. 2for sugarcane andFig. 3for cassava, it was found thatthe most suitable areas for these crops were locatedin the eastern and lower part of the province dueto a fairly fertile soil and abundant water resourcesavailable therein. The highly suitable area for cassavaplantation could be found more easily than for sugar-cane because, as a drought resistant crop, it can growin dry areas and sandy soil, whereas sugarcane needsmore water and better quality soil to grow effectively.Normally, areas suitable for sugarcane can be found inthe plain area close to main water resources, such asbig rivers or reservoirs, while cassava could be plantedin the more up-hill areas further away from the mainrivers.
Results of the area coverage in the classifiedsuitability map for both crops are shown inTable 4. Itwas found that about 52.5% of the area was classifiedas highly/moderately suitable for sugarcane plantationand 45.1% for cassava. Only a few percent wasclassified as not suitable area (2.46% for sugarcaneand 5.57% for cassava). However, the amount ofhighly suitable area for cassava (21.5%) is signifi-cantly higher than that of sugarcane (6.9%). Resultsof the finding indicated that Muang and Sai Yok dis-tricts were potentially suitable areas for these crops,while Bophloi and Danmakham Tia districts were thepotential areas for cassava plantation.
Classified LUC map using Landsat-TM image
From the accuracy assessment process, it was foundthat the overall accuracy of the classification resultwas 79.58% and the kappa index was 78%.Table 5shows the area coverage of each LUC class foundin Fig. 4. It could be seen that, from the total areaof 19 382 km2 of the province being classified, about66% was classified as forest area while 28% was usedfor various agricultural uses, such as planting rice,
SAI YOK
SRI SAWAT
SANG KABURI
THONG PHA PHUM
BO PHLOI
LAOW KWAN
NONG PHU
MUANG KANCHANABURI
THAMUANG
HUAI KRACHAO
DANMAKHAM TIA
PHANOM THUAN
420000
420000
450000
450000
480000
480000
510000
510000
540000
540000
570000
570000
1540000
1540000
1570000
1570000
1600000
1600000
1630000
1630000
1660000
1660000
1690000
1690000
1720000
1720000
0 9 18 27 364.5
km
S1:Highly suitable area
S2:Moderately suitable area
S3:Marginally suitable area
N:not suitable area
Water Resource
Fig. 2 Classified land suitability map for sugarcane inKanchanaburi province.
SAI YOK
SRI SAWAT
SANG KABURI
THONG PHA PHUM
BO PHLOI
LAOW KWAN
NONG PHU
MUANG KANCHANABURI
THAMUANG
HUAI KRACHAO
DANMAKHAM TIA
PHANOM THUAN
420000
420000
450000
450000
480000
480000
510000
510000
540000
540000
570000
570000
1540000
1540000
1570000
1570000
1600000
1600000
1630000
1630000
1660000
1660000
1690000
1690000
1720000
1720000
0 9 18 27 364.5
km
S1:Highly suitable area
S2:Moderately suitable area
S3:Marginally suitable area
N:Not suitable area
Water Resource
Fig. 3 Classified land suitability map for cassava in Kan-chanaburi province.
sugarcane, cassava, and other crops/trees. Less than1% was classified as urban/built-up area.
Sugarcane 1253.94 6.47Cassava 573.70 2.96Paddy field 399.24 2.06Eucalyptus 362.08 1.87Pineapple 70.70 0.36Other Agricultural 2758.31 14.23Dry evergreen forest 5513.28 28.45Mixed deciduous forest 5332.49 27.51Dry dipterocarp forest 2018.62 10.42Water body 812.01 4.19Urban and built-up area 182.90 0.94Miscellaneous 104.47 0.54Total area 19381.74 100
Comparison between suitability map and LUCmap
After land suitability maps for both crop were created(Fig. 2 and Fig. 3) and the restricted areas weremarked, they were compared with LUC map in 2006(Fig. 4) to find potential areas where these crops couldbe planted further apart from the existing growing area
Table 6 Percentage existing LUC for each sugarcanesuitability class.
presently found in the LUC map. Results of the com-parison for both crops (Tables6 and7), indicated thatthe highly and moderately suitable areas fell upon twoLUC features which are forest areas (dry evergreenforest and mixed deciduous forest in particular) apartfrom the restricted area marked from the study, andthe area which is currently employed for agriculturaluse already, especially for growing some crops/trees.
Considering plantation area of sugarcane and cas-sava in particular, it could be seen that the presentgrowing areas for both crops are still small comparedto the potential suitable area found in the analy-sis (highly/moderately suitable areas in particular).Therefore, it is still highly possible to expand growingarea for these crops by converting the existing agricul-tural areas which are being used for other crops/trees(like paddy fields) to cultivate these two energy cropsinstead.
In summary, the government might consider pro-viding some degraded forest areas (outside the con-servation zone) for local farmers as land resourcesfor growing these crops. If these suggestions weredone efficiently, a significant increase in the amountof sugarcane and cassava production could possibly
Acknowledgements: The authors gratefully thank theRoyal Thai Government Scholarship for financial support.We would also like to express thanks to GITSDA for thesatellite image data and to the experts for their valuablecooperation. Finally, special thanks are given to the anony-mous referees and the editor for their useful suggestions inthe revision of this manuscript.
REFERENCES
1. Ceballos-Silva A, Lopez-Blanco J (2003) Delineationof suitable areas for crops using a Multi-Criteria Eval-uation approach and land use/cover mapping: a casestudy in Central Mexico.Agr Syst77, 117–36.
2. Prakash TN (2003) Land suitability for agriculturalcrops: A fuzzy multicriteria decision making approach.MSc thesis, International Institute for Geo-informationScience and Earth Observation.
3. Thapa RB, Murayama Y (2007) Land evaluation forperi-urban agriculture using analytical hierarchical pro-cess and geographic information system techniques: Acase study of Hanoi.Land Use Pol25, 225–39.
4. Boonyanuphap J, Det W, Kasutoshi S (2004) GIS-based land suitability assessment for Musa (ABB-group) plantation.J Appl Hort6, 3–10.
5. Saifuk K, Tunsiri B (1996)Qualitative Land Eval-uation for Economic Crops, Land Development De-partment, Ministry of Agriculture and Cooperatives,Thailand.
6. Food Agriculture Organization of the United Nations(1976) A Framework For Land Evaluation, Soil Bul-letin No 32, FAO, Rome.
7. Mu Y (2006) Developing a suitability index for residen-tial land use: A case study in Dianchi Drainage Area.MSc thesis, Univ of Waterloo.
8. Saaty TL (1977) A scaling method for priorities inhierarchical structure.J Math Psychol15, 234–81.
11. Ma J, Scott NR, DeGloria SD, Lembo AJ (2005) Sitinganalysis of farm-based centralized anaerobic digestersystems for distributed generation using GIS.BiomassBioenerg28, 591–600.
12. Duc TT (2006) Using GIS and AHP technique forland use suitability analysis. In: Proceedings of the In-ternational Symposium on Geoinformatics for SpatialInfrastructure Development, Ho Chi Min, pp 1–6.
13. Hossain M, Chowdhury SR, Das NG, Rahaman MM(2007) Multi-criteria evaluation approach to GIS-basedland suitability classification for tilapia farming inBangladesh.Aquacult Int15, 425–43.
14. Qureshi ME, Harrison SR (2003) Application of the an-
alytic hierarchy process to riparian revegetation policyoptions. Small-scale forest economics.Manag Pol2,441–58.
15. Saaty TL (1980)The Analytic Hierarchy Process,McGraw-Hill, New York.
16. Dansagoonpon S (2006) Crop substitution modelingusing remote sensing and GIS. PhD thesis, AsianInstitute of Technology.
17. Liu Y, Lv X, Qin X, Guo H, Yu Y, Wang J, Mao G(2007) An integrated GIS-based analysis system forland use management of lake areas in urban fringe.Landsc Urban Plann82, 233–46.
18. Food Agriculture Organization of the United Nations(1983)Guidelines: Land Evaluation for Rainfed Agri-culture, Soil Bulletin No 52, FAO, Rome.