Page 1
IAGI Journal
Volume 1 No. 2, August 2021: 55–70 e-ISSN 2776-0111
z
55
Integration of Petrophysical Analysis and Elastic Log Properties as an Input
to Optimize the Development Wells Target in Unique Globigerina Limestone
Gas Reservoir in Madura Strait
Hendra Himawan*, Indra Sumantri, Okky Yuditya Pahlevi
Husky-CNOOC Madura Limited, Indonesia Stock Exchange Building Tower 1
Jend. Sudirman St., Kav 52 Jakarta 12190, Indonesia
*E-mail: [email protected]
Article received: 8 July 2021, revised: 10 July 2021, accepted: 30 August 2021
DOI: 10.51835/iagij.2021.1.2.31
ABSTRACT
The Madura Strait PSC is located in the southern part of North East Java Basin with biogenic gas from
Globigerina limestone Pliocene Mundu and Selorejo sequence as main target. At early stage of field development,
understanding and knowledge about petrophysical and elastic properties of reservoir rock quality is required and
very important. The petrophysical analysis provide properties such as clay volume, porosity, permeability, water
saturation and mineral volume to separate reservoir and non-reservoir zone. The elastic rock properties such as
acoustic impedance (AI), shear impedance (SI), velocity ratio (Vp/Vs), and Poisson’s ratio (σ) were generated to
identify clay zone, gas and non-gas also focused to distinguish reservoir rock quality inside gas zone as an effective
reservoir characterization. This research is done by utilize core data, quad combo logs from eleven wells and shear
velocity from eight wells. The purpose of this research is to optimize development well target in Globigerina
limestone gas reservoir, which have good to best reservoir rock quality shown with high porosity and permeability,
low clay volume and water saturation. Results from this research indicate that lime mud matrix have significant
impact in the reservoir rock quality. Meanwhile, gas saturation can affect the elastic properties due to this high gas
saturation can decrease compressional velocity (Vp) value. Finally, the integration of petrophysical result and
combination of elastic properties implementation can help in distinguishing the best reservoir rock quality, which
contains gas that should be penetrated by the development wells.
Keywords: Globigerina Limestone, petrophysical analysis, elastic properties, reservoir quality
INTRODUCTION
Reservoir characterization is closely
related to the understanding of both vertical
and lateral reservoir heterogeneity distribution.
Understanding in the vertical heterogeneity of
reservoir has always been crucial in reservoir
characterization. A successful reservoir
characterization starts with petrophysical
evaluation. Petrophysics combines wireline
logging, core, mudlog, and other disparate data
sources for evaluating, predicting, and
establishing formation lithology, clay volume,
porosity, permeability and water saturation [1].
Wireline logging is a study of acquiring
physical properties of rocks during or after
drilling of a well. Standard wireline log that
usually acquired consist of gamma ray (GR),
resistivity (micro, shallow and deep), neutron,
density (ρ), compressional and shear wave
velocities (Vp and Vs). Density, Vp and Vs are
mainly related to the elastic parameter which
are controlled by the solid component (mineral
composition, compaction, clay content,
porosity and pore geometry) and also the
contained fluid (oil, gas, free water, bound
water, and saturation) [2]. Among the various
factor affecting velocity, porosity and
Page 2
Integration of Petrophysical Analysis and Elastic Log Properties as an Input to Optimize the Development Wells
Target in Unique Globigerina Limestone Gas Reservoir in Madura Strait
Hendra Himawan, et al.
56
hydrocarbon saturation has dominant control.
Higher porosity and hydrocarbon saturation
leads to lower bulk density, lower rock rigidity
and incompressibility, and accordingly, lower
Vp and Vs [3].
This research focusses on elastic
properties analysis inside gas bearing interval
that is used to optimize development well
target that should be penetrated by
development wells. The appropriate cluster of
elastic properties can distinguish the best
reservoir quality, which have high porosity and
permeability, low clay content, and low water
saturation. This can be as an input to
geophysicist because ρ, Vp, Vs and elastic
parameter are so important. This also can be
input for geologist when building a static
model. These parameters are key to understand
the lateral heterogeneity, reservoir quality
distribution and generate the geobody of sweet
spot.
REGIONAL GEOLOGY
The Madura Strait PSC is located in the
southern part of North East Java Basin. Major
plate movements are responsible for much of
the structural development with local
stratigraphy and faulting in the sub-basins
affected by change in sea level, local
structuring and plate interactions. The tectono-
stratigraphy megasequences of this area
divided into three main events, Late
Cretaceous, Paleogene and Neogene-present
[4]. This paper focus on Neogene-present, due
to one of the most widely spread reservoirs
coming from Mundu – Selorejo sequences
which exist on Neogene-present event as
shown in Figure 1.
Figure 1. a) Location of Study Area (modified from [4]). b) Regional Geology of Madura strait PSC (modified from
[5]).
Regionally, the main reservoir target for
Pliocene play is the Mundu-Selorejo
Sequence. The Mundu Sequence comprises
bioclastics grainstones, packstones and
wackestone. The sequence is deposited at
upper part of Late Miocene to Early Pliocene
with the T50 at the top of the sequence as
sequence boundary between Mundu and
Selorejo Sequence. Meanwhile, within the
Mundu Sequence there is T40A sequence
boundary which recognized by nano fossil
zonation. The Selorejo Sequence represents a
distinct stratigraphic unit distinguished from
the underlying Mundu Sequence both on age
and on the presence of a significant structural
event at end of the Mundu times. In general,
the grainstones may be less argillaceous. It is
deposited at Middle Pliocene to Late Pliocene
a)
b)
Page 3
IAGI Journal
Volume 1 No. 2, August 2021: 55–70 e-ISSN 2776-0111
57
with T60 sequence boundary at the top of the
sequence. This sequence boundary
distinguished the Lidah Pleistocene Sequence
with the Selorejo Pliocene Sequence.
Globigerina limestone terminology that is
usually used comprises both the Mundu and
Selorejo Sequences [6].
Based on gas geochemistry study, the
genetic type of natural gas has been identified
in the area is biogenic gas which contain
methane more than 96%. The biogenic gas was
sourced by the Miocene to Pleistocene
Claystone or fine grained which interbedded
with reservoir. The Globigerina limestone
consists of bioclastic facies limestone,
characterized by the abundance of Globigerina
foraminifera. Major porosity types
encountered in this sequence are intra-particle
porosity within foraminifera shell and inter-
particle porosity (between foraminifera). The
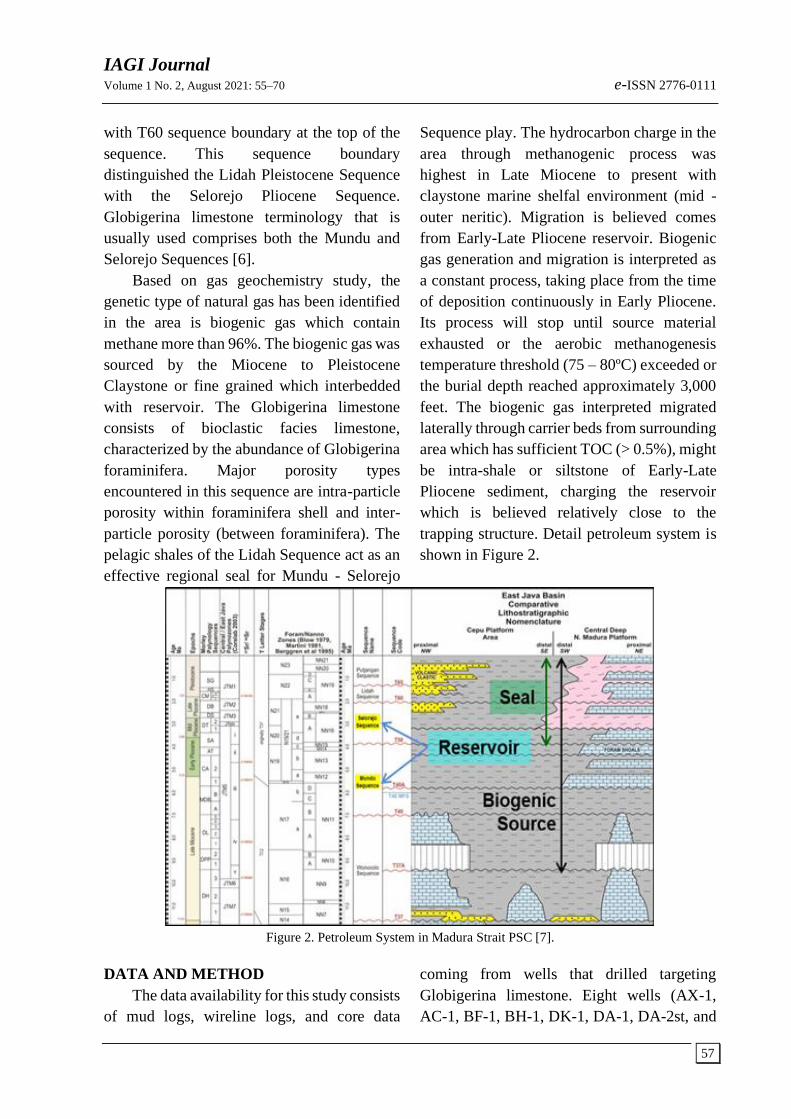
pelagic shales of the Lidah Sequence act as an
effective regional seal for Mundu - Selorejo
Sequence play. The hydrocarbon charge in the
area through methanogenic process was
highest in Late Miocene to present with
claystone marine shelfal environment (mid -
outer neritic). Migration is believed comes
from Early-Late Pliocene reservoir. Biogenic
gas generation and migration is interpreted as
a constant process, taking place from the time
of deposition continuously in Early Pliocene.
Its process will stop until source material
exhausted or the aerobic methanogenesis
temperature threshold (75 – 80ºC) exceeded or
the burial depth reached approximately 3,000
feet. The biogenic gas interpreted migrated
laterally through carrier beds from surrounding
area which has sufficient TOC (> 0.5%), might
be intra-shale or siltstone of Early-Late
Pliocene sediment, charging the reservoir
which is believed relatively close to the
trapping structure. Detail petroleum system is
shown in Figure 2.
Figure 2. Petroleum System in Madura Strait PSC [7].
DATA AND METHOD
The data availability for this study consists
of mud logs, wireline logs, and core data
coming from wells that drilled targeting
Globigerina limestone. Eight wells (AX-1,
AC-1, BF-1, BH-1, DK-1, DA-1, DA-2st, and
Page 4
Integration of Petrophysical Analysis and Elastic Log Properties as an Input to Optimize the Development Wells
Target in Unique Globigerina Limestone Gas Reservoir in Madura Strait
Hendra Himawan, et al.
58
DA-4) successfully found gas, two wells dry
(AX-3 and DA-3) and one well inconclusive
(BJ-1). All of the wells acquired wireline logs,
which consist of gamma ray, resistivity,
neutron, bulk density, Vp and Vs (eight wells)
as shown in Figure 3.
Figure 3. Wells Location Overlay with Top T60 Depth Structure Map
Core data sets of ten wells (except DA-
2st) from laboratory results include vertical
and horizontal permeability, porosity, grain
density, petrography (SEM, XRD and Thin
Section), formation resistivity, and capillary
pressure. Core permeability analysis used in
this study refer to horizontal permeability
values. Selection of routine core and
petrography samples were taken carefully to
capture rock and pore type variation in the
cores in order to identify reservoir facies and
genetic pore types from various positions.
Various reservoir quality can be identified
using porosity-permeability cross plots to
create relationship and predict permeability.
Core data is used to define lithofacies
based on lithology, texture (grain size and
sorting), and sedimentary structures using the
traditional Dunham classification, which
emphasizes depositional texture: grain
supported versus mud supported. Based on
Dunham’s classification, the carbonate rock
has more diffused clouds which indicating to
other major factors as permeability control.
High porosity in carbonates can be observed
that does not always give rise to high
permeability. However, the clusters of points,
which represent carbonate classification are
not completely separated from one another.
Petrophysical Analysis
Petrophysical analysis begins with the
data inventory and understand about the
geological concept as the foundation for
petrophysical analysis. Data quality control
includes remove tail, depth matching, log
patching, merging, depth shifting, and pseudo
log. Petrophysical analysis main objectives are
to transform well logs information into
reservoir properties such as mineral volumes
and fluid contents in the invaded and un-
invaded zones. Clay volume is the first step to
be estimated using a combination of gamma
ray and neutron-density logs. Complex
lithology method has been used for analysis of
minerals, porosity and water saturation.
Neutron-density log use to estimate porosity
and deep resistivity log for water saturation.
AX-1
AC-1
BF-1
BH-1
BJ-1
DK-1 DA-1
AX-3DA-2st
DA-3
DA-4
Page 5
IAGI Journal
Volume 1 No. 2, August 2021: 55–70 e-ISSN 2776-0111
59
Analysis of petrophysics applied appropriate
petrophysical parameters and formulas for
clastic carbonates and validated with core data.
Volume of Clay
Clay volume (Vcl) was calculated from
combination of gamma ray log and neutron-
density log. When using GR log, it needs to
check variable potassium (K) radioactivity
high readings. The effect of Uranium to the GR
log was eliminated before it used in
computation to minimize gross radioactivity
[8]. The neutron logs can be problematic,
hence different tool sizes and vintages are
unique depending on differences in the applied
environmental corrections and clay type
responses. A combination of GR and neutron-
density log response was used to calculate clay
volume. GR log was primary log used to
compute the volume of clay using Lorionov
Tertiary Rock equation as follows:
𝑉𝑐𝑙𝐺𝑟 = 0.08336 𝑥 (23.7𝑥𝑍 − 1) (1)
where Z is VclGR linear
𝑉𝑐𝑙𝐺𝑟 =𝐺𝑟−𝐺𝑟𝐶𝑙𝑒𝑎𝑛
𝐺𝑟𝐶𝑙𝑎𝑦−𝐺𝑟𝐶𝑙𝑒𝑎𝑛 (2)
Neutron-Density log separation was used
to determine clean-clay baseline to which the
end values for clean GR and clay GR were
determined. The clay volume of density-
neutron (VclND) equation as follows:
𝑉𝑐𝑙𝑁𝐷 =(𝐷𝑒𝑛𝐶𝑙2−𝐷𝑒𝑛𝐶𝑙1)∗(𝑁𝑒𝑢−𝑁𝑒𝑢𝐶𝑙1)−(𝐷𝑒𝑛−𝐷𝑒𝑛𝐶𝑙1)∗(𝑁𝑒𝑢𝐶𝑙2−𝑁𝑒𝑢𝐶𝑙1)
(𝐷𝑒𝑛𝐶𝑙2−𝐷𝑒𝑛𝐶𝑙1)∗(𝑁𝑒𝑢𝐶𝑙−𝑁𝑒𝑢𝐶𝑙1)−(𝐷𝑒𝑛𝐶𝑙−𝐷𝑒𝑛𝐶𝑙1)∗(𝑁𝑒𝑢𝐶𝑙2−𝑁𝑒𝑢𝐶𝑙1) (3)
The final calculated clay volume from well
logs was validated with total clay from XRD.
Porosity
Porosity is a fundamental measure of the
storage capacity of a rock, whereas both bulk
density and porosity are often related to the
strength of rock material. Porosity logs that
available in all wells are density, neutron, and
sonic log. Total porosity was computed using
a combination of neutron-density logs as the
principal determinant [9]. The bulk density is
controlled by the grains and pores and thus
reflects the compactness and cementation of
the rock, which will affect its overall
petrophysical and elastic properties. Below is
the equation for density porosity (DPHI)
calculation:
𝛷 =𝑅ℎ𝑜𝑚𝑎−𝑅ℎ𝑜𝑏
𝑅ℎ𝑜𝑚𝑎−𝑅ℎ𝑜𝑓𝑙𝑢𝑖𝑑 (4)
The neutron log already in limestone porosity
units (NPHI) and then manually defines the log
input and type of neutron tool environmental
corrections. Total porosity is calculated using
the following equation:
𝑃𝐻𝐼𝑇 = [(𝐷𝑃𝐻𝐼2 + 𝑁𝑃𝐻𝐼2)/2]1/2 (5)
Effective porosity is calculated from the
combination of neutron-density logs or total
porosity with correction for clay content as
follows:
𝑃𝐻𝐼𝐸 = 𝑃𝐻𝐼𝑇 − (𝑉𝑐𝑙 ∗ 𝑃𝐻𝐼𝑇𝑐𝑙) (6)
The calculated porosity log was validated with
core porosity at NOB condition.
Permeability Prediction
Reservoir quality can be identified using
porosity-permeability cross plots to create
relationship and permeability transform. From
the porosity-permeability cross plots, the
distribution of porosity and permeability
among ten wells are very scattered. The
Page 6
Integration of Petrophysical Analysis and Elastic Log Properties as an Input to Optimize the Development Wells
Target in Unique Globigerina Limestone Gas Reservoir in Madura Strait
Hendra Himawan, et al.
60
clusters of points, which represent carbonate
facies based on Dunham classification for each
reservoir, are not distinct from each other as
shown in Figure 4. The poor poro-perm
relationship is common in carbonate rocks
implying that porosity is not the only
parameter affecting permeability. In other
words, the good poro-perm relationship is
influenced by lithofacies, facies deposition and
diagenesis showed by grain size distribution,
texture, roundness, pore type, pore geometry,
pore throat size, cement, mineral composition,
and connectivity [10]. Therefore, the detail
permeability transform should be determined
through hydraulic flow unit (HFU).
Figure 4. Core Porosity vs Core Permeability cross-plot Color Coded by lithofacies. a) AX-1 well. b) AX-3 well.
c) AC-1 well. d) BF-1 well. e) BH-1 well. f) BJ-1 well. g) DK-1 well. h) DA-3 well. i) DA-4 well. j) DA-1 well
HFU’s analysis based on indicator of flow
zone which reflect to rock quality that
influenced by the mineralogical composition
and texture of lithology. HFU provide the basic
input for the generation of different lithology
classes with integration from core description,
core porosity, core permeability, petrography
(lithofacies, SEM, XRD and Thin Section),
mineralogy, relative permeability and capillary
pressure. HFU analysis technique has been
0.001
0.01
0.1
1
10
100
1000
0 0.1 0.2 0.3 0.4 0.5 0.6
Co
re P
erm
eab
ilit
y (m
D)
Core Porosity (%)
Core Poro - Core Perm
No Desc
Wacke-Pack
Pack
0.001
0.01
0.1
1
10
100
1000
0 0.1 0.2 0.3 0.4 0.5 0.6
Co
re P
erm
eab
ilit
y (m
D)
Core Porosity (%)
Core Poro - Core Perm
No Desc
Pack
Grain
0.001
0.01
0.1
1
10
100
1000
0 10 20 30 40 50 60
Co
re P
erm
eab
ilit
y (m
D)
Core Porosity (%)
Core Poro - Core Perm
Pack
0.001
0.01
0.1
1
10
100
1000
0 10 20 30 40 50 60
Co
re P
erm
eab
ilit
y (m
D)
Core Porosity (%)
Core Poro - Core Perm
GL Shale
Pack
Pack-Grain
Grain
0.001
0.01
0.1
1
10
100
1000
0 10 20 30 40 50 60
Co
re P
erm
eab
ilit
y (
mD
)
Core Porosity (%)
Core Poro - Core Perm
GL Clay
Wacke-Pack
Pack
Pack-Grain
0.001
0.01
0.1
1
10
100
1000
0 0.1 0.2 0.3 0.4 0.5 0.6
Co
re P
erm
eab
ilit
y (m
D)
Core Porosity (%)
Core Poro - Core Perm
No Desc
Wacke
Wacke-Pack
Pack
Grain
0.001
0.01
0.1
1
10
100
1000
0 10 20 30 40 50 60
Co
re P
erm
ea
bil
ity
(mD
)
Core Porosity (%)
Core Poro - Core Perm
GL Shale
Wacke
Wacke-Pack
Pack
Pack-Grain
0.001
0.01
0.1
1
10
100
1000
0 10 20 30 40 50 60
Co
re P
erm
eab
ilit
y (m
D)
Core Porosity (%)
Core Poro - Core Perm
Wacke
Wacke-Pack
Pack
Pack-Grain
0.001
0.01
0.1
1
10
100
1000
0 10 20 30 40 50 60
Co
re P
erm
eab
ilit
y (m
D)
Core Porosity (%)
Core Poro - Core Perm
GL Shale
Wacke
Wacke-Pack
Pack
Pack-Grain
Grain
0.001
0.01
0.1
1
10
100
1000
0 10 20 30 40 50 60
Co
re P
erm
eab
ilit
y (m
D)
Core Porosity (%)
Core Poro - Core Perm
Wacke
Wacke-Pack
Pack
Pack-Grain
Lst No Desc
GL Clay
Wackestone
Wackestone-Packstone
Packstone
Packstone-Grainstone
Grainstone
AX-1 AX-3 AC-1
BF-1 BH-1 BJ-1
DK-1 DA-3 DA-4
DA-1
a) b) c)
d) e) f)
g) h) i)
j)
Page 7
IAGI Journal
Volume 1 No. 2, August 2021: 55–70 e-ISSN 2776-0111
61
introduced by calculating of flow zone
indicator (FZI) from pore volume to solid
volume ratio (Φz) and reservoir quality index
(RQI) [11]. From FZI values, samples can be
classified into different HFUs. Samples with
similar FZI value will have same HFU. Each
HFU on a log-log cross plot between RQI vs
normalized porosity index will yield a straight
line with a specific unit slope. The intercept of
each unit slope with Φz = 1, designated as FZI
is a unique number for each HFU. Data points
that plot along a constant FZI exhibit similar
flow quality across a wide range of pore-perm
values as shown in Figure 5. Thus, these ratio
lines can be used as a scale to evaluate and rank
reservoir quality. The calculated permeability
log was validated with core permeability at
NOB condition and Klinkenberg effect.
Figure 5. Hydraulic Flow Unit (HFU) analysis. a) Calculated Flow Zone Indicator (FZI) Histogram. b) Stratigraphic
Lorenz Plot of FZI. c) Rock Quality Index (RQI) vs Normalized Porosity (ɸz) cross-plot d) Permeability Transform
for each HFU.
Water Saturation
All Drill Steam Tests (DST’s) result that
were conducted above Lowest Known Gas
(LKG) in seven wells (AX-1, AC-1, BF-1, BH-
1, DK-1, DA-1, and DA-4) only flew gas and
no water. In BF-1 well, one of the three DST
interval also conducted below LKG and the
result is no flow. Therefore, no valid formation
water analysis conducted in laboratory. The
formation water salinity or formation water
resistivity determined by using Pickett Plot
method. Cementation (m) and saturation
exponent (n) from special core analysis (rock
electrical properties) data has been used for
water saturation calculation [12]. The true
resistivity (Rt) is taken from deepest resistivity
reading measurements. Ideally, to get properly
true resistivity, a resistivity modelling/
inversion work is required. The standard
tornado charts are inadequate and strictly not
applicable to the wireline logs. This is
reasonable to the extent that we can argue that
invasion effects are not noticeable in the
deepest reading tools [13].
Water saturation from wireline log data
was calculated using Indonesia Equation. This
0
200
400
600
800
1000
1200
1400
0.01 0.1 1 10
Sam
ple
Num
ber
Flow Zone Indicator (FZI) μm
a)
b)
c) d)
ɸz
(v/v
)
RQI (μm) Core Poro (v/v)
Core
Per
m (m
D)
Page 8
Integration of Petrophysical Analysis and Elastic Log Properties as an Input to Optimize the Development Wells
Target in Unique Globigerina Limestone Gas Reservoir in Madura Strait
Hendra Himawan, et al.
62
equation was used to accommodate the
presence of volume of clay within the
formation. The Indonesia Equation is written
below:
1
√𝑅𝑡= (√
𝜙𝑚
𝑎∗𝑅𝑤+
𝑉𝑐𝑙(1−(
𝑉𝑐𝑙2
))
√𝑅𝑐𝑙) ∗ 𝑆𝑤
𝑛
2 (7)
Elastic Properties (AI, SI, Vp/Vs, PR)
Seismic wave propagation in the earth is
affected not only by the physical state of the
media (solid, liquid or gas) but also by other
physical properties such as rock density, pore
size, fluid content, depth of burial and
differential pressure, etc. Physical properties
of the earth can be measured in situ using
acoustic sonic logging system [14]. In recent
years there has been increased use of ρ, Vp,
and Vs, in seismic exploration for estimation
of porosity, lithology, saturating fluids in
particular intervals and provide sufficient
information to determine the elastic
parameters of isotropic media. The possibly
ambiguous interpretation of lithology and
porosity from Vp, Vs, and Vp/Vs in seismic
exploration also applies to log analysis.
However, because sonic logs are generally a
part of standard logging programs, the
interpretation of full waveform sonic logs
should be made in the context of other logging
information [15]. Although porosity is the
most important factor to control sonic velocity,
there are also various factors such as pore type,
pore fluid incompressibility (λ), shear modulus
(μ), bulk modulus (K) and saturation are
control velocities in carbonate rocks.
The relationship that describes how the
elastic moduli and density of the saturated rock
relate to the corresponding Vp, and Vs of a
porous medium are given by below equation:
𝑉𝑝 = √𝐾+
4
3𝜇
𝜌= √
λ+2𝜇
𝜌 (8)
As below equation, shear wave velocities
are more strongly impacted by more porous
and complicated fabric (rock matrix) and are
very less effected by fluid type. The shear
wave cannot propagate in fluids, as fluids do
not behave elastically under shear
deformation.
𝑉𝑠 = √𝜇
𝜌 (9)
In the above equations, shear-wave
velocity (Vs) depends only on the density (ρ)
of the saturated rock and the shear
rigidity/modulus (μ), while the compressional-
wave velocity (Vp) depends on the bulk
modulus (K) of the saturated rock and on the
shear rigidity (μ) and density (ρ) of the
saturated rock. Thus, we observe that Vp is
dependent on two unknown dry-rock
properties, while Vs depends only on one of
them [2].
Based on ρ, Vp and Vs concept and as an
input to geophysicist to cluster reservoir
quality, the log base acoustic impedance and
shear impedance can be calculated as below
equations:
𝐴𝐼 = 𝜌 ∗ 𝑉𝑝 (10)
𝑆𝐼 = 𝜌 ∗ 𝑉𝑠 (11)
Poisson’s ratio (σ) is the ratio between the
lateral and longitudinal strains resulting from
uniaxial stress applied to the rock. It is
calculated from Vp and Vs using the following
equation:
σ =𝑉𝑝2−2𝑉𝑠2
2(𝑉𝑝2−𝑉𝑠2) (12)
The Poisson’s (or Vp/Vs) ratio is very
sensitive to the existence of fluids. The Vp/Vs
(or the Poisson’s) ratio is becoming a more
useful parameter in the determination of rock
properties.
Page 9
IAGI Journal
Volume 1 No. 2, August 2021: 55–70 e-ISSN 2776-0111
63
RESULT AND DISCUSSION
The reservoir porosity of Globigerina
limestone is supported by matrix porosity and
intergranular porosity. The reservoirs have
total porosity up to 60% volume with
permeability ranging from 1mD to over
1000mD. From petrography analysis, major
porosity types encountered in this reservoir are
intra-particle porosity within foraminifera
shell and inter-particle porosity (between
foraminifera). Lime muds are the predominant
material found in the matrix with only minor
amounts of detrital clay observed. The best
reservoir quality has less lime mud matrix
filling and less clay association. Within this
condition, the space between grains is still well
preserved and only little diagenetic alteration
occurs within the forams chambers.
Total eleven wells have complete quad
combo conventional log responses such as
gamma ray, resistivity, neutron, density, Vp
and Vs (eight wells). After loading and
checking of all wireline logs data, it was found
that most of the wireline logs are aligned in
depth so does not require any depth shift. The
effects of tool position, tension, current
fluctuation, cycle skipping, have been
understood carefully. The corrected and
conditioned wireline logs data must be
confirmed through quality control methods.
Petrophysical analysis conducted based on
methodologies and data available as
mentioned earlier. Final petrophysical results
of eight representative wells that have Vs data
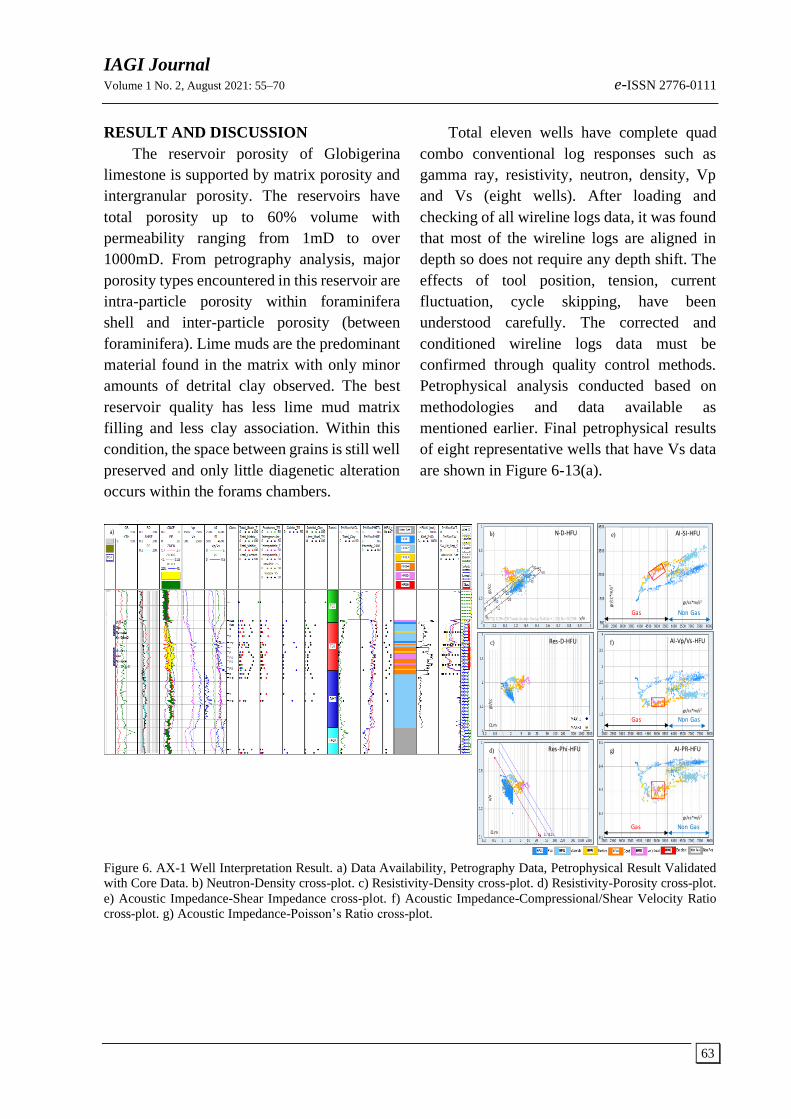
are shown in Figure 6-13(a).
Figure 6. AX-1 Well Interpretation Result. a) Data Availability, Petrography Data, Petrophysical Result Validated
with Core Data. b) Neutron-Density cross-plot. c) Resistivity-Density cross-plot. d) Resistivity-Porosity cross-plot.
e) Acoustic Impedance-Shear Impedance cross-plot. f) Acoustic Impedance-Compressional/Shear Velocity Ratio
cross-plot. g) Acoustic Impedance-Poisson’s Ratio cross-plot.
AI-PR-HFU
AI-Vp/Vs-HFU
AI-SI-HFU
Res-Phi-HFU
Res-D-HFU
N-D-HFUa) b)
c)
d)
e)
f)
g)
Gas Non Gas
Gas Non Gas
Gas Non Gas
gr/cc*m/s2
gr/
cc*m
/s2
gr/cc*m/s2
gr/cc*m/s2
Ω.m
Ω.m
v/v
gr/
cc
gr/
cc
v/v
Page 10
Integration of Petrophysical Analysis and Elastic Log Properties as an Input to Optimize the Development Wells
Target in Unique Globigerina Limestone Gas Reservoir in Madura Strait
Hendra Himawan, et al.
64
Figure 7. AX-3 Well Interpretation Result. a) Data Availability, Petrography Data, Petrophysical Result Validated
with Core Data. b) Neutron-Density cross-plot. c) Resistivity-Density cross-plot. d) Resistivity-Porosity cross-plot.
e) Acoustic Impedance-Shear Impedance cross-plot. f) Acoustic Impedance-Compressional/Shear Velocity Ratio
cross-plot. g) Acoustic Impedance-Poisson’s Ratio cross-plot.
Figure 8. AC-1 Well Interpretation Result. a) Data Availability, Petrography Data, Petrophysical Result Validated
with Core Data and Best Reservoir Quality in Red Box. b) Neutron-Density cross-plot. c) Resistivity-Density cross-
plot. d) Resistivity-Porosity cross-plot. e) Acoustic Impedance-Shear Impedance cross-plot. f) Acoustic Impedance-
Compressional/Shear Velocity Ratio cross-plot. g) Acoustic Impedance-Poisson’s Ratio cross-plot.
AI-PR-HFU
AI-Vp/Vs-HFU
AI-SI-HFU
Res-Phi-HFU
Res-D-HFU
N-D-HFUa) b)
c)
d)
e)
f)
g)
Gas Non Gas
Gas Non Gas
Gas Non Gas
gr/cc*m/s2
gr/
cc*m
/s2
gr/cc*m/s2
gr/cc*m/s2
Ω.m
Ω.m
v/v
gr/
cc
gr/
cc
v/v
N-D-HFU
Res-D-HFU
Res-Phi-HFU
AI-SI-HFU
AI-Vp/Vs-HFU
AI-PR-HFU
a) b)
c)
d)
e)
f)
g)
Gas Non Gas
Gas Non Gas
Gas Non Gas
gr/cc*m/s2
gr/
cc*m
/s2
gr/cc*m/s2
gr/cc*m/s2
Ω.m
Ω.m
v/v
gr/
cc
gr/
cc
v/v
Page 11
IAGI Journal
Volume 1 No. 2, August 2021: 55–70 e-ISSN 2776-0111
65
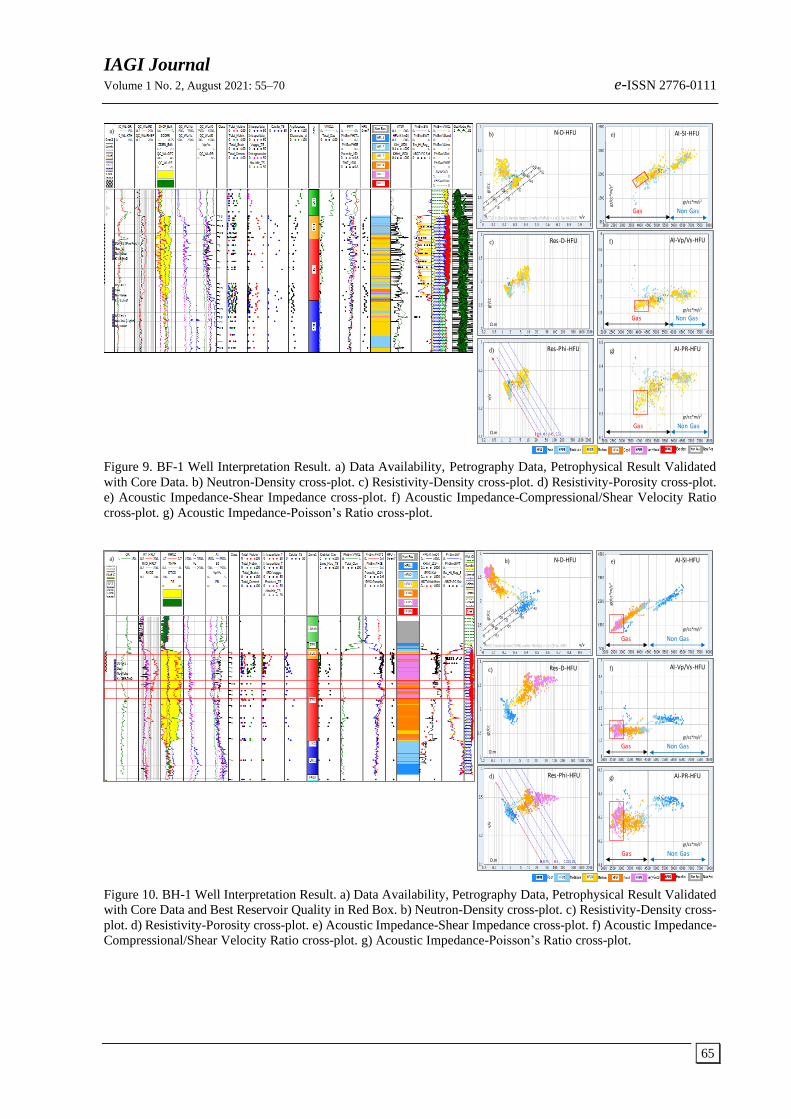
Figure 9. BF-1 Well Interpretation Result. a) Data Availability, Petrography Data, Petrophysical Result Validated
with Core Data. b) Neutron-Density cross-plot. c) Resistivity-Density cross-plot. d) Resistivity-Porosity cross-plot.
e) Acoustic Impedance-Shear Impedance cross-plot. f) Acoustic Impedance-Compressional/Shear Velocity Ratio
cross-plot. g) Acoustic Impedance-Poisson’s Ratio cross-plot.
Figure 10. BH-1 Well Interpretation Result. a) Data Availability, Petrography Data, Petrophysical Result Validated
with Core Data and Best Reservoir Quality in Red Box. b) Neutron-Density cross-plot. c) Resistivity-Density cross-
plot. d) Resistivity-Porosity cross-plot. e) Acoustic Impedance-Shear Impedance cross-plot. f) Acoustic Impedance-
Compressional/Shear Velocity Ratio cross-plot. g) Acoustic Impedance-Poisson’s Ratio cross-plot.
AI-PR-HFU
AI-Vp/Vs-HFU
AI-SI-HFU
Res-Phi-HFU
Res-D-HFU
N-D-HFUa) b)
c)
d)
e)
f)
g)
Gas Non Gas
Gas Non Gas
Gas Non Gas
gr/cc*m/s2
gr/
cc*m
/s2
gr/cc*m/s2
gr/cc*m/s2
Ω.m
Ω.m
v/v
gr/
cc
gr/
cc
v/v
AI-PR-HFU
AI-Vp/Vs-HFU
AI-SI-HFU
Res-Phi-HFU
Res-D-HFU
N-D-HFUa) b)
c)
d)
e)
f)
g)
Gas Non Gas
Gas Non Gas
Gas Non Gas
gr/cc*m/s2
gr/
cc*m
/s2
gr/cc*m/s2
gr/cc*m/s2
Ω.m
Ω.m
v/v
gr/
cc
gr/
cc
v/v
Page 12
Integration of Petrophysical Analysis and Elastic Log Properties as an Input to Optimize the Development Wells
Target in Unique Globigerina Limestone Gas Reservoir in Madura Strait
Hendra Himawan, et al.
66
Figure 11. BJ-1 Well Interpretation Result. a) Data Availability, Petrography Data, Petrophysical Result Validated
with Core Data and Best Reservoir Quality in Red Box. b) Neutron-Density cross-plot. c) Resistivity-Density cross-
plot. d) Resistivity-Porosity cross-plot. e) Acoustic Impedance-Shear Impedance cross-plot. f) Acoustic Impedance-
Compressional/Shear Velocity Ratio cross-plot. g) Acoustic Impedance-Poisson’s Ratio cross-plot.
Figure 12. DK-1 Well Interpretation Result. a) Data Availability, Petrography Data, Petrophysical Result Validated
with Core Data and Best Reservoir Quality in Red Box. b) Neutron-Density cross-plot. c) Resistivity-Density cross-
plot. d) Resistivity-Porosity cross-plot. e) Acoustic Impedance-Shear Impedance cross-plot. f) Acoustic Impedance-
Compressional/Shear Velocity Ratio cross-plot. g) Acoustic Impedance-Poisson’s Ratio cross-plot.
AI-PR-HFU
AI-Vp/Vs-HFU
AI-SI-HFU
Res-Phi-HFU
Res-D-HFU
N-D-HFUa)b)
c)
d)
e)
f)
g)
Gas Non Gas
Gas Non Gas
Gas Non Gas
gr/cc*m/s2
gr/
cc*m
/s2
gr/cc*m/s2
gr/cc*m/s2
Ω.m
Ω.m
v/v
gr/
cc
gr/
cc
v/v
AI-PR-HFU
AI-Vp/Vs-HFU
AI-SI-HFU
Res-Phi-HFU
Res-D-HFU
N-D-HFUa) b)
c)
d)
e)
f)
g)
Gas Non Gas
Gas Non Gas
Gas Non Gas
gr/cc*m/s2
gr/
cc*m
/s2
gr/cc*m/s2
gr/cc*m/s2
Ω.m
Ω.m
v/v
gr/
cc
gr/
cc
v/v
Page 13
IAGI Journal
Volume 1 No. 2, August 2021: 55–70 e-ISSN 2776-0111
67
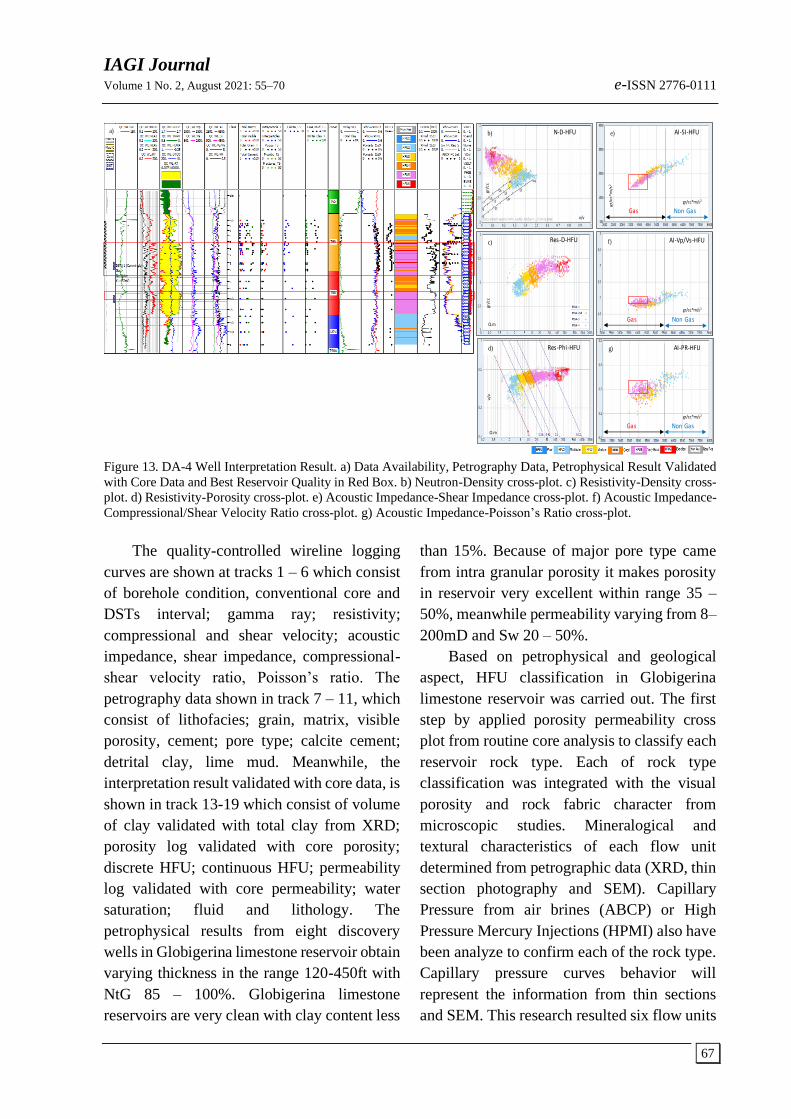
Figure 13. DA-4 Well Interpretation Result. a) Data Availability, Petrography Data, Petrophysical Result Validated
with Core Data and Best Reservoir Quality in Red Box. b) Neutron-Density cross-plot. c) Resistivity-Density cross-
plot. d) Resistivity-Porosity cross-plot. e) Acoustic Impedance-Shear Impedance cross-plot. f) Acoustic Impedance-
Compressional/Shear Velocity Ratio cross-plot. g) Acoustic Impedance-Poisson’s Ratio cross-plot.
The quality-controlled wireline logging
curves are shown at tracks 1 – 6 which consist
of borehole condition, conventional core and
DSTs interval; gamma ray; resistivity;
compressional and shear velocity; acoustic
impedance, shear impedance, compressional-
shear velocity ratio, Poisson’s ratio. The
petrography data shown in track 7 – 11, which
consist of lithofacies; grain, matrix, visible
porosity, cement; pore type; calcite cement;
detrital clay, lime mud. Meanwhile, the
interpretation result validated with core data, is
shown in track 13-19 which consist of volume
of clay validated with total clay from XRD;
porosity log validated with core porosity;
discrete HFU; continuous HFU; permeability
log validated with core permeability; water
saturation; fluid and lithology. The
petrophysical results from eight discovery
wells in Globigerina limestone reservoir obtain
varying thickness in the range 120-450ft with
NtG 85 – 100%. Globigerina limestone
reservoirs are very clean with clay content less
than 15%. Because of major pore type came
from intra granular porosity it makes porosity
in reservoir very excellent within range 35 –
50%, meanwhile permeability varying from 8–
200mD and Sw 20 – 50%.
Based on petrophysical and geological
aspect, HFU classification in Globigerina
limestone reservoir was carried out. The first
step by applied porosity permeability cross
plot from routine core analysis to classify each
reservoir rock type. Each of rock type
classification was integrated with the visual
porosity and rock fabric character from
microscopic studies. Mineralogical and
textural characteristics of each flow unit
determined from petrographic data (XRD, thin
section photography and SEM). Capillary
Pressure from air brines (ABCP) or High
Pressure Mercury Injections (HPMI) also have
been analyze to confirm each of the rock type.
Capillary pressure curves behavior will
represent the information from thin sections
and SEM. This research resulted six flow units
AI-PR-HFU
AI-SI-HFU
Res-Phi-HFU
Res-D-HFU
N-D-HFU
AI-Vp/Vs-HFU
a) b)
c)
d)
e)
f)
g)
Gas Non Gas
Gas Non Gas
Gas Non Gas
gr/cc*m/s2
gr/
cc*m
/s2
gr/cc*m/s2
gr/cc*m/s2
Ω.m
Ω.m
v/v
gr/
cc
gr/
cc
v/v
Page 14
Integration of Petrophysical Analysis and Elastic Log Properties as an Input to Optimize the Development Wells
Target in Unique Globigerina Limestone Gas Reservoir in Madura Strait
Hendra Himawan, et al.
68
as reservoir rock with different quality from
Poor (HFU1), Moderate (HFU2), Medium
(HFU3), Good (HFU4), Very Good (HFU5)
and Excellent (HFU6). The hydraulic flow unit
quality is controlled by type of pore geometry
as a function of mineralogy (abundance,
morphology, and type), texture (packing, grain
shape, grain size, sorting, pore throat and
packing) and diagenesis. In order to predict
HFU class in un-cored interval, electro-facies
have been conducted through multi regression
methodology with quad combo logs data as an
input. As shown in figure 6 – 13 (b – d), the
most sensitive log to classify HFU class, came
from resistivity, density and neutron log.
Meanwhile gamma ray log is less sensitive due
to mostly Globigerina limestone contain
similar clay volume. This is corresponding
with the concept where better reservoir quality
will have lower water saturation that represent
by high resistivity log, and better porosity,
represented by low neutron and low-density
logs. The resulting HFU class have specific
lithofacies, porosity/permeability cluster,
mineralogy, pore geometries, pore throat,
capillary pressure curve and fluid-flow
characteristics. Each HFU class will have each
permeability transform to predict continuous
permeability log that will be validated by core
permeability. The final result of continues
HFU shown in figure 6 – 13 (a) in track 16 and
the best HFU class in each well or field located
in red box. This interval should be set as the
optimize developments well target because the
best rock quality contains less lime mud,
minimum clay volume and water saturation,
high porosity and permeability. With the best
permeability as the target in the development
wells, it will increase the flow rate.
Understanding the relationship between
petrophysical result, HFU and elastic rock
properties can be used further to predict the
reservoir properties away from the well
locations. Elastic rock properties derived from
well logs are characterized in terms of HFU.
One of the main objectives of this research is
to understand and interpret elastic response for
HFU. This can be achieved by conducting
detailed cross plot analysis using different log
attributes. It is not only helps to characterize
identifiable HFU but also discern the rock
quality and fluid effect based on different
elastic properties. Several elastic rock
properties cross plot with color coded by HFU
form interval gas until non-gas fluid type are
shown in figure 6 – 13 (e – g). As shown in
figure 6 – 13 (e – g), AI has a powerful tool to
separate gas and non-gas interval by using AI
value ~4,500 – ~5,700 (g/cc*m/s2). Based on
AI vs SI cross plot in figure 6 – 13(e),
standalone AI parameter is less sensitive to
distinguish HFU class but when it combines
with SI, the clustered best HFU can be
identified. In addition, the SI shows an overall
decrease with higher HFU class, except in AX
field. Base on AX-3 wells XRD data, it has
higher amount of dolomite mineral. The
dolomite mineral has higher density which
make SI value higher. It can be said that SI has
potential of being a good indicator for the
influence of clay content, porosity,
permeability and water saturation in term of
HFU class. On figure 6 – 13 (f) which show AI
vs Vp/Vs ratio cross plot, Vp/Vs ratios value
between HFU classes, sometimes overlap each
other especially in more heterogeneity
reservoir quality. When Vp/Vs ratio combine
with AI it still can differentiate best HFU class.
In addition, the Vp/Vs ratio shows an overall
decrease with higher HFU class. Based on
figure 6 – 13 (g) which show AI vs Poisson’s
ratio cross plot, combinable elastic parameter
can cluster the best HFU class. In addition, the
Poisson’s ratio shows an overall decrease with
Page 15
IAGI Journal
Volume 1 No. 2, August 2021: 55–70 e-ISSN 2776-0111
69
higher HFU class. These all because of most of
Vp on the water-saturated are higher than the
gas saturated rock, and most of Vs is less
impacted by fluid type. In other words,
combinable of all elastic rock properties can be
used to localize the best HFU class which have
high permeability. Therefore, when the best
HFU class can be clustered using certain cut
off of elastic parameter such AI, SI, Vp/Vs
ratio and Poisson’s ratio, the optimum
developments well target and shorter
production length can be obtained to achieve
predetermined deliverability in the POD
document. For sure, with shorter production
length mean shorter development wells
trajectory, shorter drilling rig time and will
give more economic return.
CONCLUSION
A detailed Petrophysical analysis blended
with elastic log response has been conducted.
The petrophysical analysis have valid result for
clay volume, porosity, permeability and water
saturation, which have good match with core
data. Permeability prediction has been
conducted through HFU methodology. This
study resulted six flow units as reservoir rock
with different quality from Poor (HFU1),
Moderate (HFU2), Medium (HFU3), Good
(HFU4), Very Good (HFU5) and Excellent
(HFU6). The HFU classification controlled by
permeability, which affected by the existence
of lime mud and little diagenetic alteration
such as vugs, mouldic and heavily calcite
cement. Each HFU class will have each
permeability transform to predict continuous
permeability log that will be validated by core
permeability. As a link to understand the
relationship among petrophysical, HFU and
elastic rock properties which can be used
further to predict the reservoir properties away
from the well locations. Several cross plot of
elastic rock properties derived from well logs
have been used to optimize development well
target. The AI could be used as powerful tool
to separate gas and non-gas fluid type. The use
of AI can be deeper by combination of SI,
Vp/Vs ratio and Poisson’s ratio to localize
which interval of reservoir in certain well or
field that have the best HFU class. The best
HFU class contains less lime mud, minimum
clay volume and water saturation, high
porosity, high permeability and vice versa. The
best HFU class, will response specific range of
AI, SI, Vp/Vs ratio and Poisson’s ratio. With
the best permeability as the target in the
development wells, it will obtain optimum
trajectory, shorter production length and
achieve good deliverability.
ACKNOWLEDGEMENT
The author would like to thank Husky-
CNOOC Madura Ltd., especially Subsurface
Department for permission and support to
publish data and analysis result. In addition, it
would not have been possible without the
permission from shareholder, SKK Migas and
Dirjen Migas.
REFERENCES
1. Donaldson, E.; Tiab, D. Theory and Practice of
Measuring Reservoir Rock and Fluid Transport
Properties. In Petrophysics; Gulf Professional
Publishing: Houston, Texas, 2003; p. 1008 ISBN
9780123838483.
2. Avseth, P.; Mukerji, T.; Mavko, G. Quantitative
Seismic Interpretation. Applying Rock Physics to
Reduce Interpretation Risk; Cambridge University
Press: Cambridge, 2005; ISBN 0 521 81601 7.
3. Greenberg, M.L.; Castagna, J.P. Shear‐wave
Velocity Estimation in Porous Rocks: Theoretical
Formulation, Preliminary Verification and
Applications. Geophys. Prospect. 1992, 40, 195–
209.
4. Satyana, A.H.; Erwanto, E.; Prasetyadi, C.
Rembang-Madura-Kangean-Sakala (RMKS) Fault
Zone, East Java Basin: The Origin and Nature of A
Geologic Border. In Proceedings of the Proc.
IAGI, 33rd., Ann. Conv and Exh Bandung; 2004.
5. PT Patra Nusa Data Indonesia Basin Summaries;
Page 16
Integration of Petrophysical Analysis and Elastic Log Properties as an Input to Optimize the Development Wells
Target in Unique Globigerina Limestone Gas Reservoir in Madura Strait
Hendra Himawan, et al.
70
Jakarta, 2006.
6. Bransden, P.J.E.; Matthews, S.J. Structural and
Stratigraphic Evolution of the East Java Sea,
Indonesia. In Proceedings of the Proceedings of
the Indonesian Petroleum Association, 21 Annual
Convention; 1992; pp. 417–453.
7. Goodall, J. The Mundu and Selorejo Sequences:
Stratigraphy, Paleoenvironments and
Prospectivity; 2013.
8. Schlumberger Educational Services Log
Interpretations Charts; Houston, Texas, 1977.
9. Asquith, G.B.; Gibson, C.R. Basic Well Log
Analysis for Geologists; American Association of
Petroleum Geologists: Tulsa, Oklahoma, 1982.
10. Lucia, F.J. Petrophysical Parameters Estimated
from Visual Descriptions of Carbonate Rocks: A
Field Classification of Carbonate Pore Space. J.
Pet. Tech 1983, 35, 626–637.
11. Amaefule, J.O.; Altunbay, M.; Tiab, D.; Kersey,
D.G.; Keelan, D.K. Enhanced Reservoir
Description: Using Core and Log Data to Identify
Hydraulic (Flow) Units and Predict Permeability
in Uncored Intervals/Wells. In Proceedings of the
SPE Annual Technical Conference and Exhibition;
Houston, 1993; pp. 1–16.
12. Pickett, G.R. Acoustic Character Log and Their
Application in Formation Evaluation. J. Pet Tech
1963, 15, 659–667.
13. Archie, G.E. Classification of Carbonate Reservoir
Rocks and Petrophysical Considerations. Am.
Assoc. Pet. Geol. Bull. 1952, 36, 278–298.
14. Mavko, G.; Mukerji, T.; Dvorkin, J. The Rock
Physics Handbook Tools for Seismic Analysis in
Porous Media.; Cambridge University Press:
Cambridge, 1998; ISBN 0 521 62068 6.
15. Biot, M.A. The Theory of Propagation of Elastic
Waves in a Fluid Saturated Porous Solid. J. Acoust.
Soc. Am. 1956, 28, 168–191,
doi:10.1121/1.1908239.


![Well Log Interpretation and Petrophysical Analisis in [Autosaved]](https://static.documents.pub/doc/80x56/586fbbe71a28abe57d8b8baf/well-log-interpretation-and-petrophysical-analisis-in-autosaved.jpg)


