Supported by Policy and regulatory issues in the context of large scale grid integration of renewable energy in Gujarat Alok Kumar Jindal Fellow, TERI Gujarat state coordination forum meeting, 17 October 2012
Transcript
Supported by
Policy and regulatory issues in the context
of large scale grid integration of
renewable energy in Gujarat
Alok Kumar Jindal
Fellow, TERI
Gujarat state coordination forum meeting, 17 October 2012
Background
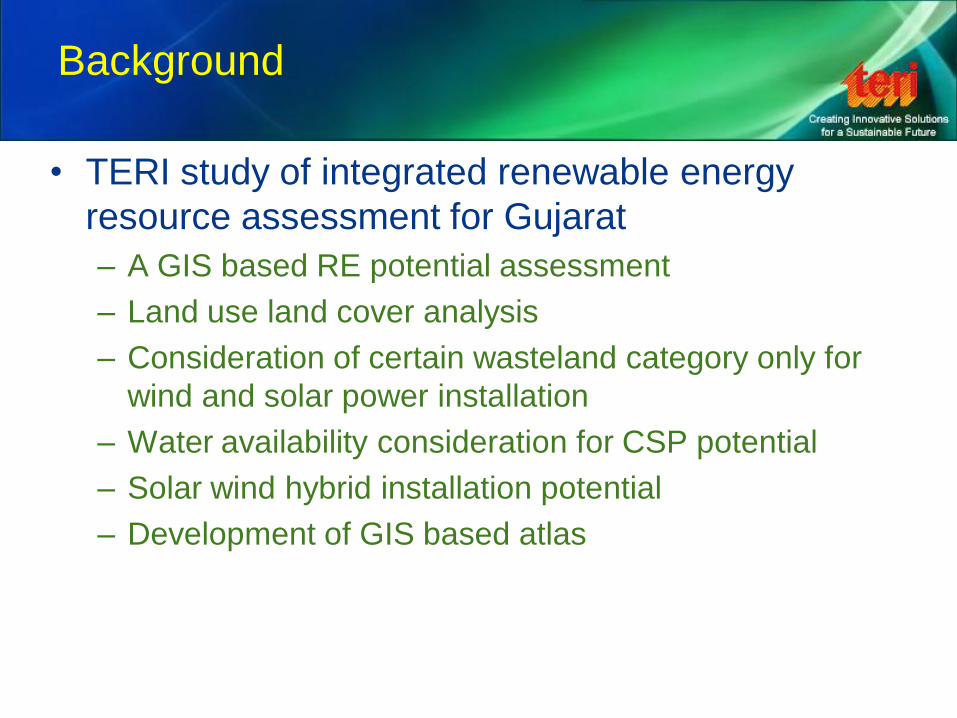
• TERI study of integrated renewable energy
resource assessment for Gujarat
– A GIS based RE potential assessment
– Land use land cover analysis
– Consideration of certain wasteland category only for
wind and solar power installation
– Water availability consideration for CSP potential
– Solar wind hybrid installation potential
– Development of GIS based atlas
Estimated RE potential in Gujarat
RE Technology
Estimated
potential in
Gujarat (GW)
Estimated
potential in
Kachchh
(GW)
CSP with water
availability (GW) 345.71 87.76
SPV Wind hybrid
excluding CSP land
(GW) 240.6 148.13
Only SPV excluding
wind and CSP 21.36 8.92
Only wind excluding
solar potential land
(GW) 139.21 133.26
Biomass (GW) 1.89 0.07
Total integrated
potential (GW) 748.77 378.14
• NAPCC suggests the
National RPO to be
increased 1% annually
from the 5% value of
the base year 2009
• Based on the EPS-17,
total energy demand of
the country will be
1914508 MU by year
2021-22
• To meet 17% RPO
target by 2021-22,
98555 MW wind
installation will be
required apart from
20000 MW solar
• Much of the power to
be transported out of
Gujarat.
Gujarat - hub for RE generation in India
Challenges in grid integration of renewables
Wind and solar generation are quite variable
which leads to
• Reactive power and voltage control
issue
• Active power and frequency control
issue
• Power balancing problems
• Power congestion
Example: Congestion in Deodhar,
Shivlakha, Shankhari networks .
Overloading of 220/66 kV Shivlakha
ICTs
• RE plants providing lesser grid support
during system disturbances than the
conventional in terms of MVAR/active
Power regulation.
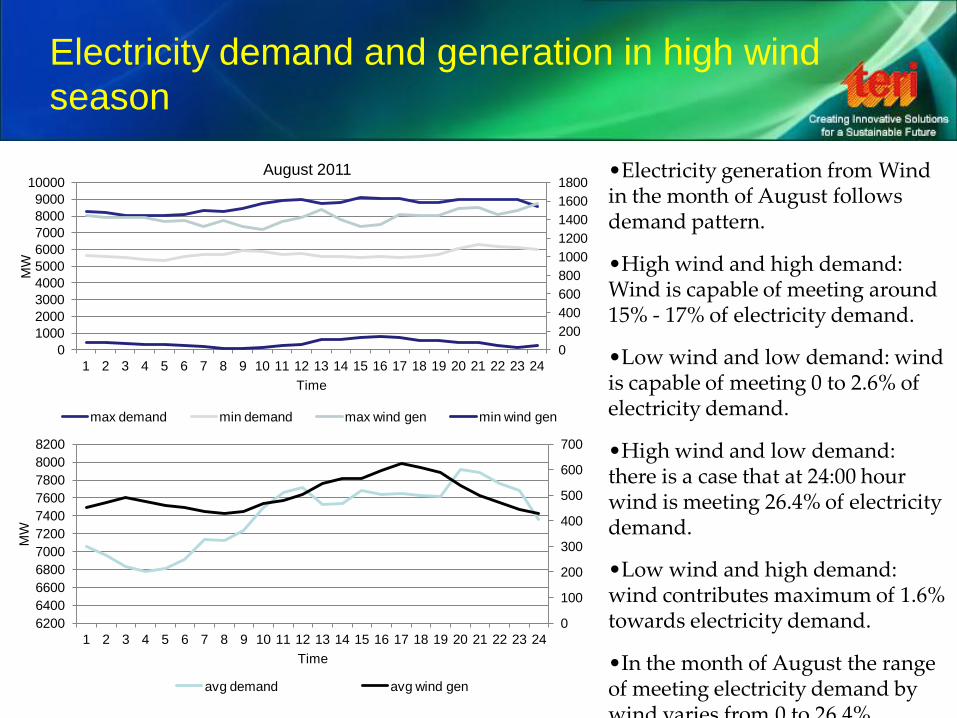
In the month of August the range of meeting electricity demand by wind
varies from 0 to 26.4%.
No major issues have been observed in
Gujarat due to wind and solar energy
variations till now
This scenario may change with increase
in wind and solar energy penetration i.e.
from current average of about 5% to
more than 30%
Policy Interventions
Focal area of
intervention
Action required Roles and responsibilities
Advance grid
planning and
network
enhancement
Grid planning
• RE potential based planning - “Integrated
Energy Parks” on PPP mode – (experience
from Charanka)
• Creation of land banks for RE parks
• Call for long term development plans of
developers (5-10 years)
Grid strengthening
• Tariff based bidding for transmission network
development
Funding
• Gujarat Green Energy Fund
• State govt. grant
• 13th Finance Commission
• Any other
• GEDA/GPCL- Integrated
energy parks- Site
identification, land banks,
bidding, developer selection
etc.
• GETCO – grid planning, tariff
based bidding (PPP)
Recommendations
Regulatory Interventions
Focal area of
intervention
Action required Roles and responsibilities
Amendment in Grid
Code
Provisions to be included
• Grid code specific issue
• Forecasting
• State level and central level (SLDC/RLDC/NLDC)
forecasting center for RE
• SLDC to consolidate the forecasting from all project
owners
• GERC to introduce
amendment in grid code
• Forecasting- GERC directive
to project developers and
owners to provide the desired
data to SLDC
Spinning reserves
and ancillary
market
• Hydropower, gas based spinning reserves
• CERC regulations for implementation of ancillary markets serve
as guidelines for Gujarat
• Primary responsibility of procuring ancillary services (SLDC).
SLDC to pay through ARR/ separate budget provision
• Manner of procurement of services (Power exchange, bi-
lateral contracts, tendering etc)
• Tariff determination by GERC
• Fixed- For availability Rs/ MW/month
• Variable- As and when services is called for
(Rs/kWh)
• Energy storage: Potential energy storage technologies to be
explored
CERC and GERC – Regulations
for implementation of ancillary
market
Recommendations….
Other measures
Focal area of intervention Action required Roles and responsibilities
Advocacy and
coordination
Coordinated planning at regional and
central level for
• RE forecasting and scheduling
• Gujarat SLDC may take a lead in
developing the forecast
evaluation methodology
• Spinning reserves and ancillary market
• Transmission network planning
GEDA, GUVNL, GERC and
GETCO with CTU / Central
Govt.
Recommendations….
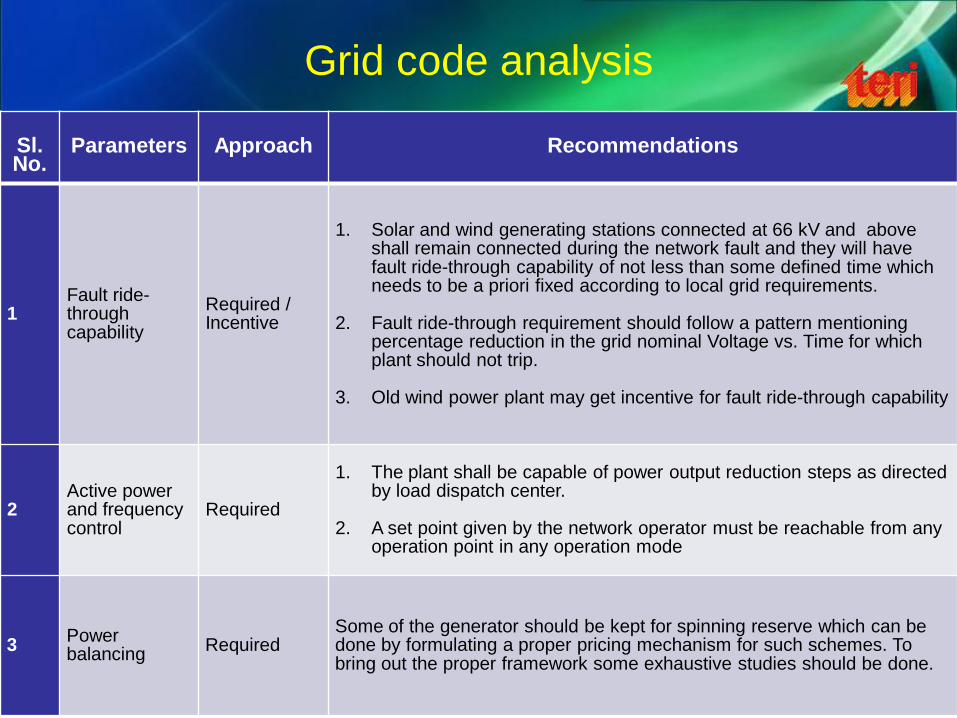
Grid code analysis
Sl. No.
Parameters Approach Recommendations
1 Fault ride-through capability
Required / Incentive
1. Solar and wind generating stations connected at 66 kV and above shall remain connected during the network fault and they will have fault ride-through capability of not less than some defined time which needs to be a priori fixed according to local grid requirements.
2. Fault ride-through requirement should follow a pattern mentioning percentage reduction in the grid nominal Voltage vs. Time for which plant should not trip.
3. Old wind power plant may get incentive for fault ride-through capability
2 Active power and frequency control
Required
1. The plant shall be capable of power output reduction steps as directed by load dispatch center.
2. A set point given by the network operator must be reachable from any operation point in any operation mode
3 Power balancing
Required Some of the generator should be kept for spinning reserve which can be done by formulating a proper pricing mechanism for such schemes. To bring out the proper framework some exhaustive studies should be done.
Grid code analysis..
Sl. No.
Parameters Approach Recommendations
4 Reactive power supply
Required / Incentive
1. Solar and wind generating stations connected at 66 kV and above shall be capable of supplying dynamically varying reactive power support so as to maintain power factor within limits ( a detail system study should be performed for defining the power factor limits).
2. To maintain the Reactive power/voltage control with high penetration of renewables, the Reactive power/ voltage control may be treated as ancillary service and the sources/devices contributing to reactive power for voltage control may also be appropriately incentivized. The proper pricing procedure can be formulated instead of flat pricing for reactive power exchanges (withdrawal/supply) by carrying out the exhaustive studies of various methods and their benefits and practical implications.
5 Forecasting Required & Incentive
1. Forecasting should be carried out at developer level as well as at SLDC/NLDC level.
2. Standardisation of forecast evaluation methodology. Accuracy requirement may be worked out separately for high wind and low wind seasons
6 Power Quality Required The grid code should clearly mention the guidelines for power quality measures, e.g. allowable total harmonic distortion, flickers (e.g. 3% in Danish grid code).
Back
Gujarat RE installation as per 17% state
RPO target by 2021-22
Estimated integrated RE potential in Gujarat
District
CSP with water
availability (GW)
SPV Wind hybrid
excluding CSP land
(GW)
Only SPV
excluding wind
and CSP
Only wind excluding
solar potential land
(GW)
Biomass
(GW)
Total
integrated
potential
(GW)
Ahmedabad 1.61 1.45 1.01 0.00 0.06 4.13
Amreli 5.87 6.91 0.00 0.11 0.14 13.03
Anand 0.00 0.00 0.00 0.00 0.02 0.02
Banaskantha 7.74 5.87 0.27 0.95 0.08 14.90
Bharuch 22.74 1.84 0.00 0.24 0.04 24.86
Bhavnagar 3.93 9.04 0.00 0.01 0.19 13.17
Dahod 24.96 5.34 0.00 0.00 0.02 30.32
Gandhinagar 0.80 0.07 1.00 0.00 0.03 1.90
Jamnagar 37.11 12.67 0.41 1.04 0.21 51.44
Junagadh 3.94 5.26 0.38 0.00 0.19 9.77
Kachchh 87.76 148.13 8.92 133.26 0.07 378.14
Kheda 5.48 2.72 0.00 0.00 0.04 8.24
Mahsana 0.33 0.39 0.76 0.00 0.05 1.53
Narmada 17.76 1.69 0.00 0.00 0.03 19.47
Navsari 0.48 0.59 0.14 0.10 0.01 1.32
Panchmahal 7.21 3.39 0.00 0.00 0.01 10.61
Patan 7.03 1.20 0.00 1.87 0.04 10.14
Porbander 0.00 0.94 0.00 0.00 0.04 0.98
Rajkot 17.61 11.19 2.46 0.08 0.23 31.57
Sabarkantha 14.49 5.83 5.27 0.00 0.09 25.68
Surat 25.88 3.70 0.60 0.01 0.03 30.23
Surendranagar 4.26 4.29 0.00 1.11 0.14 9.79
The dangs 0.00 0.51 0.00 0.00 0.02 0.54
Vadodara 44.00 5.34 0.00 0.00 0.10 49.45
Valsad 4.71 2.24 0.13 0.43 0.02 7.53
Total 345.71 240.60 21.36 139.21 1.89 748.77
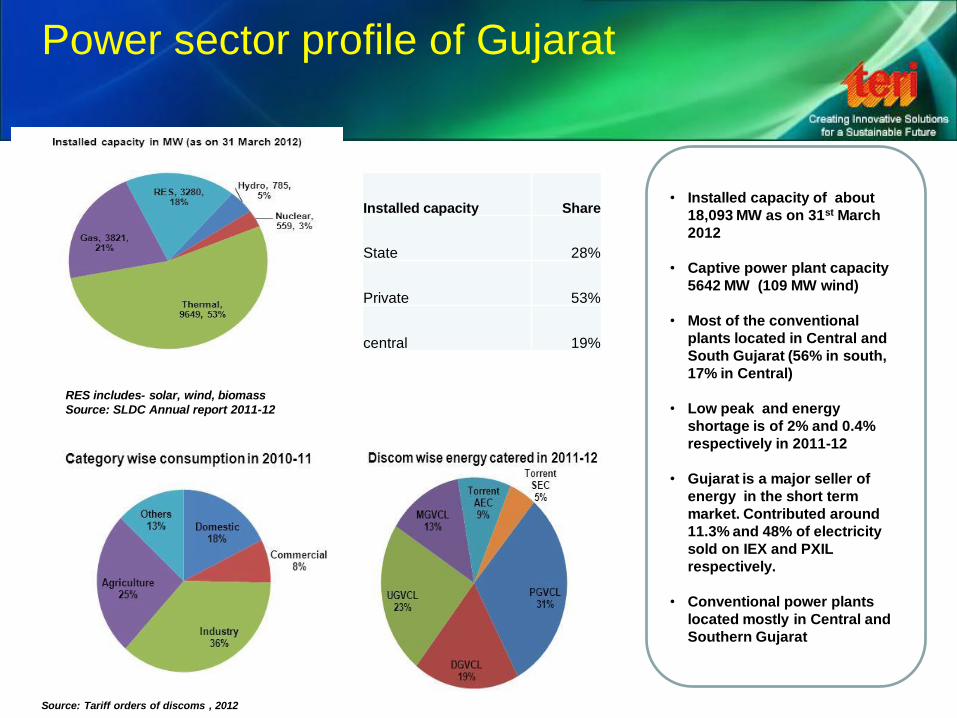
Power sector profile of Gujarat
RES includes- solar, wind, biomass
Source: SLDC Annual report 2011-12
Installed capacity Share
State 28%
Private 53%
central 19%
• Installed capacity of about
18,093 MW as on 31st March
2012
• Captive power plant capacity
5642 MW (109 MW wind)
• Most of the conventional
plants located in Central and
South Gujarat (56% in south,
17% in Central)
• Low peak and energy
shortage is of 2% and 0.4%
respectively in 2011-12
• Gujarat is a major seller of
energy in the short term
market. Contributed around
11.3% and 48% of electricity
sold on IEX and PXIL
respectively.
• Conventional power plants
located mostly in Central and
Southern Gujarat
Source: Tariff orders of discoms , 2012
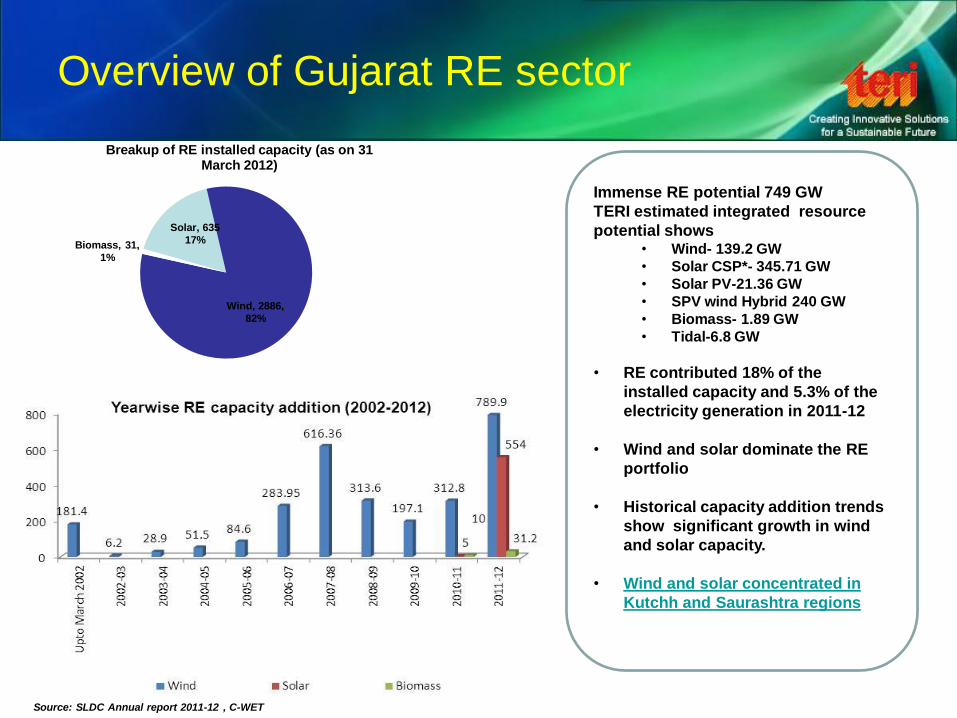
Overview of Gujarat RE sector
Solar, 635
17%
Wind, 2886,
82%
Biomass, 31,
1%
Breakup of RE installed capacity (as on 31 March 2012)
Immense RE potential 749 GW
TERI estimated integrated resource
potential shows • Wind- 139.2 GW
• Solar CSP*- 345.71 GW
• Solar PV-21.36 GW
• SPV wind Hybrid 240 GW
• Biomass- 1.89 GW
• Tidal-6.8 GW
• RE contributed 18% of the
installed capacity and 5.3% of the
electricity generation in 2011-12
• Wind and solar dominate the RE
portfolio
• Historical capacity addition trends
show significant growth in wind
and solar capacity.
• Wind and solar concentrated in
Kutchh and Saurashtra regions
Source: SLDC Annual report 2011-12 , C-WET
RPO and REC status in Gujarat
Year 2006-07 2007-08 2008-09 2009-10 2010-11 2011-12 2012-13
RPO target 1% 1% 2% 2% Wind -4.5%
Solar-0.25%
Others-
0.25%
Total- 5%
Wind -5%
Solar-0.5%
Others-0.5%
Total -6%
Wind -5.5%
Solar-0.5%
Others-0.5%
Total -7%
RPO
compliance
NA 2.07% NA 2.55% NA Wind -4.3%
Solar-0.26%
Others-
0.15%
Total – 4.7%
• Gujarat has historically been able to
meet its RPO targets
• Shortfall experienced in 2011-12,
probably for the first time
Out of 3279 MW, 321 MW registered under
REC (wind -316.9 MW, biomass and
biofuel-cogen- 4.2 MW)
The fourth ranked state in terms of REC
accredited and registered projects (after
TN, Maharashtra, and UP)
Solar energy injection pattern
-20
0
20
40
60
80
100
120
140
160
180
MW
Time
Charanka Solar Generation on 29.4.12
Varying Output:
-20
0
20
40
60
80
100
120
MW
Time
Charanka Solar Generation on 11.04.12
-20
0
20
40
60
80
100
120
140
160
MW
Time
Charanka Generation on 13.04.12
Sudden Variation in Generation: Generation in a normal Sun-
shine day:
1. Generation from solar is higher during 9:00 hrs. to 16:00 hrs. in a normal sun-
shine day.
2. Like wind there is also reasonable varying output and sudden variation in
case of solar.
3. Number of days of variation in a year is likely to be less than wind.
Hourly wind energy injection trend during the year
2011-12
From the above graph, it is observed that the wind energy
injection between 8:00 hrs. to 13:00 hrs. during the year is quite
less.
Source: Gujarat SLDC annual report
2011-12
Pattern of total electricity demand and generation from Wind in Gujarat
1. In Monsoon(Jun-Sep), electricity demand is minimum and Wind
generation is maximum (compared to other seasons)
2. Wind availability pattern in monsoon almost matches with
•Electricity generation from Wind in the month of February doesn’t follow the demand pattern.
•High wind and high demand: Wind is capable of meeting around 4.2% - 12.9% of electricity demand. •More variability in the wind availability has been observed in the month of February.
•Low wind and low demand: wind is capable of meeting 0 to 0.8% of electricity demand.
•High wind and low demand: there is a case that at 7:00 hours wind is meeting 13.6 % of electricity demand
•Low wind and high demand: wind contributes maximum of 0.7% towards electricity demand
RE penetration scenario
0
500000
1000000
1500000
2000000
2500000
Ele
ctr
icit
y D
em
an
d
(MU
)
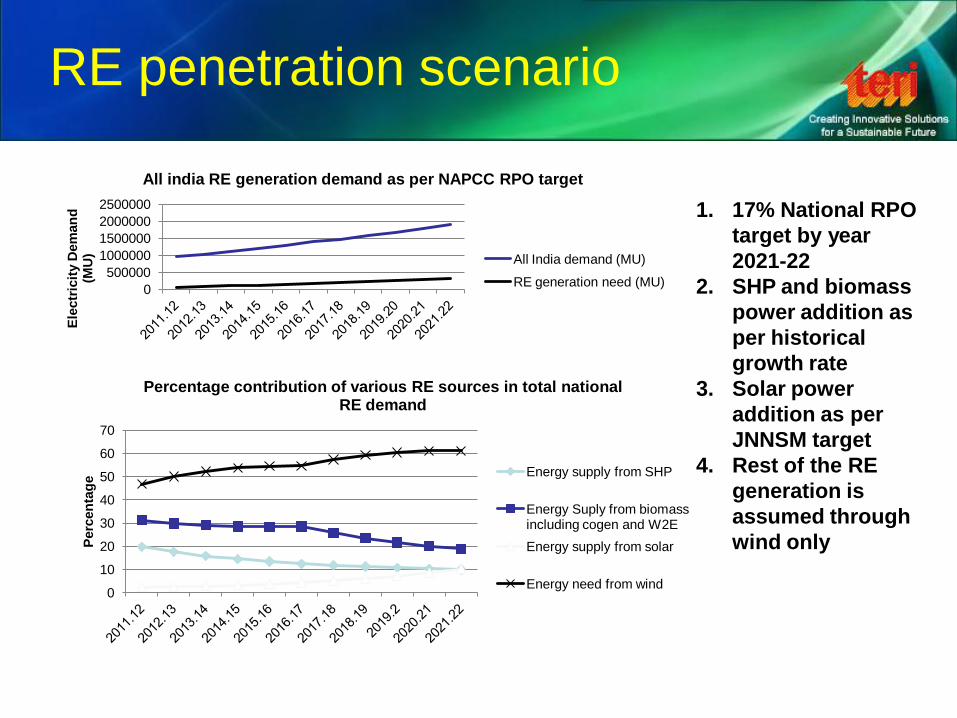
All india RE generation demand as per NAPCC RPO target
All India demand (MU)
RE generation need (MU)
0
10
20
30
40
50
60
70
Perc
en
tag
e
Percentage contribution of various RE sources in total national RE demand
Energy supply from SHP
Energy Suply from biomass including cogen and W2E
Energy supply from solar
Energy need from wind
1. 17% National RPO
target by year
2021-22
2. SHP and biomass
power addition as
per historical
growth rate
3. Solar power
addition as per
JNNSM target
4. Rest of the RE
generation is
assumed through
wind only
RE penetration scenario
1. Total wind
capacity addition
of about 100 GW
would be required
by 2021-22 to meet
the NAPCC
national RPO
target
2. Gujarat having the
maximum
potential will be
the most
preferable state to
contribute towards
wind power
installation
14.10%
34.12%
13.22%
5.80% 4.91%
13.77% 14.07%
0.00% 5.00%
10.00% 15.00% 20.00% 25.00% 30.00% 35.00% 40.00%
Perc
en
tag
e o
f to
tal ein
d p
ow
er
po
ten
tial
State wise percentage of total wind power potential in India at 80 m hub height
Scenario-1: An affirmative scenario, i.e. Wind generation follows load variation – Not an issue in grid operation
Scenario-2: Load remain constant along with increase in wind generation – Backing down of conventional power plants
• Conventional power plants are asked to back down their generation during light load periods to accommodate RE.
• Backing down is done on the basis of merit order dispatch.
Scenario-3: Load remain constant along with drop in wind generation – Needs spinning reserves- Gas based power plants are being used as spinning reserve
– load shedding • Generally shedding is not being practiced in Gujarat.
• Only in extreme cases the load regulation is done during high demand and low wind availability period if conventional power plants unable to meet the required demand.
• Equal %age of reduction in load at each feeder is followed on priority basis for load shedding.
– If frequency permits, there is possibility of over drawl at the prevailing rate.
• SLDC analyses the trend of wind generation and plans for conventional backing down.
• Till now SLDC has been able to manage it most of the time
GETCO methodology for grid expansion
planning
• 17th EPS data
– Peak demand and discom wise energy demand projections
• Anticipated generation capacity addition in Gujarat
– both conventional and renewable
• System study
– It follows CEA transmission system planning and design criteria
• Currently RE addition anticipated based on pending applications mainly
• Maximum load of wind and solar is considered as 80% of installed capacity.
• GETCO has prepared the transmission plan for 12th five year plan
and looking for the funding for it
Power congestion issues in Gujarat
• Congestion in Deodhar, Shivlakha, Shankhari networks .
Overloading of 220/66 kV Shivlakha ICTs
• RE plants providing lesser grid support during system
disturbances than the conventional in terms of
MVAR/active Power regulation.
• No major issues have been observed due to wind and solar energy variations till now
This scenario may change with increase in wind and solar energy penetration i.e. above 30% average from current average of about 5%
Solutions for future RE integration
management
• Wind power forecasting
• Grid strengthening
• Advanced grid planning
• Spinning reserves and ancillary market
• Properly defined RE grid integration regulations – Grid codes
– CEA grid connectivity standards etc.
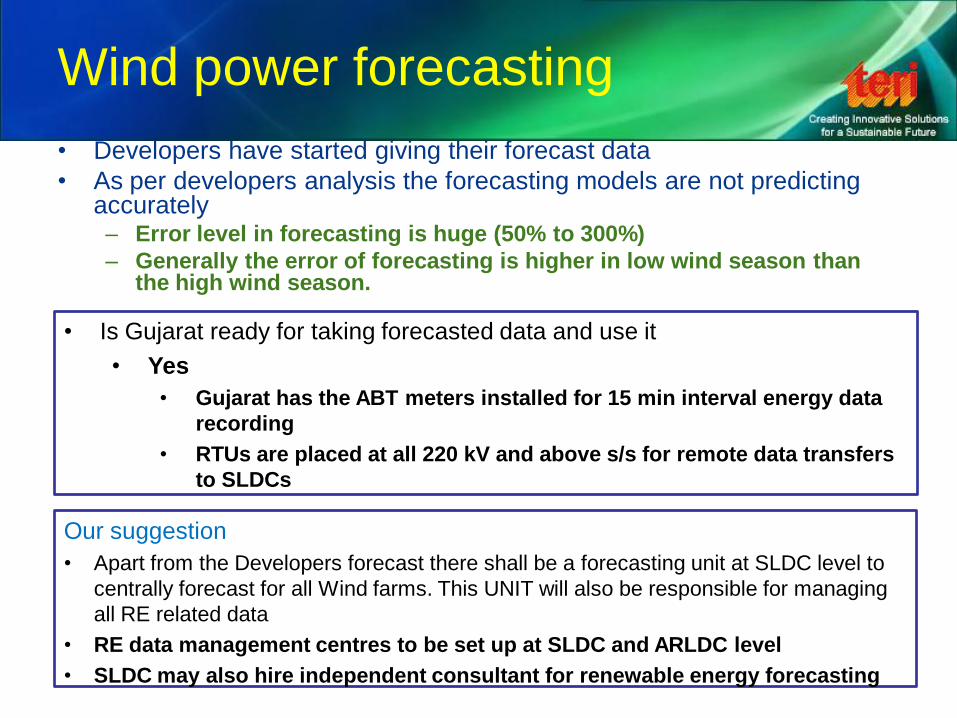
Wind power forecasting
• Developers have started giving their forecast data
• As per developers analysis the forecasting models are not predicting accurately – Error level in forecasting is huge (50% to 300%)
– Generally the error of forecasting is higher in low wind season than the high wind season.
• Is Gujarat ready for taking forecasted data and use it
• Yes
• Gujarat has the ABT meters installed for 15 min interval energy data
recording
• RTUs are placed at all 220 kV and above s/s for remote data transfers
to SLDCs
Our suggestion
• Apart from the Developers forecast there shall be a forecasting unit at SLDC level to
centrally forecast for all Wind farms. This UNIT will also be responsible for managing
all RE related data
• RE data management centres to be set up at SLDC and ARLDC level
• SLDC may also hire independent consultant for renewable energy forecasting
Advance grid planning
It is suggested that • GETCO along with GEDA and GUVNL shall consider the RE
potential distribution in the state for future network planning
• GEDA/GETCO may invite the future development plans (5-10 years)
from wind and solar power developers, for the advance planning of
grid network.
• Gujarat govt./GETCO to coordinate and collaborate with central
govt./CTU for
– Grid network within state
– Interstate network
• Integrated Solar and Wind Parks
– Will help in advance grid planning and competitive bidding
–
Spinning reserves/storage
• Hydropower and gas based power plants are considered as good spinning reserve for balancing of power
• At present about 785 MW of Hydro and 2164 MW of Gas based power plants capacity is operational in Gujarat.
• Hydro power is limited in the state – Interstate collaboration needs to be sought for sharing of hydro generation capacity to
address the variability of RE generation in the state
• Gas based power plants will be the main source in Gujarat for spinning reserves so there is a need for coordinated planning of gas based power plants along with the renewable energy development planning
• Gas based power plants should be installed in high solar and wind potential areas to act as spinning reserve. Gas turbines could run at certain capacity (about 50% of rated capacity) for break even and rest could act as spinning reserve.
• solar and wind hybrid systems need to be installed in potential areas
• Gujarat is blessed with a large capacity of tidal energy. Issues of limited hydro resource in Gujarat can be minimised by utilising tidal potential.
• Potential energy storage technologies to be explored.