94
Instituto Superior de Engenharia do Porto DEPARTAMENTO DE ENGENHARIA MECÂNICA INTEGRATION OF THE PROJECT TEAM IN THE CLASSIC MAINTENANCE CYCLE Luís Miguel Barbosa da Cruz 2015
| Date post: | 29-Mar-2019 |
| Category: |
Documents |
| Upload: | nguyenthuan |
| View: | 213 times |
| Download: | 0 times |

IInnssttiittuuttoo SSuuppeerriioorr ddee EEnnggeennhhaarriiaa ddoo PPoorrttoo DEPARTAMENTO DE ENGENHARIA MECÂNICA
INTEGRATION OF THE PROJECT TEAM IN THE CLASSIC MAINTENANCE CYCLE
Luís Miguel Barbosa da Cruz
2015

INTEGRATION OF THE PROJECT TEAM IN THE CLASSIC MAINTENANCE CYCLE LUÍS CRUZ

IInnssttiittuuttoo SSuuppeerriioorr ddee EEnnggeennhhaarriiaa ddoo PPoorrttoo DEPARTAMENTO DE ENGENHARIA MECÂNICA
INTEGRATION OF THE PROJECT TEAM IN THE CLASSIC MAINTENANCE CYCLE
Luís Miguel Barbosa da Cruz
1000686 Dissertação apresentada ao Instituto Superior de Engenharia do Porto para cumprimento dos requisitos necessários à obtenção do grau de Mestre em Engenharia Mecânica, realizada sob a orientação do Doutor Francisco José Gomes da Silva, Professor Adjunto do Departamento de Engenharia Mecânica do ISEP.
2015

JURY iv
INTEGRATION OF THE PROJECT TEAM IN THE CLASSIC MAINTENANCE CYCLE LUÍS CRUZ
JÚRI v
INTEGRATION OF THE PROJECT TEAM IN THE CLASSIC MAINTENANCE CYCLE LUÍS CRUZ
Presidente
Orientador
Arguente
Doutor Rui Pedro Cardoso da Silva Martinho Professor Adjunto, Instituto Superior de Engenharia do Porto
Doutor Francisco José Gomes da Silva Professor Adjunto, Instituto Superior de Engenharia do Porto
Doutor José Duarte Ribeiro Marafona Professor Auxiliar,Faculdadede Engenharia da Universidade do Porto
Júri

AGRADECIMENTOS vi
INTEGRATION OF THE PROJECT TEAM IN THE CLASSIC MAINTENANCE CYCLE LUÍS CRUZ

AKNOWLEDGEMENTS vii
INTEGRATION OF THE PROJECT TEAM IN THE CLASSIC MAINTENANCE CYCLE LUÍS CRUZ
Acknowledgements / Agradecimentos
This thesis represents the culmination of my academic career, which itself represents a long
and not always easy path of growth and continuous demand.
It is my belief that this path is made with perseverance, respect for others and team spirit.
In this regard, I must thank all those who shared with me experiences at professional level,
with special emphasis on my colleagues and managers at Continental Mabor for all the
support provided in the elaboration of the thesis I am presenting.
I must also enhance the total support given by “my teacher” Francisco Silva. Thank you so
much.
Thus, I cannot fail to thank my parents for education and bases of responsibility, integrity
and demand instilled from an early age that, today, allow me to face each challenge as it
only, a challenge to overcome.
Thanks also to my sister, by the complicity and unconditional support.
Finally, and most of all, I am grateful to my wife. From you Cláudia, I thank the motivation,
support and, above all, the patience!
Alone, this route would have been impossible!

RESUMO viii
INTEGRATION OF THE PROJECT TEAM IN THE CLASSIC MAINTENANCE CYCLE LUÍS CRUZ

RESUMO ix
INTEGRATION OF THE PROJECT TEAM IN THE CLASSIC MAINTENANCE CYCLE LUÍS CRUZ
Resumo
A manutenção é uma área extremamente importante, principalmente na indústria.
Devidamente organizada, permitirá um fluxo produtivo devidamente planeado e
executado, que permitirá a qualquer empresa manter o nível de facturação desejado e o
prazo de entrega acordado com os clientes. De outra forma, poderá originar o caos.
No entanto, os desafios de gestão da produção mais correntes, nomeadamente através
do Lean Manufacturing, passam a exigir um pouco mais do que uma simples
manutenção. Torna-se obrigatório fazer análises económicas que permitam averiguar
quando cada equipamento passa a exigir custos de manutenção excessivos, os quais
poderão obrigar a um recondicionamento mais acentuado do equipamento, o qual pode
passar inclusivamente por uma melhoria da sua performance. Nestes casos, terá que
existir uma “cumplicidade” entre a Direcção de Produção e a Manutenção, no sentido de
averiguar o melhor momento para proceder a uma melhoria do equipamento, numa
perspectiva de funcionamento global em linha de produção, adaptando-o à performance
que será exigida ao conjunto.
Neste domínio, o Projecto passa a prestar um serviço valiosíssimo à empresa, integrando-
se no conjunto Produção + Manutenção, criando valor na intervenção, através do
desenvolvimento de um trabalho que permite não só repor o estado natural da produção,
mas sim promover uma melhoria sustentada da mesma. Este trabalho pretende reflectir
e avaliar a relevância do Projecto neste tipo de operações, contribuindo de uma forma
sistemática e sustentada para a melhoria contínua dos processos de fabrico. É
apresentado um caso de estudo que pretende validar todo o desenvolvimento
anteriormente realizado na matéria.
Palavras-chave
Manutenção, Gestão da Manutenção, Produção, Lean-Manufacturing, Projecto, Projecto
integrado na Manutenção.

ABSTRACT x
INTEGRATION OF THE PROJECT TEAM IN THE CLASSIC MAINTENANCE CYCLE LUÍS CRUZ

ABSTRACT xi
INTEGRATION OF THE PROJECT TEAM IN THE CLASSIC MAINTENANCE CYCLE LUÍS CRUZ
Abstract
Maintenance is an extremely important field of work, mainly in the industry. Duly organized
will allow a properly planned and carried out productive flow, which will allow any
company to maintain the desired level of billing and the delivery time agreed with
customers. Otherwise, could lead to chaos.
However, the most common production managing challenges, in particular through Lean
Manufacturing, will require a little more than a simple maintenance. It becomes mandatory
to do economic analyses which become feasible to find out when each equipment shall
require excessive maintenance costs, which might advise to perform more remarkable
equipment reconditioning, passing even by an improvement in its performance. In these
cases, it must be an involvement between the Direction of Production and Maintenance, in
order to find out the best time to proceed to the equipment upgrade, in terms of overall
operation on production line, adjusting it to the performance that will be required to set.
In this field, Design will provide an invaluable service to the company, joining in the
Production + Maintenance areas, creating value in the intervention, through the
development of a job that allows not only restoring the natural state of production, but
rather promoting a sustained improvement of the same. This work aims to reflect and
assess the relevance of the Design in this type of operations, contributing to a systematic
and sustained manner to the continuous improvement of manufacturing processes. A case-
study is presented in order to illustrate how the design can help the maintenance function,
upgrading significantly the equipment’s performance, validating all the development done
in this area through this work.
Keywords
Maintenance, Maintenance Management, Production, Lean-Manufacturing, Design, Design
integrated with Maintenance.

ABSTRACT xii
INTEGRATION OF THE PROJECT TEAM IN THE CLASSIC MAINTENANCE CYCLE LUÍS CRUZ

LISTO OF SYMBOLS AND ABBREVIATIONS xiii
INTEGRATION OF THE PROJECT TEAM IN THE CLASSIC MAINTENANCE CYCLE LUÍS CRUZ
List of Symbols and Abbreviations
ABC - Activity Based Costing
ABS - Anti-lock Braking System
AoA - Analisys of Alternatives
CBDAS - Continental Basic Data Acquisition Software
CBS - Cost Breakdown Structure
CER - Cost Estimating Relationship
CIP - Continuous Improvement Process
CM - Conti Machinery
CMIP - Continental Mabor Indústria de Pneus SA
CPP - Continental Pneus Portugal
ESP - Electronic Stability Control
ESS - Electronic Suspension System
FMEA - Failure Mode and Effects Analysis
ICT - Information and communication Technologies
ICT - Information and Communication Technologies
ITA - Indústria Têxtil do Ave
KM - Carcass Construction Machine
KPI - Key Performance Indicator
LCC - Lifecycle Cost Concept
MES - Machine Equipment Standard
MTBF - Mean Time Between Failure
MTTF - Mean Time to Failure
NPW - Nissan Production Way

xiv LISTO OF SYMBOLS AND ABBREVIATIONS
INTEGRATION OF THE PROJECT TEAM IN THE CLASSIC MAINTENANCE CYCLE LUÍS CRUZ
OEE - Overall Equipment Efficiency
OPC - Object Linking and Embedding for Process Control
PDCA - Plan-Do-Check-Act Methodology
PEMS - Plant Engineering Maintenance System
PLC - Programmable Logic Controller
PLT - Passengers and Light Trucks
PU - Production Unit
R&D - Research and Development
TBM - Tire Building Machine
TC - Total Cost
TCS - Traction Control System
TPM - Total Productive Maintenance
USA - United States of America
UUHP - Ultra Ultra High Performance
WBS - Work Breakdown Structure

TABLE OF CONTENTS xv
INTEGRATION OF THE PROJECT TEAM IN THE CLASSIC MAINTENANCE CYCLE LUÍS CRUZ
Table of Contents
Table of Contents .................................................................................................................................... xv
1. Introduction .......................................................................................................................................... 1
1.1. Background ........................................................................................................................................ 1
1.2. Goals ................................................................................................................................................. 2
1.3. Methodology ..................................................................................................................................... 3
1.4. Structure ............................................................................................................................................ 3
2. Literature Review .................................................................................................................................. 5
2.1. Maintenance: Brief Introduction ........................................................................................................ 5
2.1.1. “Maintenace” Role .......................................................................................................................... 5
2.1.2. Brief History about Maintenance .................................................................................................... 5
2.1.3. Evolution of the Maintenance Function .......................................................................................... 7
2.2. Maintenance from a perspective of Production Optimization ............................................................ 8
2.2.1. “Lean” Methodology ....................................................................................................................... 8
2.2.2. Continuous Improvement ............................................................................................................... 9
2.2.2.1. Deming Cycle ............................................................................................................................... 9
2.2.2.2. Ishikawa diagram ....................................................................................................................... 10
2.2.2.1. The Five Whys ............................................................................................................................ 11
2.2.3. Maintenance Management Systems ............................................................................................. 12
2.2.3.1. Breakdown Maintenace ............................................................................................................ 12
2.2.3.2. Preventive Maintenance ............................................................................................................ 12
2.2.3.3. Predictive Maintenance ............................................................................................................. 13
2.2.4. TPM – Total Productive Maintenance ............................................................................................ 13
2.2.5. OEE – Overall Equipment Effectiveness ......................................................................................... 14
2.3. Maintenance Policies ....................................................................................................................... 15
2.3.1. Subjective Aproach ....................................................................................................................... 16
2.3.2. Maintenance Based on the Operational Status of the Equipment .................................................. 17
2.3.3. Dynamic Systems for Scheduling Maintenance (Model) ................................................................ 17
2.3.4. General Failure and Maintenance Policies (Model)........................................................................ 18
2.3.5. Gama Approach for Maintenance Scheduling System.................................................................... 19
2.3.6. Simulation and Economic Analysis for the Selection of the Moment for Corrective Maintenance.. 19
2.3.7. Other Models ................................................................................................................................ 20
2.3.8. Distribution for the Time Spent on Maintenance Operations ........................................................ 22
2.3.9. Metrics used in Maintenance ........................................................................................................ 22
2.4. Lifecycle Cost Concept ..................................................................................................................... 24
2.4.1. First Steps in the Lifecycle Cost Analysis ........................................................................................ 25
2.4.2. Lifecycle Cost Analisys Aplication .................................................................................................. 27

xvi TABLE OF CONTENTS
INTEGRATION OF THE PROJECT TEAM IN THE CLASSIC MAINTENANCE CYCLE LUÍS CRUZ
2.4.3. Lifecycle Cost Analisys Benefits ..................................................................................................... 27
2.5. Maintenance Costs .......................................................................................................................... 28
2.5.1. Preventive Maintenance Costs ...................................................................................................... 28
2.5.1.1. Failure Costs............................................................................................................................... 30
2.5.1.2. Maintenance Costs..................................................................................................................... 32
2.5.1.3. Replacement Costs ..................................................................................................................... 34
2.5.1.4. Overhead Costs .......................................................................................................................... 34
2.5.1.5. Total Costs .................................................................................................................................. 35
3. Development ...................................................................................................................................... 37
3.1. Objectives ........................................................................................................................................ 37
3.2. Company Characterization ............................................................................................................... 38
3.3. Evolution of the Maintenance Role in the Company ......................................................................... 44
3.3.1. Past Maintenance Management System Characterization ............................................................. 45
3.3.2. Reasons that have led to a New Approach to Maintenance ........................................................... 46
3.3.3. Present Maintenance Management System .................................................................................. 47
3.3.4. Benefits and Limitations of the Current Maintenance Management System ................................. 48
3.4. Case Study ....................................................................................................................................... 50
3.4.1. Description of the Initial Situation ................................................................................................. 51
3.4.2. Goals to be Achieved..................................................................................................................... 53
3.4.3. Brainstorming about Possible Solutions - Preliminary Draft ........................................................... 53
3.4.4. Project for the Selected Solution ................................................................................................... 54
3.4.5. Accomplished Real Gains .............................................................................................................. 56
3.4.6. Investment Required ..................................................................................................................... 58
3.4.7. Time Period for Return on Investment .......................................................................................... 59
3.4.8. Summary of Results ...................................................................................................................... 59
3.5. Proposed Model for Application in Other Companies ....................................................................... 68
4. Conclusions ........................................................................................................................................ 71
5. Bibliography and Other Sources of Information................................................................................... 73
TABLE OF FIGURES xvii
INTEGRATION OF THE PROJECT TEAM IN THE CLASSIC MAINTENANCE CYCLE LUÍS CRUZ
Table of Figures
Figure 1 - Steam Machine of 1800’s (http://www.adazi.1v/page/150) .................................................... 6
Figure 2 - PDCA Cycle Illustration (http://en.wikipedia.org) ..................................................................... 9
Figure 3 - Ishikawa Diagram Illustration (http://www.apo-tokyo.org) .................................................... 11
Figure 4 - Five Whys diagram example (http://www.mbaskool.com) ..................................................... 11
Figure 5 - Maintenance metrics example (http://www.mbaskool.com) ................................................. 23
Figure 6 - Balanced score card example (http://www.mbaskool.com) ................................................... 24
Figure 7 - Usual business operation (www.bin95.com) ............................................................................ 31
Figure 8 - Effects on costs and profit of a failure incident (www.bin95.com) ........................................... 32
Figure 9 - Maintenance cost comparison table example (http://www.mbaskool.com). ........................... 33
Figure 10 - Continental-Mabor plant ....................................................................................................... 39
Figure 11 - Continental-Pneus facilities ................................................................................................... 39
Figure 12 - ITA plant ................................................................................................................................ 40
Figure 13 - Continental-Lemmerz plant ................................................................................................... 40
Figure 14 - Continental-Teves plant ......................................................................................................... 40
Figure 15 - Continental Mabor, plant global perspective ......................................................................... 41
Figure 16 - Mabor old facilities ............................................................................................................... 41
Figure 17 – Tire manufacturing process .................................................................................................. 43
Figure 18 - Engineering department organizational chart ....................................................................... 47
Figure 19 – Engineering II organizational chart ....................................................................................... 48
Figure 20 - Textile Cutter Top Illustration (before upgrade) ..................................................................... 51
Figure 21 - Textile Cutter Side Illustration (before upgrade) .................................................................... 52
Figure 22 - Upgrade specifications .......................................................................................................... 54
Figure 23 - Automation Architecture ...................................................................................................... 55
Figure 24 - List of Equipments to Install .................................................................................................. 56
Figure 25 - New visualization and control panel ...................................................................................... 57
Figure 26 - Textile Cutter top illustration (after upgrade) ........................................................................ 57
Figure 27 - Textile Cutter side illustration (after upgrade) ....................................................................... 58
Figure 28 - Top view of the Textile Cutter cutting area (after upgrade) .................................................... 58
Figure 29 - Textile Cutter machine #02 2013 and 2014 production (data removed from CBDAS) (m) ....... 61
Figure 30 - September 2013 Textile Cutter #02 breakdown time losses (data removed from SAP) (H) ..... 62
Figure 31 - September 2013 Textile Cutter #02 global breakdown time losses (data removed from SAP)
(H) .......................................................................................................................................................... 62
Figure 32 - September 2013 Textile Cutter #02 scrap analysis (data removed from scrap attack
platform)(kg) .......................................................................................................................................... 63
Figure 33 - September 2013 Textile Cutter #02 global scrap analysis by root cause (data removed from
scrap attack platform)(kg) ....................................................................................................................... 64

xviii TABLE OF FIGURES
INTEGRATION OF THE PROJECT TEAM IN THE CLASSIC MAINTENANCE CYCLE LUÍS CRUZ
Figure 34 - September 2014 Textile Cutter #02 breakdown time losses (data removed from SAP) (H) ..... 65
Figure 35 - September 2014 Textile Cutter #02 global breakdown time losses by route cause (data
removed from SAP) (H) ........................................................................................................................... 66
Figure 36 - September 2014 Textile Cutter #02 scrap analysis (data removed from scrap attack
platform)(kg) .......................................................................................................................................... 67
Figure 37 - September 2014 Textile Cutter #02 global scrap analysis by root cause (data removed from
scrap attack platform)(kg) ....................................................................................................................... 67
Figure 38 - General approach flux flow ................................................................................................... 68
Figure 39 - By interaction with the other Maintenance Teams Approach Flux Flow ................................. 69
Figure 40 - By solicitation from other departments approach flux flow ................................................... 70

INTRODUCTION 1
INTEGRATION OF THE PROJECT TEAM IN THE CLASSIC MAINTENANCE CYCLE LUÍS CRUZ
1. Introduction
1.1. Background
Any company is only viable if it is competitive. The competitiveness based on a business
integrated management, which passes through the teamwork of the various sectors those
integrate it. Industrial companies are focused on production, which depends on its own
organization, and the whole environment that surrounds it, from product design, to the quality
assurance systems. For goods to be produced are needed available and appropriate
equipment’s to the adopted production system. The preservation operation of this equipment
is vital to fulfil the production plans, as required by the commercial department, one hand, and
stipulated and guaranteed by the scheduling department, on the other. In addition, the
continued demand of increasing productivity means that the equipment is operated in its limit,
which requires a greater effort to preserve its operating status. However, a careful costs
analysis of preserving the functioning equipment, as well as the production needs of the
customers. Just like any other good, if maintenance costs pass to be significant, the
intervention will necessarily have to follow other principles: or replacement equipment
through the acquisition of a new one, or its deep reconditioning, simultaneously adapting to
new needs and the production capacity of the line in which it is embedded.
If the definition of needs in terms of production targets to be achieved is carried out by the
Production Manager, the aggregate concept in these requirements should be made by the
Project Team, the one that has the necessary 'know-how” for selecting the best way to achieve
those objectives.
This leads to a new Maintenance management style, where the Project Team is particularly
important, as it can bring high added value to each maintenance intervention, through the
enhancement of that intervention in terms of added value for the company, improving
performance assembly. This system requires the appropriate integration of the Project Team in
the areas of Production and Maintenance, with a value creation in terms of productivity, which
can be extremely significant for the global business.

2 INTRODUCTION
INTEGRATION OF THE PROJECT TEAM IN THE CLASSIC MAINTENANCE CYCLE LUÍS CRUZ
1.2. Goals
This work had the main objective of carrying out a study about the advantages offered by
the integration of the “Project Team” in activities traditionally managed by Production and
Maintenance in a large industrial company. Thus, may be deemed that the main objectives
are to:
Identify how the “Project Team” can be useful in maintenance operations within a
large company;
Establish the most appropriate management format for work integration in the best
possible way;
Those are the real advantages of this integration.
For achieving the above objectives, it became necessary to:
Analyse the potential operation of the company with different maintenance systems
usually applicable in the industry;
Analyse the company organization chart and understand the relationship between
different areas;
Study the needs in terms of Production and Maintenance within the company;
Survey the situation experienced several years ago, when this integration did not exist;
Survey the current situation since integration of the “Project Teams” is working;
Analyse differences in terms of economic performance and the integration of some
sectors;
Draw conclusions and establish a model that can be successfully applied by any other
company.

INTRODUCTION 3
INTEGRATION OF THE PROJECT TEAM IN THE CLASSIC MAINTENANCE CYCLE LUÍS CRUZ
1.3. Methodology
The preparation of this work followed the methodology set out below:
Study about the state of the art concerning this issue;
Run a complete survey of the real situation several years ago, in this field;
Perform the study analysis of the current situation, considering the “Project Team” as
a valuable aid in the equipment definition and production lines regeneration;
Establish the respective differences, advantages and limitations resulting from the
implementation of this system, regarding operational purposes;
Carry out a brief economic study on the advantages of the current system;
Present a case study that can link the “Project Team” integration in the traditional
Maintenance cycle;
Develop a model that easily extrapolate this experience to other companies;
Formulating this thesis.
1.4. Structure
The structure of this work is mainly based on two parts: an initial Literature Review, which
aims to frame the reader with the issues involved in this work, by reviewing the technical and
scientific developments published in scientific books or journals dedicated to these matters,
and the Practical work itself, with reference to how the work evolved, methodologies used, the
developments carried out, results and conclusions.

4 INTRODUCTION
INTEGRATION OF THE PROJECT TEAM IN THE CLASSIC MAINTENANCE CYCLE LUÍS CRUZ

LITERATURE REVIEW 5
INTEGRATION OF THE PROJECT TEAM IN THE CLASSIC MAINTENANCE CYCLE LUÍS CRUZ
2. Literature Review
2.1. Maintenance: Brief Introduction
2.1.1. “Maintenance” Role
According to NP-EN-13306: 2007, maintenance is the combination of all technical,
administrative and management activities, during a good’s life cycle designed to keep it or
replace it, to a state which allow the required function. According to the same standard, the
maintenance management are all activities that determine the objectives, the strategy and the
responsibilities related to the safeguarding and implementing them by various means such as
planning, control and supervision of the maintenance and improved methods in the
organization, including the economic aspects.
According to Kardec (Kardec et al, 2003), maintenance is extremely important in industry in
order to produce the largest number of products that the equipment can manufacture without
breakdowns / failures.
2.1.2. Brief History about Maintenance
To find out how the Maintenance evolved, one must go back in time to the early twentieth
century to know how it was seen and used (Figure 1). The historical evolution of Maintenance
is divided into four phases.
Below are showed some of the most memorable moments of the maintenance evolution:
I – 1914: the maintenance mattered little, was a secondary consideration in the production
process, the industries of that time did not have teams specialized in maintenance and
industries worked to make the best machines production until they have a failure or stop
permanently.

6 LITERATURE REVIEW
INTEGRATION OF THE PROJECT TEAM IN THE CLASSIC MAINTENANCE CYCLE LUÍS CRUZ
From the First World War, industries in a generally manner, willing to maintain a minimum
production, created an organ / team subordinate to Production. The basic goal was to make
equipment corrective maintenance, namely when the equipment for some reason stopped
producing, maintenance was driven to make proper repairs, thus returning to the production
process, which at that time was enough. Demand for services until then was little, because the
machines are oversized and robust, which guarantee a long service life.
Figure 1 - Steam Machine of 1800’s (http://www.adazi.1v/page/150)
II - The situation presented in the first phase was the time of "fault-fix", remaining like that
until the 30s when, motivated by the Second World War, the need to rapidly increase
production corresponding to the supply of a growing demand, the industries in their highest
decisions levels decided to create a maintenance department, so that there was a concern not
only to correct the faults but also prevent them. At that time was begun to think about how
we could keep the sector from there on, ie that maintenance should be done, so that the
machines could produce the largest number of parts.
III - From 1940 to 1970, with the development of commercial aviation, there was an expansion
of preventive maintenance criteria, since there was not the possibility to perform corrective
maintenance on an aircraft during flight. This stage is considered the most important of all,
since enabled the maintenance to have more quality. The maintenance started to be seen in
another way, it grew up from a function of repairing the equipment for a more qualified
function (more technical) as is the case of equipment failure analysis, anticipating problems or
failures.

LITERATURE REVIEW 7
INTEGRATION OF THE PROJECT TEAM IN THE CLASSIC MAINTENANCE CYCLE LUÍS CRUZ
In the late sixties early seventies, the first computers appeared, being extremely huge (as big
as houses), very slow and with few functions.
IV - From 1970 to the present, with the industry rise and the computers expansion, being
faster with powerful software, maintenance has been inserted into the most sophisticated
processes, such as control and analysis, used in everyday life. Servicing is not just using the tool
boxes for defective machines repair, but also anticipating failures and determining the best
and most economic periods for the implementation of preventative maintenance, which in
most cases is no longer just based on time.
These criteria are also known as informative controllers that aim to predict or monitor the
equipment condition, putting the maintenance in a controlled situation and therefore more
economical for companies, with impact on production and especially safer for workers and the
environment.
The phase IV appeared early in the seventies with the existing technology at that time. With
computers development, it has been improved and adapted to maintenance.
2.1.3. Evolution of the Maintenance Function
In the seventies appeared “conditioned” preventive maintenance, consisting of performing
maintenance on components only when needed. It is a preventive maintenance subordinated
to a predetermined event type (self-testing) where the information is given by a sensor so that
there is wear, vibration, noise or other indicator that can reveal equipment degradation.
Total productive maintenance, also known by TPM, appeared in the 1980s in Japan (the TPM
will be described further on).
The total productive management appeared in the 1990s, and it is a management tool for the
elimination of industrial losses.
In the year two thousand upsurge the e-Maintenance concept which results from the ICT
(Information and Communication Technologies) application to the industry, within the
maintenance strategy.

8 LITERATURE REVIEW
INTEGRATION OF THE PROJECT TEAM IN THE CLASSIC MAINTENANCE CYCLE LUÍS CRUZ
2.2. Maintenance from a perspective of Production Optimization
By enhancing the effects of a careful and planned maintenance in an industrial park we are, by
this way, enhancing also the production process optimization.
Reliable equipment, with high production levels and with production stops reduced just for
preventive maintenance periods, represent high levels of productive availability or Overall
Equipment Efficiency (OEE) and guarantee an output whose values depend only on the
production department scheduling.
It can be therefore conclude that a strong bet in a robust and planned maintenance system is a
production levels enhancer factor.
2.2.1. “Lean” Methodology
Lean means thinner (training people so that they are aware that everything that spoils has
costs, and does not make investments without anticipated analysis) in order to not make
expenditures that are not needed and increasing productivity with the same resources. The
implementation of Lean in a company helps to reduce costs in maintenance, production,
logistics and administrative services, and in the human resources.
More than implement it, this philosophy must be kept, and to keep it, constant innovation is
needed.
Lean appeared in the United States of America in the early twentieth century by Frederick
Taylor and it was applied to industry for a man who had a vision would change the world, this
man was Henry Ford. Ford wanted to produce a car at low cost so that all the people had
possibility to have one. To lower the car cost he had to increase the daily production, being a
single model and using just one colour, black.
Ford implemented the assembly line methodology, where the work was sequential from the
beginning up to the exit of the factory; in this process, each worker had only one function
which on the one hand it was good, because the worker was earning more and more
experience.

LITERATURE REVIEW 9
INTEGRATION OF THE PROJECT TEAM IN THE CLASSIC MAINTENANCE CYCLE LUÍS CRUZ
From the worker’s point of view were stressful tasks, they could not make mistakes or losses of
time with the risk of decreasing production and these tasks were performed mechanically by
workers (without thinking what they were doing).
By this system, they were able to reduce the assembling time of the Model T. As an example,
in the year 1908, to assemble a full chassis it would take 728 minutes, after five years they
were able to mount the same chassis in 93 minutes (Ntuen, 1991).
It was only possible to reduce this time due to deletions of wastes, intermediate times and
improved worker’s performance, the need to produce the largest number of parts without any
errors and the need to create a quality control in each assembly line section (Ntuen, 1991).
Through this methodology, Lean philosophy was born without having this name or thought.
2.2.2. Continuous Improvement
Three main methods for improvement, one a continuous improvement tool and the others
methods for finding root causes, are touched onto this thesis. To ensure comprehension of
these methods, a respective explanation is needed.
2.2.2.1. Deming Cycle
W.E. Deming originally developed the cycle as “Plan-Do-Check-Act” (PDCA), but later changed
to study as he found it to better illustrate his intention with that step. He also liked to call it
the Shewart cycle after Walter A. Shewart from who he was inspired to the PDCA (Figure 2).
Figure 2 - PDCA Cycle Illustration (http://en.wikipedia.org)

10 LITERATURE REVIEW
INTEGRATION OF THE PROJECT TEAM IN THE CLASSIC MAINTENANCE CYCLE LUÍS CRUZ
The cycle is developed as a method to promote the Continuous Improvement Process (CIP)
(Klefsjö, 2001). It is divided into four general steps, which are to be taken in order and, as the
name suggests, it is a cycle which is therefore repeated.
When a problem is initially addressed, the source needs to be searched. To find potential
sources, existing methods such as Ishikawa diagram or FMEA can be applied. After sorting out
the potential candidates and collecting all relevant data, effective objectives need to be
established. This means the Plan stage. In the next step, Do, the objectives are executed in
appropriate scale. To confirm an improvement, the new processes are studied (step three) and
compared to the original (check).
Depending on the outcome of the implementation, the fourth step involves acting accordingly.
If the sought after results were achieved, the processes need to be standardized, else we
learned from the mistakes and the cycle is continued from start again with new insight (Ntuen,
1991).
2.2.2.2. Ishikawa diagram
The Ishikawa diagram, also called a fishbone diagram due to its appearance, is a diagram
developed to find root causes to a chosen problem. It is named due to its inventor, Kaoru
Ishikawa, who first started using the method in 1943 at Kawasaki Steel Works in Japan (Klefsjö,
2001). It is built with the effect or problem at the right, and its possible causes to the left. To
begin with, it is not always easy to come up with causes to a problem, which is why in
industrial settings the causes can most often be divided into some of seven major categories to
start from (Klefsjö, 2001). These categories are management, man, method measurement,
machine, material and Mother Nature, as we can see in the illustration bellow. To find possible
causes to continue analysis with, the fishbone (Figure 3) is then branched out further with
primary and secondary causes until the root causes are defined (Inozu, 1991).

LITERATURE REVIEW 11
INTEGRATION OF THE PROJECT TEAM IN THE CLASSIC MAINTENANCE CYCLE LUÍS CRUZ
Figure 3 - Ishikawa Diagram Illustration (http://www.apo-tokyo.org)
2.2.2.3. The Five Whys
The Five Whys (Figure 4) is a simple question-asking method aimed at discovering root causes.
It can result in very specific root causes if combined with an Ishikawa diagram. Despite its
simplicity it should not be taken too lightly, as it has to be used properly and without jumping
to conclusions or assumptions.
Figure 4 - Five Whys diagram example (http://www.mbaskool.com)

12 LITERATURE REVIEW
INTEGRATION OF THE PROJECT TEAM IN THE CLASSIC MAINTENANCE CYCLE LUÍS CRUZ
This is a simple example, but it shows how steps should be taken one at time. Also, this could
be expanded to more steps, but in most cases Five Whys can be enough to find the root cause.
2.2.3. Maintenance Management Systems
2.2.3.1. Breakdown Maintenace
According to Kardec (Kardec, 2003) corrective maintenance is the correction of the unplanned
breakdown after a problem affecting in some or all of the equipment, and it can be divided
into two groups, namely planned and unplanned corrective maintenance.
According to Xenos (Xenos, 1998), this process causes a great cost to the company on the
machines maintenance.
The higher cost is when production stops, having costs with the stop itself (non-production),
being concerned to quality and delivery times of final products to customers.
Planned corrective maintenance (deferred Maintenance) it is a programmed correction /
repair through predictive or detective methods, until the intervention is possible, without
affecting directly the production (Kardec, 2003).
2.2.3.2. Preventive Maintenance
Preventive maintenance is the maintenance operations carried out with the intention to
reduce or avoid equipment breakdown. For this purpose we use an advanced plan, with
defined time intervals, regardless of the actual need, which aims to act as preventive care to
avoid failures (Kardec, 2003).

LITERATURE REVIEW 13
INTEGRATION OF THE PROJECT TEAM IN THE CLASSIC MAINTENANCE CYCLE LUÍS CRUZ
2.2.3.3. Predictive Maintenance
Predictive maintenance is when the adjustments on the machines or equipment are made just
when they need them, but without they break down or stop. With a direct and constant
monitoring, it is possible to predict failures and know when it will be necessary to do an
intervention (Kardec, 2003).
2.2.4. TPM – Total Productive Maintenance
Productive Maintenance appeared in the United States of America in the late forties early
fifties. This concept was characterized by the development of systematic preventive
maintenance techniques to improve the equipment reliability.
The Total Productive Maintenance (TPM) is not more than the initial “American Productive
Maintenance” concept modified and improved to fit the Japanese industrial environment.
In 1953, a group of 20 Japanese businessmen gathered to do research who moved in 1962 to
the United States of America focused in observing "American productive maintenance". This
mission gave rise to the creation of the Japan Institute of Plant Engineers (JEEP), predecessor
of the Japan Institute of Plant Maintenance, created in 1969. The Ninppondenso (supplier of
components to Toyota) was the first Japanese company to introduce preventative
maintenance in the equipment of its production lines.
According to Willmott and Mccarth (2001), the TPM is a philosophy or a way of thinking
around maintenance, which means a new concept of how to keep an installation or
equipment.
The TPM is a management method that identifies and eliminates losses existing in the
productive processes, maximizing the use of industrial assets and ensuring the generation of
high quality products at competitive costs, knowledge developments able to re-educate
people to preventive actions and continuous improvement, ensuring the reliability of the
equipment and the ability of the processes, without additional investments.

14 LITERATURE REVIEW
INTEGRATION OF THE PROJECT TEAM IN THE CLASSIC MAINTENANCE CYCLE LUÍS CRUZ
According to Ribeiro (2007), translated into the English language TPM Total Productive
Maintenance:
Total – means that all employees are involved in all activities in order to eliminate all
accidents, defects and failures (waste).
Productive – means that the actions are performed during continuous production, so that the
problems for the productions are minimized.
Maintenance – maintain a good condition of the equipment repairing, cleaning and greasing.
Regarding these procedures, you can ramp up production and simultaneously lift the morale
and job satisfaction of employees.
The time for maintenance is planned with the production process and together they know the
ideal time to stop production and carry out the equipment maintenance. In this way, it is
intended to transform or minimizing possible emergency maintenance (corrective
maintenance) (Rajan, 2007).
To apply the TPM, first we have to provide the best training to workers both in the
maintenance and production area, involving everyone to work as a team and dialoguing
among themselves. The workers are the best connoisseurs and equipment status informers, so
they can describe and transmit all deficiencies, even before they are damaged.
Regarding the application of TPM philosophy, we can avoid unnecessary expenses, normal in
an environment of constant economic change, produce goods without reducing the quality of
the same, reduce costs and produce more in less time. Thus, the products are being delivered
to customers without defects (Shirose, 2000).
2.2.5. OEE – Overall Equipment Effectiveness
To achieve success in the TPM implementation, there must be a way of measuring how initially
processes were and what are the gains achieved with the implementation of the programme.
For such, a performance indicator named OEE (Overall Equipment Efficiency) was created,
which measures the productivity of equipment and processes (Pomorski, 1997). In the vast
bibliography on this topic, we can find some authors refer to this indicator as Overall
Equipment Efficiency and others whom call for Overall Equipment Effectiveness.

LITERATURE REVIEW 15
INTEGRATION OF THE PROJECT TEAM IN THE CLASSIC MAINTENANCE CYCLE LUÍS CRUZ
The key figure OEE allows visualization of machine related losses. This might seem easy at first,
because with a machine theoretically able to run 24 hours a day and 365 days each year we get
an amount of products representing the maximum capacity. Due to holidays and managerial
decisions as not working on most weekends and so on, the maximum capacity is mostly never
exploited.
Therefore, the quotient of the actual number of produced units put up against the maximum
capacity yields the effectiveness of the equipment during the chosen time period, being
obtained the overall equipment effectiveness (Reitz, 2008). It is important to keep in mind that
the OEE is only a measurement of mechanical components. Therefore all losses, even those
influenced by human aspects, such as change-overs, should be considered as the only interest
in the OEE is to see whether the equipment runs according to its capability [Reitz, 2008]. The
basic requirement for OEE correct calculation is, of course, accurate data. All mechanical losses
need to be recorded for best results.
2.3. Maintenance Policies
Maintenance involves planned and unplanned actions carried out to retain a system in or
restore it to an acceptable condition. Optimal maintenance policies aim to minimize downtime
and the operations cost. Many practitioners and academicians have tried to address the
problem of maintenance policies.
The two basic types of maintenance are:
I - Corrective: Unscheduled maintenance required as a result of failure to restore a system to
acceptable performance level.
II - Preventive: Scheduled maintenance required in order to operate a system at an acceptable
level of performance.
For complex systems comprising many different components, the actual maintenance problem
may be the organization of preventive maintenance work that depends on the critical ages of
components, rather than searching for some optimal solution in terms of any precise criterion.
This would help reduce the complexity of the problem and help develop heuristics. Often
sufficient data may not be available for complex models; if they are not available then the

16 LITERATURE REVIEW
INTEGRATION OF THE PROJECT TEAM IN THE CLASSIC MAINTENANCE CYCLE LUÍS CRUZ
maintenance policies may not be pragmatic. It is not very difficult in practice to develop
maintenance models where suitable data is available and adopted policies are realistic (Scarf,
1999) ie, the application of theoretical concepts to the industrial reality is not always easy as
result oftentimes of the lack of necessary information and the incompatibility of the
production scheduling with the practical application of the theoretical model.
2.3.1. Subjective Approach
This approach is useful in situations where objective data is not available or difficult to obtain.
The validity of such approaches is always debatable as it is based on expert opinion, which may
be influenced by current maintenance practice rather than being based on the understanding
of the current maintenance process. Various models have been proposed that incorporate
expert judgment to determine maintenance policies. Scarf (1999) has developed a model that
uses subjective data but works like a quantitative model. The model developed in this thesis
also employs a similar technique. An integrated approach to maintenance modelling involves
the following steps:
I) Problem recognition;
II) Design of data collection;
III) Design of systems for future data collection;
IV) Effective (mathematical) modelling using data collected;
V) Comparison with competitive techniques;
VI) Formulation of revised maintenance policy;
VII) Imparting ownership of models and policy on maintenance managers;
VIII) Economic considerations of new policy;
The author advocates that through such a comprehensive approach, mathematical modelling
can be considered successful from a scientific (i.e., modelling) point of view.

LITERATURE REVIEW 17
INTEGRATION OF THE PROJECT TEAM IN THE CLASSIC MAINTENANCE CYCLE LUÍS CRUZ
2.3.2. Maintenance Based on the Operational Status of the Equipment
Recently, condition monitoring techniques are being adopted by many practitioners (Scarf,
1997).
The competitive market conditions have forced plant management to reduce downtime for
routine preventive maintenance. In such cases, the maintenance department inspects the
condition of all parts that are due for replacement. If the condition-related variable is below a
pre-set (critical) value (which is determined by subjective opinion), then the component is
replaced, else it is allowed to operate. Thus, a routine preventive maintenance shut down can
be avoided. This also has a psychological effect on the people working in the plant, who would,
otherwise, feel uncertain about the state of the plant.
This technique requires a database of all the components replaced on all the machines and
their pre-set value. Also a systematic plan must be developed to check and recheck regularly if
the state of any component has crossed its pre-set value (beyond safe usage conditions). This
would increase the maintenance cost. The fundamental question for condition monitoring of a
particular component should be whether this approach will reduce costs in the long run by
giving a policy very close to the true optimal one. Since condition-based maintenance helps
use all the components for a longer period than fixed maintenance policy, lesser replacements
would be required reducing the long-term maintenance costs.
2.3.3. Dynamic Systems for Scheduling Maintenance (Model)
Coyle and Gardiner (1991) have proposed a discrete (integer) system dynamics model of
maintenance schedules for submarine operations.
System dynamics models are usually continuous models but the authors have developed a
discrete model since the ships are discrete objects. The model addresses the issues of fleet
availability and usage during the service life of a submarine. The model computes the number
of submarines to be commissioned so that the minimum number of submarines is in service.
The feedback system used for the model captures how a force of a given size is likely to meet
its operational needs and what policies might guide decision makers to cope with difficulties as

18 LITERATURE REVIEW
INTEGRATION OF THE PROJECT TEAM IN THE CLASSIC MAINTENANCE CYCLE LUÍS CRUZ
and when they arise. The model considers three types of decisions: short term, medium term
and long term decisions. The discrepancy between the operational needs (goal) and current
availability is used to drive the model decisions.
The short-term decisions deal with the number of submarines in operations, the medium term
decisions deal with the maintenance program while the long-term decisions deal with the
construction of submarines.
This thesis considers the cumulative opportunity loss per unit time as discrepancy (deviation
from the goal) and this variable is used to drive the model, i.e., to determine maintenance
policy. The main objective is to minimize life-cycle cost, subjected to mission readiness. The
main objective may also be to minimize opportunity loss.
2.3.4. General Failure and Maintenance Policies (Model)
Beichelt (1992) has presented a general model for a system. Any system has two types of
failures: type 1, that can be removed by minimal repairs and type 2, which can be removed by
replacements. Beichelt (1992) has considered both failure types. Minimal repairs do not alter
the failure rate (memory less), but put the system back in operation. In case of replacements,
the failure rate is altered. Beichelt’s model has been solved for various policies mentioned
below:
1. The system is maintained according to the failure type. In this policy, the cycle length
(i.e. the time between successive replacements) is random and the expected number
of type 1 failures is computed. This is the simplest of all policies;
2. The system is replaced at system age 't';
3. The system is replaced after n-1 minimal repairs, i.e., at the n failure;
4. On failure, the system is replaced if the random repair cost exceeds a given repair cost
limit;
5. In policy 4, in addition, there is a preventive replacement made at system age ’t’.

LITERATURE REVIEW 19
INTEGRATION OF THE PROJECT TEAM IN THE CLASSIC MAINTENANCE CYCLE LUÍS CRUZ
2.3.5. Gama Approach for Maintenance Scheduling System
Park (1975) has developed a gamma approximation model to determine the minimum cost of
preventive maintenance schedules when accurate failure data is not available except the mean
and the mode of component lifetime. This model is particularly useful since it is usually difficult
to get main data on maintenance, i.e., data on the components lifetimes, probability
distribution of lifetime, etc. From historical accounting data, we can calculate the average cost
of scheduled preventive maintenance and the average cost of breakdowns, including costs of
downtime and possible lost sales, idle direct and indirect labour, delays in dependent
processes, increased scrap and cost of repairs.
When accurate data is not available, a Gamma distribution is considered to be useful since it
only requires estimates of average and most likely (or mode) component lifetimes to describe
the specific failure distribution. Also in case of the Gamma distribution, it captures increasing
failure rates, which has been observed to be the case with most components.
This model has been shown to be robust against underlying lifetime distributions, i.e., with
other distributions like the Weibull, and with respect to errors in estimating the mean and
modal lifetime values.
Ntuen (1984) has also used a truncated gamma failure distribution. His hypothesis model is
that an optimal maintenance policy should balance the failure cost of a system during
operation against the cost of planned maintenance.
2.3.6. Simulation and Economic Analysis for the Selection of the Moment for
Corrective Maintenance
Sheu and Krajewski (1994) have developed a decision making approach for corrective
maintenance management. It consists of a simulation and is complemented by an economic
analysis. The simulation model predicts the inventory costs and effectiveness of a corrective
maintenance policy. The simulation results feed into an economic analysis, comprising a Net
Present Worth (NPW) and breakeven analysis model that determines the economic worth of
various maintenance policies. The authors have presented an example to evaluate the options
of machine redundancy and worker flexibility. Machine redundancy refers to the use of

20 LITERATURE REVIEW
INTEGRATION OF THE PROJECT TEAM IN THE CLASSIC MAINTENANCE CYCLE LUÍS CRUZ
standby machine or extra capacity in some other machine while worker flexibility refers to the
number of operations each worker can perform. The benefits of worker flexibility include the
use of cross trained workers that release the load at bottlenecks during machine breakdowns.
The two forms of redundancy mentioned above need not be mutually exclusive, i.e., a
combination of the two may be preferred. To analyse the economic worth of maintenance
policies, the model requires information on:
a) The manufacturing performance of alternative maintenance policies regarding
customer service (backlogs) and inventory cost that can be provided by a simulation
model;
b) The costs of implementing each maintenance policy, e.g., the cost of cross training
workers and the capital cost of machine redundancy. This information is then used to
perform NPW calculations and breakeven analyses for the various maintenance
options. In the given example, the author has carried out breakeven analyses to
determine the effect of certain variables like the cost of capital and training costs. The
model provides useful information for a manager in determining an effective
maintenance schedule. The comparison of various maintenance policies is analogous
to that of comparing project alternatives. According to the authors, the above model
can be extended to preventive maintenance policy making. The research methodology
of this thesis uses life-cycle cost along with opportunity loss as the metrics that
determine optimum maintenance policy for a system. This model uses NPW and
breakeven analysis for the same purpose. In the future, it may be worth using other
metrics like a cost-benefit ratio to determine optimal preventive maintenance policies.
2.3.7. Other Models
Various other models have been developed using techniques like linear programming, non-
linear programming, dynamic programming, mixed integer programming, decision theory,
search techniques and heuristic approaches (Sherif, 1981). The following models are briefly
described in this section to give to the reader information about other techniques used for
maintenance modelling.
Hariga (1996) has developed a general model to determine a periodic inspection schedule as
part of a preventive maintenance policy for a single machine subject to random failure.

LITERATURE REVIEW 21
INTEGRATION OF THE PROJECT TEAM IN THE CLASSIC MAINTENANCE CYCLE LUÍS CRUZ
The problem has been formulated as a profit maximization model with a general failure time
distribution. A heuristic approach has been developed to obtain an approximate inspection
schedule, when the failure times are exponentially distributed.
Menipaz (1974) introduced the concept of a discounting factor to bring all future cash
expenses to time, t = 0. The objective function considered is the expected cost per cycle when
some or all cost components are variables and a discount rate is assumed. The objective
function is solved using a differentiation method and a dynamic programming approach.
Zuckerman (1986) developed a stochastic model to determine the optimal maintenance
schedule under the following criteria: long run average cost and total expected discounted cost
over an infinite horizon. The system is subject to shocks causing a random amount of damage
to the system components. The research methodology uses the average opportunity loss as a
driver to determine the maintenance policy.
Inozu and Karabakal (1994) have formulated a model that is marine industry specific.
According to the authors, the maintenance schedule in the marine industry is very complicated
owing to conflicting objectives. Here a new approach to perform group (multi-item)
replacement has been proposed under budget constraints (capital rationing). It considers all
replacement decisions of an entire ship fleet (or all component replacements for a single ship)
simultaneously. The problem has been formulated as an integer linear program.
A Lagrangian methodology for the replacement problem is also presented. This has been
introduced to find the dual of one of the constraints, namely, the capital rationing constraints,
and incorporate it into the objective function in order to solve the integer program easily.
Sim and Endrenyi (Sim, 1988) have developed a minimal preventive maintenance model for
repairable, continuously operating devices whose conditions deteriorate with time in service.
This model is useful for devices like coal pulverisers, circuit breakers and transformers. The
preventive maintenance times are assumed to have an Erlang distribution while the failures
are Poisson distributed. Deterioration failures have been considered in the model. The
objective function used by the model is to minimize the system unavailability.
Sherif (1982) has developed an optimal maintenance model for life-cycle costing analysis that
determines a schedule that minimizes the system's future total expected maintenance cost.
This may be added to other costs like acquisition, salvage and operation costs to obtain the
life-cycle cost. The equations for optimal maintenance schedule and minimum expected future

22 LITERATURE REVIEW
INTEGRATION OF THE PROJECT TEAM IN THE CLASSIC MAINTENANCE CYCLE LUÍS CRUZ
cost of the system, developed in the model, are solved recursively using dynamic programming
principles.
2.3.8. Distribution for the Time Spent on Maintenance Operations
The normal distribution applies to relatively straightforward maintenance tasks and repair
actions. The log-normal distribution applies to more sophisticated tasks where times and
frequencies vary. Exponential and Poisson distributions apply to electronic components with
sudden failures (Hoopes, 2003).
2.3.9. Metrics used in Maintenance
As the adage goes, you cannot improve a process without first measuring its performance (Bill
Gates, 2014). But what are the most important maintenance metrics or Key Performance
Indicators (KPI) you should measure?
By definition (Significados.com, 2015), KPIs facilitate the vision and mission of a particular
company transmission process to the employees who do not occupy high positions. In this
way, all employees of various hierarchical levels are involved in the mission to achieve the
strategic targets set by the company. A key performance indicator serves as a communication
vehicle, ensuring that employees understand how their jobs are important to the success or
lack of success of the organization.
In the business world, the KPIs are quantifiable measures used to understand whether the
company’s objectives are being met. Consequently, these indicators determine whether to
take different attitudes to improve current results. Performance key indicators should only be
changed if the primary objectives of a company also undergo change.
Establishing a baseline for success should be the first step whenever you set out to improve
something. Bill Gates (2014) draws the example of the steam engine – one of the biggest
advancements in the industrial age, as being a product of incremental design changes and
precise feedback. “Without measurement,” writes William Rosen, invention is “doomed to be
rare and erratic”.

LITERATURE REVIEW 23
INTEGRATION OF THE PROJECT TEAM IN THE CLASSIC MAINTENANCE CYCLE LUÍS CRUZ
With the steam engine, the criterion is fairly straightforward. A superior design would have
some combination of being lighter, more powerful, more fuel efficient, cheaper to construct,
etc.
The same is true for maintenance metrics and there is a wealth of performance indicators that
can be used to measure and improve performance. For example (Figure 5):
Figure 5 - Maintenance metrics example (http://www.mbaskool.com)
Minimizing downtime might seem like a worthy goal, but not if it also has a negative impact on
product quality and employee morale, otherwise, it jeopardizes a longer term strategy of
increasing the proportion of preventive/reactive maintenance. When optimizing the
department, there are dozens of confounding factors to be considered. The struggle then
becomes which maintenance metrics to focus on.
The balanced scorecard approach was first introduced in the early 1990’s and encouraged
managers to track performance using a variety of metrics. The central idea is to avoid
optimizing one area at the expense of another. Increasing machine availability by stocking an
excessive number of spare parts - OEE improves, but inventory costs skyrocket as well. The
age-old practice of measuring performance based solely on financial indicators alone has been
found to be inadequate and missing the whole picture. Hence, a new school of thought has
emerged that reconciles high-level financial measures with more practical day-to-day
indicators.
Balanced scorecards (Figure 6) provide a clear and effective approach to capturing a high-level
view of the organization.

24 LITERATURE REVIEW
INTEGRATION OF THE PROJECT TEAM IN THE CLASSIC MAINTENANCE CYCLE LUÍS CRUZ
Figure 6 - Balanced score card example (http://www.mbaskool.com)
*Cost/unit should be defined based on the organization specifics. Generally speaking, it will include some
combination of labour, spare parts, overtime, contract labour, utilities, insurance, etc.
**OEE: Operational Equipment Effectiveness = (Availability)*(Performance)*(Quality)
This holistic approach to maintenance brings the organization one step closer to integrating
maintenance with other high-level goals, and promotes the idea that maintenance should be
viewed as an input to production instead of a necessary waste.
2.4. Lifecycle Cost Concept
The life-cycle cost (also referred to as "ownership cost") may be defined as the total cost of a
system or product to be incurred over its anticipated useful life in research and development,
construction, production, operation, maintenance and support, retirement and disposal. It is
the total cost of a system ownership. This is not a new concept, but it is an updated version of
the capitalized cost analysis that uses Nissan Production Way (NPW) to evaluate a system
(Ntuen, 1984). Lifecycle Cost Concept (LCC) problems are quite complicated and hence can be
considered as a computational technique for studying design and operational alternatives
(Ntuen, 1984). In general, LCC is the sum of acquisition cost (which is the sum of purchase,
Research and development (R&D), commissioning costs), the present worth of annual

LITERATURE REVIEW 25
INTEGRATION OF THE PROJECT TEAM IN THE CLASSIC MAINTENANCE CYCLE LUÍS CRUZ
maintenance cost over the intended period of service, the disposal cost and all the other costs
expected to be incurred discounted to the present time.
The life cycle cost is considered during the analysis of alternatives (AoA) since decisions made
early in the system life cycle have significant cost impact downstream, i.e., in the future. There
is a need to extend planning and decision-making to address system requirements from a total
life-cycle perspective.
The use of the LCC can influence system design and assist in producing low cost systems. For
existing systems, it can form the basis of a continuous improvement process. In both cases, the
LCC creates awareness among the designers to produce an effective system with not only a
low acquisition cost but also low operation, support and disposal costs. LCC models vary in
scope and form.
There is no standard LCC model. Most of the models developed are case-specific rather than
universal (Sherif, 1982). From a management standpoint, LCC is an integral part of the ultimate
goal to achieve desired system performance (and readiness) at an affordable cost. The desired
level may be subjective or objective. In the model developed in the next chapter, the life-cycle
cost is calculated to determine the effectiveness of various maintenance policies.
2.4.1. First Steps in the Lifecycle Cost Analysis
The basic steps involving a lifecycle cost analysis are:
1. Describe the system configuration being evaluated in functional terms and identify the
appropriate technical performance measures or applicable "metrics" for the system;
2. Describe the system life cycle and identify the major activities in each phase as
applicable (e.g., system design and development, construction/ production, utilization,
maintenance and support, retirement/ disposal);
3. Develop a work breakdown structure (WBS) or cost breakdown structure (CBS),
covering all activities and work packages throughout the life cycle. The work
breakdown structure involves a breakdown of all the necessary activities involved
throughout the life-cycle. Cost breakdown structure involves the following:
(i) Includes all costs direct, indirect, supplier, consumer, contractor, etc.;
26 LITERATURE REVIEW
INTEGRATION OF THE PROJECT TEAM IN THE CLASSIC MAINTENANCE CYCLE LUÍS CRUZ
(ii) Provides insight to management regarding design and decision making;
(iii) A structure for initial cost allocation and the subsequent collection and
summarization of costs;
(iv) Complete description of cost categories, cost determination methods and cost
input factors;
(v) A functional breakdown of costs (i.e., costs of R&D, production, operations and
disposal).
The cost breakdown structure must be tailored for each system application.
4. Estimate the appropriate costs for each category in the cost or work breakdown
structure, using activity-based costing (ABC) methods (Canada, 1996), or the
equivalent. Activity-based costing gives a more accurate cost since it does not
apportion the overhead on a company-wide basis, instead activity costs are directly
linked to the product or system that causes it;
5. Develop a model to facilitate the life-cycle cost analysis process. Considering the
complexities involved, it may be advisable to develop a computer-based model;
6. Develop a cost profile for the "baseline" system configuration being evaluated. The
initial cost estimated becomes the baseline and other configurations are compared to
this baseline;
7. Develop a cost summary, identifying the high cost contributors (i.e. high-cost
"drivers");
8. Determine the "cause-and-effect" relationships and identify the causes for the high
cost areas;
9. Perform a sensitivity analysis to determine the effects of input factors on the results,
and identify the high-risk areas or areas that could lead to substantial increases in cost;
10. Draw a Pareto diagram, which is a non-increasing order of the relative importance
ranking for major problem areas. Rank the high-cost areas in terms of their relative
importance that require immediate management attention;

LITERATURE REVIEW 27
INTEGRATION OF THE PROJECT TEAM IN THE CLASSIC MAINTENANCE CYCLE LUÍS CRUZ
11. Identify feasible alternatives (potential areas for improvement), perform a life-cycle
cost profile (graph of annual cost) for each, and carry out a breakeven analysis showing
the point in time when a given alternative assumes a point of preference;
12. Recommend a preferred approach and develop a plan for system modification and
improvement (equipment or software or process). This constitutes an on-going
iterative approach for continuous process improvement.
The model developed in this thesis involves steps 1 through 5. The steps 6 through 12 are also
essential and may be used in conjunction with the model by the decision-maker.
2.4.2. Lifecycle Cost Analisys Aplication
Applications of the life-cycle cost concept has taken place in various areas like evaluating
alternative supplier proposals, design configurations, production profiles, logistics and
maintenance support policies, identification of high-risk contributors (issues that are expected
to have a significant effect on the life-cycle cost of the system), long-range budgeting and
allocation of resources, project management and control, and replacement policies of existing
systems.
In the “alternatives identification” stage, LCC may be used to compare alternatives using
simple parametric Cost Estimating Relationships (CER). After selecting a particular
configuration or system, design trade-offs may be evaluated based on LCC calculations.
After construction of the system, LCC may be used for engineering change evaluations using
more detailed analytical CERs.
When the concept of LCC is applied to new systems, then it could influence design for lower
life-cycle cost. When it is applied to existing systems, then it could be used to assist the
"continuous improvement process" to lower life-cycle cost, and redesign of costly items,
policies and other tactical decisions.
2.4.3. Benefits of Lifecycle Cost Analisys

28 LITERATURE REVIEW
INTEGRATION OF THE PROJECT TEAM IN THE CLASSIC MAINTENANCE CYCLE LUÍS CRUZ
There are various benefits life-cycle costing (Ntuen, 1984). Some of them are:
1. Fosters long-range considerations and helps avoid myopic or short-term decisions;
2. Necessitates total cost visibility;
3. Establishes relationships between different system components and elements of
cost;
4. Causes a reduction in risk by identifying potential "high-risk" areas;
5. Allows for better overall resource management;
As mentioned earlier, the research methodology of chapter 3 uses the life-cycle cost as a
metric, along with opportunity loss, to determine an optimum maintenance policy.
2.5. Maintenance Costs
Maintenance costs are, in most cases, taken by the various companies management groups as
those costs that, by not indicating direct incomes, as usually the most difficult to justify and, in
some cases, more difficult to ensure.
Hence, below are the definitions of the different maintenance costs associated, interpreted
according to a "theoretical" point of view and then compared with reality in an industrial
environment.
2.5.1. Preventive Maintenance Costs
Multi-objective preventive maintenance optimization models have been presented in several
papers. Kralj and Petrovic (1995) present a novel approach in preventive maintenance
scheduling of thermal generating systems. The authors developed a large-scale multi-objective
combinatorial optimization model with three objective functions and a set of constraints. They
consider minimization of total fuel costs, maximization of reliability in terms of expected
unnerved energy and minimization of technological concerns as the objective functions. In
addition, they defined maintenance duration, maintenance continuity, maintenance season,
LITERATURE REVIEW 29
INTEGRATION OF THE PROJECT TEAM IN THE CLASSIC MAINTENANCE CYCLE LUÍS CRUZ
maintenance sequences of same class thermal units, limitation on thermal units’ simultaneous
maintenance, and limitation on total capacity on maintenance due to labor and resources as
the constraints. They developed a multi-objective preventive maintenance scheduling software
based on a multi-objective branch and bound algorithm implemented in FORTRAN. Finally, the
researchers apply their methodology to a real system of eight power plants with twenty one
thermal units and eleven maintenance classes over thirty three weeks as the planning horizon.
Chareonsuk et al (1997) developed a multi-criteria preventive maintenance optimization
model to find the optimal preventive maintenance intervals of components in a production
system. In this study, the authors consider an age-based failure rate for components by fitting
a Weibull distribution to the data and define expected total cost per unit time and the
reliability of the production system as the main criteria. Following, they utilized a preference
ranking organization method for enrichment evaluations (PROMETHEE) as the solution
approach and defined the alternative decisions as the preventive maintenance intervals. By
using this approach, they can aggregate preferences of alternatives by combining the weighted
values for the preference functions of the criteria complete set. As a case study, they apply
their methodology in a paper factory and used PROMCALC as the optimization software.
Finally, they mention the advantage of their approach in which decision makers and managers
can input various criteria into the model and do sensitivity analysis on the optimal solutions.
Konak (2006) presented a comprehensive study on multi-objective genetic algorithms and
their applications in reliability optimization problems. They review fifty five research papers
and talks about the recent techniques and methodologies.
Quan (2007) developed a novel multi-objective genetic algorithm in order to optimize
seventeen preventive maintenance schedule problems. They defined the problem as a multi-
objective optimization problem by considering the minimization of workforce idle time and the
minimization of maintenance time and mention that there is a trade-off between the objective
functions. As the solution procedure, they used utility theory instead of dominance-based
Pareto search to determine the non-inferior solutions and show the advantage of this method
via numerical example.
Taboada (2008) present a recent study in this area. They developed a multi-objective genetic
algorithm in order to solve multi-state reliability design problems. The authors utilized the
universal moment generating function to measure the reliability and availability criteria in the
system. They applied their approach into two examples; the first one is a system of five units

30 LITERATURE REVIEW
INTEGRATION OF THE PROJECT TEAM IN THE CLASSIC MAINTENANCE CYCLE LUÍS CRUZ
connected in series in which each component has two states, functioning properly, or failure
and the second one is a system of three units connected in series. In this system, each
component has multi-states with different levels of performance, which range from maximum
capacity to total failure. They utilized MATLAB as the programming environment, and shown
the effectiveness of their approach in terms of computational times and obtained non-inferior
solutions.
All of this approaches resulted in substantial reductions concerning Maintenance Costs.
Despite the different theoretical basis, the survey of all the factors, their study and application
in a concerted way resulted on the knowledge and quantification thereof upon failure analysis
and consequently the anticipation of possible unnecessary costs.
2.5.1.1. Failure Costs
When a failure incident occurs there is a consequent loss of profits (Sondalini, 2006).
The cost of failure includes lost profit, the repair cost, the fixed and variable operating costs
wasted during the downtime and a myriad of consequent costs that reverberate and surge
through the business. These are all paid by the organization and seen as poor financial
performance.
The costs of failure cannot be escaped and are counted in millions of euro of lost profit per
year. Total defect and failure true costs are not normally recognized by managers, yet they can
send businesses bankrupt. In the instance of a failure all its costs and losses are automatically
incurred on the business. These costs can only be prevented by precluding the failure in the
first place.
Every business has fixed costs (Figure 7) that it must carry on regardless of how much it
produces. These include the cost of building rent, the manager's salary, the permanent staff
and employees' wages, insurances, equipment leases, etc. There are variable costs as well,
such as fuel, power, hire labour, raw materials to make product, etc.

LITERATURE REVIEW 31
INTEGRATION OF THE PROJECT TEAM IN THE CLASSIC MAINTENANCE CYCLE LUÍS CRUZ
Figure 7 - Usual business operation (www.bin95.com)
We can take the same analogy of normal business operation down to normal equipment
operation. When plant and equipment are running each item has a fixed cost, a variable cost
and generates a contribution to the overall business profit. It is reasonable to look at every
machine and item of plant in your operation as contributing their share to the total profit of
the business - their 'profit contribution'. When one of these items cannot be used for
production it cannot contribute to profit. If the reason of the non-operation is because it has
failed, then it is not contributing to profit performance and it also imposes added costs on the
business (Figure 8).

32 LITERATURE REVIEW
INTEGRATION OF THE PROJECT TEAM IN THE CLASSIC MAINTENANCE CYCLE LUÍS CRUZ
Figure 8 - Effects on costs and profit of a failure incidente (www.bin95.com)
When a failure happens, many people suddenly get involved in solving it. Meetings are held,
overtime is worked, subcontractors are brought-in, engineers investigate and parts and spares
are purchased to get back in operation. Instead of the variable costs being a proportion of
production, as intended, they rise and take on a life of their own in response to the failure. The
losses grow up proportionally bigger the longer the repair takes or the greater the
consequences of the failure exist.
The costs keep on growing, more and more people throughout the company waste time
because of the failure, during larger periods of time.
The company pays for all of it from its profits, which is then reflected in poor financial
performance. The reactive costs and the resulting wastes start immediately upon failure and
continue until the last cent is paid on the final invoice.
2.5.1.2. Maintenance Costs
One universal measurement of maintenance performance, and perhaps the measure that
matters most in the end, is the cost of maintenance. Regrettably maintenance costs are often
used to compare maintenance performance between companies or between plants within the
same company (Idcon, 2015).

LITERATURE REVIEW 33
INTEGRATION OF THE PROJECT TEAM IN THE CLASSIC MAINTENANCE CYCLE LUÍS CRUZ
Equally unfortunately, there is no standard for measuring maintenance costs. Each company,
usually each plant within a company and often each department within a plant develop their
own definition of "maintenance costs."
For this reason, maintenance cost comparisons should always be accompanied by a clear
definition of what is included and excluded for each plant contained in the comparison, for
which, one can find the figure show bellow very helpful (Figure 9):
Figure 9 - Maintenance cost comparison table example (http://www.mbaskool.com).
Once again, in a “practical” point of view, these costs are analysed by comparing the effective
cost in maintaining equipment with its real participation in the final production level. Using
Continental company as an example, a cost (whatever that may be: scrap, maintenance, etc.) is
always compared according with the daily global tire production.
34 LITERATURE REVIEW
INTEGRATION OF THE PROJECT TEAM IN THE CLASSIC MAINTENANCE CYCLE LUÍS CRUZ
2.5.1.3. Replacement Costs
Using Continental as an example, we can conclude that the cost of replacing equipment is
always analysed by the needed time for start providing the expected revenues.
Thus, sometimes, some particular equipment has to be replaced for safety or ergonomic
issues, those are the only situations when the replacement of equipment is not analysed or
decided purely by the financial way.
2.5.1.4. Overhead Costs
For a multi-component system, and the cost structure defined above, the problem can be
solved as a problem of finding the optimal sequence of maintenance, replacement, or do-
nothing actions for each component, independent of all other components. Thus, one could
simply find the best sequence of actions for component 1 regardless the actions taken to
component 2 and so on. This would result in N independent optimization problems. Such
model seems unrealistic, as there should be some overall system cost penalty when an action
is taken on any component in the system. It would seem that there should be some logical
advantage to combining maintenance and replacement actions, e.g., while the system is shut
down to replace one component, it may make sense to go ahead and perform
maintenance/replacement of some other component, even if it is not at its individual optimum
point where maintenance or replacement would ordinarily be performed.
Under this scenario, the optimal time to perform maintenance/replacement actions on
individual components is dependent upon the decision made for other components. As such, it
was proposed that a fixed cost of “downtime” should be charged in period if any component
(one or more) is maintained or replaced in that period.
Consideration of this fixed cost makes the problem much more interesting, and more difficult
to solve, as the optimal sequence of actions must be determined simultaneously for all
components.

LITERATURE REVIEW 35
INTEGRATION OF THE PROJECT TEAM IN THE CLASSIC MAINTENANCE CYCLE LUÍS CRUZ
2.5.1.5. Total Costs
According to Reibstein (2010) in economics and cost accounting, Total Cost (TC) describes the
total economic cost of production and is made up of variable costs according to the quantity of
a good produced and include inputs such as labour and raw materials, plus fixed costs, which
are independent of the good quantity produced and include inputs (capital) that cannot be
varied in the short term, such as buildings and machinery.
Total cost in economics includes the total opportunity cost of each production factor as part of
its fixed or variable costs.
The rate at which total cost changes as the amount produced changes is called marginal cost.
This is also known as the marginal unit variable cost.
If one assumes that the unit variable cost is constant, as in cost-volume-profit analysis
developed and used in cost accounting by the accountants, then total cost is linear in volume,
and given by:
Total Cost = Fixed Costs + Unit Variable Cost x Amount (1)
Adapting this definition to Continental Mabor, is clear the direct association of some costs to
the equation represented above.
We can then consider as fixed maintenance costs the ones associated with employees
(maintenance teams) and components whose consumption we know in advance.
As variable costs we can consider the ones concerning overtime and material needed for
unplanned interventions/operations, tools (other than those of wear) and possible
subcontractors work.

36 LITERATURE REVIEW
INTEGRATION OF THE PROJECT TEAM IN THE CLASSIC MAINTENANCE CYCLE LUÍS CRUZ

DEVELOPMENT 37
INTEGRATION OF THE PROJECT TEAM IN THE CLASSIC MAINTENANCE CYCLE LUÍS CRUZ
3. Development
3.1. Objectives
The present work aims to demonstrate the importance and added value represented by the
integration of the "project team" figure in the already widely known maintenance process,
which included the Breakdown/Curative, Preventive and Predictive/Conditioned maintenance
teams. With this integration is aimed nothing more than to reduce the intervention cycle on a
machine from the time it is requested by an intervention for breakdown reasons but also, and
at the same time, ensure the installation of new equipments, support for day-to-day
production processes on equipment upgrade in the shop floor, to ensure new productive
processes and/or security updates and layout settings.
The main objective of this dissertation is therefore to confirm the relevance of such integration
in the final results of the Engineering Department in the lost times, maintenance costs and
OEE. In order to prove the effectiveness of this system, it will be described the intervention
carried out in a textile fabric cutting machine, which, by their design, age and rate of
utilization, was a real Achilles heel of the Department as a result of time lost through
malfunction and starting difficulties whenever there was a longer stop or after a few hours
break period for preventive maintenance. This equipment became a perfect example to
demonstrate the effectiveness of the theory proposed since, as a result of lost time and scrap
generated by failure, synchronization issues when running automatically and difficulty in
adapting to new processes and / or products, was the subject of many brainstorms developed
between engineering teams and other departments involved in the manufacture process,
culminating in certainty as to the need for concerted action conducted by the Projects team.
Thus, a specification was drawn up by the project team, perfectly integrated in the
maintenance process, after meeting with teams of Preventive, Curative and Production (in
order to address some difficulties in the processes, due to the equipment age and to ensure
some features perceived as necessary for the processing of materials that, in future, will enter
the production planning) the necessary work was put out to tender, awarded to a supplier,
executed, approved by quality and production and, currently, the indicators presented speak
for themselves.

38 DEVELOPMENT
INTEGRATION OF THE PROJECT TEAM IN THE CLASSIC MAINTENANCE CYCLE LUÍS CRUZ
3.2. Company Characterization
Continental Group
Continental was founded in Hanover, Germany, in October 1871.
Originally, the company was focused on manufacturing flexible rubber artifacts and solid tires
for carriages and bicycles. In 1898, it started to produce flat tires (no tread design) for
automobiles. Since then, it has followed the evolution operated in the automotive industry
with the application of techniques, products and equipment for the improvement of tires and
their manufacturing processes.
Your reputation goes beyond the Germany borders and Continental tires started to equip
winning cars in various car competitions.
With a highly diversified production, Continental AG Group has its sales volume centered on
tires of various sub-brands for passenger cars, light trucks, agricultural, industrial equipments
and motorcycle integrated into Tire Division.
The Group is also composed of the Systems Division for the Automotive Industry, which is part
of the braking systems manufacture, electronic components and systems for light and heavy
vehicles. This Division is responsible for developing of automotive systems such as Anti-lock
Braking Systems (ABS), Electronic Stability Control (ESP), Traction Control Systems (TCS),
Electronic Suspension Systems (EES), among others.
ContiTech is another division of the Rubber Group which manufactures industrial products
based on rubber intended for mining industry, printing, furniture and machinery
manufacturing.
Continental, with its estimated 150.000.000 tires per year global production, is currently the
first tire producer in Germany, the second at European level and the fourth worldwide. One in
every four vehicles produced in Europe are equipped with Continental tires.

DEVELOPMENT 39
INTEGRATION OF THE PROJECT TEAM IN THE CLASSIC MAINTENANCE CYCLE LUÍS CRUZ
Continental AG has several tire plants as well as technology development centers and test
tracks spread across several continents (European, American, Asian and African), and consists
of a workforce of more than 170.000 employees around the world.
The Continental Group Worldwide
Currently, the Continental universe consists of 269 production units, research and
development in 46 countries spread over 5 business areas throughout the world.
Continental Group in Portugal
In Portugal, the Continental Corporation is made up of five companies: Continental Mabor,
Continental Pneus, Indústria Têxtil do Ave, Continental Teves and Continental Lemmerz.
Together, they represent a workforce of more than 2000 employees.
Continental Mabor, Indústria de Pneus S.A. (CMIP)
Foundation Year: 1989
Location: Lousado, V. N. Famalicão
Products: Passengers and Light Trucks Tires (PLT)
History: Resulted from the fusion between Mabor (Manufatura Nacional de Borracha, S.A.) and Continental Group.
Continental Pneus (Portugal) S.A. (CPP)
Foundation Year: 1992
Location: Lousado, V. N. Famalicão
Products: Marketing in Portugal, the tires produced by Continental AG History: This company was constituted through the acquisition of all shares of Scrimex (which owned the marketing exclusivity for Continental tires brand in Portugal). The ContiPneus integrated the transferred employees from Scrimex and also from Mabor and started selling Continental products, among others sells Continental, Semperit, Uniroyal and Mabor tires.
Figure 10 - Continental-Mabor plant
Figure 11 - Continental-Pneus facilities

40 DEVELOPMENT
INTEGRATION OF THE PROJECT TEAM IN THE CLASSIC MAINTENANCE CYCLE LUÍS CRUZ
Indústria Têxtil do Ave, S.A. (ITA)
Foundation Year: 1950
Location: Lousado, V. N. Famalicão
Products: Textile products for the rubber industry History: It belonged to the same group that held Mabor (Amorim Group). Became part of the Continental Group AG in 1993 .
Continental Lemmerz (Portugal) - Componentes para Automóveis, Lda. (CLCA)
Foundation Year: 1994
Location: Palmela, Setúbal
Products: Automotive Components
History: It was established as a "joint venture" with the purpose of ensuring the tire-wheel assemblies just-in-time to Auto-Europa Volkswagen plant. 51% of the Company’s capital is held by Continental Mabor and the remaining 49% by Schedl.
Continental Teves – Sistemas de Travagem, Lda.
Foundation Year: 1998
Location: Palmela, Setúbal
Products: Braking Systems
History: This plant manufactures and assembles brakes for major car manufacturers in Europe. Currently has an installed capacity of about 4 million brakes per year.
Figure 13 - Continental-Lemmerz plant
Figure 14 - Continental-Teves plant
Figure 12 - ITA plant

DEVELOPMENT 41
INTEGRATION OF THE PROJECT TEAM IN THE CLASSIC MAINTENANCE CYCLE LUÍS CRUZ
Continental Mabor
Figure 15 - Continental Mabor, plant global perspective
Location
Located at Famalicão (Figure 15) county southern end, Lousado has in Santo Tirso and the right
bank of Ave’s river its limits. Lousado's main economic activities are the general trade and
textile, tires, clothes manufacturing, metallurgy, aluminium and plastics transformation, as
well as small-scale farming.
History
The Continental Mabor was born in December 1989 (Figure 16). Its name comes from the
union of two renowned companies in the tire manufacture, Mabor, nationally, and Continental
AG. of a global dimension.
Figure 16 - Mabor old facilities
Mabor – Manufatura Nacional de Borracha, S.A., was the first tire factory in Portugal, having
begun working in 1946 under technical assistance of the General Tire C.ª, from Ohio, United
States of America (U.S.A.).

42 DEVELOPMENT
INTEGRATION OF THE PROJECT TEAM IN THE CLASSIC MAINTENANCE CYCLE LUÍS CRUZ
July 1990 saw the start of the major restructuring program that has transformed the old
Mabor facilities in the most modern of then 21 Continental units. Starting in 1990 with a daily
average production of 5.000 tires, in 1996 the 21.000 tires per day barrier have been broken, it
means that production level had quadrupled. Initially producing only the Mabor brand tires,
the range of the company is currently very varied either in articles, types or brands, comprising
Continental, Uniroyal (Europe), General Tire, Semperit, Gislaved, Viking, Mabor and Barum as
commercialized brands.
There is also the production of high tech tires like the ones specially developed for excellent
performance at high speeds, winter tires, and ecological tires - once they are developed in a
way that reduces the vehicle fuel consumption. Continental Mabor includes also in its portfolio
tires designed for SUV’s and recently started the 21 inches wheel tires production. It also
produces ContiSeal (anti-hole technology), ContiSilent (low noise levels) and just started with
the Ultra Ultra High Performance (UUHP) tires production.
More than 98% of its production is focused on external market, mainly, distributed by the
assembly lines of the most prestigious automotive manufacturers. The designated
“replacement market” correspond to 60% of Continental Mabor annual production.
Manufacturing Process
The Continental Mabor manufacturing process is divided into five main parts, assured by six
departments, which correspond to the different stages of the tires manufacturing processes.
Following, it will be provided some information about the activity of each department (Figure
17).
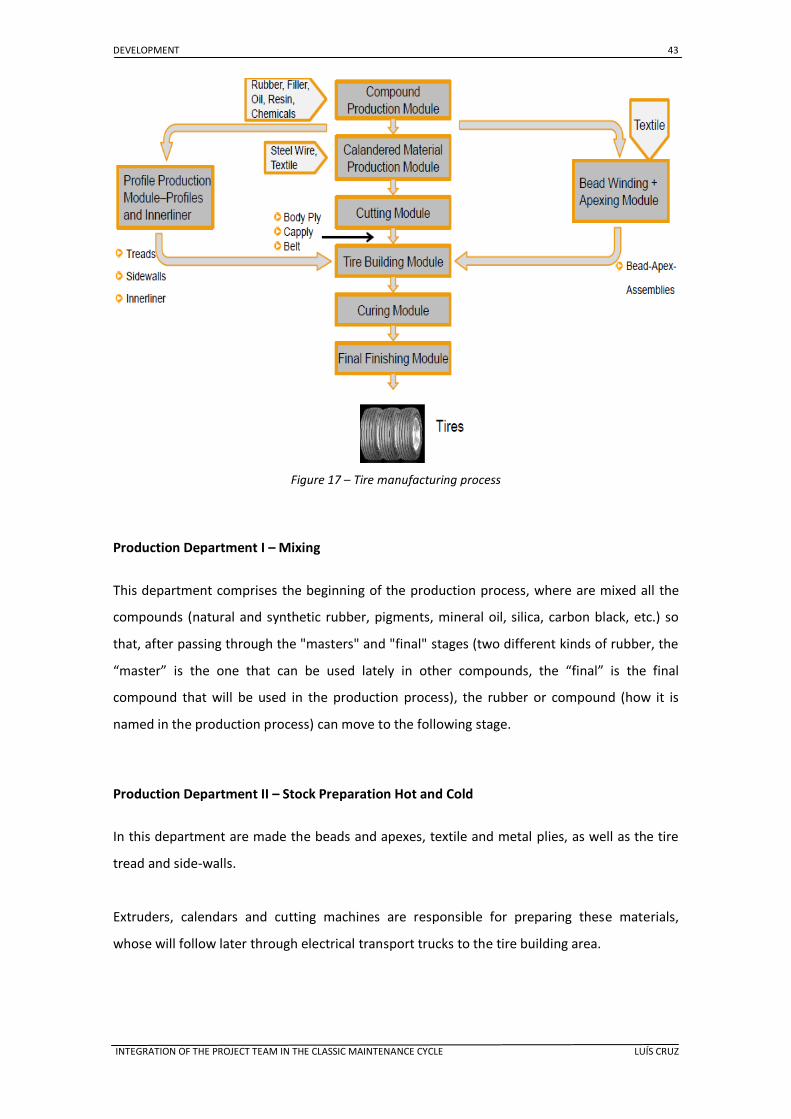
DEVELOPMENT 43
INTEGRATION OF THE PROJECT TEAM IN THE CLASSIC MAINTENANCE CYCLE LUÍS CRUZ
Figure 17 – Tire manufacturing process
Production Department I – Mixing
This department comprises the beginning of the production process, where are mixed all the
compounds (natural and synthetic rubber, pigments, mineral oil, silica, carbon black, etc.) so
that, after passing through the "masters" and "final" stages (two different kinds of rubber, the
“master” is the one that can be used lately in other compounds, the “final” is the final
compound that will be used in the production process), the rubber or compound (how it is
named in the production process) can move to the following stage.
Production Department II – Stock Preparation Hot and Cold
In this department are made the beads and apexes, textile and metal plies, as well as the tire
tread and side-walls.
Extruders, calendars and cutting machines are responsible for preparing these materials,
whose will follow later through electrical transport trucks to the tire building area.

44 DEVELOPMENT
INTEGRATION OF THE PROJECT TEAM IN THE CLASSIC MAINTENANCE CYCLE LUÍS CRUZ
Production Department III – Tire Building
All the manufactured products in the previous steps are here assembled, resulting in the
"green tire", also so-called pre-cured tire.
This assembly process is assured by the tire building modules, whose are constituted by two
elements / machines, the construction machine (KM) machine that builds the carcass, and the
Production Unit (PU) machine, responsible for the breaker assemble, tread and cap ply and
then, finally, the complete set with the carcass made in the KM.
Production Department IV – Curing
At this stage, the tire is submitted to a process of high pressure levels (16 bar) and
temperature (170°C) in the curing presses, where the mould will give the final appearance to
the tire.
Production Department V – Final Inspection
All checks are made to ensure the whole tire quality requirements. This inspection process
includes balancing and uniformity tests, X-Rays analysis and, finally, visual inspection done by
experienced operators. Please pay attention that 100% of Continental Mabor’s production is
inspected before storage in order to ensure top quality level to our final customers. After this
stage the tires follow to the finished product warehouse.
3.3. Evolution of the Maintenance Role in the Company
In a company as old as Continental Mabor, we can easily understand the changing role of
maintenance fairly clear, being, in this case, quite noticeably the two completely distinct areas,
Mabor and Continental Mabor.

DEVELOPMENT 45
INTEGRATION OF THE PROJECT TEAM IN THE CLASSIC MAINTENANCE CYCLE LUÍS CRUZ
Indeed, the inclusion of Mabor in the Continental group, among other issues, provided the
company with new approach methodologies and methods to production processes and, more
specifically, to the inherent maintenance processes.
The maintenance began to be seen as a need and assumed a key role in the constant demand
for increased production, quality and product wise complexity.
It was assumed the importance of an available and with high levels of productivity and
reliability industrial park, in order to achieve the proposed objectives regarding the company’s
core business, which is the tire manufacture in quantity, high quality level and under well
controlled technical specifications.
3.3.1. Past Maintenance Management System Characterization
Before the Mabor integration in the Continental group, maintenance was practically reduced
to Curative Maintenance, It means interventions in case of failure. Prevention was not a
priority and reduced itself to small and temporarily distributed actions, without any rigor in the
timely delivery of the concerned equipment’s.
The preventive measures were part of a small checklist which was not properly controlled.
There was no maintenance plans for each equipment individually and the maintenance actions
were not structured. The period assigned to the preventive maintenance was, mostly, a chance
to carry out cleaning and lubrication of the plant equipments.
Only since the mid-90s, with the development of a software called PEMS (Plant Engineering
Maintenance System) that, slowly, began the mentality changing work and paradigms raise
regarding this issue that, until then, was underappreciated, the preventive maintenance.
From then on, intervention plans began to be drowned up, data for further analysis were
introduced in dedicated software (PEMS – Plant Engineering Maintenance System) and, above
all, conclusions regarding actual or possible failures were reached based on facts.
This systematization was crucial to the development and subsequent growth of preventive
action, allowing the enforcement of machines shutdown for preventive maintenance based on

46 DEVELOPMENT
INTEGRATION OF THE PROJECT TEAM IN THE CLASSIC MAINTENANCE CYCLE LUÍS CRUZ
figures / real facts. This was undoubtedly a deciding factor in changing the preventive
maintenance role within the company.
3.3.2. Reasons that have led to a New Approach to Maintenance
The need to increase the production levels, the increasing complexity of the final product and
increased quality requirements during the manufacturing process and, ultimately, in the final
product, were in the last analysis, the key factors for the increasing demand in terms of the
industrial plant management.
The extension of the machines lifetime, continuous adaptation to new premises, the need for
reliability and productivity levels never seen before and which became mandatory in order to
assure a rapid integration into a multi-national group, all these aspects seemed impossible with
the “traditional” maintenance management used until then.
Regarding this goal, it was required the reorganization of the engineering department, its sub-
division into various departments specialized in support of the different production areas and,
most of all, a revolution was needed in terms of attitudes and methods, not only at the
engineering department level and their maintenance methods, but also in the production
department, with the internal acceptance of the fact that without the completion of a strict
maintenance plant, it is not possible ensure high levels of production stably .
Thus, before the integration in the Continental group, a maintenance system which
cornerstone was the curative maintenance prevailed, troubleshooting, reaction, where
prevention was limited only to carrying out cleaning and lubrication actions, the fulfilment of
small checklists that did not meet any timescale, i.e. machines were being delivered upon the
production department availability.
As the years went by and production capacity increased, this dysfunctional mind set has also
evolved, gradually growing to a planned and structured maintenance. This new concept has
been validated by the increasing availability levels of the equipment’s (OEE), by the decrease in
breakdown downtime and scrap levels generated by incompatibility and/or machine
malfunction, that is, all this new approach has been validated by the most important of all
indicators for a company, the production volume and financial profits.

DEVELOPMENT 47
INTEGRATION OF THE PROJECT TEAM IN THE CLASSIC MAINTENANCE CYCLE LUÍS CRUZ
3.3.3. Present Maintenance Management System
In broad terms, the Continental Mabor Engineering Department is divided into five separate
divisions (Figure 18) for the shop floor support but in unison regarding the application of good
practices and supporting the production department concerns.
Thus, and as we can see in the organizational chart of the Engineering Department, directly
linked to the industrial park we have:
Engineering 1 allocated to the Mixing department, Extrusion and Calendaring;
Engineering 2 responsible for Cold Preparation, Tire Building, Green Tire Transport
System and Spraying;
Engineering 3, responsible for Curing, Final Inspection and Conti Seal.
At the same time we also have the Infrastructure, Energy and the Expansion Projects Division,
as the names suggest, deal with matters related to building, water supply, electricity, steam
and HVAC (Heating, Ventilation and Air Conditioned), the last of which was recently created to
deal with successive expansion projects that have took place in the company and which, by
their complexity and need for detail, were consuming valuable and critical resources to other
divisions in the daily assistance to the manufacturing process.
Figure 18 - Engineering department organizational chart

48 DEVELOPMENT
INTEGRATION OF THE PROJECT TEAM IN THE CLASSIC MAINTENANCE CYCLE LUÍS CRUZ
As previously explained, the equipment used as an example in the argumentation of the
concept in study is a textile cutting equipment, being part of the Cold Preparation department
which, by itself, is under the Engineering 2 (Figure 19) support and control.
Figure 19 – Engineering II organizational chart
Just like the other Engineering Divisions, also this is divided into three teams, Planned
(responsible for the management of Predictive/Conditional and Preventive maintenance
teams), Curative maintenance and Projects teams.
3.3.4. Benefits and Limitations of the Current Maintenance Management System
At technical level, the maintenance system “on site” is reflected in numerous advantages,
among them the following ones:
Controlled Breakdown Time: the co-existence of multidisciplinary teams in the analysis
and resolution of day-to-day problems allows greater control of lost time due to
breakdown and hence the forecast of increasingly lower values for the future;
Root causes of the failures quickly and efficiently identified: the advantages listed in
the previous paragraph also mean that, on the occurrence of a malfunction, the
discussion among the different department teams can, quickly and effectively,
determine the root cause and quickly develop intervention or, at least, contingency
plans / actions;
Possibility for drawing up systematic action plans: action plans tailored to preventive
maintenance and project teams as well as procedures and best practices for teams of

DEVELOPMENT 49
INTEGRATION OF THE PROJECT TEAM IN THE CLASSIC MAINTENANCE CYCLE LUÍS CRUZ
curative maintenance are carried out in a systematic way and based on evidence
gathered on the shop floor;
Controlled Spare Parts Costs: by systematising to the most the interventions and
optimize the teams capacity in proper diagnosis and fault repair procedures, we
ensure a tight control in maintenance costs relatively to the spare parts;
Controlled spare parts inventory: the number of spares in stock is directly related to
the needs highlighted by the different teams, so the control carried out to the
breakdown / failures incurred and their root causes allow us to have an accurate and
updated idea, quickly and periodically, about the materials whose presence is required
in storage and, thereby, ensure storage of the least possible amount of obsolete and
unnecessary material;
Existing and updated breakdowns history: this is undoubtedly one of the greatest
advantages of the presented maintenance model, the ability in report and registers all
the breakdowns and interventions occurred in the shop floor. Here, the use of digital
platforms, such as the example the SAP management software that allows us to assign
each department their machines on an individual basis and at the same machines, the
different systems / circuits and components, all of them properly referenced and
quoted;
Effective and multi-purpose maintenance teams: the segmentation of the Engineering
Department in support divisions to the different stages of the process allows a greater
team specialization, translating into a fast breakdown diagnosis and solution, as well as
the development of Planned Maintenance, with high levels of effectiveness.
These benefits or capital gains are reflected, in terms of output, in high levels of production
and equipment availability (OEE) and, regarding the final product, reference quality levels
within the Continental group. As limitations, it could be referred the lack of operational
resources to analyse and transform into actions all the information collected through the
intervention of the whole teams in the field, which can be a problem.
As a solution, it would be necessary to have a structure at the human resources level, which by
itself would make its implementation difficult due to the higher costs involved, ie, the gains
obtained through the use of this model could be overshadowed by the cost associated with its
own structure. This can be, probably, the subject of study for another thesis.

50 DEVELOPMENT
INTEGRATION OF THE PROJECT TEAM IN THE CLASSIC MAINTENANCE CYCLE LUÍS CRUZ
3.4. Case Study
Inserted in the Cold Preparation department, the textile cutter machine #2 was, until the
major upgrade, a hybrid in the sense that it was composed of two areas from the responsibility
of two different suppliers, which in turn, implemented distinct software and control systems.
Essentially, this machine processes the calendared textile as follows:
1. The calendared textile roll, impregnated with rubber in the calendar, is placed in the
textile cutter let-off;
2. The textile is then transported through a buffer and feeding conveyor until the cutting
blade;
3. In the cutting blade (guillotine or roller blade), the fabric will be cut in straps with the
needed width regarding the article (tire) specification. Here ends the cutting area;
4. Then, already in the tire construction zone, the cut straps are joined in the stitching
area, forming a continuous line;
5. Finally, this continuous line is winded up with a pre-defined length in a cassette that,
later on in the production process, will feed the Tire Building Machines (TBM) for the
carcass construction.
Thus, the machine wherein the cutting area (let-off, feeding conveyor and guillotine) was a
Fischer product (Karl Eugen Fischer GmbH - Maschinenfabrik) equipped with Siemens S5
control, as opposed to the construction zone (suction bar, splicing table and wind-up), supplied
by Conti Machinery (CM) with Beckhoff control.
This condition resulted in a huge problem due to the time lost in fault diagnosis and resolution,
set-ups and start-ups after prolonged maintenance or breakdown stoppage concerns. It was
clear the incompatibility of the two control systems when adapted to the same equipment and
needing to work together. Thereby, it was decided by the perennial need to carry out an
upgrade in order to simultaneously standardize the amend type control, other malfunction
source previously identified by Preventive and Curative maintenance teams, and adjust as
much as possible the capacity / output to the new production requirements.

DEVELOPMENT 51
INTEGRATION OF THE PROJECT TEAM IN THE CLASSIC MAINTENANCE CYCLE LUÍS CRUZ
3.4.1. Description of the initial situation
Originally, as already explained, the device under study was, in practical terms, divided into
two devices (Figure 20).
Figure 20 - Textile Cutter Top Illustration (before upgrade)
Note also the difficulties felt whenever the need arose to perform the machine start up after a
prolonged maintenance or production stop period, or even for different article manufacturing
set-up elaboration.
Such difficulties were reflected obviously in production lost time and scrap generated with set-
ups and machine breakdown.
At mechanical level, apart from the heavy structure and difficult access to consumable and / or
replaceable components, the machine original design presupposes the existence of an huge
steel structure supporting the material feeding system from the buffer to the cutter. This
delivery was assured by a system consisting in a suction bar with servo-powered movement
that fixed and moved the textile fabric together with the conveyor (Figure 21).

52 DEVELOPMENT
INTEGRATION OF THE PROJECT TEAM IN THE CLASSIC MAINTENANCE CYCLE LUÍS CRUZ
Figure 21 - Textile Cutter Side Illustration (before upgrade)
The reference for this axial movement is often lost by the system, something which required a
total axes referencing and that, as a result of Siemens S5 control system associated to a
completely outdated command cards, quickly became a painful and with heavy consequences
in the maintenance indicators and production schedule.
Regarding this issue, adds still the urgent need to replace the let-off buffer responsible for the
material accumulation in order to assure the continuous feeding to the cutter, since it is a
structure which, as a result of age and use, indicated severe signs of wear with diminished
adjustment possibilities that, in some components, did not exist. This was an inevitable source
of the misalignment before the cutting conveyor entrance and, therefore, of the wrinkle that
therein was formed in the handling of some materials which would eventually culminate in
widths cutting differences beyond the specified tolerances, or scrap.
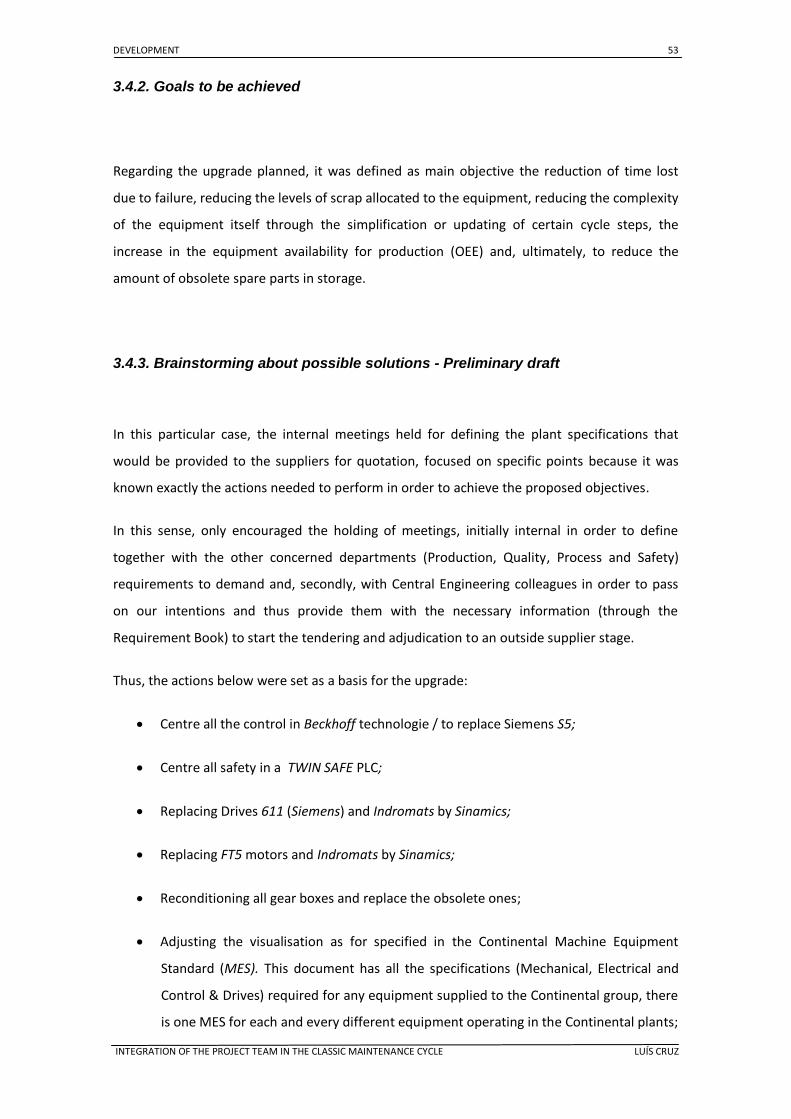
DEVELOPMENT 53
INTEGRATION OF THE PROJECT TEAM IN THE CLASSIC MAINTENANCE CYCLE LUÍS CRUZ
3.4.2. Goals to be achieved
Regarding the upgrade planned, it was defined as main objective the reduction of time lost
due to failure, reducing the levels of scrap allocated to the equipment, reducing the complexity
of the equipment itself through the simplification or updating of certain cycle steps, the
increase in the equipment availability for production (OEE) and, ultimately, to reduce the
amount of obsolete spare parts in storage.
3.4.3. Brainstorming about possible solutions - Preliminary draft
In this particular case, the internal meetings held for defining the plant specifications that
would be provided to the suppliers for quotation, focused on specific points because it was
known exactly the actions needed to perform in order to achieve the proposed objectives.
In this sense, only encouraged the holding of meetings, initially internal in order to define
together with the other concerned departments (Production, Quality, Process and Safety)
requirements to demand and, secondly, with Central Engineering colleagues in order to pass
on our intentions and thus provide them with the necessary information (through the
Requirement Book) to start the tendering and adjudication to an outside supplier stage.
Thus, the actions below were set as a basis for the upgrade:
Centre all the control in Beckhoff technologie / to replace Siemens S5;
Centre all safety in a TWIN SAFE PLC;
Replacing Drives 611 (Siemens) and Indromats by Sinamics;
Replacing FT5 motors and Indromats by Sinamics;
Reconditioning all gear boxes and replace the obsolete ones;
Adjusting the visualisation as for specified in the Continental Machine Equipment
Standard (MES). This document has all the specifications (Mechanical, Electrical and
Control & Drives) required for any equipment supplied to the Continental group, there
is one MES for each and every different equipment operating in the Continental plants;

54 DEVELOPMENT
INTEGRATION OF THE PROJECT TEAM IN THE CLASSIC MAINTENANCE CYCLE LUÍS CRUZ
3.4.4. Project for the selected solution
From the meetings held internally and with the Continental central engineering team, resulted
a summary table with the requirements considered as essential for intervention in matter,
later integrated into the Requirement Book’s chapter “Plant Requirements”, and from which is
presented a small excerpt, as follows (Figure 22:
Figure 22 - Upgrade specifications
These are the indications given to suppliers at contest as for the work to consider in the
proposal to be submitted.

DEVELOPMENT 55
INTEGRATION OF THE PROJECT TEAM IN THE CLASSIC MAINTENANCE CYCLE LUÍS CRUZ
In the winning proposal (presented by a local supplier), the system architecture, as well as
hardware and software components were chosen to provide the best service possible, keeping
in mind that the system would had to be enlarged and upgraded, so the global solution should
not be limitative in terms of production increase and product complexity rise.
According to the technical documentation of the contest, it was proposed Beckhoff
architecture for the automation system and a Siemens Solution based in WinCC flexible for
Supervisor System. This choice solves all the needs explained in the technical description and
keeps the global system open for future needs (Figure 23).
Figure 23 - Automation Architecture
The system proposed was based on WinCC Flexible from Siemens. The communications
between the SCADA system and the Programmable Logic Controller (PLC) program would be
made through an Object Linking and Embebing for Process Control (OPC) Server included on
this proposal.
The chart of items to be included in this upgrade can be seen in Figure 24.

56 DEVELOPMENT
INTEGRATION OF THE PROJECT TEAM IN THE CLASSIC MAINTENANCE CYCLE LUÍS CRUZ
Figure 24 - List of equipments to Install
3.4.5. Accomplished Real Gains
In general terms, the gains were those previously discussed as requirements, which will be
further presented as Control and Mechanical.
Thus, the gains regarding the Control are:
New electrical cabinet;
Replacement of the obsolete components (drives, motors, switches, etc.);
Now the different areas of the machine are controlled by a single system (Beckhoff)
(Figure 25). Due to this type of control and visualization, which is common to the other
machines from the industrial park, there was also a gain concerning training, since the
Curative and Preventive Maintenance teams are using this schematic software.

DEVELOPMENT 57
INTEGRATION OF THE PROJECT TEAM IN THE CLASSIC MAINTENANCE CYCLE LUÍS CRUZ
Figure 25 - New visualization and control panel
That particular feature is reflected in the lower intervention times for Troubleshooting
(Lost Times by breakdown) because, by being familiarised with the type of software
organization, the technicians from the maintenance teams take less time to find and
solve a breakdown (Figure 26);
Figure 26 - Textile Cutter top illustration (after upgrade)
Regarding the mechanical part, the cutting area was the most upgraded, being also the one
which needed more changes.

58 DEVELOPMENT
INTEGRATION OF THE PROJECT TEAM IN THE CLASSIC MAINTENANCE CYCLE LUÍS CRUZ
Thus, we can point as major improvements those seen with the removal of the textile
transport to the cutter holder structure and the complete restructuring of the post let-off
buffer, which has ensured the production stability before cutting regardless of its thickness,
reducing so the constant jams and resultant scrap (Figure 27).
Figure 27 - Textile Cutter side illustration (after upgrade)
The safety aspect should be also noted, therefore taking the opportunity of dwell time and
budget available, the safety specifications of the machine was also adjusted to the parameters
currently required by law. Thus, in addition to the concept of the safety control software,
physical barriers with switches / locks complying with the legal requirements have also been
installed, as can be seen below (Figure 28):
Figure 28 - Top view of the Textile Cutter cutting area (after upgrade)

DEVELOPMENT 59
INTEGRATION OF THE PROJECT TEAM IN THE CLASSIC MAINTENANCE CYCLE LUÍS CRUZ
3.4.6. Investment Required
As already mentioned, in order to carry out the proposed works, two suppliers were consulted:
a local one and the machine manufacturer.
The selection turned out to be within the domestic supplier in as much as, in addition to
technical skills already widely demonstrated through the long-time partnership with the
Continental Mabor, the fact that our country has lower operating costs when compared with
Germany, allowed its commercial proposal to be cheaper than the one presented by the
German Competitors in over 50%. Thereby combining the costs proposed by the supplier to
the internal estimated ones allocated to the actions that would be at Continental Mabor
charge, a total budget for the upgrade was requested and approved by the management.
3.4.7. Payback Time
In this particular case, the concept of "time required to recover the investment" is not
applicable since this intervention arises from a need identified by the Engineering Department
through the application of the maintenance model analysed in this thesis, then approved by
the production department and the other departments involved and, in 2012, integrated in the
budget for "Major Repair" for 2013 (general maintenance budget assigned annually to each
Continental plant, which is then divided into several individual projects). Therefore, although
internally be considered as a maintenance cost, for tax purposes it is considered as an
investment, which leads to substantial fiscal counterparts and benefits for the plant and,
consequently, for the group.
3.4.8. Summary of Results
Before proceeding to the explanation of the results obtained with the methodology in study
and respective action which took place and is presented in this paper as a case study, it should
first be realized the volatility associated with this branch of industry.

60 DEVELOPMENT
INTEGRATION OF THE PROJECT TEAM IN THE CLASSIC MAINTENANCE CYCLE LUÍS CRUZ
Thus, in an easily perceivable way we describe in general terms how the Continental AG group
distributes the needs or volumes necessary to satisfy the markets, by the group's various
factories.
At each factory, depending on its production capacity and number of articles (different types /
models and tire sub-branches) in production, it is assigned a "quote" of production, which is an
annual quantity of tires to be injected in the market, being estimated according to its variation
and always calculated on, at least, a year in advance.
However, as many others car and financial market from which the tire market totally depends,
also suffer sudden and unusual variations, which sometimes requires an extra effort from the
tires factories to ensure the required production outputs quotes as, on the other hand, the
ability to slow down and adapt the direct costs concerned to a sudden and unexpected
decrease tires demand.
Thus, it is easy to understand why, even when you analyse namesakes periods between two
consecutive years, not always the results obtained represent the checked reality.
Thus there was exactly found this phenomenon when examining the results pre and post
intervention on the machine, that is, analysing the production levels assigned to this particular
equipment we could be taken to conclude that the total production of the factory and its
turnover fell from 2013 to 2014, however, this could not be further far from the truth, in so far
as the year 2014, not only increased the number of units produced as also increased even
more significant of the billing levels result, not from the general increase in production but,
above all, the increased production of articles of incremented value by, which, in the case of a
tire factory, translates in the increase of high-performance tires production.
This increase in number of the different articles (internally designated as “complexity” or
“mix”) that prophesied the reduction in levels of productivity associated with the machine in
analysis of the year 2013 to 2014, as shown in the picture took from the production
management platform of Continental Basic Data Acquisition System (CBDAS) in the next figure
(Figure 29).
In conclusion, the decrease verified does not derive from overall lower production levels, once,
as it is clear, both the total and other months results grown in 2014 but, from the attempt of
distribution in this particular month of the various articles in production by the four machines
that make up the textile cutting division, so as to minimize the production losses allocated to
set-ups.

DEVELOPMENT 61
INTEGRATION OF THE PROJECT TEAM IN THE CLASSIC MAINTENANCE CYCLE LUÍS CRUZ
Sum of Quant.
Months 2013 2014 Grand Total
T 02 6407288 7688748 14096036
Jan 688857 655840 1344697
Fev 586325 698656 1284981
Mar 629125 743616 1372741
Abr 654617 631176 1285793
Mai 665788 768426 1434214
Jun 644042 725852 1369894
Jul 666597 691255 1357852
Ago 537438 531849 1069287
Set 714966 669247 1384213
Out 34837 671487 706324
Nov 319370 608108 927478
Dez 265326 293236 558562
Grand Total 6407288 7688748 14096036
Figure 29 - Textile Cutter machine #02 2013 and 2014 production (data removed from CBDAS) (m)
Moving to the comparison between the results recorded before, the upgrade execution
(September 2013) with those obtained in the next year (Sep/2014):
1. Time Losses for Breakdown:
From the SAP management software were collected the following data related to the
time lost by breakdown in September/2013 (Figure 30).

62 DEVELOPMENT
INTEGRATION OF THE PROJECT TEAM IN THE CLASSIC MAINTENANCE CYCLE LUÍS CRUZ
Figure 30 - September 2013 Textile Cutter #02 breakdown time losses (data removed from SAP) (h)
Of which resulted the summary figure below (Figure 31):
SAP Values Loss Time % Total Time
Total 8,21 8h13 100%
Electrical 4,84 4h50 59%
Mechanical 3,37 3h23 41%
Figure 31 - September 2013 Textile Cutter #02 global breakdown time losses (data removed from SAP)
(H)
Analysing the presented figures, we can conclude that, in September.2013, the time lost by
electrical breakdown was similar to that caused by mechanical causes.
This brings us to the low levels of complexity/mix recorded in 2013, when compared with
2014, which translates to greater stability in production as a result of the reduced need to
perform set-ups.
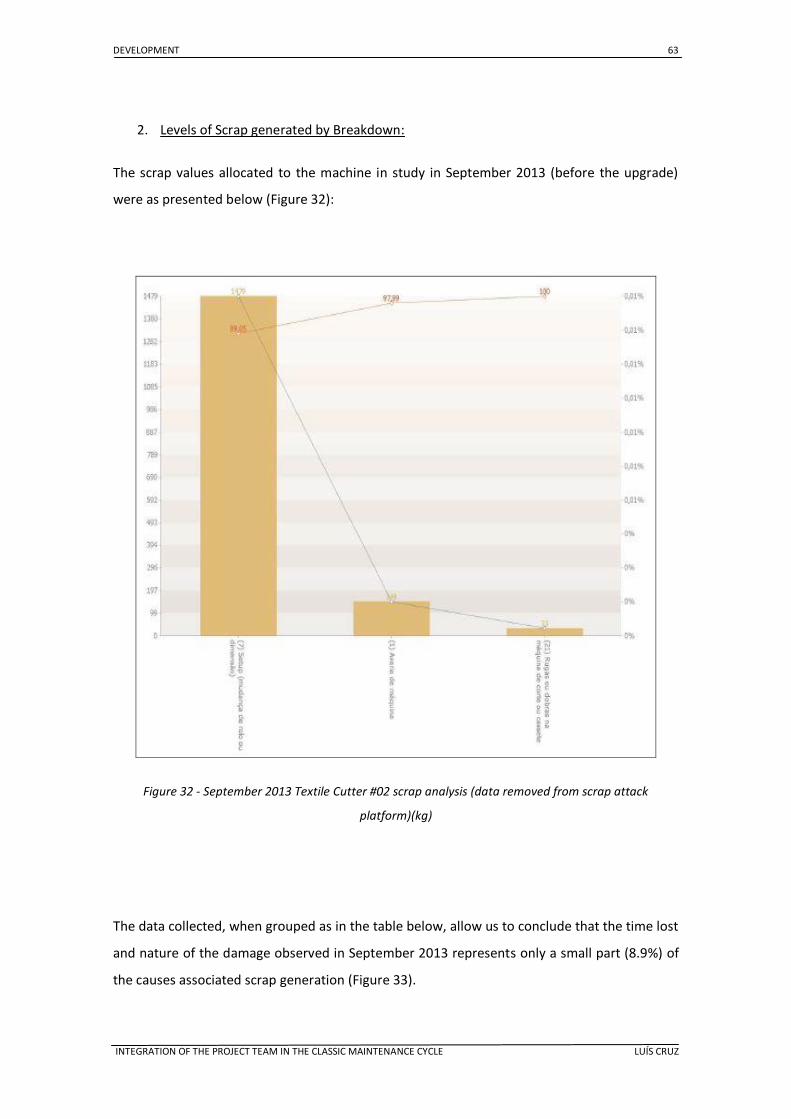
DEVELOPMENT 63
INTEGRATION OF THE PROJECT TEAM IN THE CLASSIC MAINTENANCE CYCLE LUÍS CRUZ
2. Levels of Scrap generated by Breakdown:
The scrap values allocated to the machine in study in September 2013 (before the upgrade)
were as presented below (Figure 32):
Figure 32 - September 2013 Textile Cutter #02 scrap analysis (data removed from scrap attack
platform)(kg)
The data collected, when grouped as in the table below, allow us to conclude that the time lost
and nature of the damage observed in September 2013 represents only a small part (8.9%) of
the causes associated scrap generation (Figure 33).

64 DEVELOPMENT
INTEGRATION OF THE PROJECT TEAM IN THE CLASSIC MAINTENANCE CYCLE LUÍS CRUZ
Quantity %
Total: 1660,9 kg 100,0%
Setup: 1479 kg 89,0%
Breakdown: 148,5 kg 8,9%
Figure 33 - September 2013 Textile Cutter #02 global scrap analysis by root cause (data removed from
scrap attack platform)(kg)
The great booster of scrap values checked was, without a doubt, the scrap generated during
the set-ups, i.e., the amount of damaged material during machine setting to the production of
a new article and/or taken as needed to make adjustments after an intervention by failure.
This difficulty can be associated to the fact that machine initially had two distinct types of
control which co-existence was not always peaceful; this meant a tremendous difficulty to
parameterize and synchronize the production start-ups.
After the intervention carried out, analysed the results obtained during the same period
immediately after the intervention (September 2014) below indicated, we can conclude the
following (Figure 34):

DEVELOPMENT 65
INTEGRATION OF THE PROJECT TEAM IN THE CLASSIC MAINTENANCE CYCLE LUÍS CRUZ
1. Time Losses for Breakdown:
Figure 34 - September 2014 Textile Cutter #02 breakdown time losses (data removed from SAP) (h)

66 DEVELOPMENT
INTEGRATION OF THE PROJECT TEAM IN THE CLASSIC MAINTENANCE CYCLE LUÍS CRUZ
From the above listed data analysis, resulted the breakdown time summary in the figure
presented below (
Figure 35):
Figure 35 - September 2014 Textile Cutter #02 global breakdown time losses by route cause (data
removed from SAP) (h)
Here we conclude by the increase of electrical damage in relation to the same period of last
year, that reality associated to the intervention carried out has not improved the breakdowns
downtimes in that respect, however, it is essential to understand also what was changed on
the production planning when compared to the period prior to the upgrade implementation.
Indeed, it is through the analysis of the scrap levels recorded during September of 2014 that
we can take some more realistic conclusions (Figure 36):
2. Levels of Scrap generated by Breakdown:
SAP Values Breakdown Time % Total Time
Total 15,31 15h19 (...)
Electrical 11,17 11h10 73%
Mechanical 4,14 04h09 27%

DEVELOPMENT 67
INTEGRATION OF THE PROJECT TEAM IN THE CLASSIC MAINTENANCE CYCLE LUÍS CRUZ
Figure 36 - September 2014 Textile Cutter #02 scrap analysis (data removed from scrap attack
platform)(kg)
Once again, the analysis to the graphic showed above resulted in the following summary figure
(Figure 37):
Figure 37 - September 2014 Textile Cutter #02 global scrap analysis by root cause (data removed from
scrap attack platform)(kg)
Analysing the summary table of failure generated scrap, apart from a slight increase, we realize
that, despite the decreased difference to the scrap generated by setups, the total amount of
scrap for the month of September dropped dramatically compared to the same period in the
previous year, regardless of the increase in the number of articles (mix) in production.
We can then conclude that the scrap generated by failure in September 2014 decreased to
almost a 1/3 of the values checked on the same period of 2013, despite the implications
related to the fluctuations of the levels and nature of articles in production. We are also driven
Quantity %
Total: 710,45 kg 100,0%
Setup: 560,05 kg 78,8%
Breakdown: 85,8 kg 12,1%

68 DEVELOPMENT
INTEGRATION OF THE PROJECT TEAM IN THE CLASSIC MAINTENANCE CYCLE LUÍS CRUZ
to conclude that the range of articles in production had a direct influence in the time lost
through malfunction, but not in production levels as it would be initially expected.
3.5. Proposed Model for Application in Other Companies
So we are proposing a model of project team integration in the traditional maintenance
according to the following general assumptions (Figure 38):
Figure 38 - General approach flux flow
Hence, in general terms, the integration of the project team in the Classic Maintenance flow
will occur as follows:
After the occurrence of a malfunction, the first intervention will always be made by the
Curative Maintenance team that, if the intervention is complex and/or expensive, will try to
just ensure the start up for production of the machine (even that in a conditioned way),
passing the teams analysis / diagnosis to the preventive maintenance teams. In the case that
the malfunction does not fit in the check list of the preventive maintenance or the costs
associated are too high regarding the maintenance proposed objectives, it will be forwarded to
the Project Team.

DEVELOPMENT 69
INTEGRATION OF THE PROJECT TEAM IN THE CLASSIC MAINTENANCE CYCLE LUÍS CRUZ
This way, the breakdown will be properly diagnosed and quoted and, even, in conjunction with
other departments may be included other improvements or updates necessary to the
production process in analysis. The defined requirements will be included in a specification and
seen as an upgrade action subject to an investment project with decoupled costs usually
allocated to maintenance.
We can even tailor the proposed integration by the nature of the request in addition to the
previously indicated, as are the examples presented (Figure 39):
1. By interaction with the other classic branches of maintenance:
Figure 39 - By interaction with the other Maintenance Teams Approach Flux Flow
By the above represented flowchart, we can see that the Project Team intervention may also
arise from a problem detected by the other maintenance teams, in particular, the Preventive
Maintenance, Conditioned or even Curative Maintenance teams (Figure 40).

70 DEVELOPMENT
INTEGRATION OF THE PROJECT TEAM IN THE CLASSIC MAINTENANCE CYCLE LUÍS CRUZ
2. By internal customer request:
Figure 40 - By solicitation from other departments approach flux flow
The Project Team intervention may also be requested by other departments of the plant
where the need arises to perform background changes in the equipment (regarding production
levels, quality, security, etc.), or when the need arises to reorganize the plant layout.
So, and after multi-disciplinary discussions, changes and/or equipment relocations are carried
out in accordance with the requested requirements, ensuring always the smallest possible
impact on the normal maintenance crews performance, above all, in the production process.
By this way, besides ensuring a greater assertiveness in the maintenance department team
intervention, allows also a more rigorous control of costs associated with the maintenance,
minor time for damage and, consequently, an increase in production levels and quality of the
final product.

CONCLUSIONS 71
INTEGRATION OF THE PROJECT TEAM IN THE CLASSIC MAINTENANCE CYCLE LUÍS CRUZ
4. Conclusions
The integration of the Project Team in the “Maintenance Classic Method” and its importance
by intervening machines requiring upgrades by the moulds presented in this thesis assumes, in
these days, a major importance in the company's operative results for the reasons that, in a
resumed way, are presented below:
Need of production capacity optimization as a result of the increased availability of
equipment for production (OEE);
Constant updating of equipment to new manufacturing processes;
Guarantee of Quality high levels in the final product;
Substantial increase of the industrial park equipment lifetime;
Controlled maintenance costs;
Control of spare parts amount in stock;
Increment of assertiveness in the interventions on the machines, performed by
maintenance crews;
Possibility of clear division between Investment and Maintenance costs;
Effective planning of maintenance, which results in the optimisation of means and
resources assigned to distributed teams on the shop floor.
In conclusion, we can say that the success achieved by Continental Mabor within the
Continental Group and other competitors dues, also, to the way that the Engineering
Department and its divisions are organized.
There are no doubts that the assertively and efficient way that the various day-to-day
problems are addressed enables the company productivity and quality levels taken as
reference within the Continental Group. To this end, the establishment of a Project Team and
its integration into the circle of Maintenance was essential.

72 CONCLUSIONSS
INTEGRATION OF THE PROJECT TEAM IN THE CLASSIC MAINTENANCE CYCLE LUÍS CRUZ
In this way, in addition to create a branch of the department specializing in supporting the
purchasing process and responsible for the installation of new equipment, upgrades and other
background interventions in existing equipment that allow an equipment remarkable longevity
and always updated to the production processes, also a more complete and reasoned
approach to the day-by-day malfunctions.
In conclusion, the development and application of the presented strategy led to outstanding
production levels with controlled maintenance costs.

BIBLIOGRAPHY AND OTHER SOURCES OF INFORMATION 73
INTEGRATION OF THE PROJECT TEAM IN THE CLASSIC MAINTENANCE CYCLE LUÍS CRUZ
5. Bibliography and Other Sources of Information
Beichelt, F., 1992, A General Maintenance Model and its Application to Repair Limit
Replacement Policies, Microelectronics and Reliability, Vol.32, No.8, pp. 1185-1196;
Canada, J., Sullivan, W., White, J., 1996, Capital Investment Analysis for Engineering and
Management, Prentice Hall, N.J.;
Cetron, Marvin J., Mahinske, Edmund B., 1968, The Value of Technological
Forecasting for the Research and Development Manager, Technological
Forecasting for R & D, Vol.1, No.1, pp. 21-33;
Cetron, Marvin J., Dick, Donald N., 1969, Technological Forecasting- Practical
Problems and Pitfalls, IEEE Transactions on Engineering Management, Vol. EM-
16, No.4, pp. 161-172;
Cetron, Marvin J., Johnson, Jacob N., 1969, Technological Forecasting in a Dynamic
Environment, IEEE Transactions on Engineering Management, Vol.EM-16, No.4, pp. 190-
222;
Coyle, R.G., Gardiner, P. A., A System Dynamics Model of Submarine Operations and
Maintenance Schedules, The Journal of Operational Research Society,
Vol.42, No.6, June 1991, pp. 453-463;
Drew, D. R., Applied Systems Engineering, Virginia Tech Course ENGR 5104,
Course notes, 1998;
Drew, D. R., System Dynamics: Modeling and Applications, Virginia Tech
University Printing Services, 1998;
Eschenbach, Ted G., 1989, Describing the Uncertainty in Technological Forecasts,
International Conference on Engineering Management, 2nd, IEEE, Toronto,
Ontario, Canada, pp. 298-302;

74 BIBLIOGRAPHY AND OTHER SOURCES OF INFORMATION
INTEGRATION OF THE PROJECT TEAM IN THE CLASSIC MAINTENANCE CYCLE LUÍS CRUZ
Fauber, C. E., 1989, Use of Improvement (Learning) Curves to Predict Learning Costs,
Production and Inventory Management Journal, Vol.30, No.3, pp. 57-60;
Fisher, J.C., Pry, R.H., 1971,A Simple Substitution Model of Technological Change,
Technological Forecasting and Social Change, Vol.3, pp. 75-88;
Forrester, Jay W., 1994, System Dynamics, Systems Thinking, and Soft OR, System
Dynamics Review, Vol.10, nos. 2-3, pp. 245-256;
Fusefeld, Alan, 1970, The Technological Progress Function: A New Technique for
Forecasting, Technological Forecasting, Vol. 1, pp. 301-312;
Hariga, M. A., 1996, A Maintenance Inspection Model for a Single Machine with
General Failure Distribution, Microelectronics and Reliability, Vol.36, No.3,
pp. 353-358;
Hoopes, D. G. , 2003, Toward a Theory of Competitive Heterogeneity Strategic
Management Journal, Vol. 24, No. 10, In: Special Issue: Why Is There a
Resource -Based View? Toward a Theory of Competitive Heterogeneity, Oct.,
p.889-902;
Inozu, B., Karabakal, N., May 1994, Optimizing Maintenance: Models with Applications to
the Marine Industry, Journal of Ship Production, Vol.10, No.2, pp.133-139;
Keloharju, R., Wolstenholme, E.F., 1989, A Case Study in System Dynamics
Optimization, Journal of the Operational Research Society, Vol.40, No.3, pp. 221-230;
Kivijarvi, H., Soismaa, M., 1995, Terminal Conditions in System Dynamics, System
Dynamics Review, Vol.11, No.2, pp. 95-112;
Kang, B., Han, C., Yim, Chu-Hwan, 1996, An Adaptive Framework for Forecasting
Demand and Technological Substitution, ETRI Journal, Vol.18, No.2, pp. 87-106;
Martino, Joseph P., 1993, Technological Forecasting for Decision Making, Third edition,
McGraw-Hill, Inc.;

BIBLIOGRAPHY AND OTHER SOURCES OF INFORMATION 75
INTEGRATION OF THE PROJECT TEAM IN THE CLASSIC MAINTENANCE CYCLE LUÍS CRUZ
Menipaz, E., 1978, Optimization of Stochastic Maintenance Policies, European Journal of
Operational Research, Vol.2, pp. 97-106;
Miser, H.J., Quade, E.S., 1985, Handbook of Systems Analysis- Overview of Uses,
Procedures, Application, and Practice, Elsevier Science Publishing Co., Inc.;
Ntuen, C. A., 1991, An Economic Preventive Maintenance Scheduling Model with
Truncated Gamma Function, Reliability Engineering and System Safety, Vol.31,
pp. 31-38;
Ntuen, C. A., 1984, A Stochastic Simulation Model for System Availability Design and
Life-Cycle Costing, Dissertation, West Virginia University;
Ogunlana, S., Lim, J., Saeed, K., 1996, A Dynamic Model for Civil Engineering Design
Management, Information representation and delivery in civil and structural engineering
design, pp. 47-56;
Park, K. S., 1975, Gamma Approximations for Preventive Maintenance Scheduling,
AIIE Transactions, Vol.7, No.4, pp. 393-397;
Richardson, G. P., 1996, Problems for the Future of System Dynamics, System
Dynamics Review, Vol.12, No.2, pp. 141-157;
Rodrigues, A., Bowers J., 1996, System Dynamics in Project Management: a comparative
analysis with Traditional methods, System Dynamics Review,
Vol.12, No.2, pp. 121-139;
Scarf, P.A., 1997, On the application of mathematical models in maintenance, European
Journal of Operational Research, Vol.99, pp.493-506;
Sherif, Y.S., 1982, An Optimal Maintenance Model for Life-cycle Costing Analysis,
Reliability Engineering, Vol.3, pp. 173-177;
Sherif, Y.S., Smith, M.L., 1981, Optimal Maintenance Models for Systems subject to
Failure- A Review, Naval Research Logistics Quarterly, Vol.28, pp. 47-74;

76 BIBLIOGRAPHY AND OTHER SOURCES OF INFORMATION
INTEGRATION OF THE PROJECT TEAM IN THE CLASSIC MAINTENANCE CYCLE LUÍS CRUZ
Sheu, C., Krajewski, L. J., 1994, A Decision Model for Corrective Maintenance
Management, International Journal of Production Research, Vol.32, No.6,
pp. 1365-1382;
Sim, S.H., Endrenyi, J., 1988, Optimal Preventive Maintenance with Repair, IEEE
Transactions on Reliability, Vol.37, No.1, pp. 92-96;
Sullivan, W.G., 1978, A Cross-Impact Analysis of the Solar Space Heating and Cooling
Industry, Industrial Management, pp. 17-21;
Zuckerman, D., 1986, Optimal Maintenance Policy for Stochastically Failing
Equipment: A Diffusion Approximation, Naval Research Logistics Quarterly,
Vol.33, pp. 469-477;
Outras Fontes de Informação
Bin.com, www.bin95.com (Consultado em 12 de Março de 2015)


