INTELLECTUAL PROPERTY RIGHTS AND ACCESS TO INNOVATION:EVIDENCE FROM TRIPS
Margaret KyleYi Qian
Working Paper 20799http://www.nber.org/papers/w20799
NATIONAL BUREAU OF ECONOMIC RESEARCH1050 Massachusetts Avenue
Cambridge, MA 02138December 2014
We thank Tahir Amin, Iain Cockburn, Carsten Fink, Craig Garthwaite, Intan Hamdan-Livramento,Bhaven Sampat, Mark Schankerman, Tavneet Suri, and seminar participants at CERGE-EI, CopenhagenBusiness School, DIW Berlin, Duke, KU Leuven, Mannheim, MINES ParisTech, Northwestern, andthe NBER Summer Institute, Peking University, Tsinghua University, the University of Hong Kong,andWIPO for useful comments and suggestions. Intan Hamdan-Livramento, Sumner LaCroix, andWalterPark generously shared their datasets on IPRs at the country level. Kyle thanks Pfizer for access tothe IMS data used. The views expressed in this paper are entirely those of the authors, and we are responsiblefor all errors. The views expressed herein are those of the authors and do not necessarily reflect theviews of the National Bureau of Economic Research.
NBER working papers are circulated for discussion and comment purposes. They have not been peer-reviewed or been subject to the review by the NBER Board of Directors that accompanies officialNBER publications.
Intellectual Property Rights and Access to Innovation: Evidence from TRIPSMargaret Kyle and Yi QianNBER Working Paper No. 20799December 2014JEL No. I10,O34
ABSTRACT
We examine the effect of pharmaceutical patent protection on the speed of drug launch, price, andquantity in 60 countries from 2000-2013. The World Trade Organization required its member countriesto implement a minimum level of patent protection within a specified time period as part of the TRIPSAgreement. However, members retained the right to impose price controls and to issue compulsorylicenses under certain conditions. These countervailing policies were intended to reduce the potentialstatic losses that result from reduced competition during the patent term. We take advantage of thefact that at the product level, selection into TRIPS "treatment" is exogenously determined by compliancedeadlines that vary across countries. We find that patents have important consequences for accessto new drugs: in the absence of a patent, launch is unlikely. That is, even when no patent barrier exists,generic entry may not occur. Conditional on launch, patented drugs have higher prices but higher salesas well. The price premium associated with patents is smaller in poorer countries. Price discriminationacross countries has increased for drugs patented post-TRIPS and prices are negatively related to theburden of disease, suggesting that countervailing policies to offset expected price increases may havehad the intended effects.
Margaret KyleMINES ParisTech (CERNA) and PSL Research University60 boulevard Saint Michel75006 Paris [email protected]
Yi QianDepartment of MarketingKellogg School of ManagementNorthwestern University2001 Sheridan RoadEvanston, IL 60208and [email protected]
Intellectual Property Rights and Access to Innovation: Evidence
from TRIPS∗
Margaret Kyle†and Yi Qian‡
December 13, 2014
Abstract
We examine the effect of pharmaceutical patent protection on the speed of drug launch,
price, and quantity in 60 countries from 2000-2013. The World Trade Organization required its
member countries to implement a minimum level of patent protection within a specified time
period as part of the TRIPS Agreement. However, members retained the right to impose price
controls and to issue compulsory licenses under certain conditions. These countervailing policies
were intended to reduce the potential static losses that result from reduced competition during
the patent term. We take advantage of the fact that at the product level, selection into TRIPS
“treatment” is exogenously determined by compliance deadlines that vary across countries. We
find that patents have important consequences for access to new drugs: in the absence of a
patent, launch is unlikely. That is, even when no patent barrier exists, generic entry may not
occur. Conditional on launch, patented drugs have higher prices but higher sales as well. The
price premium associated with patents is smaller in poorer countries. Price discrimination across
countries has increased for drugs patented post-TRIPS and prices are negatively related to the
burden of disease, suggesting that countervailing policies to offset expected price increases may
have had the intended effects.
1 Introduction
Intellectual property rights (IPRs) attempt to balance static and dynamic efficiency. By allowing
innovators to block competition and therefore appropriate a greater share of the value of their ideas,
∗We thank Tahir Amin, Iain Cockburn, Carsten Fink, Craig Garthwaite, Intan Hamdan-Livramento, BhavenSampat, Mark Schankerman, Tavneet Suri, and seminar participants at CERGE-EI, Copenhagen Business School,DIW Berlin, Duke, KU Leuven, Mannheim, MINES ParisTech, Northwestern, and the NBER Summer Institute,Peking University, Tsinghua University, the University of Hong Kong, and WIPO for useful comments and suggestions.Intan Hamdan-Livramento, Sumner LaCroix, and Walter Park generously shared their datasets on IPRs at the countrylevel. Kyle thanks Pfizer for access to the IMS data used. The views expressed in this paper are entirely those of theauthors, and we are responsible for all errors.†MINES ParisTech (CERNA), PSL Research University and CEPR ([email protected] )‡Kellogg School of Management at Northwestern University and NBER ([email protected])
and sales across 59 countries of varying levels of development. We explain why patent protection
may shift the equilibrium speed of launch, price and quantity. We then empirically examine these
outcomes using data that allows us to compare patent protection in countries of different income
levels. Though the introduction of IPRs is an endogenous decision taken by policy makers, devel-
oping countries were required by WTO rules to implement a minimum level of patent protection
within a specified time period, and we argue that this requirement creates a natural experiment.
In addition, we exploit the fact that these policy changes did not affect all drugs in the same
way. Drug development has a large random component in the time between discovery (or initial
patent date) and completion of clinical trials and regulatory requirements (or initial launch date).
Within a country and year, we can compare the outcomes of products invented in a year before
they were eligible for patent protection meeting all the TRIPS requirements with those invented
just after TRIPS compliance. This allows us to control for unobservable country characteristics
that affect an innovator’s expected profitability and that vary over time, as well as unobservable
product characteristics that affect price.
Our results suggest that the consequences of TRIPS-required patents on access have not been
as negative as predicted by many in the global health community. Patents are generally associated
with earlier launch of new products and higher sales. The effect of a patent on an innovator’s
launch incentive appears to be greater than the effect of removing this barrier to entry for generics,
on average. This finding suggests the existence of other important barriers, some of which may be
directly linked to regulatory policies. Surprisingly, we find a decrease in the price premium enjoyed
by drugs with patents in the post-TRIPS era, although patented drugs are nevertheless still more
expensive. Countervailing policies such as price controls or the threat of compulsory licensing may
be responsible, either directly or indirectly by inducing different pricing behavior from originators.
We summarize related literature in the next section, with a discussion of important institutional
details and existing theory to motivate our empirical study. Section 3 explains our empirical model,
and Section 4 describes the data. Results are presented in Section 5, and we conclude in Section 6.
2 Background and literature
2.1 The impact of IPRs
IPRs potentially have both static and dynamic effects. Standard theory models predict negative
static effects, as patents allow inventors to block imitation. This monopoly position usually leads
to higher prices and lower consumption. However, these static losses can be offset by increased
incentives for inventors, leading to higher rates of innovation in the long run. There are some
notable exceptions to these predictions, including Boldrin & Levine (2002) and others who are
critical of IPRs as a mechanism to induce innovation. We focus here on the empirical evidence,
and specifically the pharmaceutical sector.
3
A number of papers have examined the effect of IPRs on pharmaceutical innovation, an industry
setting in which patents are especially important (Cohen et al. (2000)). In a study of 26 countries,
Qian (2007) suggested that IP implementation increased domestic innovation only if accompanied
by high levels of development, educational attainment, and economic freedom. Arora et al. (2008)
found that patent applications associated with process innovations increased in India after its
compliance with TRIPS in 2005. Lanjouw & Cockburn (2001) investigated the impact of TRIPS
on pharmaceutical innovations for diseases most prevalent in developing countries, but concluded
that too little time had elapsed by the time of their study to observe large changes. Ten years later,
Kyle & McGahan (2012) examined whether TRIPS compliance stimulated R&D activities for new
drugs across the world. They found that TRIPS has strengthened research on global diseases that
affect both high-income as well as developing countries, but it has not increased R&D activities for
diseases that almost exclusively affect low-income countries.
Other papers have focused on how IPRs have affected access to new treatments. In studies
covering a large number of developed as well as developing countries, Lanjouw (2005) and Cockburn
et al. (2014) found that stronger patent protection increased the speed of new drug launches in
rich countries, but the effect in lower income countries was ambiguous. Borrell (2005), examining
HIV treatments, found that patents were associated with faster launch in developing countries with
relatively low levels of income inequality. However, the results of Berndt et al. (2011) suggest that
while IPRs exist de jure, de facto protection in countries such as Brazil, India, and China remains
weak. These countries generally see substantial entry by generic firms, conditional on launch by at
least one firm.
The most important study in this area is Chaudhuri et al. (2006), who focused on a single
category of antibiotics in India prior to the introduction of pharmaceutical product patents. Us-
ing counterfactual welfare calculations derived from structural estimation, they concluded that the
introduction of IPRs would reduce social welfare, because of the increase in price a reduction in
generic competition would cause both for new treatments and their older substitutes. In addition,
domestic producers had an advantage in distribution, so that total consumption would fall sub-
stantially if the sole supplier was a foreign innovator firm. Given the importance of Indian generic
firms in supplying low-cost treatments for HIV in developing countries (Waning et al. (2010)), the
Chaudhuri et al. (2006) results have important implications for other countries as well. However,
Duggan et al. (2014) find that product patents in India are not associated with large price increases
between 2005 and 2008.
2.2 The TRIPS Agreement
The TRIPS Agreement specifies the minimum levels and enforcement of IPRs, including patents,
trademarks and copyright, that are a condition of membership in the World Trade Organization
(WTO). TRIPS compliance requires patent terms of at least 20 years for products and processes.
4
Two features of TRIPS are of particular importance here.
First, the introduction of product patents for pharmaceuticals was a major change for many
countries. Product patents on pharmaceuticals allow the originator to protect the active chemical
ingredient in a drug. This is considered the strongest form of protection, because no other firm
can produce or import that chemical during the period of patent protection. LaCroix & Liu (2008)
note that in 1960, very few countries allowed pharmaceutical product patents, but more than 95%
did so by 2005; TRIPS is responsible for much of this shift.
Second, the WTO established a process of dispute resolution between member states. If a
country fails to comply with TRIPS, other member states may use this process to impose trade
penalties on the offending country. To the extent that this gave patentholders (or at least their
representatives in the governments of member states) greater enforcement power, we would expect
TRIPS to strengthen patent protection in practice, even in the absence of a legislative change to
patent law.
Developing and least-developed countries generally objected to some terms of TRIPS, and
specifically to pharmaceutical product patents. To alleviate their concerns, poorer countries were
permitted a transition period to comply with TRIPS. While developed countries had one year
after joining the WTO to conform, most developing countries were required to implement TRIPS
by 2000, and least-developed countries (LDCs) by 2006. However, countries that did not grant
patents in a particular technology area in 1995 were given 10 years to comply. India, for instance,
had until 2005 to introduce pharmaceutical product patents. The transition period for LDCs was
later extended to 2016 for pharmaceutical product patents. Further details are provided in Section
4.3.
Several other exemptions that weaken the strength of pharmaceutical patents were included in
TRIPS to accommodate the concerns of developing countries as well as developed countries.2 The
2002 Doha Declaration first outlined the conditions under which countries may issue compulsory
licenses; these conditions include limiting the use of the licensed product to the domestic market,
restricting the use of compulsory licenses to cases of national health emergencies and providing
“reasonable” compensation to the patent holder. Since many countries lack domestic manufacturing
capacity and were therefore unable to use compulsory licenses, they negotiated the ability to import
compulsory-licensed products from foreign markets (parallel imports) in 2003. Several countries
have issued compulsory licenses, mainly for HIV treatments, although Thailand and India have also
done so for other diseases such as hypertension and cancer. Several developed countries, including
the United States, threatened compulsory licensing during public health scares such as flu outbreaks
(Beall & Kuhn (2012)).
Both developed and developing countries may impose price controls on pharmaceuticals under
2For example, the patent law of many developed countries includes a “Bolar provision,” which permits researchusing a patented pharmaceutical during the term of patent protection if the purpose of the research is compliancewith regulatory requirements for market approval.
5
the TRIPS Agreement (discussed below). The combination of price controls and compulsory li-
censing (or the threat of either) may serve as an important check on the market power granted by
pharmaceutical patents. These countervailing policies, which are challenging to account for in an
empirical model, are critical for interpreting our results.
2.3 Pharmaceutical regulation
The pharmaceutical sector is highly regulated. Most countries require proof of safety and efficacy
before permitting a drug to be sold, and many also regulate the prices that firms can charge for
pharmaceuticals; see Scott Morton & Kyle (2012) for an overview. Across developed and developing
countries, there is variation in the regulation of market entry and in the use of price controls. Price
controls may offset the expected effects of IPRs, since patent holders may be forced to charge lower
prices (thus reducing the incentives for innovation) and access may be higher as a result (thus
reducing the static inefficiencies associated with patents).
Most previous work on price regulation has focused on relatively rich markets. For example,
Danzon et al. (2005), Kyle (2006), Kyle (2007) and Danzon & Epstein (2008) all examine the
relationship between price controls and the speed of access to new drugs. If country markets were
completely independent and firms faced no capital constraints in product launch, we would expect
firms to launch a new drug in all markets immediately, especially considering the limited term of
patent protection (if applicable). In general, marginal costs of production are fairly low relative
to the fixed cost of developing a drug, at least for small molecule drugs. So long as a firm can
cover the marginal cost of producing the drug, the firm should be willing to sell. However, all these
papers find that the reality is more complicated.
First, firms must incur country-specific entry costs. In countries such as the US and EU member
states, the first firm to introduce a new chemical or biological entity must document the drug’s
safety and efficacy through clinical trial evidence. Most developing countries have regulatory agen-
cies charged with granting marketing authorizations, though some allow firms to rely on dossiers
provided to other countries. The process of price negotiation with particular governments can be
time-consuming, generating further launch delays. This is a purely bureaucratic delay, although it
may be increasing in regulators’ preferences for low prices.
In addition, country markets are not truly independent. Many governments use “external
reference pricing” when setting the local price, meaning that they base the local price on that
observed in other countries. Thus, launching a new drug at a very low price in one country can
reduce the price the firm receives in other countries, if initial low price is referenced. Country
markets can also be linked through parallel trade, which is legal between European Union member
states and has been considered by the US. Parallel trade amounts to arbitrage of price differences
between countries, which again means that launch in a low-price market is less attractive than
would be the case with independent country markets. The general finding from the literature cited
6
above is that price controls are associated with launch delays. Whether the cost-savings generated
by the use of price controls outweigh the delay in access is unresolved, as is the effect on dynamic
incentives for investment in innovation.
With patent protection, the innovator may block entry by generic firms. Without patent pro-
tection, both innovators and generic firms are eligible to launch a new drug. Their incentives to
do so depend on other policies, in particular regarding data exclusivity and the requirements for
subsequent entrants. For example, many countries (including the US and EU member states) allow
generic firms seeking regulatory approval to rely on the clinical data provided by the first entrant.
They need only demonstrate that their product is bioequivalent to that of the first entrant’s. The
difference in regulatory treatment of first entrants and followers is considered vital for assuring
generic competition, since it drastically lowers the entry costs for the latter.3 However, the first
entrant may be granted a period of data exclusivity over its clinical trial evidence, during which
time generic firms must either independently provide similar evidence to the regulator or wait for
its expiration. Even in the absence of a patent, therefore, potential entrants may not launch due
to the high costs of acquiring clinical data for regulatory approval.
2.4 Summary of theoretical predictions
We assume firms (either innovators or generic producers) launch products when they expect positive
expected profits. If subsequent entrants can rely on the clinical trial evidence of the first entrant
and there is no period of data exclusivity, the first entrant may not be able to recoup the fixed costs
of launch. With a period of data exclusivity, both the innovator and generic firms may be willing
to launch. If it has already conducted clinical trials for regulatory approval in other countries, the
innovator may have a cost advantage in doing so. With patent protection and no data exclusivity,
then only the innovator has the right to launch the product. The innovator may choose not to
launch because of the regulatory spillovers discussed above.
In the absence of price regulation, the theoretical effect of IPRs on price, conditional on launch,
is fairly clear: the price with IPRs should be at least as high as that without IPRs.4 With price
regulation, the theoretical effect is less obvious, and depends on regulators’ willingness to reward
innovators, attract entry, control expenditures, etc.
In the case of total quantity sold (conditional on launch and price), the expected effect of
IPRs depends on the importance of country and product specific investments. Examples of such
investments include educating medical professionals about the existence, use and benefits of a new
drug; establishing distribution networks; ensuring the provision of complements such as diagnostics,
etc. If competitors can free-ride on those investments, then generic competition in the absence of
3The 1984 Hatch-Waxman Act established the regulatory pathway for generic approval, after which generic entryincreased substantially.
4An exception might occur if firms use price to signal quality when there are multiple producers of the same drugand no reliable government certification of quality.
7
IPRs might result in lower levels of investment and lower quantities sold. On the other hand,
generic firms may sell a larger portfolio of products than innovator firms and therefore have greater
incentive to invest in distribution. In this case, removing generic firms from the market may reduce
quantity sold via inferior distribution.
To summarize, the theoretical impact of IPRs on launch, price and quantity is ambiguous.
Under regulatory conditions that require firms to provide clinical evidence of safety and efficacy
(information that is a public good), IPRs are likely to result in faster launch. In markets with free
pricing, IPRs are likely to result in higher prices; in markets with price controls, the effect may
depend on relative bargaining power. For products that require substantial country-level investment
in education and infrastructure, IPRs may encourage such investments and lead to higher quantities
sold. Chaudhuri et al. (2006) suggest instead that generic producers have superior distribution,
so that IPRs that block them from the market yield reduced quantities. Conditions may vary
substantially across countries and products, so effects may be heterogeneous.
3 Empirical model
In this section, we describe our estimation methods for evaluating the effects of IPRs on the time
to launch, price and quantity sold. We use data at the country-molecule-quarter level, which allows
us to control for molecule and country effects and to use within-molecule, between-country and/or
within-country, between-molecule comparisons in evaluating the effects of IPRs.
3.1 Endogeneity of patent protection
IPRs exist at the country level, and change for a subset of countries as a result of the TRIPS
Agreement. One estimation of the effect of IPRs is a comparison of the overall launch speed, price
level and quantity sold within countries following the introduction of IPRs, compared with those
that did not. If adoption of IPRs is driven by time-varying unobservables, however, this difference-
in-difference will yield biased results. Cockburn et al. (2014) use instrumental variables such as
legal origin, ethno-linguistic fractionalization, and the number of bilateral trade agreements signed
by a country in their study of drug launches.
Developing countries generally opposed the requirements of TRIPS, so one could argue that
this policy was exogenously imposed on many of them (Hamdan-Livramento (2009), LaCroix &
Liu (2008)). At the time of the WTO’s establishment, member countries that declared themselves
as “developed” had one year to bring their IPRs up to the minimum standards specified by TRIPS.
Developed countries that joined after 1995 were required to be compliant at the date their WTO
membership began. Original WTO members that declared themselves as “developing” were per-
mitted a transition period for TRIPS implementation, with a deadline of 2000. A longer transition
period, until 2005, was permitted for countries that did not grant pharmaceutical product patents,
8
such as India. These countries were required to provide a “mailbox provision” until then, i.e. accept
patent applications even while deferring decisions until 2005, and to grant applicants five years of
marketing exclusivity during the transition period. 5 Least- developed countries, designated as
such by the United Nations, had the longest transition period: initially the deadline was January
1, 2006, and this was extended to 2016 as a result of the Doha round of negotiations in 2002. That
said, some countries resisted more than others, and some complied early. An instrument for the
year of actual compliance is the year by which a country was required to implement TRIPS under
WTO rules. One possible instrument for IPRs at the country-year level is the WTO’s deadline for
TRIPS compliance. However, it is correlated with the level of development, and has only cross-
country variation. The decision by originators to seek patent protection on a particular molecule
where and when such protection is available is also potentially endogenous. If originators perceive
patent protection to be ineffective or do not expect to market due to low profit expectations, they
may not even submit applications for patent protection.
We adopt an approach that exploits our country-molecule-quarter level information on patents.
Following changes to patent law in accordance with TRIPS, only a subset of products within a
country qualifies for strengthened patent protection and any associated pricing power, and this
subset is exogenously determined by the priority date of the first patent application globally and
the country’s required compliance dates with TRIPS. Similarly, within a molecule, the countries
in which a drug qualifies for product patents is exogenously determined by the date its priority
patent application was filed. We therefore define a “Post-TRIPS treated” group of products within a
country, composed of molecules whose patent priority dates allows them to apply for a patent under
a TRIPS-compliant legal regime in a country. If the patent priority date determining whether a
product qualifies for a Post-TRIPS patent in a country is exogenous, then the difference in outcomes
between products with pre-TRIPS patents and those with Post-TRIPS patents captures the effect of
strengthened IPRs.6 Within a country, the expiration of a granted patent is exogenously determined
by its application date, although patent extensions may apply in some cases.
We estimate separate regressions for each of our dependent variables of interest, i.e. the speed
of launch, price, and quantity sold. With this approach, we are assuming that firms first choose
whether (and how quickly) to launch, which may depend on the existence of IPRs. Given launch, we
examine whether prices are higher in the presence of IPRs and whether the quantity sold changes in
the presence of IPRs. To be clear, we are not estimating structural demand and supply equations.
Our claim is only that IPRs may shift the equilibrium levels of these outcomes.
We use a discrete-time model of firms’ launch decisions, assuming that we observe launch if firms
expect positive profits from market entry. The latent variable for profit Πijt denotes the profit from
the launch of drug j in country i and in quarter t, and we specify the following reduced-form profit
5The US challenged India’s compliance with these terms in a WTO trade dispute.6In many countries, a patent system existed prior to official TRIPS compliance, but may not have offered the
same level of protection.
9
function conditional on drug launch:
Πijt = α0 + α1ExpiredPatentijt
+ α2OnPatentijt
+ Xijtµ+ τit + ψj + εijt,
where ExpiredPatentijt is a dummy variable equal to one if drug j has no remaining patent
protection in country i in quarter t, and OnPatentedijt is a dummy variable equal to one if drug
j has an active patent (i.e., granted and not yet expired) in quarter t. The omitted category is
the case of a drug that was never patented in country i. Xijt is a vector of other variables that
may affect the launch probability (market size, GDP levels, the number of previously launched
substitute pharmaceutical treatments for drug j in country i, etc.), τit is the time elapsed since the
first international launch for drug j in country i at time t, ψi is the disease category fixed-effect,7
and εijt is the unobserved error term. We estimate this using a discrete-time hazard with a logit
link.
The theoretical effect of IPRs is ambiguous in the launch equation. We simply estimate whether
countries have earlier access to innovations when patent protection exists (or ever existed) there,
without distinguishing whether the originator or imitators enter first. Originators may be more
likely to launch when they have strong IPR protection, but international reference pricing may
cause strategic delays in the launch. Generics may be quicker to market if no IPRs exist, but if
they rely on entry by an originator to reduce their regulatory requirements, they may not necessarily
enter the market before the originator.
We next examine the relationship between IPRs and price by estimating the following equation,
conditional on launch:
Pijt = β0 + β1ExpiredPatentijt
+ β2OnPatentijt
+ Xijtν + φj + εijt,
where φj is a drug fixed-effect and other variables are defined as in the launch model. The drug
fixed-effect controls for unobserved quality. Generally, we expect IPRs to give originators some
market power, and for this to be reflected in higher prices on patented products. However, the use
of price controls by countries may limit those price increases.
Finally, we turn to quantity. It is possible that originators may be more willing to undertake
7We chose to use disease fixed-effects rather than drug due to the computational burden of estimating more than700 fixed-effects in a non-linear model.
10
investments in education and advertising if they are able to appropriate most of the benefits,
which is more likely in the absence of generic competition. However, originators may invest less in
distribution, since they may have a smaller product portfolio than generic firms. To evaluate the
effect of IPRs, we estimate the following equation:
Qijt = γ0 + γ1ExpiredPatentijt
+ γ2OnPatentijt
+ Xijtµ+ φj + εijt,
where variables are defined as earlier.
We next estimate specifications that allow for the effect of patents to vary across countries. First,
we interact our patent status variables with country income per capita (logged). As an alternative,
we interact patent status with World Bank income group definitions to examine differences between
different levels of development. We also include a specification in which we allow for the effect of
patents to vary by country, rather than by income group.
Finally, we distinguish between pre- and post-TRIPS patents. Instead of defining a dummy
variable for whether a drug is currently on patent, we define whether it is protected by only pre-
TRIPS patents or has some patent protection under a country’s TRIPS regime. We again allow
this to vary by country income groups. This specification allows us to explore the effects of TRIPS
in particular, rather than patents generally.
We perform the analysis using the two definitions for “patented”: the existence of any patent
(product, process, etc.) and the existence of a product patent. While product patents have received
the most attention and were the most contentious legislative change, researchers and policymakers
have also focused on the use of follow-on patents to extend market exclusivity. The latter speci-
fications provide some insight into whether such additional patents affect originator incentives to
launch and market their products.
We also estimate the equations above with the addition of a country fixed effect, δi. This
fixed-effect will absorb differences across countries in, for example, the efficiency of bureaucracies
in approving new drugs; policies on price controls and reimbursement; and enforcement. The
difference between pre- and post-TRIPS patents is therefore a comparison of two groups of products,
one treated by theoretically stronger protection, net of unobserved quality differences (which are
absorbed by drug fixed-effects).
3.2 Instrumental variables approach
A limitation of the above approach is that patent protection is the endogenous outcome of decisions
by two key players. First, the originator must apply for protection (if offered in a country), and
11
expectations about the state of future patent protection in a country, or effective enforcement, as
well as expected price and quantity will influence this decision. Second, the policymaker or patent
office must grant the patent. As discussed above, many countries did not offer patent protection,
or offered weaker forms of protection, prior to TRIPS.
In an alternative model, we define an indicator variable for whether a drug was eligible for
TRIPS-compliant patent protection in a particular country, i.e. TRIPS compliance occurred no
later than the priority date plus 30 months. Having a priority date within this window exogenously
shifts the incentive for originators to apply for a patent (because of stronger protection or enforce-
ment) and the obligation of patent offices to grant pharmaceutical product patents. In addition,
patents have a predetermined maximum term. While other country policies may extend this, we
take the “normal” expiration date of the first patent on a drug within a country as exogenous, at
least at the level of a specific patent at the time of filing. These patent terms vary across countries
and over time, as laws were changed to comply with TRIPS. For example, in 1995, the maximum
term of patent protection in the US changed from 17 years from the grant date to 20 years from the
filing date. We use indicators for the priority date falling within the period of TRIPS eligibility and
for the current period falling within the standard patent term following the approach recommended
by Wooldridge (2010).
First, we estimate a reduced-form model of patent protection (which we will call “stage 0”):
PatentedDrugijt = ν0 + ν1WithinWindowij
+ ν2WithinTermijt
+ Xijtκ+ φj + ξijt,
We then calculate predicted values ˆPatentedDrugijt, and use this and its interaction with other
variables as instruments in the second stage regressions of price and quantity:
where PatentedDrugijt and IncomeGroupi ∗PatentedDrugijt are instrumented using the pre-
dicted values from stage 0, the square of predicted values, and the interaction with income (GDP
per capita, logged). As above, we also estimate an alternative specification using World Bank
income groups rather than a continuous measure of income. Although the dependent variable in
stage 0 is discrete, we use OLS due to the large number of fixed-effects. This method is robust to
misspecification of stage 0, although the estimator is not efficient if the linear probability model we
use is not correct.
The main drawbacks to this approach are the following. Since we lack separate instruments for
pre- and post-TRIPS patents, we treat any patent protection as the endogenous treatment variable.
The omitted category, no patent protection, includes both drugs that were never patented and
those with expired patents. Treatment effects are likely to be heterogeneous if patent protection
has different effects across countries and/or drugs. Finally, we cannot implement an instrumental
variables estimator for the nonlinear model of launch.
4 Data
4.1 Market outcome data
Our data on key market outcomes of interest – the speed of launch, price, and units sold – comes
from the MIDAS dataset produced by IMS Health. We have quarterly data on prices and units
sold from 2000-2013 and on launch from 1990-2013, a time period that allows us to examine several
years pre- and post-TRIPS implementation for many developing countries. The original data is
provided at the package level, i.e. bottles of 30 10mg tablets. For drugs sold in multiple packages
and presentations, we aggregate the revenues and number of “standard units” (smallest dose) up to
the level of a molecule or combination. Although there is some price discrimination across packages
within a country, this aggregation facilitates comparisons across countries. Each drug is assigned
to a therapeutic class (at the ATC3 level); for drugs with sales in multiple classes, we use the class
with the highest level of sales as its primary disease market.
The IMS data includes a total of 33,240 unique molecules or combinations of molecules, many
of which are quite old. We exclude diagnostic agents (ATC class T) and drugs that cannot be easily
assigned to a disease (ATC class V). We focus on drugs first launched anywhere in the world after
1990, since it is this set for which TRIPS is most relevant. Drugs that are unique to one country, a
set that includes many homeopathic products in India and China, are dropped from our analysis.
Finally, we restrict our sample to drugs that we could match to patent information. This leaves us
with a total of 716 drugs.
For each molecule-country pair, we observe launch date, the total sales in nominal local currency,
and the number of units sold. We convert nominal sales to real values using the country’s GDP
13
deflator. We calculate price as total sales divided by the total number of standard units sold.8
Thus, within-country price changes do not reflect exchange rate fluctuations or inflation. For cross-
country comparisons, we express prices in constant US dollars using the average exchange rate for
2013Q4.
We keep one observation per country and quarter for each drug starting from its initial launch.
A drug is considered launched in a country once positive sales are observed; prior to its launch
in a country but following its first launch elsewhere, launch is coded as zero and price and sales
are coded as missing. Ultimately, this dataset includes 56 quarters, 60 countries, and 716 unique
molecules, amounting to 1459993 molecule-country-quarter observations.
4.2 Firm-level data
We distinguish between originators, or firms that invest in the development of a new drug, and
generic firms. Originators generally own patent rights on the molecule or a license to those rights.
Many drugs are developed and/or marketed under license by multiple firms. For example, several
firms could collaborate in the development, with one firm responsible for marketing the drug glob-
ally, or one firm might develop the drug and license it out to other firms for marketing in North
America, Europe, etc. We use two approaches to identify these firms. First, the MIDAS dataset
includes some information on the licensing status of each firm generating sales of a molecule in
a country. If the licensing status is available and listed as either “original brand” or “licensed
brand”, we treat the observation as an originator sale, since the originator receives some payment
for the sale of a licensed brand or at least authorized its sale. For the remaining cases, we use
the R&D Focus database provided by IMS Health, which tracks drug development projects and
includes information on the drug, its intended uses, and the firms participating in its development
or marketing. We designate any firm listed as a co-developer or licensee on a drug project that is
also selling the product in one of our sample countries as an originator. All other sellers of that
drug are coded as generic firms or parallel importers.9
4.3 Country-level data
Summary information for the countries in our sample, including the dates of TRIPS deadlines,
World Bank income group definitions in 2000 and 2013, and region, is provided in Table 1. Our
sample includes the major emerging markets of Brazil, Russia, India, and China, as well as Indone-
sia, Malaysia, Thailand, and South Africa. Thirty of our sample countries had TRIPS compliance
dates in 2000 or later (see Table 1). Many countries had adopted pharmaceutical product patent
8Some observations have negative values for sales, which reflect the return of products to the manufacturer. Weset price to missing in these cases.
9Parallel importers sell the originator’s own products in a country, but without a license. Parallel trade iswidespread within the European Union and is thought to be important in some developing countries. We are onlyable to identify parallel traders within Europe, however.
14
legislation prior to their official compliance deadlines. Quite a few rose in income classification
between 2000 and 2013. In our analysis, we use the income classification as of 2000. Results are
similar using the 2013 definition, although we have fewer countries in the lowest income group.
Our main focus in this paper is the effect of IPRs on the outcomes in country-markets, so it
is critical that we correctly measure the existence or strength of IPRs at the country-level over
time. There are a number of possible candidates. The first is the Ginarte-Park index of IPRs
and enforcement (Ginarte & Park (1997)). This measure has the advantage of including a specific
index of patent protection for chemicals. It is only available at 5-year intervals, however, and is
not available for every country in our sample. We complement this with information collected by
LaCroix & Liu (2014) and Hamdan-Livramento (2009). We thank these authors for their willingness
to share their datasets.
An additional form of protection available in many countries is called data exclusivity. During
the period of data exclusivity, only the owner of the data may use it to obtain regulatory approval
for marketing a drug. This varies across countries and over time. Based on country i’s data
exclusivity term at time t, we define a dummy variable equal to one if drug j was likely to be
protected by data exclusivity.
To control for the impact of economic development or income level, we use the World Devel-
opment Index (WDI) dataset from the World Bank. It includes GDP per capita, population, the
Gini coefficient of income inequality, health expenditures per capita, life expectancy, out-of-pocket
health expenditures, poverty rates, and GDP deflators across the sampled countries. To retain as
much of our sample as possible, we include only the subset of WDI indicators with very complete
coverage. Our source of information on quarterly exchange rates between the local currency and
the US dollar is the Pacific Exchange Rate Service for most countries, and individual central banks
otherwise.
4.4 Disease data
We define a market as a country-disease pair. Regulatory approval is required at the country level
in order to market a drug, and gaining regulatory approval in one country does not generally allow
a firm to access other countries.10 In addition, demand for a drug that treats a particular disease
is generally limited to the population affected by that disease. For example, we would not expect
demand for a colon cancer drug to be very high among those who do not have colon cancer. Since
the burden of disease (or demand) can change over time for any number of reasons (aging of the
population, spread of infectious diseases, changes in risky behaviors, etc.), our ideal measure would
capture such changes.
10Within the European Union, a firm can use a centralized approval process handled by the European MedicinesAgency to win approval among all member states. Alternatively, a firm can apply for regulatory approval in onemember state and use this member state as a reference for approval in other EU countries. However, in order to havethe product reimbursed, the firm must negotiate with different (country specific) regulators over the price.
patents on drug delivery technologies, and for patents identified only by the name of the branded
product, additional work is required to find the corresponding product in the other dataset.
There are a number of complications in using pharmaceutical patent data. Linking patents
to marketed drugs is a many-to-many match. Most molecules have multiple associated patents,
covering the molecule itself, a use of the molecule, manufacturing processes, etc. In addition, a single
patent may protect multiple drugs. For example, the HIV treatment markted as EPZICOM in the
United States is a combination of abacavir (sold under the brand name ZIAGEN) and lamivudine
(sold as EPIVIR). Patents protecting one of the individual molecules may block entry into the
combination product, and there is also a patent on the combination. A process patent for the
preparation of optically active cis-nucleosides that specifically mentions abacavir and lamivudine
could protect each of the single-molecule products. Despite a move towards harmonization of IP
laws, the same molecule might be eligible for a different number of patents in different countries,
or different breadth of coverage.
When a molecule is protected by multiple patents, it is not always straightforward to determine
which patent is most important for blocking competition; this is true not only for the econometri-
cian, but also for patent attorneys and the managers of pharmaceutical firms. Generic competition
may legally occur despite the existence of a patent on a molecule, because the patent covers a man-
ufacturing process that generics have worked around, or because the originator has authorized a
generic. In some countries, generic competition may also occur because no patent exists, or because
patents are not enforced. We use two different measures of patent protection in the empirical anal-
ysis: the existence of an active patent (post-grant date and pre-expiration date) and the existence
of an active product patent, which is considered the most difficult to invent around.
We use the first application date for any patent associated with a molecule across all countries
as an approximation of its priority date.12 Originators generally must apply for protection in other
countries within 12-30 months of the priority date. Under the Paris Convention, inventors have 12
months to apply in other countries. Under the Patent Cooperation Treaty, inventors may take an
additional 18 months, for a total of 30. We account for each country’s status as a signatory to the
PCT in variable definitions. Because of the lengthy period of clinical trials, the priority date of the
first patent is usually at least 5 years before the launch date of a new drug.
We observe patenting activity in many countries prior to their required compliance with the
TRIPS Agreement. Some complied early, and most maintained a pre-TRIPS patent system that
provided weaker protection than TRIPS required. In addition, the legal availability of patents may
not always lead to the use of patents. If a market is very small or cannot support prices that allow
the firm to recover variable costs and the fixed costs of launch, then a firm may not bother to
apply for a local patent. Similarly, we may not observe patent applications when a firm expects
12The filing date and priority date can be different, particularly when a patent application is derived from a parentapplication. We do our best to deal with this by selecting the earliest filing date for all patents associated with amolecule.
17
lax enforcement of the patent or a negative decision from the patent office.
We define a drug j as “on patent” in country i in quarter t if quarter t follows the earliest grant
date of any patent on j in i and if quarter t precedes the last expiration date of any patent granted
on j in i. Pre-TRIPS, the patent term varied by country. Post-TRIPS, patents have a duration of
20 years from the date of application. In some countries, drugs may be protected by “supplementary
protection certificates” or patent term extensions that allow years of market exclusivity. We adjust
our definition of “on patent” for patent extensions, lapsed patents, and invalidated patents. For
the specifications that focus on product patents, we use analogous definitions but exclude process,
composition, and other types of patents.
4.6 Summary of data
The distribution of broad disease areas for the molecules in our regression sample is listed in Table
2. Cancer, cardiovascular treatments, and anti-infectives have the highest number of molecules.
The list of countries included, along with their required TRIPS compliance dates and dates of
pharmaceutical product patent legislation, is contained in Table A of the appendix. For ease of
explication, we combine the three low income countries (India, Indonesia and Pakistan) with the
lower middle income group in the discussion and analysis that follows. All three were considered
lower middle income by 2013.
There is wide variation across countries in the fraction of drugs with product patents. For
example, there are very few with product patents in the United Arab Emirates and the Dominican
Republic, but more than 70% of the drugs launched since 1990 in the United States had a product
patent. Even among high income countries, some introduced product patent legislation relatively
late (such as Norway, Spain, and Estonia) and have a lower share of drugs with product patents.
Those without product patents in the US are generally older drugs for which a new use has been
discovered, or combinations of drugs that may not always qualify for product patents. The share of
products for which originators beat generics to market also varies substantially. The originator is
first more than 80% of the time in most countries. However, India is a clear exception: originators
are first in fewer than 20% of the opportunities (see Table A). In some South American and
Middle Eastern countries, generic firms precede originators in a significant number of cases. Some
of these countries only recently implemented product patents, but others may have weak patent
enforcement. Overall, the pattern of launch suggests that generic firms often rely on local entry by
originators, perhaps because obtaining regulatory approval is easier once the originator has provided
clinical data or because originators invest in advertising that generic firms can benefit from. It also
underscores the importance of patents in India compared with other developing countries. The
impact of introducing patent protection is likely to be larger in India than anywhere else, and may
have consequences for the supply of generic drugs to countries where IPRs do not block entry.
Table 3 presents simple means of several key variables by income group and patent status. Not
18
surprisingly, the fraction of product launched is generally increasing in country income, with 55%
of eligible treatments available at some point during 1990-2013 in high income OECD countries,
but only 35% for lower middle income/low income countries. Launch by originators is faster in
high income countries, and originators are quicker to markets than generics in every income group.
However, generic entry is more likely in the upper and lower middle income groups, and occurs
slightly earlier than in high income countries on average.13 The existence of a product patent
implies faster originator entry (a median of 1.5 versus 3.51 years). More surprisingly, generic entry
is slow whether a product patent exists or not, though somewhat more likely when no product
patent exists. However, originators are still first in more than three-quarters of the cases. This
suggests that product patents are not the only important barrier to entry in most countries. Figure
1 shows the distribution of the number of producers over drug-country-quarter observations by
patent status; results using the presence of any patent are similar. The presence of a product
patent mostly affects whether any producer is active. That is, there is a shift from no producers
to a monopoly; the shift from more competitive markets to a monopoly is not evident. Of course,
originators are more likely to seek patents where they expect to earn positive profits. These simple
summary statistics suggest that if originators do not expect profits, generic firms may not either.
Trends in patenting and launch activity are shown in Table 4. There is a clear increase in
patenting over time (subject to truncation issues for recently introduced drugs, for which secondary
patents may continue to be granted). Launch lags remain significant: while drugs first launched
since 1995 appear to be reaching more countries than those pre-1995, those first launched since
2005 have not yet reached half the countries in our sample.
Summary statistics for variables used in the regression analysis are presented in Tables 5 and
6. Table 5 contains the sample used for the launch regression, which runs from 1990-2013; only
observations up to and including the quarter of launch are included for this analysis. Table 6
corresponds to the sample used for the price and quantity regressions, for which data is available
from 2000-2013. Only observations post-launch are included.
5 Results
5.1 Main effects
In all the tables of estimation results that follow, standard errors are clustered by country. Year
fixed-effects are included in all specifications, drug fixed-effects are included in the price and quan-
tity regressions, and therapeutic-class fixed-effects are included in the launch regressions. Because
our price measure is the price per “standard unit,” which varies across drugs,14 it is essential that
we include a drug fixed-effect. This inclusion is also important if patents are more likely to be
13The different outcomes observed in the high income non-OECD category likely reflect the small number ofcountries (Kuwait, Singapore, Slovenia and the United Arab Emirates) with high income inequality.
14Ideally, we would use the price per standard course of treatment, but this is not available.
19
granted on novel drugs and novelty is positively correlated with a drug’s quality or effectiveness, or
if originators are more likely to seek protection on high quality drugs (though quality is generally
difficult to assess when the first patent applications are filed).
Market size is approximated by country level variables such as the disease burden associated
with each drug’s primary therapeutic class, population, GDP per capita and life expectancy. Infor-
mation on national health policies such as the existence of an essential medicines list, use of price
controls, average out-of-pocket expenditures, etc. is available for a subset of countries, and the
effect of many of these (endogenous) policies on access is, of course, also of great interest. How-
ever, incorporating this information would reduce the sample of countries considerably. Because
we observe few changes for these policies over time within countries, we instead include a country
fixed-effect in some specifications. Other control variables include the number of substitute drugs
sold locally and the number of products marketed by the originator in country j (both lagged one
period). Finally, a lagged price index that tracks changes in the price of other (older) drugs in
the same ATC3 therapeutic class is included. Our discussion below focuses only on the variables
related to intellectual property.
Tables 7 and 8 present the results of the simplest specifications we estimate. We exclude country
fixed-effects, and focus only on how the existence of a patent affects launch, price and quantity sold.
We distinguish between cases where no patent ever existed (the excluded category), where a drug
had some patent protection that has expired, and where a drug is currently protected by a product
patent (Table 7) or any patent (Table 8). On-patent products are most likely to be launched and to
sell in higher quantities, but also command the highest prices. Products with expired patents sell in
lower quantities and at lower prices than those that are on patent, but higher prices and quantities
relative to those that were never protected. The latter likely reflects the greater availability of
patent protection in richer countries and the greater incentives to seek patents in those markets.
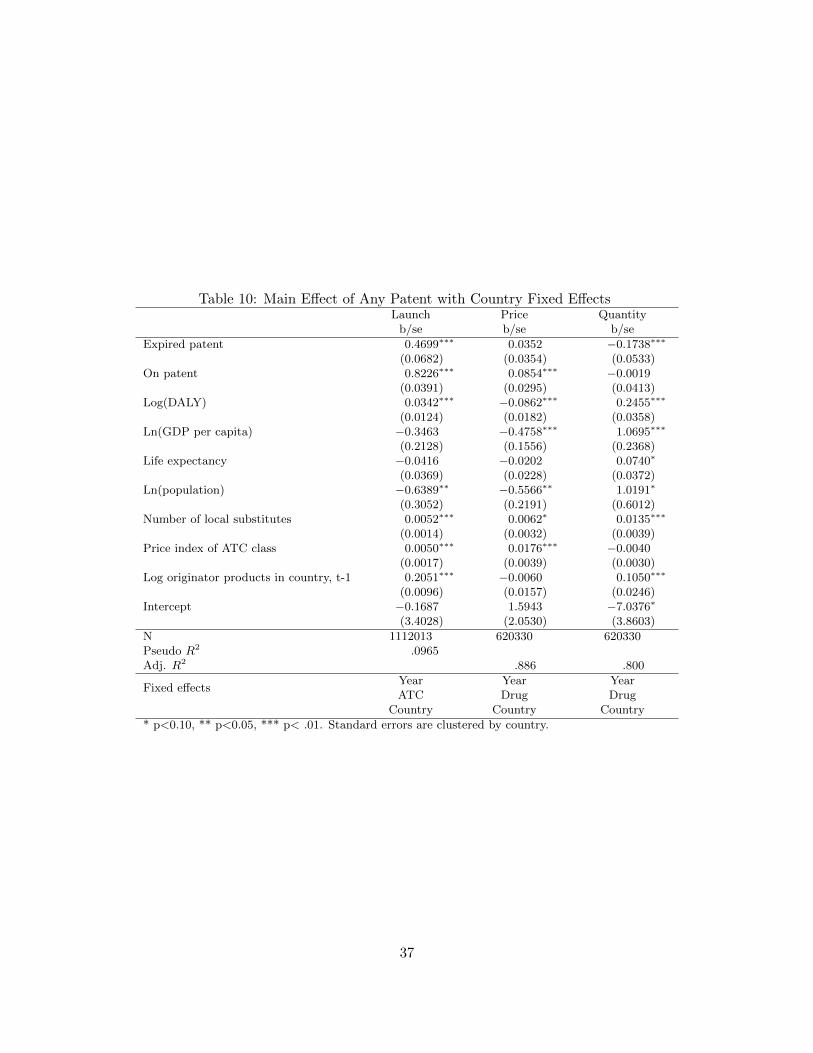
Tables 9 and 10 include country fixed-effects. These absorb time-invariant differences in regula-
tory barriers, the structure of retail and hospital pharmacy distribution, price controls, and other
factors. While the results for product launch are very similar, we find much smaller coefficients
on patent status in the price and quantity regressions. This is not very surprising, since richer
countries generally granted patents earlier than poorer countries and incentives to patent in rich
countries are also probably higher. The price variation associated with patents appears to be driven
mostly by cross-country variation.
5.2 Effects by country income
We next explore whether the importance of patents varies by country income. Demand for pharma-
ceuticals in rich countries tends to be somewhat inelastic, especially when patients have insurance
coverage. In contrast, the average patient in a poorer country may be unable to pay high out-of-
pocket prices or to afford insurance, limiting the ability of originators to exercise any market power
20
provided by patents. We would therefore expect prices to be lower overall in poorer countries, and
for the patent premium to be smaller there. That said, there are reasons to expect deviations from
this pricing pattern. If firms are unable to price discriminate across patients of different income
levels within a country, they may choose to set a high price and sell only to the richest segment in
lower income countries. Governments in rich countries may act as monopsony purchasers or have
greater bargaining power in negotiating prices with pharmaceutical firms than poorer countries.
Both factors suggest that prices may be relatively high in poorer countries, with lower quantities
sold.
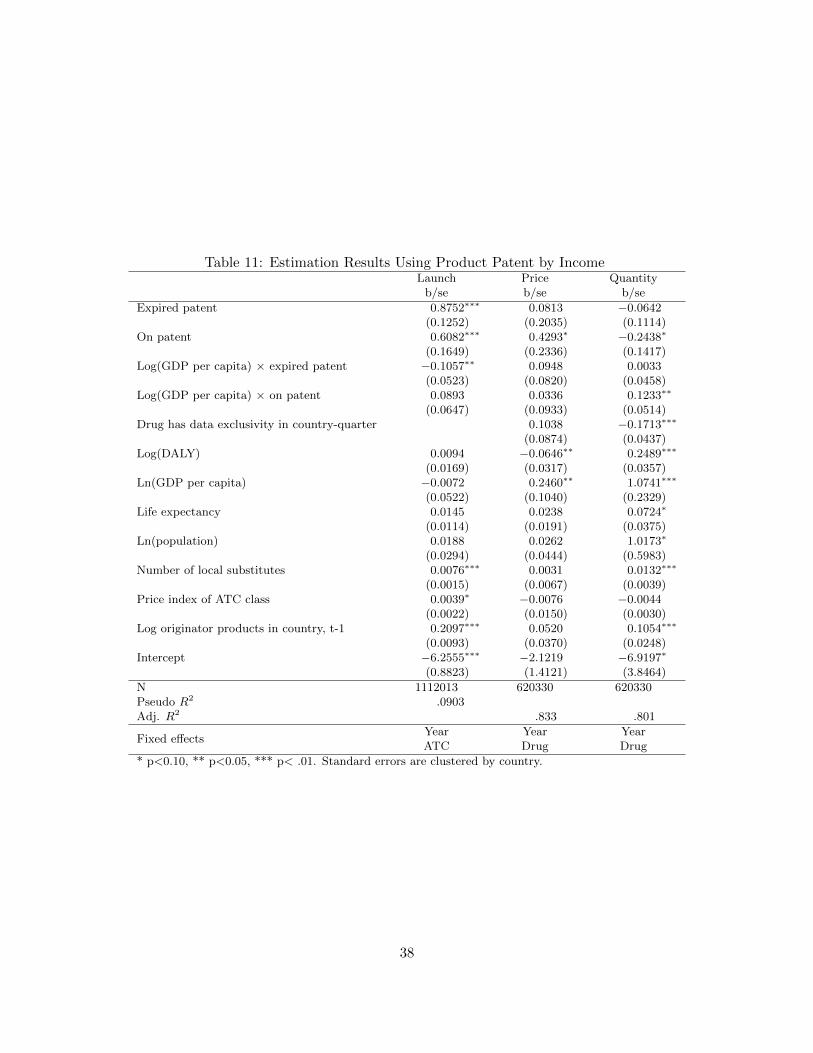
Results from regression specifications that interact patent status with logged GDP per capita
are presented in Tables 11 and 12. We find the most striking differences for launch. Drugs that
are never patented are unlikely to be marketed, regardless of income. Launch of on-patent drugs is
increasing in income, but the opposite is true for drugs with expired patents. In other words, poor
countries are more likely to receive older drugs (meaning they could be sold either by originators or
by generic firms, although we showed earlier that originators are more likely to be first); firms are
less likely to introduce drugs with expired patents in rich countries. Clearly, selection is important.
Drugs that prove unsuccessful in their initial launch markets may never be sold globally. The results
for price also suggest that patents are indeed worth more in richer markets, although differences
between never patented, expired patent and on-patent products are not statistically significant.
That is, differential pricing across countries is not markedly different for on-patent drugs, which is
somewhat surprising. If markets were perfectly competitive in the absence of a patent barrier, we
would expect price to fall to marginal cost and to vary little across countries. In fact, we observe
large price differences across countries regardless of patent status. In the case of quantity, the
estimated difference across patent status is an imprecisely estimated zero. Results using World
Bank income group classifications, shown in Tables 13 and 14, are very similar.
Next, we explore whether TRIPS changed the value of patents. In Tables 15 and 16, we allow
the effect of patents to vary by income group and distinguish between patents granted pre-TRIPS
or post-TRIPS. As described earlier, the same drug can have pre-TRIPS and post-TRIPS patent
status in two different countries, depending on when each complied with TRIPS. Within a country,
we argue that the set of drugs with post-TRIPS patents is also (mostly) exogenously determined
by priority dates and TRIPS deadlines. Figures 2, 3 and 4 provide a graphical summary. Overall,
drugs are more likely to be launched if they have post-TRIPS patents, as well as to sell in higher
quantities. The most surprising result is that the price of such drugs is lower than pre-TRIPS
patented products, on average, in the poorest category of countries.
We interpret these results with caution, since they are driven by a small number of drugs. Most
low and lower middle income countries faced TRIPS compliance deadlines of 2005. Because of
the lengthy drug development cycle, very few drugs first patented after 2005 have been brought to
market by 2013, when our sample ends. Identifying differences is difficult once drug fixed effects are
21
included, and our estimates are noisy. However, the general pattern that emerges is that prices have
not significantly increased post-TRIPS, and quantities have not significantly declined, in relatively
poor countries. We discuss possible explanations in section 5.4. In addition, while we include
drug fixed-effects to control for the quality of a molecule, it is also possible that quality varies
between manufacturers of the same molecule. In recent studies of the quality of drugs available in
pharmacies in the developing world, Bate et al. (2014a) and Bate et al. (2014b) present evidence
of significant quality differences between manufacturers and countries. They find that innovator
products tend to be of higher quality. Thus, higher prices on innovator products may signal quality
in markets where less stringent regulation exists. In the absence of generic competitors, originators
may have less reason to signal quality through price.
5.3 Results using instrumental variables
Our final analysis adopts a different approach to identifying the effect of patent protection. Rather
than grouping products by whether they have pre- or post-TRIPS patents, we use a country’s
compliance with TRIPS as an exogenous shifter for the incentives of firms to seek patents and for
a country to grant them. We can also exploit the exogenously determined (at the time of patent
application) statutory patent term, which should be correlated with patent status but have no
effect on price or quantity except through patent status. The statutory limit should be unrelated
to quality, unlike patent term extensions or other regulatory provisions for market exclusivity. It
should also be unrelated to endogenous challenges (which are more likely for expensive or important
drugs) to a patent’s validity. The statutory patent term is specified by law as years since application
or years since grant. Since the decision to apply (and possibly to grant) is endogenous, we instead
base this definition on the priority date plus 12 or 30 months, depending on a country’s status as a
signatory to the Patent Convention Treaty. As noted above, we focus only on the linear price and
quantity equations, and on a simplified measure of patent status.
Table 17 contains the estimation details for patent status (“stage 0”) and the first stage IV
regressions, where we define “patented” as having any patent protection. In stage 0, we esti-
mate a linear model for patent status using all explanatory variables (including year, country and
drug fixed-effects) plus indicators for whether the priority date fell within the window of TRIPS
compliance and for whether the period is within the statutory term of patent protection. The
latter are both highly significant and economically meaningful. We then generate predicted val-
ues ( PatentedDrug) for patent status, and use these, their square, and their interactions with
income groups as instruments for patent status in the price and quantity regressions. Standard
tests indicate that these instruments are valid.
Table 18 contains the results of IV estimation of price and quantity, with OLS included for
comparison. While the OLS estimates indicate only small differences in price or quantity associated
with patents, the IV estimates point to a much larger effect. The price premium associated with
22
patent protection is large and significant for all income groups except the poorest. This makes
intuitive sense: while patents provide some market power, its exercise (through setting high prices)
is likely to be limited where purchasing power is very low. In rich countries, patents allow the use
of much higher markups. The IV estimates also suggest more use of differential pricing for patented
drugs than do the OLS. Patented drugs sell in higher quantities in most income groups.
The IV estimates rely on the variation explained by the exogenous option of post-TRIPS pro-
tection and pre-determined statutory patent terms, and provide the local average treatment effect
of patents for the subset of cases where this variation changed patent status. The estimated local
average treatment effect of patent status for these products may not be representative for all drugs.
5.4 Discussion
Most of the debate about patented drugs is focused on price, with concerns that patients in poor
countries are unable to afford them. We expected patents to be associated with increased prices, if
patent holders are able to exploit their market power. In general, this is what we find, and concerns
about the effect of IPRs on affordability are certainly valid. However, there are two reasons to be
somewhat optimistic about the effects of patents in developing countries. The price premium
associated with patents is close to zero, on average, in the lower-middle income countries in our
sample. This is true whether we rely on OLS or on IV specifications. These results obscure the
changes specific to the implementation of the TRIPS Agreement in developing countries, however.
In fact, we find that TRIPS has actually been associated with a smaller price difference attributable
to patent protection in the poorest countries in our sample. Pre-TRIPS patented drugs are relatively
more expensive there. The price premium associated with patents is highest in rich countries, and
our estimates of this premium are higher when we control for the endogeneity of patent protection.
Two other measures of access receive less attention, but are worthy of discussion. Most of our
specifications find little difference in the quantities sold associated with patent status, although the
IV estimates show a more worrisome picture in poor countries. Drugs with post-TRIPS patents
have higher sales than those without such protection, however. This suggests that originators invest
in efforts to shift out demand when IPRs protect them from generic competition. Since advertising
and investments in educating patients or health care practitioners would generally spill over to
competitors, it makes sense that originators underinvest in them when facing generic imitation.
We did not have a clear prediction for the effect of patents on launch, but we find across all
specifications that launch of new products is faster in the presence of patents. As was evident from
the summary statistics, patents are not the only barrier to generic entry in practice: even when
patents do not exist, generics may not enter, and they rarely enter first in most markets.
Cockburn et al. (2014), in a study of country-level patent policy and launch incentives in an
earlier period than that covered here, also emphasize the importance of IPRs and access. They
found interesting differences for countries that offered only short process patents versus those with
23
long product patents, but TRIPS has eliminated these cross-country differences. Other authors who
have conducted a recent analysis of the pharmaceutical market in one important developing country,
India, find only a small increase in price post-TRIPS (Duggan et al. (2014)) and note the substantial