Page 1
UNIVERSITY OF ZAGREB
FACULTY OF ELECTRICAL ENGINEERING AND COMPUTING
MASTER THESIS Nr. 608
INTELLIGENT TRADING AGENT FOR
POWER TRADING THROUGH
WHOLESALE MARKET
Ivo Buljević
Zagreb, June 2013
Page 2
SVEUČILIŠTE U ZAGREBU
FAKULTET ELEKTROTEHNIKE I RAČUNARSTVA
DIPLOMSKI RAD br. 608
Inteligentni programski agent za trgovanje
električnom energijom posredstvom
veleprodajnog tržišta
Ivo Buljević
Zagreb, Lipanj 2013.
Page 3
The author wishes to express gratitude to his supervisor, Assist. Prof. Vedran
Podobnik for his help, assistance and guidance through the learning process of
this master thesis. Additionally, the author wishes to express gratitude to Jurica
Babic, MSc, for his guidance and help during the creation of this thesis.
Special thanks to Sinisa Matetic with whom the author formed the development
team for the design and implementation of the CrocodileAgent 2013.
Finally, the author wishes to thank his family members for their valuable support
during the author’s master study.
Page 4
Abbreviations
ICT Information and Communications Technology
PowerTAC Power Trading Agent Competition
RES Renewable Energy Sources
EU European Union
RD&D Research, Development and Demonstration
SG Smart Grid
EISA Energy Independence and Security Act
NIST National Institute of Standards and Technology
AMI Advanced Metering Infrastructure
DER Distributed Energy Resources
EMCAS Electricity Market Complex Adaptive Systems
MAIS Multi Agent Intelligent Simulator
ACE Agent-based Computational Economics
MCP Market Clearing Price
MCV Market Clearing Volume
LMP Locational Marginal Price
ZMCP Zonal Market Clearing Price
TSO Transmission System Operator
MSE Mean Squared Error
NRMSE Normalized Root Mean Squared Error
MPE Mean Percentage Error
MAPE Mean Absolute Percentage Error
ARMA Autoregressive Moving Average
WCR Wholesale Clearing Rate
KPI Key Performance Indicator
Page 5
Table of contents
Introduction............................................................................................................. 1
1. Background and motivation ............................................................................. 2
2. Smart grid ........................................................................................................ 6
2.1. Smart grid benefits ................................................................................... 9
2.2. Smart grid challenges ............................................................................ 10
2.3. Smart grid market modeling ................................................................... 12
2.4. Multi-agent market models ..................................................................... 13
3. Wholesale market ......................................................................................... 15
3.1. History and structure of the wholesale market ....................................... 15
3.1.1. Power exchanges and power pools ................................................ 16
3.1.2. Nodal and zonal pricing .................................................................. 18
3.1.3. Market structure .............................................................................. 19
3.2. Electricity loads and prices ..................................................................... 20
3.2.1. Price spikes..................................................................................... 20
3.2.2. Seasonality ..................................................................................... 22
3.3. Modeling and forecasting electricity loads .............................................. 23
3.3.1. Similar-day method ......................................................................... 25
3.3.2. Exponential smoothing .................................................................... 25
3.3.3. Regression methods ....................................................................... 27
3.3.4. Autoregressive moving average model (ARMA) ............................. 27
3.3.5. Reinforcement learning ................................................................... 28
3.4. Modeling and forecasting electricity prices ............................................. 29
3.4.1. Spike preprocessing ....................................................................... 30
3.4.2. Quality assessment of a price forecast ........................................... 31
3.4.3. Time series models with exogenous variables ................................ 32
Page 6
3.4.4. Interval forecasts ............................................................................. 33
4. Power Trading Agent Competition ................................................................ 34
4.1. Retail market .......................................................................................... 36
4.2. Distribution utility .................................................................................... 36
4.3. Wholesale market .................................................................................. 37
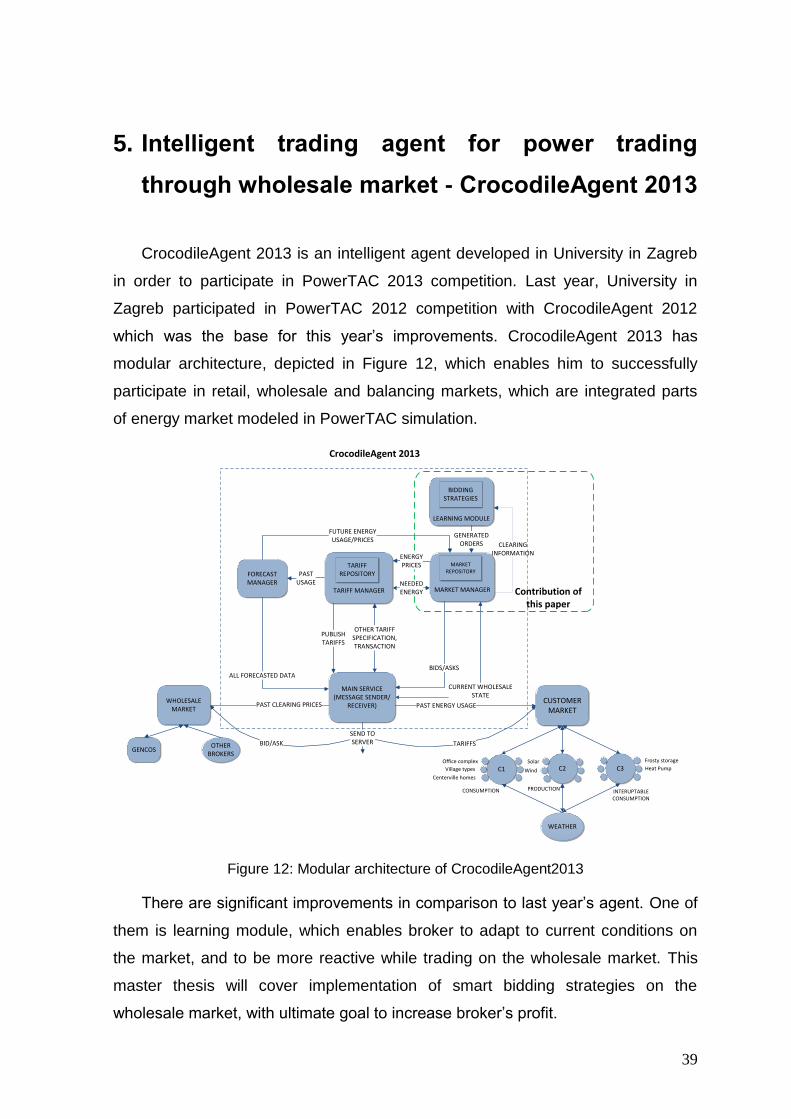
5. Intelligent trading agent for power trading through wholesale market -
CrocodileAgent 2013 ............................................................................................ 39
5.1. Competing in PowerTAC competition .................................................... 40
5.2. Design of CrocodileAgent 2013 ............................................................. 41
5.2.1. Basic order generation .................................................................... 43
5.2.2. Learning module ............................................................................. 44
5.3. Implementation of learning module ........................................................ 49
6. CrocodileAgent 2013 performance evaluation .............................................. 52
6.1.1. Evaluation environment .................................................................. 52
6.1.2. Key Performance Indicators ............................................................ 53
6.1.3. Results and discussion ................................................................... 55
Conclusion............................................................................................................ 60
References ........................................................................................................... 61
Summary .............................................................................................................. 65
Sažetak ................................................................................................................ 66
Page 7
Figures
Figure 1: Architecture of a traditional energy market .............................................. 2
Figure 2: Energy distribution in 2010 ...................................................................... 4
Figure 3: Renewable energy sources through last 5 years .................................... 5
Figure 4: General architecture of a modern smart grid ........................................... 7
Figure 5: Multi-layered smart grid architecture [11] ................................................ 8
Figure 6: One-sided auction in power pool ........................................................... 17
Figure 7: Two-sided auction in power exchange .................................................. 18
Figure 8: An example of the price spikes manifestation ....................................... 21
Figure 9: An example of daily (top chart) and weekly seasonality (bottom chart) . 23
Figure 10: Broker’s interaction in PowerTAC simulation [36]................................ 35
Figure 11: Example of wholesale market clearing process .................................. 38
Figure 12: Modular architecture of CrocodileAgent2013 ...................................... 39
Figure 13: Negative effect of imbalance on the market ........................................ 41
Figure 14: Sequence diagram of order generation ............................................... 44
Figure 15: Architecture of the learning module ..................................................... 45
Figure 16: Example that shows multiple trades for desired timeslot ..................... 47
Figure 17: Example result of modified Erev-Roth method – convergence of best
strategies for each timeframe ............................................................................... 48
Figure 18: Implementation of learning module ..................................................... 50
Figure 19: Sequence diagram describing one iteration of learning module .......... 51
Figure 20: CrocodileAgent’s revenue on the balancing market ............................ 57
Figure 21: Total revenue in observed games ....................................................... 58
Figure 22: Progressive decrease of negative effects on the balancing market .... 59
Page 8
Tables
Table 1: Different application categories in market layer ...................................... 13
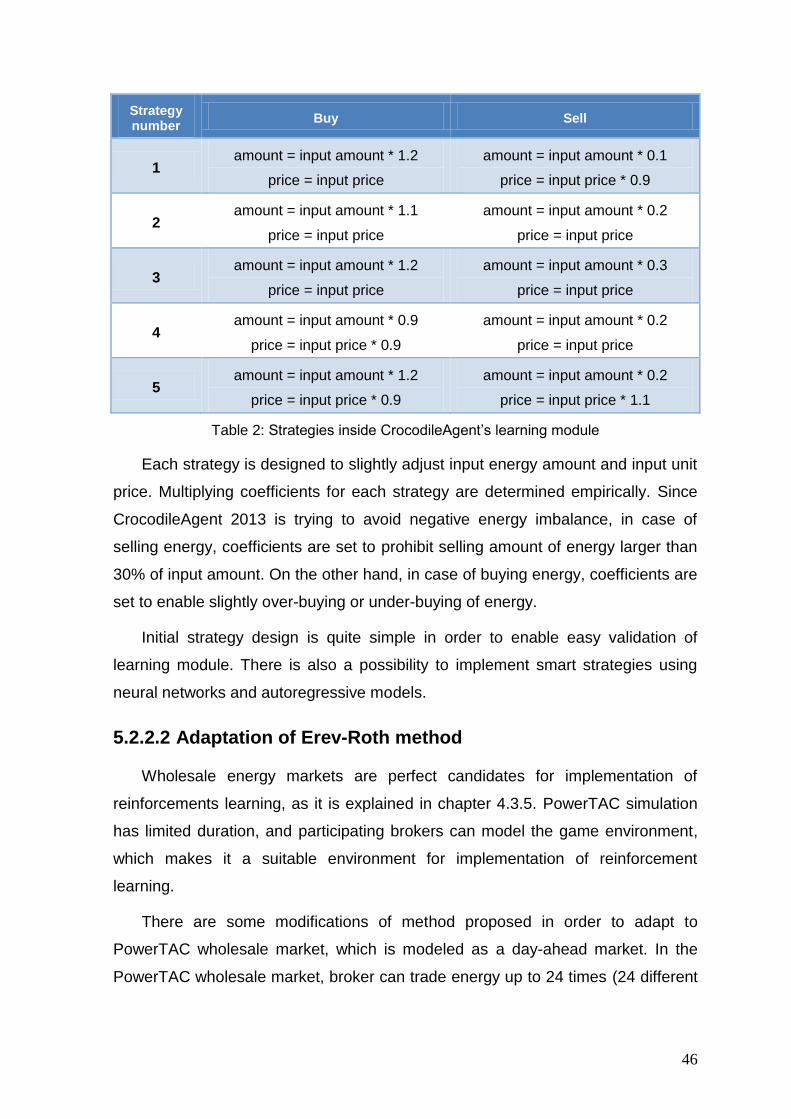
Table 2: Strategies inside CrocodileAgent’s learning module .............................. 46
Table 3: KPIs used to evaluate performance of CrocodileAgent 2013 ................. 54
Table 4: Calculated performance indicators for PowerTAC May trial ................... 55
Table 5: Amount of energy traded by CrocodileAgent on customer, wholesale and
balancing market .................................................................................................. 57
Page 9
1
Introduction
Liberalization and decentralization of energy market has resulted in major
changes in its structure and dynamics, thus creating a regulated and competitive
market environment. To enable further improvements, most of traditional power
grids are introducing novel Information and Communications Technology (ICT)
solutions, progressively transforming into evolved systems called smart grids.
Smart grids enable more efficient energy usage, better communication between
the entities on the market as well as real-time balancing of energy supply and
demand. There is also a possibility for implementing advanced software solutions
to provide a support for trading on the modern energy market. Hence, there is a
need for a risk-free environment in order to test software solutions developed for
modern energy markets.
Power Trading Agent Competition (PowerTAC) is an agent-based competitive
simulation which models a modern energy market, where competing entities
(brokers) offer energy services to customers through tariff contracts and must
serve those customers by trading in a wholesale market. One of the competitors in
PowerTAC 2013 is CrocodileAgent 2013, developed at University in Zagreb. The
main focus of this paper is optimizing CrocodileAgent’s trading in the wholesale
market, in order to improve its general performance.
Background and motivation for designing and improving trade mechanisms in
evolved wholesale energy market are described in the first chapter. Architecture of
smart grids and their characteristics are described in the second chapter. Third
chapter defines structure and mechanisms on today’s wholesale market,
altogether with forecasting methods used on the market. Fourth chapter describes
competitive environment and integrated mechanisms of PowerTAC competition,
used as a test environment for new improvements of intelligent software agent
CrocodileAgent 2013 described in the final chapter. Final chapter also presents
results of CrocodileAgent’s performance evaluation.
Page 10
2
1. Background and motivation
Since the discovery of the light bulb, electricity has made a huge impact in
developing a modern society. Today, it is hard to imagine a life without it. Electric
companies provide every factory and household with a supply of electric energy
and they used to serve various areas from which consumers had to buy their
electric energy. Traditional energy market was centralized in order to ensure
security of supply and efficient production of electric energy. Efficiency was
achieved through economics of scale1. The power sector had a highly vertically
integrated market structure2 with a little competition, but during last two decades
huge changes of electricity market’s structure have taken place all around the
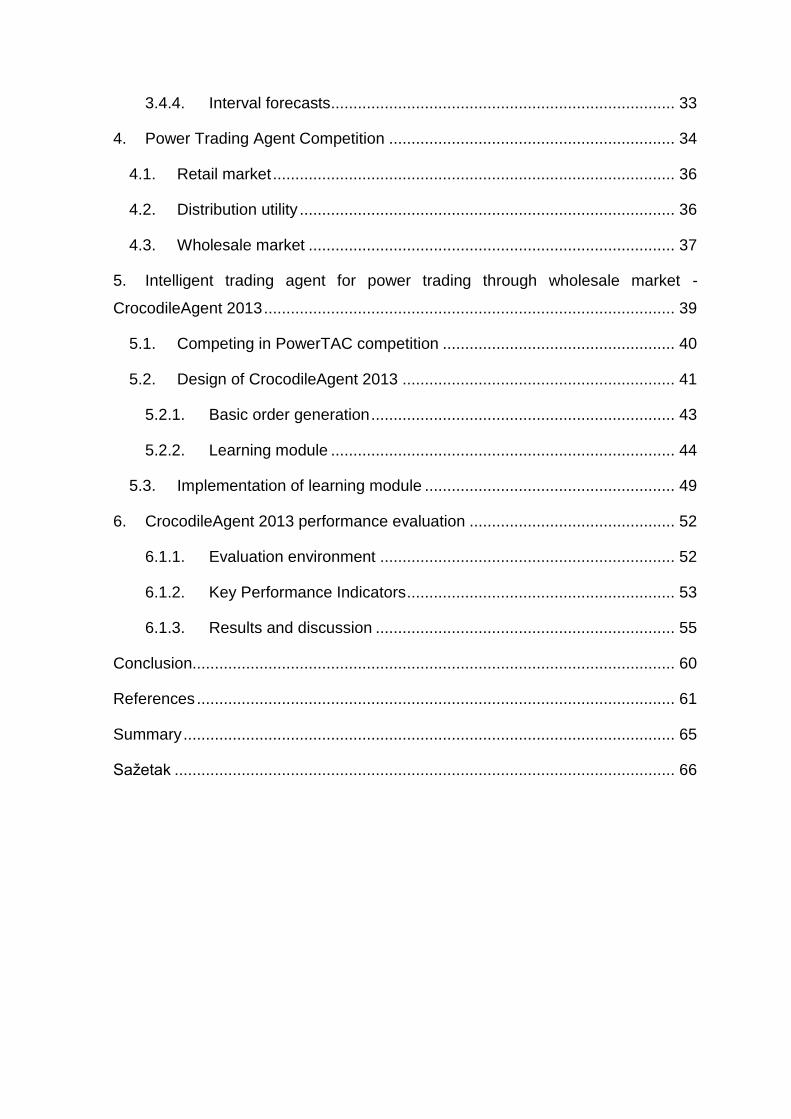
world. The architecture of a traditional energy market is depicted in Figure 1.
Figure 1: Architecture of a traditional energy market
1 The increase in efficiency of production as the number of goods being produced increases.
2 Vendors offer goods and services specific to an industry, trade, profession, or other group of
customers with specialized needs.
Page 11
3
In order to promote competition, traditional structure of energy market has
been replaced by deregulated, competitive structure, where consumers are free to
choose their provider. Electricity exchanges and pools have been organized in
order to enable and enhance trading in these new markets. A power exchange,
though, is not a necessary entity in a deregulated power market. In fact, in most
countries the most of the deals are made on a bilateral basis, on the so-called
over-the-counter (OTC) market3. Establishment of power exchanges has promoted
competition and contributed to the high trading activity, but the main value can be
expressed through providing updated, independent and good-quality market
information which can enhance quality of trading and provide base for further
evolution of electricity market. In a modern, competitive power market electricity
can be traded at market prices, which as a consequence has an increased amount
of risk borne by electric utilities, power producers and marketers. In order to
successfully manage a company in the modern market there is a need for using
statistical analysis and educated guesswork, which involves developing dedicated
statistical techniques and managing huge amounts of data for modeling,
forecasting and pricing purposes.
The second aspect of electricity market’s evolution can be expressed through
strong need to increase number of renewable energy sources (RES, hereafter) in
order to increase sustainability. Non-renewable energy sources were exploited for
over two centuries, however, often with undesirable side effects such as pollution
and other damage to the natural environment. In the second half of the 20th
century, building of nuclear power plants grew in popularity, relieving some
demands on limited fossil fuel reserves, but at the same time, raising safety and
political problems [2]. Even though the RES technologies are constantly
developing, exploitation of non-renewable is growing and will continue in the near
future, resulting in the environment pollution. As a response, there is a need to
establish a sustainable energy policy in order to integrate both renewable and non-
renewable technologies and to minimize utilization of fossil sources.
3 Over-the-counter trading is done directly between two parties, without any supervision of an
exchange.
Page 12
4
In the European Union (EU, hereafter) there is a goal to join liberalization of
electricity sector and reduction of greenhouse gas emission in order to modernize
the energy policy. EU officially started its renewable energy policy through
launching of Research, Development and Demonstration (RD&D) programs from
1974 onwards [2]. In 1974, Madrid Conference laid the basis for the first objectives
for renewable energy at EU level, later formalized in the RES-E whitepaper
“Energy for the future – renewable sources of energy”. According to the Kyoto
Protocol4, commits to reduce emission of greenhouse gases by 8% during period
2008-2012 in comparison to levels in 1990. Regarding that commitment, the 2010
target for electricity was set at 22.1 % as a share of electricity produced from RES
within the EU. Promotion of renewable sources should lead in the long term to
electricity systems based on renewables to a larger extent than today. But
increasing the share of renewable sources in the electricity technology mix
requires strong and efficient regulatory policy support.
According to Renewables 2012 report [3], there is substantial growth of 16.7%
in contribution of RES to global energy consumption in 2010. As it is depicted in
Figure 2, modern RES are accounted for 8.2% in this total, and that share has
increased over last years as a result of technology evolution [3].
Figure 2: Energy distribution in 2010
4 International treaty that sets binding obligations on industrialized countries to reduce emissions of
greenhouse gases.
Page 13
5
Share of energy from traditional biomass has declined to 8.5%. Total of 3.3%
of global energy consumption was supplied by hydropower, and its supply rate is
growing substantially. All other modern renewables provided approximately 4.9%
of energy consumption. During 2011, the growth of modern renewables continued
in all sectors: heating, cooling, power and transport. Wind and solar photovoltaics
accounted for almost 40% and 30% of renewable capacity, respectively, followed
by a hydropower which contributed to renewable capacity with almost 25%. By the
end of 2011 renewables contributed with more than 25% to total global power
capacity (estimated at 5,360 GW in 2011) and supplied an estimated 20.3% of
global electricity. As Figure 3 shows, the fastest-growing RES is solar, which at the
end of 2011 had annual growth of 74%.
Figure 3: Renewable energy sources through last 5 years
As a result of decentralization and liberalization of electricity market, and
increasing trend of using RES, it is necessary to transform existing power grid in
order to provide better control and satisfy increasing demand for electricity. One of
the solutions is to create synergy of already evolved power grid and information
and communications technology (ICT, hereafter) layer in order to create advanced
energy network called smart grid.
Page 14
6
2. Smart grid
The term “Smart Grid” (SG, hereafter) refers to a modernization concept of the
electricity delivery system so it monitors, protects and automatically optimizes the
operation of the modernized power grid, from the central and distributed generator
through the high-voltage transmission network and the distribution system, to
industrial users and building automation systems, to energy storage installations
and to end-use consumers and their thermostats, electric vehicles, appliances and
other household devices [4]. The Energy Independence and Security Act of 20075
(EISA), which directed the National Institute of Standards and Technology6 (NIST)
to coordinate development of this framework and roadmap, states that national
policy supports the creation of a Smart Grid [5]. SG is characterized by a two-way
flow of electricity and information in order to create automated and distributed
energy delivery network. It provides the power grid with benefits of distributed
computing and communications in order to deliver the real-time information and
maintain balance of supply and demand in the power grid. Using modern
information technologies, the SG is capable to deliver electric power more
efficiently and to respond to various conditions and events [6]. Figure 4 shows the
general architecture of modern a SG. Generally, the SG is able to respond to
various events that occur anywhere in the grid, such as power generation,
transmission, distribution, and consumption, and adopt the corresponding
strategies in order to maintain load balance and to supply energy to end-users. For
instance, once a voltage transformer failure event occurs in the distribution grid,
the SG may automatically change the power flow to recover the power delivery
service.
5 Act of Congress concerning the energy policy of the United States.
6 http://www.nist.gov, measurement standards laboratory, otherwise known as a National
Metrological Institute (NMI), which is a non-regulatory agency of the United States Department of
Commerce.
Page 15
7
Figure 4: General architecture of a modern smart grid
Evolution of ICT and its integration into modern SG provided solid base for
two-way communication between entities in SG, in order to maintain balance
through the whole power grid. ICT is the main component of the future Internet,
and one of most important part of the future Internet is Internet of energy, which is
simply a term that describes intelligent, evolved, modern and transformed power
grid, or shortly – SG. A SG extends a traditional power grid with additional
functionalities provided by ICT layer. Multi-layered smart grid architecture along
with its functionalities and correspondent flows is depicted in Figure 5.
Page 16
8
Figure 5: Multi-layered smart grid architecture [11]
The most important feature on the client-side is smart metering, implemented
through an idea of advanced metering infrastructure (AMI, hereafter) with the aim
to improve demand-side management and energy efficiency, and constructing
self-healing reliable grid which can be able to recover after influence of malicious
sabotage and natural disasters [10]. The AMI is the main factor in the smart grid
which enables architecture for automated two-way communication between a
utility company and a smart utility meter. A smart meter is advanced meter
equipment which tracks detailed power consumption and communicates collected
information to the utility company in order to monitor energy load and to bill
consumers [12]. Consumers can be informed of amount of power they are using
so they could control their power consumption, which can result in reduction of
electricity bill and in reduction of greenhouse gas emission. By managing the peak
load through consumer participation, the utility will likely provide electricity at lower
and even rates for all.
Page 17
9
ICT layer in general provides the base infrastructure for wholesale and retail
electricity market and provides connection between energy and market layers of
SG architecture. Energy layer acts similar to traditional power grid, but
implementation is far more complex. As a result of electricity market
decentralization and liberalization, instead of a few large power plants electric
energy is fed into power grid from numerous distributed energy sources. As a
response to decentralization of power sources, there are new limitations in
transmission and distribution of electricity to end-customers in order to satisfy
growing need for electricity supply. Wholesale and retail markets together create a
market layer. ICT layer provides extensive set of information to retail customers
which enables them to make better and more accurate decisions in choosing the
appropriate tariff offered by energy companies. The wholesale market represents
a deregulated market that is used by competitive energy companies buy desired
amount of energy in order to ensure continuous supply for their customers.
2.1. Smart grid benefits
Evolution of traditional power grids into modern SG bring many benefits, which
can be divided in five groups [7]:
Power reliability and power quality: The SG provides more reliable power
supply with fewer and briefer outages, power from renewable energy
sources, and self-healing power systems. Additionally, ICT layer takes care
of global load balancing which can be crucial in load peeks.
Safety and cyber security: The SG continuously monitors itself to detect
unsafe situations which could interrupt its normal operation. State-of-the-art
cyber security is built into all systems and operations including physical
power plant monitoring, and privacy protection of all end-customers.
Energy efficiency: The SG provides reduced total energy usage. Some of
the other benefits are: a reduced peak demand, reduced energy losses,
and the ability to reduce end-customer demand by sending interruption
signals instead of new generation in power system operations.
Page 18
10
Environmental and conservation benefits: The SG is “green”. It helps
reduce greenhouse gases and other pollutants by reducing generation from
inefficient energy sources. It also supports renewable energy sources, and
enables the usage of the plug-in electric vehicles.
Direct financial benefits: The SG offers direct economic benefits as a
result of reduced energy losses and introduction of interruptible demand.
Operations costs are reduced or avoided and customers have pricing
choices and access to energy information.
2.2. Smart grid challenges
Although SG brings many advantages, there are also some challenges as
traditional power grid evolves into modern SG with distributed power sources, two-
way power flows and end-customer interaction [4]. Procedural challenges of the
smart grid evolution are enormous, and need to be met as the SG evolves. Some
of the most important procedural challenges are:
Complexity of the Smart Grid: The SG is enormous complex system, with
some parts sensitive to human interaction and response, and other parts
that needs to react instantaneously and automatically. Speed and aspects
of SG evolution will vary of environmental requirements and also, will be
influenced by financial pressures.
Transition to Smart Grid: Transition to the SG cannot be executed briefly.
It takes a lot of time to prepare and adapt to various conditions that need to
be met in order to complete transition. The SG supports gradual transition
and long coexistence of diverse technologies, not only transition of legacy
systems to modern today equipment, but also transition to equipment of
tomorrow. Transition must be carefully executed in order to avoid
unnecessary expenses and decreases in reliability and safety.
Research and Development: The SG is an evolving goal and final stage of
evolution cannot be exactly predicted. The smart grid will demand
continuing R&D to assess the evolving benefits and costs, and to anticipate
the evolving requirements.
Page 19
11
Regulatory and Policy: In order to maintain consistent regulatory and
energy policy framework over a long transition period, there are many
regulatory conditions which need to be met. Conditions vary of regulatory
system which is different for every country.
Although the backbone of SG evolution is modern technology that supports
ICT layer, there are still many challenges that need to be met:
Smart equipment: Smart equipment refers to all equipment which is
computer-based or microprocessor-based, including controllers, remote
terminal units and intelligent electronic devices [12]. It also refers to the
equipment inside homes, buildings and industrial facilities, mostly used for
smart metering. Smart equipment also includes electromechanical
switches, voltage controllers, and other older hardware that have been
equipped with sensors and controls in order to monitor state, transmit that
state for analysis, and execute control commands that are result from
analysis. Some of these instruments have integrated units used for
intelligent data processing, and they are used when remote analysis is
unnecessary or not economical. This embedded computing equipment must
be robust to handle future applications for many years without being
replaced.
Communication systems: Communication systems refer to the network
infrastructure and communication protocols used to transmit collected data
through SG using ICT layer [14]. These technologies are in various stages
of maturity, hence SG must be robust enough to accommodate protocols
and formats that emerge daily from the communications industries..
Data management: Data management refers to all aspects of collecting,
analyzing, storing, and providing data to users and applications, including
issues of data identification, validation, accuracy, updating and consistency
across databases. Data management methods which work well for small
amounts of data usually do not work for large amounts of data generated in
SG. In many cases entirely new data models and techniques such as data-
warehousing and data-mining are being applied in order to handle the huge
amount of data which additionally increases as a result of synchronization
Page 20
12
between old and modern databases. Data management is among the most
time-consuming and difficult task and must be addressed in a way that will
be scalable.
Software applications: Software applications refer to programs,
algorithms, calculations, and data analysis used to process data collected in
SG. Applications can range from low level control algorithms to massive
software systems to support transaction processing. Application
requirements are becoming more sophisticated in order to solve complex
problems, and are demanding ever more accurate data in order to deliver
results more quickly and accurately. Software solutions are also evolving
and shifting to services oriented architecture built upon on a robust
analysis, simulation and data management infrastructure. Software
engineering is still emerging as a discipline and it is crucial in DG evolution
because software solutions are at the core of every function and node of
the SG [13].
2.3. Smart grid market modeling
Market layer is a very important part of the SG ecosystem. While the transition
to the SG may unfold over many years, market layer is rapidly evolving. The main
reason for progressive evolution of the market layer is potential possibility for
electricity companies to make profit by trading energy on wholesale and retail
market. Actors in the market layer exchanges price and balance supply and
demand within the power system. The communication between the market layer
and the domains supplying energy is crucial because efficient balancing between
production and consumption is dependent on market domain. Energy supply
domains include the Bulk Generation domain and Distributed Energy Resources
(DER, hereafter) [15]. DER is represented in the transmission, distribution and
customer domains, and it is typically served through aggregators. Communication
for market interactions must be reliable and traceable. As the percentage of
energy supplied by small DER increases, allowed latency in communications with
other resources must be reduced. Table 1 shows different application categories in
market layer.
Page 21
13
Application category Description
Market Management Includes wholesale market exchanges for various regions,
altogether with transmission and services and demand
response markets.
Retailing Retailers sell power to end-customers and may in the future aggregate or trade DER between customers or into the market. Most are connected to a various trading organizations to allow participation in the wholesale market.
DER aggregation Aggregators combine smaller participants to enable distributed resources in order to participate in larger markets.
Trading Traders participate in markets, which include aggregators and other qualified entities, in order to make profit only by buying and selling energy.
Market operations Functions that make particular market function run smoothly. It includs financial and goods sold clearing, price quotation streams and balancing.
Table 1: Different application categories in market layer
The high-priority challenges in the market domain are extension of price and
DER signals to customer domain, simplification of market rules, expanding the
capabilities of aggregators and interoperability across all providers and consumers
of market information. Also, there is a need to manage and regulate growth of
energy trading on retail and wholesale market, and to further improve
communication mechanisms for prices and energy information throughout market
and consumer domains.
2.4. Multi-agent market models
Although there are many benefits from electricity market’s decentralization and
its evolution to SG, there are many challenges in designing such decentralized
systems and predicting their impact on economy [16]. Recently there were some
unsuccessful attempts to deploy such systems, i.e. California energy market and
collapse of Enron, which showed that successful deploy of modern electricity
market takes a lot of effort in market design and planning of demand response,
capacity reserves and risk management [17]. Therefore, it is very important to
Page 22
14
thoroughly test system design proposals in a risk free simulated environment
before deploying these ideas into the real world.
Agent-based modeling and simulation has emerged over the last few years as
a powerful tool for testing end evaluating new solutions in energy sector [18].
There are few examples of such implementation. First, Electricity Market Complex
Adaptive Systems Model (EMCAS) is an agent simulation that models an electric
power system [19]. An EMCAS simulation includes both the customers who
represent the end users of electricity and the demand companies from whom they
purchase electricity. Agents inside simulation interact on several layers, including
a physical layer, several business layers and a regulatory layer. Second solution is
Multi Agent Intelligent Simulator (MAIS) and it serves as an agent-based support
for analyzing dynamic price changes in the U.S. wholesale market. MAIS
generates artificially numerous trading agents equipped with different learning
capabilities and duplicates their bidding strategies in the California electricity
markets during the crisis period [16].
Software agents are also used in the field of Agent-based Computational
Economics (ACE) [19] that studies economic processes, including whole
economies, as dynamic systems of interacting agents. ACE models can be
exploited in many areas related to SG, such as understanding and evaluating
market designs, evaluating the interactions of automated markets and trading
agents, creating rich economic decision environments for human-subject
experiments, and advising policy makers on the expected behaviors of markets or
market interventions. ACE can be used to construct a rich simulated market
environment in which agents face each other, representing trading entities in real-
world market.
Page 23
15
3. Wholesale market
There is an ongoing liberalization of energy market that is taking place in many
countries over last two decades [25]. The main motivation for liberalization of
power sectors worldwide is unbundling the vertically integrated monopoly
structures that has traditionally managed generation, distribution and transport of
energy. The introduction of competition on the market has been encouraged in
order to introduce market forces in industry that was for many years constructed
as a natural monopoly. The breach of natural monopoly has been enabled due to
changes in generation technologies and modernization of energy transmission.
Therefore the motivation behind electricity liberalization is, in the long run, to
promote efficiency gains, to stimulate technical innovation and to lead to efficient
investment.
3.1. History and structure of the wholesale market
Energy market liberalization was pioneered by Chile in 1982, by reform based
on the idea of separate generation and distribution companies [21]. Formula used
for calculating energy price was constructed as a function of the energy cost, cost
of a dispatch system and a system of trading power between generators. Further
implementation continued in 1986 and resulted with a partial vertical disintegration
of the energy sector and formation of a wholesale energy trading mechanism. The
Chilean reform was followed by the restructuring of the British and Welsh
electricity sector in 1990s. Furthermore, the Nordic market opened in 1992 and
Australian market began operating in 1994. There were a number of markets in
northeast America opened in late the 1990s, followed by California in 1998 and
Texas and Alberta three years later [26]. Number of liberalized electricity markets
is growing worldwide, but the trend is most visible in Europe. Some of the pioneers
in the electricity market reform have been successfully operating for over a
decade, while others have made major changes in order to improve performance
and survive. There are also some cases of failure in reformation of electricity
Page 24
16
market (e.g. California market crash in 2001 [17]), which are sometimes used to
argue that electricity market liberalization is still not flawless.
3.1.1. Power exchanges and power pools
There is a need for organized markets at the wholesale level as a result of
market liberalization. There are two types of market that emerged: power pools
and power exchanges. They share many characteristics and it’s not always trivial
to distinguish them. The oldest and one of the most mature power exchanges in
the world is called NASDAQ OMX7. Also, there are two types of power pools that
can be identifies – technical and economic [22]. Technical power pools or
generation pools have always existed. Vertically integrated utilities used a pool
system to optimize generation with respect to cost minimization. In such a system
the power plants were ranked based on costs of production. Hence, generation
costs and network constraints were the determining factor for dispatch. Trading
activities were limited to transactions between utilities from different areas and
international trade activity was limited, due to a low level of interconnection
capacity.
Economic pools or simply power pools have been established to facilitate
competition between generators. They have been created as a result of public
initiative by governments willing to introduce competition in generation of energy.
Power pools have been used worldwide, for instance, in England and Wales [24].
Participation in an economic pool is mandatory, hence no trade is allowed outside
the pool. Participants bid based on the prices at which they are willing to run their
own power plants. The market clearing price (MCP, hereafter) is established
through a one-sided auction as the intersection of the supply curve constructed
from aggregated supply bids and the estimated demand, which automatically
defines the market clearing volume (MCV, hereafter). One-sided auction is
depicted in Figure 6.
7 NASDAQ OMX is the single financial energy market for Norway, Denmark, Sweden and Finland.
Before 1 November 2010, it was known by the name Nord Pool.
Page 25
17
Pri
ce
MCP
MCVVolume
Supply curve Estimated demand
Figure 6: One-sided auction in power pool
Bids can be very complex, because of the technical aspects involved. Hence,
the price determination mechanism requires complex optimizations which require
computationally demanding operations.
On the other hand, power exchange is usually launched by a combination of
generators, distributors and traders in order to create common marketplace for
energy exchange. Many of European markets are based on power exchange
model, and they are usually organized as a day-ahead electricity market [25]. The
main role of a power exchange is to match the supply and demand in order to
determine a publicly announced MCP. Generally, MCP is established as a result of
two-sided auction that is conducted once a day. It is constructed as the
intersection of the supply curve constructed from aggregated supply bids, and the
demand curve constructed from aggregated demand bids, as depicted on Figure
7.
Page 26
18
Pri
ce
MCP
MCVVolume
Supply curve Estimated demand
Figure 7: Two-sided auction in power exchange
Buyers and suppliers can submit their bids and offers for each hour of the next
day, and MCP is calculated hourly as a result of balancing supply and demand. In
uniform-price auction market buyer whose bids are higher or equal to the MCP pay
that exact price (MCP), regardless of their actual bids. Respectively, suppliers
whose bids are below or equal to the MCP also pays that same price. In contrast,
in pay-as-bid auction market a supplier would be paid exactly for the amount he
listed in his bid, which leads to a problem because as a result of transaction there
is generated extra money paid by buyer but not paid to suppliers. There are many
pros and cons for each of the models, but in practice, most markets have adopted
the uniform-price auction design.
3.1.2. Nodal and zonal pricing
In cases when there is no transmission congestion8, MCP is the only price in
the market. When there is an occurrence of transmission congestion, there are two
types of prices that can be introduced into market: locational marginal price (LMP,
hereafter) and zonal market clearing price (ZMCP, hereafter).
8 Event that occurs when there is insufficient energy to meet the demands of all customers.
Page 27
19
LMP can be expressed as a sum of generation marginal cost, transmission
congestion cost and the cost of marginal losses, which can sometimes be ignored.
Cost of marginal losses is usually area-dependent, and can be different for various
nodes. Nodal prices are the ideal reference because the electricity value is
function of place of generation and place of delivery. However, LMP usually comes
with complexity of the pricing mechanisms, and could generate higher transaction
costs.
In ZMCP concept, prices are the same within the zone, but they may vary
depending of different zones and areas. The concept is mostly used in zones in
which transmission congestion is expected to occur infrequently or has low cost of
congestion management.
Locational pricing is widely used in meshed North American energy markets
as a result of market’s locational division caused by transmission lines. Zonal
concept is more suitable for simpler electricity systems, such as in Australia.
European market is very interesting because although it is quite complex, it is
evolving into electricity market with zonal division, where zone is consisted of
entire country [21] [26].
3.1.3. Market structure
In the energy market, the MCP is commonly known as the spot price. The spot
electricity market is actually a day-ahead market in which the entities trade the
energy for the next day, which differs from the actual definition of a spot market,
characterized by immediate delivery and prolonged period of two days for financial
settlement. Spot market is not suitable for energy market since transmission
system operator (TSO, hereafter) requires advanced notice for energy distribution
in order to ensure reliability of energy transmission. In short time periods before
the delivery of energy, the TSO operates the balancing market in order to balance
deviations in supply and demand contracts. The TSO needs to be able to call in
extra production at very short notice, since the deviations needs to be corrected in
short period measured in minutes or even seconds, in order to ensure energy
delivery and to keep the system in balance. Spot and balancing markets are
complimentary and although their functioning is quite different, they cannot
function without each other. Balancing market is not the only technical market. In
Page 28
20
order to minimize reaction time in case of supply and demand deviation, TSO runs
the assistant market which provides energy reserve and generating capacity
market, which is used to temporarily invest in new generating capacity. Design and
implementation of such a market requires a lot of work and knowledge due to its
complexity and to responsibility to deliver energy to end-customers without
disturbing the balance in the market.
3.2. Electricity loads and prices
In order to optimize and maintain balance on the day-ahead energy market,
there is a strong need to determine and predict two essential values: energy load
and energy price. Although there is a possibility for a manifestation of unpredicted
load spikes whose effects can be minimized by using ancillary market
mechanisms, price spikes are more common on the real day-ahead market.
Another phenomenon frequently manifested on the market is seasonality and it is
a result of pattern in energy consumption of end-users.
3.2.1. Price spikes
One of the features on the electricity markets are extreme changes in the spot
prices known as jumps or spikes. In a short period of time, the price can increase
temporarily and then drop back to the previous level. These temporary price
escalations are responsible for a large part of the total price variation and the
entities that are not prepared to manage the risk arising from price spikes can lose
huge amount of money in a few hours. There is a measure that describes standard
deviation of trading goods – volatility. As stated in [21], treasury bills have a
volatility of less than 0.5%, stocks have a moderate volatility of about 1-15%,
crude oil have volatility of 1.5-4%. Electricity has extreme volatility – up to 50%.
The spike intensity is non-homogeneous in time. The spikes are especially
high during peak hours - around 09:00 and 18:00 on business days and during
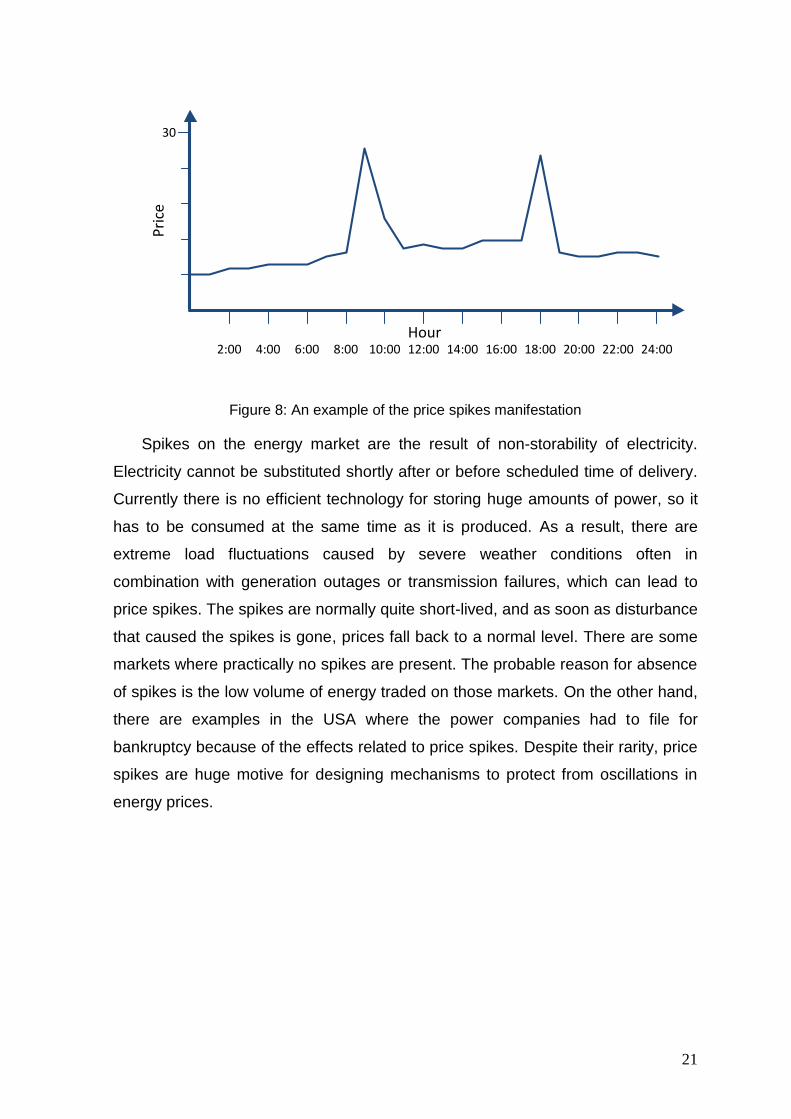
high-consumption period in areas with harsh weather conditions [27]. Figure 8
depicts an example of the price spikes manifestation at 6:00 and 18:00. It is not
uncommon that prices can increase 10 times within few hours. As the time window
increases and more data aggregates spikes manifestation is getting weaker.
Page 29
21
2:00 4:00 6:00 8:00 10:00 12:00 14:00 16:00 18:00 20:00 22:00 24:00
30
Pri
ce
Hour
Figure 8: An example of the price spikes manifestation
Spikes on the energy market are the result of non-storability of electricity.
Electricity cannot be substituted shortly after or before scheduled time of delivery.
Currently there is no efficient technology for storing huge amounts of power, so it
has to be consumed at the same time as it is produced. As a result, there are
extreme load fluctuations caused by severe weather conditions often in
combination with generation outages or transmission failures, which can lead to
price spikes. The spikes are normally quite short-lived, and as soon as disturbance
that caused the spikes is gone, prices fall back to a normal level. There are some
markets where practically no spikes are present. The probable reason for absence
of spikes is the low volume of energy traded on those markets. On the other hand,
there are examples in the USA where the power companies had to file for
bankruptcy because of the effects related to price spikes. Despite their rarity, price
spikes are huge motive for designing mechanisms to protect from oscillations in
energy prices.
Page 30
22
3.2.2. Seasonality
Seasonality is a component of a time series which is defined as the repetitive
and predictable movement around the trend line in definite time period. It is known
that energy demand on the market exhibits seasonal fluctuations, which are
usually, result of changing climate conditions, like temperature and number of
climate hours. In some countries, there are also seasonal variations manifested in
supply-side. Hydro units, for example, are heavily dependent on precipitation and
snow melting, which varies from season to season. These seasonal fluctuations in
demand and supply translate into seasonal behavior of electricity prices and spot
prices in particular [28]. There are few levels of granulation when it comes to term
of seasonality:
Annual seasonality – it is mostly manifested because of change of
seasons. It can be approximated by sinusoidal function – high prices in
winter time and low prices during summer;
Weekly seasonality – it is related to the business day – weekend structure.
In the weekdays prices are higher than those during the weekends, when
major businesses are closed.
Daily seasonality – fluctuations that happen every day. Higher than
average prices are observed during the morning and evening peaks, while
midday and night prices tend to be lower than average. This corresponds
to the time of day when people normally get up and go to work, and when
they come home from work.
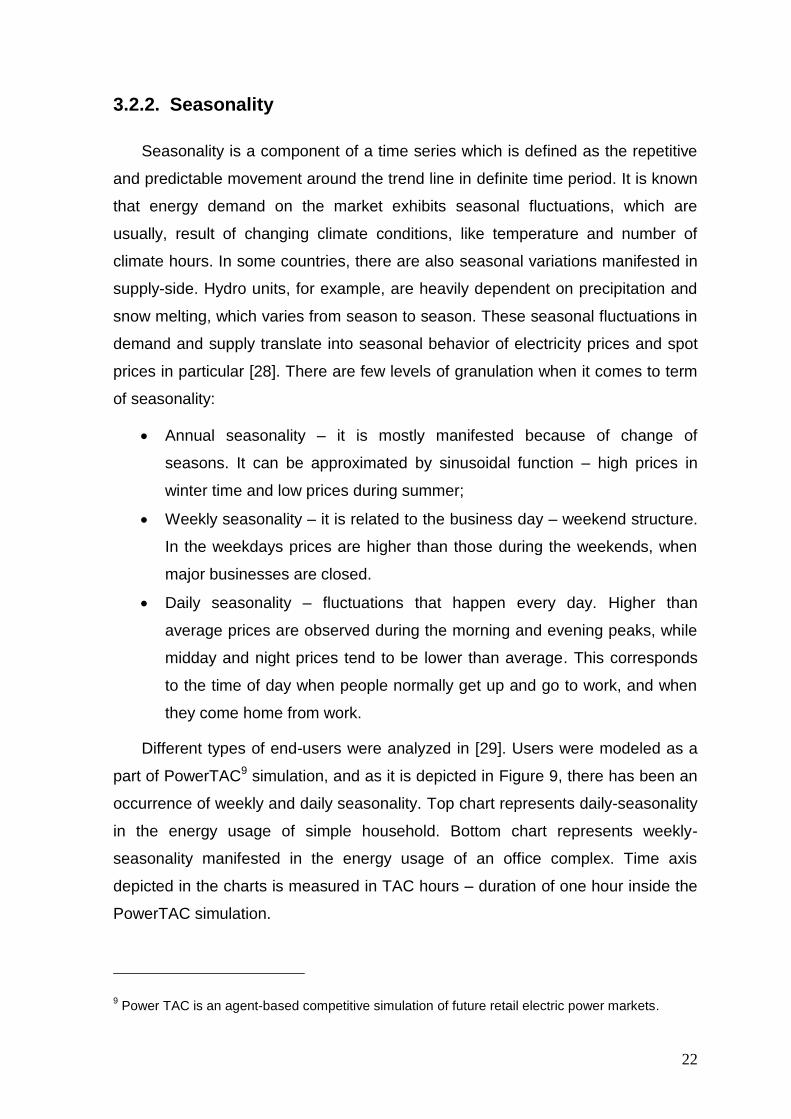
Different types of end-users were analyzed in [29]. Users were modeled as a
part of PowerTAC9 simulation, and as it is depicted in Figure 9, there has been an
occurrence of weekly and daily seasonality. Top chart represents daily-seasonality
in the energy usage of simple household. Bottom chart represents weekly-
seasonality manifested in the energy usage of an office complex. Time axis
depicted in the charts is measured in TAC hours – duration of one hour inside the
PowerTAC simulation.
9 Power TAC is an agent-based competitive simulation of future retail electric power markets.
Page 31
23
Figure 9: An example of daily (top chart) and weekly seasonality (bottom chart)
3.3. Modeling and forecasting electricity loads
In an evolved and competitive energy market the electricity is traded at market
prices10. As a consequence, there is increased amount of risk borne by power
producers, electric utilities and marketers. Management of a successful company
on today’s modern deregulated market requires a big amount of statistical analysis
and educated guesswork. Energy demand may differ from expected amount
stated in the contract and the actual volume available for trade may not be enough
to cover produced costs. A deregulation of the market and introduction of
competition has made forecasting a necessity for all market players. On today’s
deregulated market, over-contracting or under-contracting energy must be
balanced on the balancing marker, which can lead to serious financial loss. As a
result, load forecasting has become the central process in the planning and
10 Market price is the economic price for which a good or service is offered in the marketplace.
Off
ice
co
mp
lex
En
erg
y u
sa
ge (
GW
h)
Ho
us
ho
ld e
nerg
y
usa
ge (
MW
h)
TAC hours
TAC hours
Page 32
24
operation of electric utilities, energy suppliers, system operators and other market
participants. The basic quantity of interest is typically the hourly load demanded by
end-customers. However, load forecasting is also concerned with the prediction of
hourly, daily, weekly and monthly values of the system load and peak system load.
The forecasts for different time horizons are important for different operations
within a company. Error of the forecast depends on the time horizons and it is
possible to predict energy load for the next day with error minimized down to few
percent. Typically load forecasting is classified in terms of the time horizon’s
duration, as short-term (STLF, hereafter), medium-term (MTLF, hereafter) and
long-term load forecasting (LTLF, hereafter). STLF forecasting methods are used
in operational phase of energy market in order to minimize energy imbalance. On
the other hand, MTLF and LTLF forecasting methods are required for maintenance
scheduling, fuel planning and planning of generation and transmission expansion.
Short-term load forecasting has become increasingly important since the rise
of competitive energy markets. With fluctuations of supply and demand, there is a
possibility of manifestation of price spikes which leads to huge financial loss. STLF
can help to estimate energy demand in order to reduce effect of price spikes and
to make decisions that can prevent energy overload. Hence, hourly and daily
forecasts, which can be classified as STLF, are primary interest in everyday
energy market operation. A large variety of methods and ideas have been tried for
load forecasting, with varying degrees of success. They may be classified into two
broad categories:
Statistical approach; and
Artificial intelligence-based techniques.
The statistical methods forecast the current load value by combining previous
load information and previous or current values of exogenous factors, typically
weather information and social variables. On the other hand, artificial intelligence-
based methods are more flexible and can handle more complex situations on the
market. Among these methods, neural networks have probably received the most
attention. The employed algorithms automatically classify the input data and
associate it with the respective output values, so there is no human supervision
needed. This simplicity is at the same time their limitation.
Page 33
25
The most suitable method for a particular company can be chosen only by
testing various methods on real data. As in some cases there are no particular
winners, many companies use several load forecasting methods combined or,
often in cooperation with academics, create hybrid solutions that will suit to their
particular needs.
3.3.1. Similar-day method
This simple approach is based on searching historical data for days with
similar characteristics to the forecasted day. Similar characteristics may include
day of the week, day of the year or even exogenous conditions, like weather
information. The similar-day method can be also used for modeling energy load for
some holiday. In that case, a search is conducted on the historical data in range
on few years. The load of a similar day is considered as a forecast. Instead of a
single similar-day load, the forecast can be a linear combination or a result of
regression11 that can combine several similar-days. The simplest, yet in some
cases surprisingly powerful implementation of the similar-day method can be as
follows: a Monday is similar to last Monday, and the same rule applies for
Saturdays and Sundays; analogously, a Tuesday is similar to the previous
Monday, and the same rule applies for Wednesdays, Thursdays and Fridays. This
method can be used as a benchmark for more sophisticated models.
3.3.2. Exponential smoothing
Exponential smoothing is one of the statistic methods used to forecast energy
load on the market. Using this method, prediction is constructed from an
exponentially weighted average of past observations. The accuracy of exponential
smoothing has led to its widespread use in a variety of applications. The idea is to
aggregate historic data and to assign a weight to every value in order to achieve
that the newer data have greater impact on predicting future values [30]. Simple
exponential smoothing is based on weighting, where exponentially smaller weights
are assigned to older observations:
11 A statistical technique for estimating the relationships among the variables.
Page 34
26
(3.1)
When applied recursively to each successive value in the series, each new
smoothed value is computed as the weighted average of the current value and the
previous smoothed value. In effect, each smoothed value is the weighted average
of the previous values, where the weights decrease exponentially depending on
the value of parameter .
Since energy load tends to show seasonal characteristic, there have been
introduced more advanced exponential smoothing methods in order to provide
more accurate forecast. As far as electricity load forecasting is concerned the
implementation of following Holt-Winter’s method has showed notable results [29]
[31] [32]:
(3.2)
(3.3)
(3.4)
(3.5)
where listed variables are:
F – forecasted value;
h – time horizon;
l – level of time series;
T – trend of time series;
S – seasonal adjustment;
p – period of seasonal component; and
constants which must be chosen for the smallest sum of the
squared forecast errors one of the following methods: MSE (mean squared
error), NRMSE (normalized root mean squared error), MPE (mean
percentage error) and MAPE (mean absolute percentage error).
Page 35
27
Proposed Holt-Winter’s method was tested in PowerTAC simulation, as
described in [29]. Implementation showed notable results when tested on end-
consumers with seasonal energy consumption.
3.3.3. Regression methods
Regression is one of the most widely used statistical techniques [31]. The
general purpose of multiple regression is to learn more about the relationship
between several independent variables and a dependent variable. Multiple
regression is based on method of least squares. The model is fit in a way that the
sum of squares of differences between observed and predicted values is minimal.
For energy load forecasting regression methods are usually used to model the
relationship of load and other factors such as weather, day type and customer
type. The model expresses the load as a linear function of one or more
explanatory variables and an error term:
(3.6)
where is the load, describe independent variables correlated with load,
describes regression coefficients, and is noise. Independent variables can be
simple, as weather conditions, but they can also be described as complex
functions of simple variables.
In its classical form, multiple regression assumes that the relationship between
variables is linear, but sometimes in the real-life implementation there are possible
some deviations from the basic assumption [33]. Despite the large number of
alternatives the linear regression models are still among the most popular load-
forecasting approaches.
3.3.4. Autoregressive moving average model (ARMA)
Autoregressive moving average model is often used to predict energy load on
the market. It is based on the moving average (MA, hereafter) model in which the
Page 36
28
time series is regarded as an unevenly weighted moving average of a random
shock series12 . The moving average model of order q is defined by:
∑
(3.7)
MA models are not very useful in forecasting applications, but it its
autoregressive form, it is a very powerful tool. In the ARMA model the current
value of the time series is expressed linearly in terms of its past values and in
terms of previous values of the noise [34]. The autoregressive moving average
model of order (p, q) can be written as:
∑
∑
(3.8)
Autoregressive moving average models have been extensively applied to
energy load forecasting. There are also two modifications of this model:
autoregressive moving integrated average model and seasonal autoregressive
moving integrated average model and both of them are successfully implemented
on various energy markets. Second one is used to forecast values on the set of
date with expressed seasonality.
3.3.5. Reinforcement learning
Reinforcement learning is a type of a learning concerned with how an agent
should take actions in an environment, in order to maximize a numerical reward
signal. The learner is not told which actions to take, as in most forms of machine
learning, but instead, the learner must discover which actions result with the
highest reward [38]. In some cases, actions may affect not only the immediate
reward but also the next situation and, through that, all subsequent rewards.
Reinforcement learning is different from supervised learning and artificial
neural networks, which can be classified as a form of unsupervised learning.
Supervised learning is learning from examples provided by an external supervisor.
12 Random shock is noise that does not follow a predictable pattern.
Page 37
29
Although this learning has many qualities, it is not adequate for learning from
interaction. In interactive problems (i.e. wholesale trading in energy market
simulation) it is often impractical to choose examples of desired behavior that are
both correct for some scenario. Reinforcement learning enables agent to learn
from its own experience and to determine which decision is the best in some
particular situation.
Wholesale market also acts like environment in which all decisions are correct,
but only some of them can yield maximum profit. Hence, entities competing in the
wholesale market are able to use reinforcement learning to improve their bidding
strategies. Paper by Weidlich and Veit [39] describes several adaptations of
reinforcement learning methods suitable for the wholesale market:
Q-Learning;
Learning Classifier Systems;
Supply function optimizing agents; and
Erev-Roth method.
Weidlich and Veit describe in their paper detailed implementation and usage of
Erev-Roth method, which can be defined as following:
{
(3.9)
∑
(3.10)
where is calculated action value, M is number of actions, is probability of
choosing specific action and , and are coefficients which need to be
determined empirically. There are many variations and implementations of a base
Erev-Roth method and one of them is explained in detail in chapter 6.2.2.3.
3.4. Modeling and forecasting electricity prices
With energy market deregulation and introduction of competition, new
challenges have emerged on the market. One of them is caused by extreme price
volatility and it has forced market players to cope with unstable price movements,
Page 38
30
along with energy load variations. Price forecasting has become a fundamental
tool in creating a strategy development for trading on the energy market. This was
a reason to increase number of researches in electricity price modeling and
forecasting. The proposed solutions are classified based on the time horizon’s
duration. It is customary to talk about short-term (STPF, hereafter), medium-term
(MTPF, hereafter) and long-term price forecasting (LTPF, hereafter).
The main objective of LTPF is planning of investment, such as determining the
future sites or sources of fuel for power plants. MTPF or monthly time horizons are
generally preferred for balance sheet calculations and risk management. It is
mostly used to evaluate distribution of future prices over some longer period. But,
when bidding on auction-type energy market, participants need to forecast spot
price, because their orders will clear only if they are below/above MCP, depending
whether it is ask or bid. Since the day-ahead market typically consists of 24 hourly
auctions that take place simultaneously one day in advance, STPF with time
horizons from a few hours to a few days is of great importance in daily market
operations.
As far as the modeling and forecasting techniques are concerned, generally
they can be traced back to models that originate either in electrical engineering or
in general market models. On today energy market, price modeling and
forecasting have an essential role and they have also been at the center of intense
studies in other markets, including financial. Depending on the objectives of the
analysis, a number of methods for modeling price dynamics have been proposed,
ranging from stochastic models to game theoretic approaches. Some of the
methods will be described in the next chapters.
3.4.1. Spike preprocessing
One of the big problems in price prediction on the energy market can be
connected to anomalies in price trends, manifested through price spikes. Leaving
spikes untreated in the data will later result in more anomalies in forecasted data.
There are some solutions to eliminate spikes inside the dataset:
Page 39
31
First solution is to substitute price spike with the average of the neighbor
values, or with the similar-day prices. But total removal of price spikes can
result in getting the wrong price trend as forecast output.
Better solution would be not to remove spikes completely, but to limit their
severity by using threshold filter. After executing chosen treatment of the
price spikes, dataset is ready for executing price forecast.
3.4.2. Quality assessment of a price forecast
There is a need to assess the quality of price forecasting, in order to achieve
better results on the market. The most widely used measures of forecasting
accuracy are those based on absolute errors, i.e; absolute values of difference
between actual value ( ) and predicted value ( ) for a given hour [21]. One of
the most popular measures for quality assessment of the forecasting is Mean
Absolute Error (MAE, hereafter), defined as:
∑| |
(3.11)
In some cases when two distinct data sets are compared, better performance
is shown by using one of the methods for determining relative percentage error.
One of them is Mean absolute percentage error (MAPE, hereafter). For hourly
prices the daily MAPE is defined as:
∑
| |
(3.12)
The MAPE measure works well in load forecasting, since actual load values
are rather large, but when applied to electricity prices, MAPE values could be
misleading. In particular, when electricity prices drop to zero, MAPE values
become very large regardless of the actual absolute differences | |. There is
a way to adapt this method for using in price forecasting - absolute error | |
needs to be normalized by the average price of that day. The modified measure,
also known as the Mean daily error (MDE), is given by:
Page 40
32
∑
| |
(3.13)
One of the measures mostly used in prediction evaluation and data training for
some learning methods is Root-mean-square deviation (RMSE). It is defined as:
√∑
(3.14)
The RMSE serves to aggregate the magnitudes of the errors in predictions for
various times into a single measure of predictive power and it measures accuracy
for continuous variables. The MAE and the RMSE can be used together to
measure the variation in the errors forecasted set.
In general, MDE compared to other measures puts more weight to errors in
the high-price range, so it is more suitable to use to evaluate price forecasting on
the energy market.
3.4.3. Time series models with exogenous variables
As explained in chapter 3.3.4, variations of the autoregressive moving average
model are widely used on a day-ahead market for both price and load prediction.
One of them – ARIMA, has shown notable performances especially in spot price
forecast [35]. ARIMA-type models relate the studied signal to its own past, and
additionally, they correlate the signal with influence of various exogenous factors,
like weather conditions, load profiles, etc. In order to accurately capture the
relationship between price and load or weather conditions, time series models with
exogenous or input variables can be used. Proposed models can usually be
viewed as a generalization of existing autoregressive models. The autoregressive
moving average model with exogenous variables – ARMAX can be
defined as:
Page 41
33
∑
(3.15)
where set of ’s models multiple exogenous variables, and is a shorthand
notation with being the corresponding coefficients of exogenous variables. In
order to adapt to specific conditions on the market, different transformations can
be applied to mimic characteristics of ARIMAX and seasonal ARIMAX models.
3.4.4. Interval forecasts
There are some forecast models which can predict price intervals on the
market [35]. Such forecasts may be especially relevant for risk management
purposes where companies are more interested in predicting intervals for future
price movements than simply estimates for the exact time point. However, while
there is a variety of studies on evaluating point forecasts in electricity markets,
forecasting of price intervals is not so evolved. In their paper, Misioerk et al. [35]
described a model for interval forecasting of electricity prices. For every processed
time series intervals are calculated by taking the quintiles of a standard normal
random variable rescaled by the standard deviation of the residuals in the
calibration period. Afterwards, the quality of the interval forecasts is evaluated by
comparing the nominal coverage of the models to the true coverage. Alternative
solution consists of computing the quintiles of the empirical distribution of the one-
step-ahead prediction errors. The drawback of this approach is that it needs more
data for initialization. This approach can be used not only in combination with time
series models, but also with any forecasting techniques (including AI-based
methods).
Page 42
34
4. Power Trading Agent Competition
Power trading agent competition (PowerTAC, hereafter) was first introduced in
2011 and it was developed by John Collins, Wolfgang Ketter, Prashant P. Reddy i
Christoph M. Flath [36]. PowerTAC represents a model of modern energy market
on which multiple brokers compete in order to make profit to their owners, usually
energy companies. Brokers are represented by intelligent software agents, and
their main role is to buy energy on the wholesale market in order to satisfy energy
demand on the retail market. Another important part of PowerTAC is the model of
distribution utility, whose general role is to maintain the global balance of supply
and demand on the market.
Trades on the wholesale market are executed thorough contracts with energy
producers, other brokers and distribution utility. On the other hand, one of the
biggest factors on the retail market is customer share, which can be increased by
publishing multiple tariffs suitable for various end-customers. Tariffs can vary
depending on sign-up bonuses, periodic payments, and fixed or variable payments
proposed in tariff specification. Fixed tariffs are specified for certain part of the day,
and variable tariffs target smart-appliances which can be controlled by signals sent
through the power grid.
In competitive environment modeled by PowerTAC game every broker needs
to adapt to variable conditions on the market either by forecasting future energy
price and demand, or some other strategy. By forecasting conditions on the
market, brokers can buy energy on the wholesale market for lower price and then
sell it to their end-customers on the retail market, which results in making profit.
Forecasted values are sometimes crucial to avoid creating imbalance of energy
supply and demand, which in usually results in penalties that broker must pay to
distribution utility. During the game brokers maintain their portfolios in which
contains information like executed contracts, published tariffs, number and type of
end-customers, etc. By maintaining portfolio broker is able to review information
on executed trades and customer usage, which can be crucial in forecasting some
of the key values on the market, like energy price and energy demand.
Page 43
35
In PowerTAC simulation time proceeds in “time slots”, each one representing
one hour in simulation time. In the real-time, duration of one TAC-hour is five
seconds. Average duration of one simulation is 60 TAC-day, which is
approximately 2 hours in real-time. During the simulation broker has an account in
central bank and every TAC-hour he gets information regarding his account’s
balance. At the beginning of each timeslot broker also receives information
regarding his current market position and his published tariffs. Weather forecast
and current weather conditions are broadcasted to the all brokers in each timeslot
and they represent valuable factors in process of forecasting energy load and
price, energy usage and production of some end-customers is closely related to
current weather conditions. Broker’s interactions in the PowerTAC simulation are
depicted in Figure 10.
Figure 10: Broker’s interaction in PowerTAC simulation [36]
Page 44
36
4.1. Retail market
Main interaction with end-customers takes place in the retail market, where
broker publish their tariffs in order to increase their customer share. Brokers need
to develop a set of tariffs suitable for various types of customers, and carefully
plan the payment for delivered energy, in order to make profit. Tariffs are
published every 6 TAC-hours, and they need to contain all the necessary
information that describe the conditions offered by tariff. Tariff specification must
contain:
Specific time intervals in which tariff is defined. It determines tariff’s
duration;
Amount of consumed or produced energy included in tariff. Some tariffs can
also declare amount of energy that can be revoked by sending interrupt
signals to smart-appliances;
Payment details for the energy specified in the tariff specification. Payment
can be defined in relation to time units, or to energy units; and
Communication channels used to publish tariff revocation or change in tariff
specification.
4.2. Distribution utility
One of the integrated parts of PowerTAC simulation is distribution utility. In
general, its role is to maintain balance of energy demand and supply on the
market, and to provide competitive environment. Distribution utility operates on
three different levels:
It distributes power through the transmission grid to the customers and
brokers must pay distribution fees for the use of the distribution grid;
It operates the balancing market in order to maintain balance between
demand and supply on the market; and
It offers default tariffs for energy consumption and production, and in that
way it creates a limit for broker’s profitability.
Page 45
37
4.3. Wholesale market
The wholesale market in Power TAC represents energy exchange where
brokers can trade energy with large producers and other brokers in order to satisfy
energy demand on the retail market. Wholesale market operates as a periodic
double auction and represents a traditional energy exchange like NordPool,
FERC13, or EEX614 [36]. Since the wholesale market is modeled by following
principles of day-ahead market, brokers can buy and sell energy for the future 24
hour (in PowerTAC represented as timeslots) and optimize their portfolios. Broker
participates in the trade by placing the bid for one of the next 24 timeslots. Every
bid must contain:
Broker’s name;
Timeslot for which the order is placed;
Amount of energy in MWh; and
Price for energy unit (€/MWh).
Orders placed for timeslot which are already disabled are being discarded.
When the simulation clock is advanced to a new time slot, the wholesale market
clears the orders for each of the enabled time slots. Orders with positive amount of
energy are considered as bids, and those with negative amount of energy are
considered as asks. Clearing process begins with sorting the orders – highest to
lowest price for bid orders, and lowest to highest price for ask orders. After that
begins the construction of demand and supply curves from orders placed for
enabled timeslots. Clearing price is determined on the crossing of supply and
demand curves. If curves do not cross then the clearing price is set at the mean of
the lowest bid and the highest ask price. Bids are executed if specified price is
higher than the last cleared bid. Following the same principle, asks are executed if
specified price is below the last cleared ask. Figure 11 depicts an example of
clearing process on the wholesale market.
13 http://www.ferc.gov
14 http://www.eex.com/en
Page 46
38
All orders are sorted in two groups: bids and ask. Bids are sorted by
decreasing price and asks are sorted by increasing price. Orders without specified
price (bid 1 and ask 1) are called market orders, and they are placed in the first
place of the sorted series. In the clearing process described in Figure 11 bids 1-8
are matched by lower-priced asks, as well as asks 1-6 are matched with higher-
priced bids. Bid 8 and ask 6 represent the clearing limit. Hence, orders
represented by bids 8-10 and ask 7 cannot be executed. Cleared amount is 27
MWh and the cleared price is 16, calculated as a mean value of prices on the
clearing limit (16 and 18).
Figure 11: Example of wholesale market clearing process
After the clearing process is finished, following actions are executed:
Broadcasting of cleared price and total amount of cleared energy to all
brokers;
Publishing of not cleared orders;
Publishing of broker-specific information regarding cleared trades;
Publishing broker-specific information regarding broker’s current market
position and cash balance; and
Order list clearing.
Page 47
39
5. Intelligent trading agent for power trading
through wholesale market - CrocodileAgent 2013
CrocodileAgent 2013 is an intelligent agent developed in University in Zagreb
in order to participate in PowerTAC 2013 competition. Last year, University in
Zagreb participated in PowerTAC 2012 competition with CrocodileAgent 2012
which was the base for this year’s improvements. CrocodileAgent 2013 has
modular architecture, depicted in Figure 12, which enables him to successfully
participate in retail, wholesale and balancing markets, which are integrated parts
of energy market modeled in PowerTAC simulation.
CLEARINGINFORMATION
WHOLESALE MARKET
CUSTOMER MARKET
GENCOSOTHER
BROKERS
C1 C2 C3
WEATHER
PAST ENERGY USAGE
ALL FORECASTED DATA
PAST CLEARING PRICES
BID/ASK TARIFFS
CONSUMPTION PRODUCTION INTERUPTABLE CONSUMPTION
Office complex
Village types
Centerville homes
Solar
Wind
Frosty storage
Heat Pump
FORECAST MANAGER
TARIFF MANAGER MARKET MANAGER
MARKET REPOSITORY
TARIFF REPOSITORY
MAIN SERVICE (MESSAGE SENDER/
RECEIVER)
OTHER TARIFF SPECIFICATION, TRANSACTION
PUBLISH TARIFFS
PASTUSAGE
FUTURE ENERGY USAGE/PRICES
CURRENT WHOLESALESTATE
BIDS/ASKS
SEND TO SERVER
CrocodileAgent 2013
LEARNING MODULE
BIDDING STRATEGIES
GENERATEDORDERS
ENERGYPRICES
NEEDEDENERGY Contribution of
this paper
Figure 12: Modular architecture of CrocodileAgent2013
There are significant improvements in comparison to last year’s agent. One of
them is learning module, which enables broker to adapt to current conditions on
the market, and to be more reactive while trading on the wholesale market. This
master thesis will cover implementation of smart bidding strategies on the
wholesale market, with ultimate goal to increase broker’s profit.
Page 48
40
CrocodileAgent’s activity on the customer market is described in [37]. In his
master thesis, Matetic describes broker’s reactivity on the customer market and
the principle of the tariff design. CrocodileAgent also tracks the number of
subscribers on the customer market, in order to enable prediction energy amount
that needs to be bought on the wholesale market.
5.1. Competing in PowerTAC competition
Broker’s actions in PowerTAC simulation can be simply described with
following:
Attract customers with publishing suitable tariffs;
Predict energy usage on customer market;
Buy needed amount of energy on the wholesale market; and
Minimize imbalance of energy supply and demand in order to avoid
negative effects on the balancing market.
Since the PowerTAC wholesale market is modeled as a day-ahead market,
energy can be traded for the next 24 hours. Thus, energy load and price prediction
can be crucial in developing broker’s strategy. Broker’s total profit in the simulation
is generally calculated as sum of total revenues on wholesale, customer, and
balancing market, minus distribution costs. Balancing transactions can have huge
impact on the broker’s revenue – broker must deliver energy to the end-customer,
so in case of energy shortage, distribution utility balances energy shortage, which
will result in broker’s profit loss on the balancing market. Also, in case of energy
surplus balancing mechanisms are executed and energy is sold for much lower
price than in the wholesale market.
Figure 13 depicts negative effect of imbalance on the market. It is expressed
through balancing cost that needs to be paid on the balancing market in order to
compensate for energy shortage.
Page 49
41
Balancing cost
SupplyDem
and
Balancing market
Custom
er mark
et Wholesale m
arket
Figure 13: Negative effect of imbalance on the market
Although CrocodileAgent 2012 has achieved some notable results in last
year’s competition [29], it is noticed that there was a negative impact on broker’s
revenue produced by balancing market. It was a motivation for implementation of
smart bidding strategies on the wholesale market in order to increase broker’s
robustness15 and to provide adequate support to trading on the customer market.
Some of the features from CrocodileAgent 2013 were tested in PowerTAC trial
competitions16 and results achieved in those games will be evaluated later.
5.2. Design of CrocodileAgent 2013
As depicted in Figure 12, CrocodileAgent has a quite modular architecture, in
order to easily generate separated strategies for wholesale and customer market.
Agent is implemented in Java17 programming language and using Spring18
framework. Spring framework is used in order to enable broker to communicate
with PowerTAC game simulator, and to enable communication between broker’s
15 The ability to resist change without adapting its initial stable configuration.
16 Warm-up competitions held to test some new functionalities in brokers publised by participants.
17 http://www.java.com/en/
18 http://www.springsource.org/
Page 50
42
modules. CrocodileAgent is implemented on top of agentware19 provided by Power
TAC organizers in form of the Maven20 project called sample-broker project.
CrocodileAgent’s modular architecture is represented by several Java classes
with @Service annotation which originates from Spring framework. On start of
broker’s lifecycle Spring framework scans entire project, and creates bean of every
class with @Service annotation, providing one instance of those classes in
broker’s lifecycle. Those instances are called singletons, and enables memory
persistence and easy communication between modules in broker’s lifecycle. Most
of the services in brokers’ architecture implements interfaces that provide method
for receiving custom messages from simulator. There are three main services
which enable broker’s interaction on customer and wholesale market:
MarketManagerService – represents market manager module
responsible for trading on the wholesale market. It enables broker to
generate orders for wholesale market, and to track various information
regarding trading on the wholesale market. It implements several methods
which enable broker to exchange messages with simulator:
o activate(timeslotIndex) – incoming message, marks the
beginning of timeslot and signals broker to prepare order for enabled
timeslots; and
o handleMessage(template) – incoming message, enables broker
to receive cleared trade, balancing transaction, distribution
transaction, market position , weather report and orderbook
information.
TariffManagerService – represents tariff manager module responsible
for trading on the customer market. This module enables broker reactive
response triggered by multiple events on the customer market. Complex
implementation of tariff module is thoroughly described in [37].
PortfolioManagerService – portfolio manager module which enables
exchange of common information between MarketManagerService and
19 Template software used by broker developers as a starting point in broker development process.
20 http://maven.apache.org/
Page 51
43
TarifManagerService. It implements several methods which enable
broker to communicate with simulator. It also implements tracking of
subscribers on the customer market, which serves as a useful source for
forecasting future energy load.
Market manager module communicates with learning module which enables
broker to adapt his basic strategy to specific conditions in day-ahead wholesale
market. Implementation of order generation and learning module is explained in
the next chapters.
5.2.1. Basic order generation
Market manager module in CrocodileAgent’s implementation represents
module responsible for bidding on the wholesale market. In the beginning of each
timeslot broker needs to prepare orders for enabled timeslots. First step is to
retrieve amount of needed energy from portfolio manager, which is calculated
based on customers’ information sent by tariff manager.
Next step is preprocessing of needed amount in which amount of already
cleared energy needs to be subtracted from retrieved amount. In order to minimize
negative effects on the balancing market, broker always tries to buy slightly larger
amount than retrieved from portfolio manager, leaving that extra amount to be
processed by learning module.
After preprocessing of needed amount market manager calculates basic unit
price. Basic unit price calculation is a function of remaining timeslots in which
broker is able to place order for target timeslot. In last step, broker sends needed
amount of energy and calculated unit price to learning module, which returns final
order after choosing the appropriate strategy. Order that is returned from learning
module is ready to be sent to simulator. Process that describes generation of basic
order is show in Figure 14.
Page 52
44
Market manager Portfolio manager Tariff manager
Update customer data
Retrieve needed usage
Needed usage
Refresh customer data
Learning module
Calculate unit price
Generate bid (amount and unit price)
Bid
Choose strategy
Figure 14: Sequence diagram of order generation
5.2.2. Learning module
One of the key features in wholesale module implementation is learning
module. It is designed to enable broker to adapt to various conditions on the
market. Main functionalities of the learning module can be expressed through
optimization of basic wholesale bidding in a way which will minimize negative
effects of the balancing market. Architecture of the learning module along with its
interaction with market manager module is depicted in Figure 15.
Implementation of the learning module is based on Erev-Roth method adapted
to match mechanisms on the PowerTAC wholesale market. There are three
integrated parts of the module:
Bidding strategies: set of 5 strategies used to modify basic order from
market manager. Strategies are designed to balance energy demand and
response on the wholesale market and they enable broker to adapt to
different conditions on day-ahead market.
Reward module: module designed to evaluate each strategy based on its
efficiency on the wholesale market. It uses market transactions information
as input, provided by PowerTAC simulator in the end of each timeslot. It
also calculates value of each strategy which is used to choose appropriate
strategy.
Page 53
45
Weighted randomizer: module designed to choose bidding strategy based
on action value. Choosing function is designed as a simple random
function used in many statistical methods, but it is impacted by probability
for choosing each strategy. Module is invoked in the beginning of each
timeslot in order to choose appropriate strategy for modeling of basic order.
LEARNING MODULELEARNING MODULE
BIDDING STRATEGIES
MARKET MANAGER
BIDDING EFFICIENCYINFORMATION
GENERATED BIDDING
S1 S2 S4S3 S5 NEEDEDAMMOUNT
REWARDMODULE
WEIGHTEDRANDOMIZER
Figure 15: Architecture of the learning module
5.2.2.1 Strategies
In order to optimize bidding on the wholesale market, CrocodileAgent has
several strategies suitable for various conditions on the market. CrocodileAgent’s
general strategy on the wholesale market is based on buying an amount of energy
needed to satisfy demand on the retail market. Market manager sends to the
learning module a needed amount and unit price specified in basic order. Those
values are used as an input values for strategy modeling inside the learning
module. Role of each strategy is to simply adjust inputted amount of energy and
unit price based on rules implemented inside the strategy. Strategies inside the
learning module are designed are described in Table 2.
Page 54
46
Strategy number
Buy Sell
1 amount = input amount * 1.2
price = input price
amount = input amount * 0.1
price = input price * 0.9
2 amount = input amount * 1.1
price = input price
amount = input amount * 0.2
price = input price
3 amount = input amount * 1.2
price = input price
amount = input amount * 0.3
price = input price
4 amount = input amount * 0.9
price = input price * 0.9
amount = input amount * 0.2
price = input price
5 amount = input amount * 1.2
price = input price * 0.9
amount = input amount * 0.2
price = input price * 1.1
Table 2: Strategies inside CrocodileAgent’s learning module
Each strategy is designed to slightly adjust input energy amount and input unit
price. Multiplying coefficients for each strategy are determined empirically. Since
CrocodileAgent 2013 is trying to avoid negative energy imbalance, in case of
selling energy, coefficients are set to prohibit selling amount of energy larger than
30% of input amount. On the other hand, in case of buying energy, coefficients are
set to enable slightly over-buying or under-buying of energy.
Initial strategy design is quite simple in order to enable easy validation of
learning module. There is also a possibility to implement smart strategies using
neural networks and autoregressive models.
5.2.2.2 Adaptation of Erev-Roth method
Wholesale energy markets are perfect candidates for implementation of
reinforcements learning, as it is explained in chapter 4.3.5. PowerTAC simulation
has limited duration, and participating brokers can model the game environment,
which makes it a suitable environment for implementation of reinforcement
learning.
There are some modifications of method proposed in order to adapt to
PowerTAC wholesale market, which is modeled as a day-ahead market. In the
PowerTAC wholesale market, broker can trade energy up to 24 times (24 different
Page 55
47
timeframes) for chosen timeslot. Figure 16 depicts an example where broker
places 24 different trades for timeslot 25.
1 2 3 4 5 6 7 8 9 10 11 12 13 14 15 16 17 18 19 20 21 22 23 24
30
Am
mo
un
t o
f tr
aded
en
ergy
(M
Wh
)
Timeslot
Figure 16: Example that shows multiple trades for desired timeslot
Since there are multiple chances to trade for desired timeslot which enables
broker to choose different strategies, there is a need to modify Erev-Roth
algorithm. Proposed solution is described below:
{
(5.1)
∑
(5.2)
where and
represent calculated action value and action probability for
trade in timeframe . Timeframe represents ordinal number of trade for
desired timeslot. In basic Erev-Roth method action values are calculated as
function of total trade impact for desired timeslot. Hence, broker can use only
single strategy while trading for desired timeslot.
This modification of basic Erev-Roth method enables broker to trade up to 24
times for desired timeslot with support of reinforcement learning. Proper use of this
method should progressively result with optimal strategies for each of 24 possible
timeframes in which broker can trade for desired timeslot. Example showing
strategy convergence for 24 timeframes is depicted in Figure 17.
Page 56
48
1 2 3 4 5 6 7 8 9 10 11 12 13 14 15 16 17 18 19 20 21 22 23 24
30
Timeslot
Firststrategy
Thirdstrategy
Fifthstrategy
Secondstrategy
Am
ou
nt
of
trad
ed e
ner
gy
(MW
h)
Figure 17: Example result of modified Erev-Roth method – convergence of best strategies
for each timeframe
5.2.2.3 Reward function
Reward function is used to evaluate efficiency of each strategy. In modified
Erev-Roth implementation each timeframe has own reward in order to enable
differentiation of best strategies for each timeslot. In implementation of
CrocodileAgent 2013 reward is calculated as a function of wholesale trading
efficiency in observed timeframe compared to broker’s total revenue for desired
timeslot. Reward function is defined below:
(5.3)
where is calculated as a total profit on the customer market in the
timeslot m, is calculated as a total profit on the wholesale
market in the timeslot m and represents a total cost of balancing
transactions in the timeslot m.
In this adaptation of Erev-Roth method reward function is defined on interval
[0,1]. Hence, calculated reward needs to be normalized by following expression:
(5.4)
Normalized reward is used in action value calculation, which has a great
impact in choosing appropriate strategy in the future.
Page 57
49
5.2.2.4 Weighted randomizer
Weighted randomizer is a module used for choosing a best suitable strategy in
specific timeframe for desired timeslot. Module connects probability of each
strategy with random function. Choosing of strategy is described by Algorithm 1:
random = generateRandom(0,1);
for(i = 0; i< actions.length; i++){
for(j = 0; j < i; j++){
sum += action[j].getProbabilityForTimeframe()}
if(random <= sum){
return action[i];} }
}
Algorithm 1: Strategy choosing
5.3. Implementation of learning module
Learning module is implemented following the principles of object-oriented
programming, in order to provide easy integration into wholesale module and to
enable future improvements. Implementation of the learning module is descriped
with class diagram depicted in Figure 18. Core of the learning module is
ErevRothImplementation singleton class, which needs to be instanced in
broker's initialization process. Initialization proccess of learning module consits of
setting list of strategies, initialization of , and variables and calculation of
initial reward, value and probability for each strategy. List of strategies is fed into
instance of WeightedRandom class created in initialization process of
ErevRothImplementation.
Abstract class Action defines valueMap and probabilityMap, needed for
proper functioning of each action in learning module. Using of Map structure is
necessary in order to use adapted Erev-Roth method and it is used to track value
and probability for each of 24 timeframes.
Page 58
50
Figure 18: Implementation of learning module
All strategies in learning module are instances of class Bidding which extends
abstract class Action and implements interface ActionInterface. Action
interface has declared method doAction() which needs to be overridden in
class that implements ActionInterface. Overridden method in class Bidding
is used to define behavior of each strategy.
Figure 19 depicts interaction between market manager, learning module and
PowerTAC simulator during simulation lifecycle. After module is initialized and
initial values and probabilities for each action are calculated, learning module is
ready to model received basic order depending on chosen strategy. After receiving
modeled order market manager can send order to simulator. After receiving
market clearing information market manager sends request for evaluation of
previously chosen strategy, which triggers calculation of reward inside learning
module. This procedure will be invoked every time when broker receives activation
message from simulator and energy amount received from portfolio manager is a
non-zero value.
Page 59
51
Market manager PowerTAC simulatorLearning module
Initialize (input set of strategies)
Calculate values and probabilities
Prepare order
Order
Send order
Cleared trades
Evaluate strategies
Calculate rewards
LoopsimulationEnd=false
Figure 19: Sequence diagram describing one iteration of learning module
Page 60
52
6. CrocodileAgent 2013 performance evaluation
In order to enhance CrocodileAgent’s performance in competitive wholesale
market, there are several improvements in this year’s implementation of the agent.
One of the integrated parts in CrocodileAgent 2013 is learning module based on
Erev-Roth reinforcement learning method, adapted for PowerTAC wholesale
market. The main objective of implemented improvements was to enable broker
efficient trading on the wholesale market in a way that minimizes negative effects
on the balancing market. In order to test efficiency of newly implemented learning
module, there is a need to evaluate broker’s performance in a competitive
environment.
6.1.1. Evaluation environment
CrocodileAgent 2013 is an intelligent software agent designed and
implemented for competing in PowerTAC 2013 competition. In order to test
robustness and to ensure proper interaction of newly implemented modules within
broker, there was a need to run some local simulations. Latest version of the game
simulator, altogether with game-related modules and dependencies are provided
on official GitHub page21 of PowerTAC competition.
PowerTAC server distribution provides testbed environment which can be
easily configured and adapted to various features of development version of the
broker. Another important module available on PowerTAC GitHub page is sample
broker, which is usually used as a base for developing PowerTAC agent. Sample
broker can be useful to create local competitive environment by adding multiple
instances of sample broker, each with slightly changed parameter in basic setup
The best way to test broker’s performance and to evaluate results of
implementation is to participate in PowerTAC competition. This year’s competition
consists of 4 trial competitions, held in March, April, May and June and a final
21 https://github.com/powertac/
Page 61
53
competition which is scheduled from July 8 until July 16. Each broker which
participates in competition has its own set of strategies, which globally provides
perfect competitive environment to test and evaluate broker’s performance.
Crocodile Agent’s improvements described in this master thesis were deployed
and tested in this year’s PowerTAC May trial competition. Along with
CrocodileAgent 2013 developed at the University in Zagreb, there were six other
participants:
AstonTAC - Aston University, England;
INAOEBroker01 - National Institute of Astrophysics, Optics and
Electronics, Spain;
cwiBroker - Centrum Wiskunde & Informatica, Netherlands;
MLLBroker - University of Freiburg, Germany;
UTest - The University of Texas at Austin, United States; and
LARGEpower - Rotterdam School of Management, Netherlands.
Each PowerTAC competition consists of multiple games with different game
sizes (number of participating brokers), providing different conditions on the
market in each game. Also, each participating broker has developed its unique
strategy which models competition environment through the broker’s interaction.
Variable number of participating brokers and market conditions which change
progressively make PowerTAC 2013 the perfect environment to test new
improvements implemented in CrocodileAgent 2013.
6.1.2. Key Performance Indicators
In order to test and evaluate new improvements implemented in wholesale
module of CrocodileAgent 2013, there is a need to define Key Performance
Indicators (KPIs, hereafter) to be measured in the evaluation process. An analysis
of PowerTAC 2013 March trial [40] defines important performance indicator for
wholesale, customer and balancing market and some of them are used to evaluate
the efficiency of CrocodileAgent’s 2013 wholesale trading.
Page 62
54
Since CrocodileAgent’s wholesale strategy is aimed at minimizing negative
effects of the balancing market, there are several important KPIs defined to
measure broker’s performance, defined in Table 3.
KPI Description Measurement
Root mean square imbalance for the
balancing transactions. Since balancing
mechanisms are executed to balance
energy shortage or surplus, RMS is used
to track absolute deviation.
Value is measured as a root
mean square value of energy
amount of all balancing
transactions during the
competition.
Amount of energy traded on the balancing
market expressed in kilowatt-hours.
Positive value indicates balancing of
energy shortage and negative value
indicates balancing of energy surplus.
Value is measured as an
arithmetic mean value of energy
amount of all balancing
transactions during the
competition.
Mean balancing price per energy unit.
Positive values indicate cost of balancing
energy surplus and negative ones indicate
cost of balancing energy shortage.
Value is measured as an
arithmetic mean value of energy
price of all balancing
transactions during the
competition.
Wholesale clearing rate. Zero-value
indicates that none of placed orders were
cleared and high number indicates that
placed orders were not well designed.
Value is defined as a as the
ratio between the number of
successful trades and the
number of submitted orders
Table 3: KPIs used to evaluate performance of CrocodileAgent 2013
In order to enable evaluation of results from PowerTAC trials, there are
detailed logs from each game available on the PowerTAC competition webpage.
There is also a tool called PowerTAC logtool which enables the extraction of raw
data from downloaded log files. Logtool converts log files with .state extension into
serialized objects and enables manipulation of instanced objects in order to enable
thorough evaluation.
Page 63
55
Another tool used for result evaluation is a visualizer web-application
developed at University of Zagreb as a part of PowerTAC project [11] [41].
Visualizer provides user-friendly interface to track details and status of each game
in the competition. It provides interfaces for tracking aggregate and per-timeslot
activities on customer, wholesale, and balancing market, which can be very useful
in evaluation of broker’s performance.
6.1.3. Results and discussion
During the PowerTAC trial competition there were some problems in
communication between some brokers and PowerTAC game simulator, as a result
of different time synchronization. Since PowerTAC simulator broadcasts activation
messages to brokers in the beginning of each timeslot, it is necessary that each
broker is synchronized to the Internet time standard (NTP). As a result of
communication problems, many of games were irregular, so only a few games
were included in evaluation process, in order to provide reliable data. Games with
following IDs were included in the evaluation: 23, 49, 54, 57, 59, 64, 69 and 101.
As it is previously explained, there are several KPIs measured in order to
evaluate CrocodileAgent’s wholesale bidding mechanisms. Table 4 contains
values of performance indicators which were calculated based on data extracted
from PowerTAC 2013 May trial log files.
Broker/KPI
AstonTAC 2624,64 3664,25 81,29 0,83
cwiBroker 8089,81 869,07 81,34 0,51
INAOEBroker 2664,31 -940,35 -50,16 0,23
CrocodileAgent 5340,98 19075,23 84,89 1,40
MLLBroker 15896,79 -10145,83 -736,66 0,12
UTest 9412,37 -25827,20 -1856,97 0,41
LARGEpower 1543,16 -368,78 -16,24 1,73
Table 4: Calculated performance indicators for PowerTAC May trial
Page 64
56
Calculated RMSimbalance_amount values indicate that CrocodileAgent wholesale
bidding needs to be improved in order to decrease energy imbalance. Some
brokers like MLLBroker, cwiBroker and UTest have even larger value of
RMSimbalance_amount, which suggests that they have different strategy on the
wholesale.
The other value used as indicator of imbalance amount, µimbalance_amount shows
that amount of energy that CrocodileAgent buys on the wholesale market is too
large. When compared to value of RMSimbalance_amount it indicates that in some
games Crocodile agents has placed a few orders which resulted in huge energy
surplus. Since high values (spikes) have a great impact on calculation of a mean
value, CrocodileAgent’s µimbalance_amount value is the highest among the other
brokers.
If broker has energy surplus, it needs to sell it on the balancing market in order
to maintain balance of energy supply and demand. µimbalance_price shows that
although CrocodileAgent buys excessive amount of energy, he still manages to
make profit by selling energy surplus in the balancing market. Most of the agents
(INAOEBroker, MLLBroker, UTest and LARGEPower) pay the balancing cost in
order to balance their energy shortage. Figure 20 depicts charts from balancing
market in the game 23. It shows that CrocodileAgent has an energy surplus, but it
manages to sell it on the balancing market. This particular game shows
CrocodileAgent’s quite balance wholesale trading. Peaks depicted in Figure 20 are
a result of fast changes in number of subscribers on the customer market which
has an impact on forecasting basic demand.
If only trading on the balancing market is observed, CrocodileAgent’s orders in
the wholesale market are well constructed and balanced, as it is shown by WCR
indicator. But still, better performance can be achieved by offering slightly lower
unit price. MLLBroker and UTest have very low WCR values, which suggests that
their orders do not clear very often. That is confirmed by value of their
µimbalance_amount and µimbalance_price, which indicate substantial energy shortage.
Page 65
57
Figure 20: CrocodileAgent’s revenue on the balancing market
In order to further evaluate CrocodileAgent’s total performance in PowerTAC
2013 May trial, logtool is used to calculate amount of energy traded on customer,
wholesale and balancing market. Values are presented in Table 5. As it is already
assumed, CrocodileAgent buys 125% of needed energy, which indicates that there
is a strong need to adapt generation of basic order for the wholesale market.
Broker/traded
amount[GWh] Customer market Wholesale market Balancing market
CrocodileAgent -574,489,539 775,918,723 -192,373,719
Table 5: Amount of energy traded by CrocodileAgent on customer, wholesale and
balancing market
To make the final conclusion for observed games of PowerTAC 2013 May
trial, there is a need to correlate measured KPIs with total revenue of participating
brokers. Figure 21 shows total revenue22 of each broker which participated in
22 It is calculated as a sum of profit on the wholesale, customer and balancing market, minust the
cost of distrubution fees.
Re
ven
ue
per
tim
esl
ot
[€]
Agg
rega
ted
rev
enu
e [€
]
Timeslot
Timeslot
CrocodileAgent
Default broker
cwiBroker
CrocodileAgent
Default broker
cwiBroker
Page 66
58
observed games. Although KPIs show that CrocodileAgent needs to improve load
forecasting for generation of basic orders, CrocodileAgent manages to make
substantial profit on the customer and balancing markets, which in most cases
results with top results in total revenue. It is a result of good communication
between his modules. In observed games of PowerTAC 2013 May trial
CrocodileAgent managed to earn total of nearly 5.000.000 € which puts him in the
first place.
Figure 21: Total revenue in observed games
Many games in PowerTAC May trial were irregular due to manifestation of
infinite orders and problems with broker – simulator synchronization. Hence, the
real performance of participating brokers could not be shown. In June, 2013
another PowerTAC trial was organized. All of the games in the competition were
regular and there is a notable difference in broker’s results. Since there were no
manifested irregularities, PowerTAC 2013 June trial has provided a perfect
environment for testing CrocodileAgent’s learning module. It is noticed that while
trading on the wholesale market, CrocodileAgent has a learning period – period in
which broker’s orders result in large imbalance, which triggers a negative
reinforcement. As a result, broker progressively learns to choose the most suitable
-2000000
-1000000
0
1000000
2000000
3000000
4000000
5000000
Total revenue (€)
Page 67
59
strategy for the particular timeframe. Figure 22 depicts charts from balancing
market in the game 11 from PowerTAC 2013 June trial. As it is previously
described, after the learning period CrocodileAgent’s wholesale trading results in
minimized energy imbalance on the balancing market. On the other hand,
LARGEpower’s imbalance increases progressively, which indicates a need to
optimize its wholesale strategy.
Figure 22: Progressive decrease of negative effects on the balancing market
Learning period
Page 68
60
Conclusion
The structure of energy market is going through major changes as a result of
progressive liberalization and decentralization. The introduction of a smart grid
concept has resulted in modernization of a traditional power grid, enabling usage
of intelligent software agents as representatives of trading entities on such
modernized energy market.
PowerTAC competition models the modern energy market and provides a
competitive environment suitable for experimentation. Main entities in the
competition are brokers whose goal is to maximize their profit while trading on the
customer, wholesale and balancing market. One of the brokers designed for
competing in PowerTAC 2013 competition is CrocodileAgent 2013, developed at
University in Zagreb. This paper presents key features of CrocodileAgent’s
wholesale module, designed to improve trading on the wholesale market, while
minimizing negative effects on the balancing market. One of the most important
features described in the paper is the learning module which enables broker to
adapt to various market conditions.
Newly implemented modules were evaluated in PowerTAC 2013 May trial,
providing insight in performance of CrocodileAgent 2013. Evaluation results
proved the efficiency of CrocodileAgent’s wholesale module and pointed out some
weaknesses in generating basic orders. Hence, future work includes improvement
of energy load forecasting in order to avoid energy surplus.
PowerTAC final competition is scheduled to be held in July 2013, collocated
with the Twenty-Seventh AAAI Conference on Artificial Intelligence (AAAI-13) in
Bellevue, Washington. Final competition will provide another chance to test
implemented features described in this paper.
Page 69
61
References
1. A. Ciarreta, N. Georgantzis, C. GutiErrez-Hita, “On the promotion of
renewable sources in liberalized electricity markets. The role of feed-in-tariff
systems”, 4th Annual conference on Competition and Regulation in Network
Industries, 25 November 2011, Residence Palace, Brussels, Belgium.
2. M. Liserre, T. Sauter, J. Y. Hung, “Future Energy Systems: Integrating
Renewable Energy Sources into the Smart Power Grid Through Industrial
Electronics”, Industrial Electronics Magazine, IEEE, Vol. 4, No. 1, March
2010.
3. REN21 Secretariat (Paris), “Renewables 2012: Global Status Report”,
UNEP, 2012.
4. NIST, “NIST Special Publication 1108R2 NIST Framework and Roadmap
for Smart Grid Interoperability Standards,” NIST Special Publication, p. 225,
2012.
5. Electric Power Research Institute, “Report to NIST on the Smart Grid
Interoperability Standards Roadmap”, August 10, 2009.
6. H. Farhangi, “The path of the smart grid”, Power and Energy Magazine,
IEEE, Vol. 8, No. 1. (22 January 2010), pp. 18-28.
7. T. Vijayapriya, D. P. Kothari, "Smart Grid: An Overview", Smart Grid and
Renewable Energy, 2011, 2, 305-311.
8. M. Hashmi, S. Hanninen, K. Maki, "Survey of smart grid concepts,
architectures, and technological demonstrations worldwide," Innovative
Smart Grid Technologies (ISGT Latin America), 2011 IEEE PES
Conference, Vol. 1, No. 7, Oct. 201.
9. X. Fang, S. Misra, G. Xue, D. Yang, "Smart Grid — The New and Improved
Power Grid: A Survey," Communications Surveys & Tutorials, IEEE, Vol.14,
No.4, pp.944, 980, Fourth Quarter 2012.
Page 70
62
10. F. Rahimi and A. Ipakchi, “Demand response as a market resource under
the smart grid paradigm”, IEEE Transcations on Smart Grid, 1:82–88, 2010.
11. J.Babic, “A simulation platform for power trading”, Master Thesis,
University of Zagreb, Faculty of electrical engineering and computing ,
2012.
12. Y. Yan, Y. Qian, H. Sharif, D. Tipper, "A Survey on Smart Grid
Communication Infrastructures: Motivations, Requirements and
Challenges," Communications Surveys & Tutorials, IEEE, Vol.15, No.1,
pp.5,20, First Quarter 2013.
13. D. J. Leeds, “The smart grid in 2010: Market segments, applications and
industry players”, GTM research, July 2009.
14. K. Manickavasagam, M. Nithya, K. Priya, J. Shruthi, S. Krishnan, S. Misra,
S. Manikandan, "Control of distributed generator and smart grid using multi-
agent system," Electrical Energy Systems (ICEES), 2011 1st International
Conference, pp.212,217, Jan. 2011.
15. K. Jae-Hoon, K. Do-Hoon, "Design of user-oriented market operations in a
smart grid ecosystem," Computers and Industrial Engineering (CIE), 2010
40th International Conference, pp.1,4, 25-28 July 2010.
16. M. Pipattanasomporn, H. Feroze, S. Rahman, "Multi-agent systems in a
distributed smart grid: Design and implementation," Power Systems
Conference and Exposition, 2009. PSCE '09. IEEE/PES, pp.1,8, 15-18
March 2009.
17. S. Borenstein, J. B. Bushnell, F. A. Wolak. “Measuring market inefficiencies
in California’s restructured wholesale electricity market” The American
Economic Review, 92(5):1376–1405, 2002.
18. C. Block, J. Collins, W. Ketter, and C. Weinhardt, “A Multi-Agent Energy
Trading Competition,” Technical Report, no. ERS–2009-054-LIS. Erasmus
Research Institute of Management, Erasmus University, 2009.
19. G. Conzelmann, G. Boyd, V. Koritarov, and T. Veselka, “Multi-agent power
market simulation using EMCAS,” in Power Engineering Society General
Meeting 2005 IEEE, 2005, pp. 2829 - 2834.
Page 71
63
20. T. Sueyoshi, G. Tadiparthi, “An agent-based decision support system for
wholesale electricity market”. Decision Support Systems, 44(2):425–446,
2008.
21. R. Weron, “Modeling and Forecasting Electricity Loads and Prices”, John
Wiley & Sons, Ltd, 2006.
22. N. Flatabo, G. Doorman, O. S. Grande, H. Randen, I. Wangensteen,
"Experience with the Nord Pool design and implementation," Power
Systems, IEEE Transactions, vol.18, no.2, pp.541,547, May 2003.
23. Energy, Transport and Water Department, World Bank Group. Energy and
Mining Sector Board, “Building Regional Power Pools: A Toolkit”, Energy,
Transport, and Water Department, World Bank Group.
24. D. S. Kirschen, "Market power in the Electricity Pool of England and Wales,"
Power Engineering Society Winter Meeting, 2001. IEEE, vol.1, pp.36,40, 28
Jan-1 Feb 2001.
25. DG Energy, “Quarterly Report on European Electricity Markets”, Market
Observatory For Energy, Vol. 5 , No. 2, April 201 2 – June 2012
26. W. Yanrui, “Electricity market integration: global trends and implications for
the EAS region”, Discussion paper 12.19, Economics, Business School,
University of Western Australia.
27. J. Mullins, L. D. Wagner, J. Foster, “Price Spikes in Electricity Markets: A
Strategic Perspective”, Energy Economics and Management Group
Working Papers, School of Economics, University of Queensland, Australia.
28. R. Weron, I. Simonsen, P. Wilman, "Modeling highly volatile and seasonal
markets: evidence from the Nord Pool electricity market," Econometrics
0303007, EconWPA, 2003.
29. J. Babic et al., “The CrocodileAgent 2012: Research for Efficient Agent -
based Electricity Trading Mechanisms,” in Special Session on Trading
Agent Competition @ KES-AMSTA 2012, 2012, pp. 1-13.
30. R. Bindiu, M. Chindri, G.V. Pop, “Day-Ahead Load Forecasting Using
Exponential Smoothing”, Scientific Bulletin of the Petru Maior University of
Tirgu Mures Vol. 6 (XXIII), 2009.
Page 72
64
31. P. R. Winters, “Forecasting Sales by Exponentially Weighted Moving
Averages,” Management Science , vol. 6, no. 3, pp. 324 - 342, 1960.
32. C. C. Holt, “Forecasting seasonals and trends by exponentially weighted m
oving averages,” International Journal of Forecasting , vol. 20, no. 1, pp. 5 -
10, 2004.
33. H. Tao, G. Min, M.E. Baran, H.L Willis, "Modeling and forecasting hourly
electric load by multiple linear regression with interactions," Power and
Energy Society General Meeting, 2010 IEEE, pp.1,8, 25-29 July 2010.
34. S.S. Pappas, L. Ekonomou, D.C. Karamousantas, G.E. Chatzarakis, S.K.
Katsikas, P. Liatsis, “Electricity demand loads modeling using
AutoRegressive Moving Average (ARMA) models”, Energy, Vol. 33, No. 9,
September 20082.
35. A. Misiorek, R. Weron, “Interval forecasting of spot electricity prices”,
International Conference ”The European Electricity Market EEM-06” May
24-26, 2006, Warsaw, Poland Proceedings Volume, pp. 305-312
36. Ketter, W., Collins, J., Reddy, P., Flath, C., Weerdt, M. The Power Trading
Agent Competition, Erasmus Research Institute of Management Report,
ERS-2011-011-LIS, SSRN 1975237, 2011.
37. S. Matetić, “Intelligent trading agent for power trading through tariff market”,
Master Thesis, University of Zagreb, Faculty of electrical engineering and
computing, 2013.
38. R. S. Sutton and A. G. Barto, “Reinforcement Learning: An Introduction”,
MIT Press, 1998
39. A. Weidlich, D. Veit, "A critical survey of agent-based wholesale electricity
market models", Energy Economics, Vol. 30, No. 4, July 2008
40. J. Babic and V. Podobnik, An analysis of Power TAC trial, in Proceedings
of the 2013 AAAI Workshop on Trading Agent Design and Analysis, 2013
41. T. Brisevac, Visualization module for a simulation platform for power
trading, Master Thesis, University of Zagreb, Faculty of Electrical
Engineering and Computing, 2013
Page 73
65
Summary
Intelligent trading agent for power trading through wholesale market
This master thesis describes an implementation of intelligent software agent
for efficient trading in the modern energy market, with special emphasis on
wholesale trading. Main motivation for this work arises from the evolution of
energy market, which provides a possibility for implementation of complex
software solutions in order to improve market trading mechanisms. The emphasis
of this master thesis was placed on the design and implementation of adaptive
wholesale module which is an integrated part of the CrocodileAgent 2013,
developed at University in Zagreb. The solutions described in this thesis were
evaluated on the Power TAC 2013 May trial competition.
Keywords: smart grids, software agents, energy market modeling, Power Trading
Agent Competition, energy wholesale market
Page 74
66
Sažetak
Inteligentni programski agent za trgovanje električnom energijom
posredstvom veleprodajnog tržišta
U ovom diplomskom radu opisan je razvoj inteligentnog programskog agenta
za trgovanje na tržištu električne energije, s posebnim naglaskom na trgovanje na
veleprodajnom tržištu. Motivacija za izradu ovog rada proizlazi iz razvoja tržišta
električne energije, što omogućava implementaciju složenih programskih rješenja
u cilju poboljšavanja mehanizama za trgovanje elektičnom energijom. Naglasak
rada je na dizajnu i implementaciji modula za trgovanje na veleprodajnom tržištu
električne energije, koji je ujedno sastavni dio programskog agenta
CrocodileAgent 2013, razvijenog na Sveučilištu u Zagrebu. Rješena opisana u
radu testirana su i evaluirana u sklopu probnog natjecanja PowerTAC 2013
održanog u svibnju 2013. godine.
Ključne riječi: napredne energetske mreže, programski agenti, modeliranje tržišta
električne energije, Power Trading Agent Competition, veleprodajno tržište
električne energije