INTENSITY, VARIETY, AND ACCURACY IN NONVERBAL CUES AND DE-/ENCODING: TWO EXPERIMENTAL INVESTIGATIONS Hans Gerhard Klinzing (University of Tuebingen, University of Stuttgart) and Bernadette Gerada-Aloisio (Malta) Paper presented at the at the annual meeting of the American Educational Research Association, San Diego, CA, 2004 0
Transcript
INTENSITY, VARIETY, AND ACCURACY IN NONVERBAL CUES AND
DE-/ENCODING:
TWO EXPERIMENTAL INVESTIGATIONS
Hans Gerhard Klinzing (University of Tuebingen, University of Stuttgart)
and
Bernadette Gerada-Aloisio
(Malta)
Paper presented at the at the annual meeting of the
American Educational Research Association,
San Diego, CA, 2004
0
INTENSITY, VARIETY, AND ACCURACY IN NONVERBAL CUES AND
DE-/ENCODING:
TWO EXPERIMENTAL INVESTIGATIONS
Hans Gerhard Klinzing (University of Tuebingen/University of Stuttgart, Germany)
and
Bernadette Gerada-Aloisio
(Malta)
Abstract Nonverbal communication skill, decoding and encoding nonverbal cues effectively, is an important part of social competence. Merely experience in receiving and sending nonverbal cues, however, is not sufficient to improve nonverbal skill. Consequently, a training program was designed to develop nonverbal sensitivity of school administrators and pre-service teachers and to help them to effectively express themselves nonverbally. Two experimental investigations with school-principals and university students were to test the effectiveness of the program and to investigate psychosocial correlates of nonverbal skill. Results revealed significant improvements in nonverbal perceptiveness, expressiveness, and extraversion. Statistically significant age- and gender related differences and relationships between measures of decoding and encoding ability and psychosocial correlates were found. Recommendations are made for the pre-service and in-service curriculum.
Introduction
One of the important preconditions for successful learning in organizations, as well as a
requirement for many professions (e.g., teachers, ministers, administrators, clinicians,
business executives) is social competence. A fundamental part of social competence is skill in
communication. Thus, an attempt was made to develop an attractive and powerful learning
environment in the form of a program for the improvement of social competence in general,
and specifically for the improvement of the accuracy of decoding and the expressiveness and
unambiguousness in encoding nonverbal cues which can be used in pre-service as well as in
in-service education.
1
Purpose of Studies
Two experimental studies - one with school principals, another with education students -
were conducted to test the effectiveness of the program, and its underlying theory, on
nonverbal skill (decoding and encoding abilities), (rigid, imposing) attitudes and personality
characteristics (extraversion). The program was also evaluated by the participants. Beyond
testing the effectiveness and evaluation of the program, experimental hypotheses were
investigated, aiming at confirming, or clarifying inconsistencies of earlier findings:
differences between groups, gender effects, relationships between encoding and decoding
skill, and selected personality and psychosocial correlates of skilled nonverbal receivers and
senders.
Rationale/Review of Research
A fundamental part of social competence is skill in nonverbal communication (Knapp &
Hall, 2002, 71f). “We speak with our vocal organs, but we converse with our whole body”
(Abercromby, 1968, cited in Argyle, 2002, 151). The ability to receive or to accurately
decode nonverbal cues, as well as the ability to send them expressively and unambiguously
matter greatly in daily life.
Accuracy of Decoding Nonverbal Cues
Strong research evidence suggests that understanding socially agreed meanings for
nonverbal signs and signals is key for effective every day as well as for professional
The importance of one’s ability to judge nonverbal cues is also evident in research
examining personal traits and psychosocial correlates associated with nonverbal receiving
ability. Skilled decoders of nonverbal signs and signals are also shown to possess the
following personal characteristics: they have been found to be “better adjusted, less hostile
and manipulating, more interpersonally democratic and encouraging, more extraverted, less
shy, less socially anxious, more warm, more empathic, more cognitively complex and
flexible.” (Knapp & Hall, 2002, 85). In keeping with possession of these desirable
characteristics, skilled nonverbal decoders are more self-monitoring, are considered more
popular and sensitive to the needs of others, and report higher levels of warmth and
satisfaction in their own personal relationships. (Hall, 1998; Knapp & Hall, 2002;). For self-
rated interpersonal success, Rosenthal et al. (1979, 263ff) found consistent and significant
positive relationships to nonverbal sensitivity (assessed by PONS) in three samples, but the
correlations were small in magnitude. In a sample of college students which might be
comparable to the sample of university students in Study 2 of the present report, Rosenthal et
al. (1979) found significant relationships between PONS scores and the factor “understanding
in friendships” and “making friends more quickly”. Also relationships between nonverbal
sensitivity and attitudes like dominance or directiveness (rigid, imposing attitudes) and
personality characteristics like extraversion have been found over many studies as weak, but
statistically significant (Rosenthal et al., 1979; Hall, 1998; Knapp & Hall, 2002). In the
studies reported in this paper these findings were replicated in the German context.
3
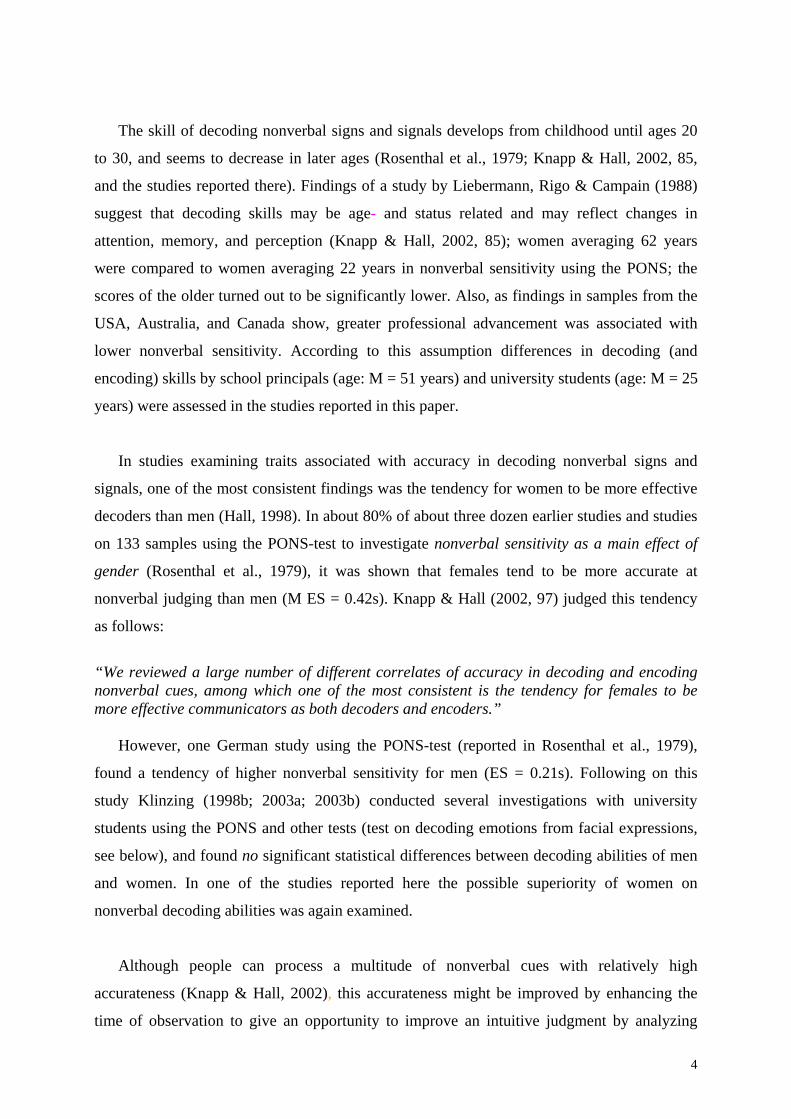
The skill of decoding nonverbal signs and signals develops from childhood until ages 20
to 30, and seems to decrease in later ages (Rosenthal et al., 1979; Knapp & Hall, 2002, 85,
and the studies reported there). Findings of a study by Liebermann, Rigo & Campain (1988)
suggest that decoding skills may be age- and status related and may reflect changes in
attention, memory, and perception (Knapp & Hall, 2002, 85); women averaging 62 years
were compared to women averaging 22 years in nonverbal sensitivity using the PONS; the
scores of the older turned out to be significantly lower. Also, as findings in samples from the
USA, Australia, and Canada show, greater professional advancement was associated with
lower nonverbal sensitivity. According to this assumption differences in decoding (and
encoding) skills by school principals (age: M = 51 years) and university students (age: M = 25
years) were assessed in the studies reported in this paper.
In studies examining traits associated with accuracy in decoding nonverbal signs and
signals, one of the most consistent findings was the tendency for women to be more effective
decoders than men (Hall, 1998). In about 80% of about three dozen earlier studies and studies
on 133 samples using the PONS-test to investigate nonverbal sensitivity as a main effect of
gender (Rosenthal et al., 1979), it was shown that females tend to be more accurate at
nonverbal judging than men (M ES = 0.42s). Knapp & Hall (2002, 97) judged this tendency
as follows:
“We reviewed a large number of different correlates of accuracy in decoding and encoding nonverbal cues, among which one of the most consistent is the tendency for females to be more effective communicators as both decoders and encoders.”
However, one German study using the PONS-test (reported in Rosenthal et al., 1979),
found a tendency of higher nonverbal sensitivity for men (ES = 0.21s). Following on this
study Klinzing (1998b; 2003a; 2003b) conducted several investigations with university
students using the PONS and other tests (test on decoding emotions from facial expressions,
see below), and found no significant statistical differences between decoding abilities of men
and women. In one of the studies reported here the possible superiority of women on
nonverbal decoding abilities was again examined.
Although people can process a multitude of nonverbal cues with relatively high
accurateness (Knapp & Hall, 2002), this accurateness might be improved by enhancing the
time of observation to give an opportunity to improve an intuitive judgment by analyzing
4
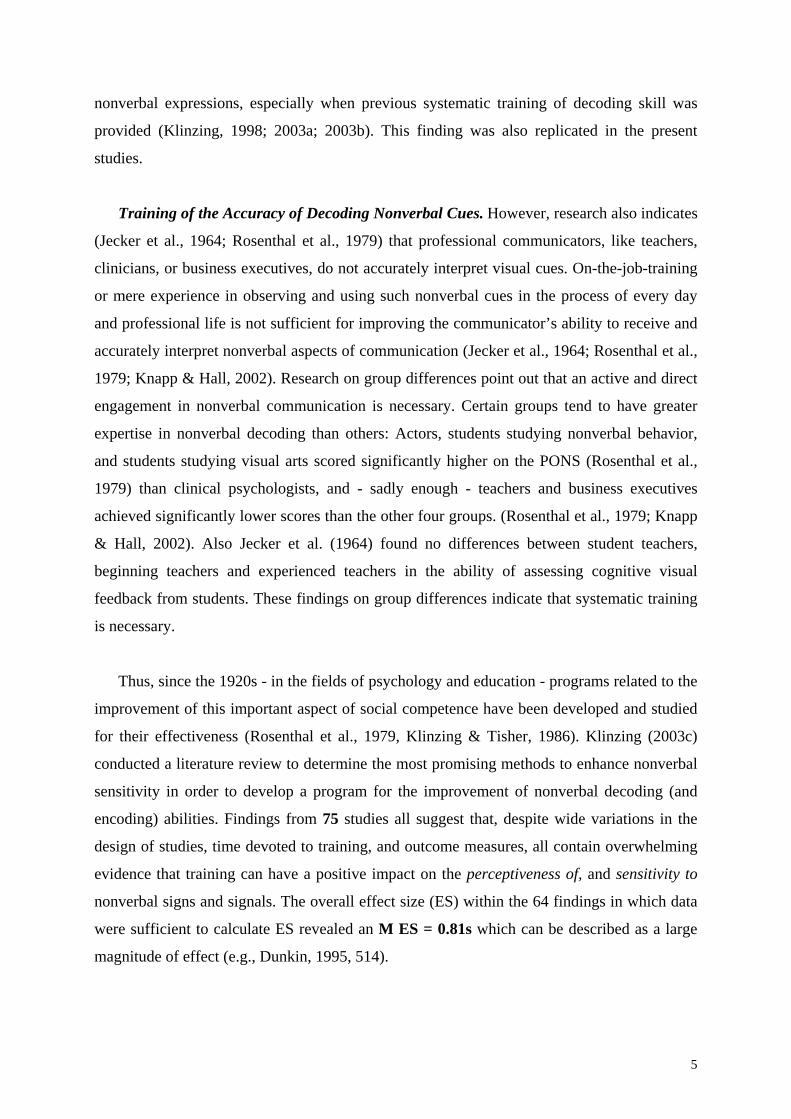
nonverbal expressions, especially when previous systematic training of decoding skill was
provided (Klinzing, 1998; 2003a; 2003b). This finding was also replicated in the present
studies.
Training of the Accuracy of Decoding Nonverbal Cues. However, research also indicates
(Jecker et al., 1964; Rosenthal et al., 1979) that professional communicators, like teachers,
clinicians, or business executives, do not accurately interpret visual cues. On-the-job-training
or mere experience in observing and using such nonverbal cues in the process of every day
and professional life is not sufficient for improving the communicator’s ability to receive and
accurately interpret nonverbal aspects of communication (Jecker et al., 1964; Rosenthal et al.,
1979; Knapp & Hall, 2002). Research on group differences point out that an active and direct
engagement in nonverbal communication is necessary. Certain groups tend to have greater
expertise in nonverbal decoding than others: Actors, students studying nonverbal behavior,
and students studying visual arts scored significantly higher on the PONS (Rosenthal et al.,
1979) than clinical psychologists, and - sadly enough - teachers and business executives
achieved significantly lower scores than the other four groups. (Rosenthal et al., 1979; Knapp
& Hall, 2002). Also Jecker et al. (1964) found no differences between student teachers,
beginning teachers and experienced teachers in the ability of assessing cognitive visual
feedback from students. These findings on group differences indicate that systematic training
is necessary.
Thus, since the 1920s - in the fields of psychology and education - programs related to the
improvement of this important aspect of social competence have been developed and studied
for their effectiveness (Rosenthal et al., 1979, Klinzing & Tisher, 1986). Klinzing (2003c)
conducted a literature review to determine the most promising methods to enhance nonverbal
sensitivity in order to develop a program for the improvement of nonverbal decoding (and
encoding) abilities. Findings from 75 studies all suggest that, despite wide variations in the
design of studies, time devoted to training, and outcome measures, all contain overwhelming
evidence that training can have a positive impact on the perceptiveness of, and sensitivity to
nonverbal signs and signals. The overall effect size (ES) within the 64 findings in which data
were sufficient to calculate ES revealed an M ES = 0.81s which can be described as a large
magnitude of effect (e.g., Dunkin, 1995, 514).
5
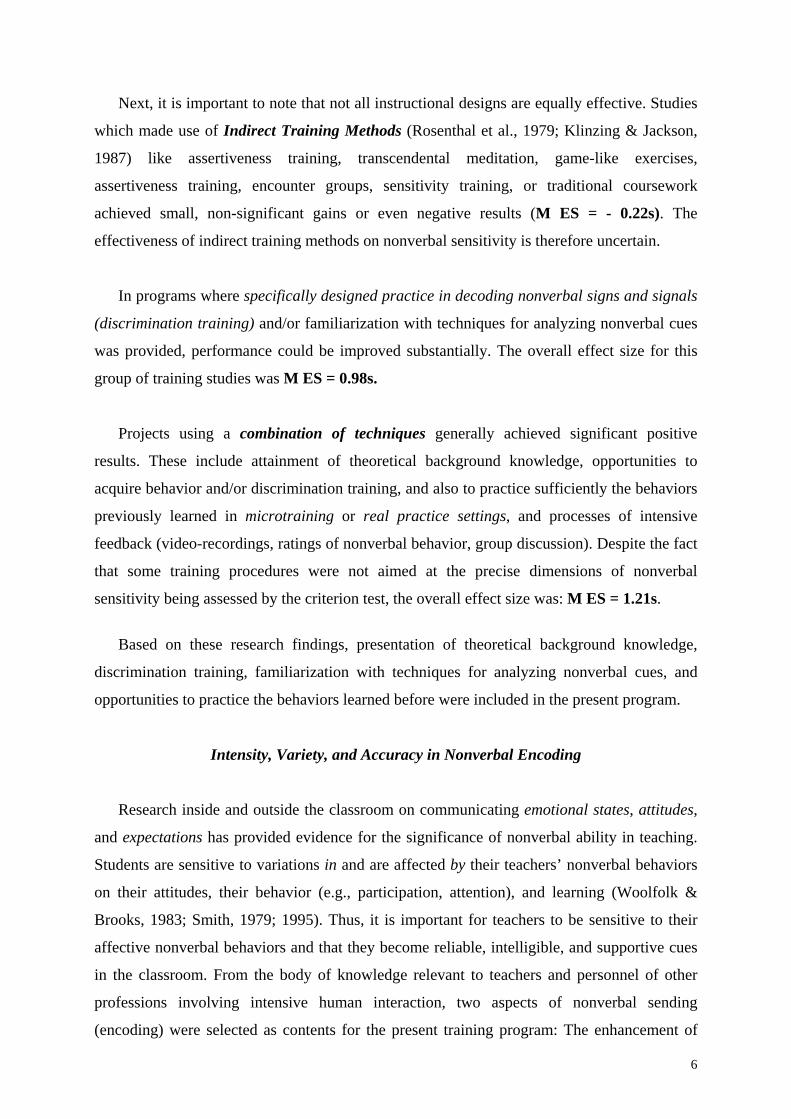
Next, it is important to note that not all instructional designs are equally effective. Studies
which made use of Indirect Training Methods (Rosenthal et al., 1979; Klinzing & Jackson,
1987) like assertiveness training, transcendental meditation, game-like exercises,
assertiveness training, encounter groups, sensitivity training, or traditional coursework
achieved small, non-significant gains or even negative results (M ES = - 0.22s). The
effectiveness of indirect training methods on nonverbal sensitivity is therefore uncertain.
In programs where specifically designed practice in decoding nonverbal signs and signals
(discrimination training) and/or familiarization with techniques for analyzing nonverbal cues
was provided, performance could be improved substantially. The overall effect size for this
group of training studies was M ES = 0.98s.
Projects using a combination of techniques generally achieved significant positive
results. These include attainment of theoretical background knowledge, opportunities to
acquire behavior and/or discrimination training, and also to practice sufficiently the behaviors
previously learned in microtraining or real practice settings, and processes of intensive
feedback (video-recordings, ratings of nonverbal behavior, group discussion). Despite the fact
that some training procedures were not aimed at the precise dimensions of nonverbal
sensitivity being assessed by the criterion test, the overall effect size was: M ES = 1.21s.
Based on these research findings, presentation of theoretical background knowledge,
discrimination training, familiarization with techniques for analyzing nonverbal cues, and
opportunities to practice the behaviors learned before were included in the present program.
Intensity, Variety, and Accuracy in Nonverbal Encoding
Research inside and outside the classroom on communicating emotional states, attitudes,
and expectations has provided evidence for the significance of nonverbal ability in teaching.
Students are sensitive to variations in and are affected by their teachers’ nonverbal behaviors
on their attitudes, their behavior (e.g., participation, attention), and learning (Woolfolk &
Brooks, 1983; Smith, 1979; 1995). Thus, it is important for teachers to be sensitive to their
affective nonverbal behaviors and that they become reliable, intelligible, and supportive cues
in the classroom. From the body of knowledge relevant to teachers and personnel of other
professions involving intensive human interaction, two aspects of nonverbal sending
(encoding) were selected as contents for the present training program: The enhancement of
6
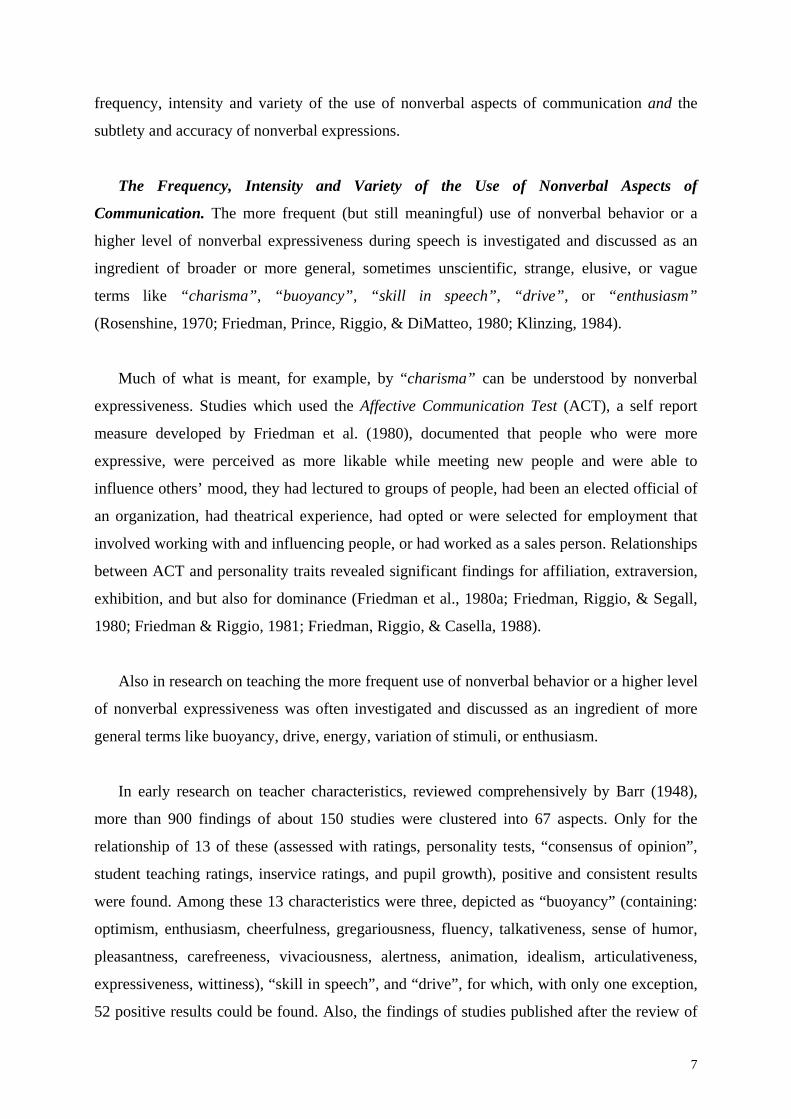
frequency, intensity and variety of the use of nonverbal aspects of communication and the
subtlety and accuracy of nonverbal expressions.
The Frequency, Intensity and Variety of the Use of Nonverbal Aspects of
Communication. The more frequent (but still meaningful) use of nonverbal behavior or a
higher level of nonverbal expressiveness during speech is investigated and discussed as an
ingredient of broader or more general, sometimes unscientific, strange, elusive, or vague
terms like “charisma”, “buoyancy”, “skill in speech”, “drive”, or “enthusiasm”
Following the research tradition that began in the early 1960s, when teaching
effectiveness was no longer seen as a function of some teacher characteristic, but as a function
of what the teacher is actually doing in the classroom (see e.g., Gage, 1963; 1972), energy,
enthusiasm, stimulation, animation, and expressiveness have again been studied, now as an
aspect of teaching behavior. Some of these studies helped determine which specific behaviors
are comprised in enthusiastic, stimulating, and animated teaching.
Rosenshine (1968; 1970; 1971; Rosenshine & Furst, 1973) reviewed the “state of the art”
in this field for 13 studies conducted till 1970. Rosenshine (1970, 510).concluded:
“In summary, the results of high-inference studies provide evidence that ratings given to teachers on such behaviors as “stimulating”, “energetic”, “mobile”, “enthusiastic”, and “animated” are related to measures of pupil achievement. The results of low-inference studies suggest that the frequencies of such variables as movement, gesture, variation in voice, and eye contact are related to pupil achievement.” In his comprehensive research review Teaching Behaviours and Student Achievement
(1971), Rosenshine reviewed about 70 studies containing 150 findings about the relationship
between teaching behaviors and student achievement, clustered them into 41 groups, and
ranked the clusters according to the statistical significance, consistency of findings, and size
of correlation; “enthusiasm” appears in the third place (after clarity of presentation and
variability).
This impressive positive pattern continues in research reviews after that of Rosenshine.
Klinzing (1984) reviewed 36 studies. Positive relationships of animating, expressive
nonverbal or enthusiastic teaching behavior and direct observable, productive pupil behavior
were found in one correlational study: Ryans (1960) found a positive relationship of
stimulating (vs. dull) teaching behavior and alert, responsible, confident, and initiating pupil
behavior. Also, in training studies, some directly observable desired pupil behaviors like on-
8
task behavior of students (Gillett & Gall, 1981; Denight & Gall, 1989), attention, interest
(Klinzing, Fitzner & Klinzing-Eurich, 1983), and positive nonverbal interactions (Raymond,
1973) could be achieved as an outcome of successful nonverbal behavior training.
The relationship between energetic, enthusiastic teacher behavior and pupil attitudes
and/or pupil/student ratings of teacher effectiveness was studied in four correlational and 11
experimental studies. While in correlational studies - with one exception (Solomon,
Rosenberg & Bedzek, 1964, r = - 0.02) - high positive and significant results were obtained
(Good & Grouws, 1975, r = 0.47; McConnell, 1977, r = 0.34; Evertson, Brophy, & Crawford,
1978; Evertson, Anderson & Brophy, 1978, r = 0.48), a positive influence of enthusiastic or
expressive nonverbal behavior on student attitudes could be revealed in only eight
experimental studies (Mastin, 1963; Breed, 1971, study 1; Ahlbrand, 1976; Ware & Williams,
Winterbotham, 1993), at least in facial accuracy and expressiveness. As cited above, the
authors found gender effects for decoding as well as for encoding abilities as the most
consistent tendency in present research. In a highly controlled training study, however,
Schiefer, Kunkel, Steiger, Revenstorf, & Klinzing (1984) found no statistical differences
between men and women in nonverbal expressiveness. Thus, gender effects in nonverbal
expressiveness were examined in Study 2 of this paper.
Nonverbal decoding and encoding are discussed so far as separate skills. In face-to-face
communication interactants are decoding and encoding nonverbal cues simultaneously. Are
receiving and sending skills related as parts of a general communication ability? If this is the
case, then decoding and encoding skills would be related. Knapp & Hall (2002, 92) reported
findings from about a dozen studies and found positive, weak as well as negative
relationships. The authors concluded:
“Evidence is extremely mixed on whether being a good decoder implies being a good encoder. It does not necessarily follow that proficiency in one skill (encoding or decoding) makes one proficient in the other, although sometimes this is the case. Skill in one area may detract from proficiency in another.” (Knapp & Hall, 2002, 98).
The present project offered the opportunity to replicate findings obtained in these earlier
studies.
Although encoding and decoding might be different skills, accuracy, unambiguousness of
communication can be seen as inextricably connected to both the sender and receiver.
Sensitivity to nonverbal cues and in nonverbal expressiveness and clarity of nonverbal
sending are reflected in the degree to which a common perception of the behavior exhibited is
held by sender and receiver. But, reduction of the discrepancy between experienced and
observed performance requires not just change in perception, but also in behavior. This idea is
15
- at least partly - reflected in the concept of “Self-Realism” as an important base for the
facilitation of behavioral change (Fuller & Manning, 1973).
Thus, the enhancement of the degree of nonverbal expressiveness and of accuracy
(unambiguousness/self-realism) was stated as an objective of the training program because it
is a basic social competence, a precondition or even a requirement for changing performance
and a reflection on accurate sending.
The Training of Nonverbal Expressiveness and Accuracy. As with nonverbal sensitivity,
nonverbal expressiveness is usually acquired in daily life and in on-the-job-training. Because
this is seen as insufficient for professions involved in human interaction, programs of
systematic training have been developed, tested for their effectiveness, and evaluated. In their
findings were obtained for pupil attitudes and for student ratings of teachers’ effectiveness.
(As mentioned above, none or even negative findings have been obtained for pay-offs like
pupil achievement in these training studies (Klinzing & Tisher, 1986; Klinzing, 1999).
The review of Klinzing (1999) and Klinzing & Gerada Aloisio (2004) contains 11
additional studies conducted by Klinzing and his associates. In these studies considerable
effects of the training program were achieved (ES = 1.45s). Also, it was demonstrated that
improvement could be achieved not only in behaviors directly related to the training
objectives but also in broader dimensions like social climate, interest and clarity of the
presentation, persuasiveness, and assertiveness. Again, the effectiveness of programs using
17
indirect training approaches on nonverbal expressiveness (like sensitivity training,
assertiveness training, or game-like exercises) remains still uncertain given its research base.
Klinzing and associates designed training programs by integrating components of
laboratory experiences in teacher education and their different functions (Cruickshank &
Metcalf, 1990; Metcalf, 1995; Klinzing & Tisher, 1993) using the framework of
“Interacting/Teaching as Experimentation” (Klinzing & Floden, 1990, 177): “The perspective of teaching as experimentation assumes that improvement of practice and understanding of the nature, function, and worth of practices will occur simultaneously as a mutual inspiring, interactive process. In other words, this paper reflects the belief that improvement of theoretical understanding, practical knowledge, and performance happens as an interaction between, on the one hand, extensive acquisition of knowledge, skills, and techniques and, on the other hand, focused, reflected experience.” From this frame of reference the successful training of manifest and narrowly defined
actions can flow on consequentially not only to improve broader dimensions like “clarity” or
“unambiguousness” of sending but also to influence global personality constructs like
attitudes and personality characteristics (e.g., via feedback loops, Klinzing & Jackson, 1987).
So for the studies reported here, it was assumed that an improvement of nonverbal
decoding and expressiveness would flow on to changes in directiveness (imposing, rigid
attitudes) and extraversion.
Based on their findings, Klinzing & Tisher (1986), Klinzing (1999), and Klinzing &
Gerada Aloisio, (2004) recommended training to broaden teachers’ repertory of nonverbal
behavior (besides improving perception) and to promote their expressiveness and their
flexibility in coping with a variety of different situations. For this training the tasks to be
mastered should be divided into components which are to be learned stepwise, practiced and
gradually integrated. Derived from the most successful studies reviewed and according to this
task design, the authors suggested an instructional strategy that provides for each of the sub-
tasks the following components: provision of theoretical background knowledge, skill
acquisition exercises/discrimination training, and opportunities to practice repeatedly the
skills learned before in experimental/laboratory settings with informative feedback focusing
on positive changes supplied by recommendations for successive attempts.
18
No studies could be located which aimed at accuracy of encoding. For the program
presented here it was hoped that the enhancement of expressiveness will improve also
nonverbal accuracy in sending (see above).
The Program
Enriched by past research on nonverbal sensitivity, nonverbal sending, and educational
techniques for the improvement of nonverbal skill, a training program was developed for a
Teaching/Interaction Laboratory.
Objectives of the Program.
The program was directed at six objectives:
1. to improve Decoding Skills, i.e. the accuracy of decoding nonverbal cues;
2. to improve Encoding Ability by enhancing intensity, variety in the nonverbal functions
of expressing emotions, conveying interpersonal attitudes, framing verbal messages,
as well as in the para-linguistic and para-syntactic functions, and in the regulation of
interaction (in the dimensions of expressiveness and other orientation);
3. to increase Accuracy and Subtlety in De-/Encoding (multiple tracked messages
without interferences), or Self-Realism (increase of congruency between experienced
and observed performance);
4. to change attitudes (Directiveness: imposing, rigid attitudes) and personality
characteristics (extraversion);
5. to achieve a positive attitude to the training and its components.
6. to acquire background knowledge on nonverbal behavior and training methods to
improve nonverbal skill for subsequent training on-the-job after the end of the course
(not tested yet!)
19
The Contents of the Program
According to the research sketched above training programs are successful if their
contents are organized into sub-tasks which can be acquired in steps. Thus, the contents of the
present program were arranged according to tasks and components. They were divided first
according to areas which belong together from the aspect of production: into non-vocal
(kinesics) and vocal behavior; secondly, these areas were again divided into three sub
divisions according to the domains of functions - the affective, regulative, and cognitive
domain; thirdly, they were divided into seven specific functions of nonverbal behavior:
expression of emotions, attitudes, presentation of one’s own personality, affective framing of
verbal messages (affective domain); group management (regulative domain); para-semantic -
substituting/complementing, elaborating, modifying, contradicting - and para-syntactic –
emphasis, segmentation (cognitive domain). These functions were then related to expression
modes in which they are manifested in different degrees of intensity (facial expressions, gaze,
gestures, posture, and proxemics). Following the analytical/technical skills approach (Gage,
1972), the resulting sub-components were finally decomposed and described in terms of their
low inference constituents, skills and the skill clusters involved, because concrete descriptions
of such behaviors support an effective acquisition of cognitive representations which guide
action (Bandura, 1979; 1986).
Derived from this structure the program has consisted of three parts:
Part I dealt with the affective functions of non-vocal nonverbal behaviors (kinesics):
expression of emotions, interpersonal attitudes, presenting one’s personality to others, and
affective framing of the verbal message; regulation functions were included in this part
because of practical reasons. (Duration: Study 1: 365 minutes, Study 2: 690 minutes).
Part II of the program dealt with the cognitive functions of kinesics: parasemantic and
parasyntactic functions. (Duration: Study 1: 180 minutes; Study 2: 255 minutes).
Part III of the program aimed at the improvement of vocal nonverbal behavior (voice
delivery). Vocal behavior can fulfill all of the functions to about an equal degree (Duration:
Study 1: 180 minutes; Study 2: 240 minutes).
20
In the introductory and in the final session as well as during the training, theoretical
background information was provided with regard to the theoretical and empirical bases of
the program: the contents of the program (research on nonverbal aspects of communication)
and the approach to systematic training, the methods used, the program organization, and the
experimental study carried out in the course (Study 1: 45 min.; Study 2: 210 min.). Also,
recommendations for subsequent training on the job, including those for further reading, were
given (Study 1: 30 min.; Study 2: 90 min.).
The training was followed by a performance test (= posttest; see below), tests on
nonverbal sensitivity, personality inventories, and attitude tests. An end-course questionnaire
was administered to the participants who also gave their opinions on the program and its
elements in written and/or oral form. (Study 1: 210 min.; Study 2: 300 min.).
To the training and testing, about 155 (Study 1) or 240 minutes (Study 2) for pauses must
be added.
Structure and Components of the Training Program
To achieve these ambitious and long lasting objectives and to cover the enormous
amount of contents in a relatively short time, a program was designed using a
Teaching/Interaction Laboratory approach. Various laboratory experiences were developed as
on-campus activities, as an addition to the traditional mainstays of the education for
professions requiring intensive human interaction (lecture and coursework, the traditional
methods of induction: on-the-job training, apprenticeship etc.), namely model demonstrations,
1978; Klinzing, 1982; Klinzing & Floden, 1990). From the techniques mentioned above those
effective approaches were selected which fitted the prevailing conditions (time, rooms, sets of
equipment and personnel available, number of participants etc.), and the content of the
training (nonverbal decoding and encoding). These, then, were integrated into a
comprehensive training program (Study 1: two days, 20 hours; Study 2: three and a half days,
six to eight hours a day, see below). It was expected that the simultaneous enhancement of the
interrelated and overlapping processes, assumed by developers and researchers as crucial to
effective communication and teaching (and therefore worth improving in teaching/interaction
laboratories individually) and integrated by the framework of interacting as experimentation,
would have large constructive effects and help to prepare skillful and reflective practitioners -
an objective endorsed by prominent educators from Dewey (1904) to Berliner (1985).
This frame of reference was used to identify the interrelated processes and the abilities
contributing to effective nonverbal communication.
Thus, the learning process for each of the three parts and within the parts of the program is
based on the following components (see Klinzing & Floden, 1990, 178f):
Acquisition of Background Knowledge. This was made possible by formal instructions including lectures, readings, and discussion in small and large groups (based on written materials, about 100 pages), with focus on nonverbal processes. They were provided at the beginning and end of the training and in the respective parts of the training program. According to Klinzing & Floden (1990) the acquisition of background knowledge provides an overall framework of purposes, concepts, and their relationships, necessary for planning, interpreting, and evaluating nonverbal events. The program tried to incorporate the best evidence available about which concepts are important and about which sorts of nonverbal actions and reactions are most likely to lead to which consequences, under which contexts and circumstances. This framework should guide understanding, reflection on possible hypotheses, and provide the substantive basis for determining whether a given hypothesis is promising for improving communication. Since knowledge, insights, even attitudes which are acquired through reading or formal coursework do not lead to appropriate related performance (e.g., Aspy, 1972; Cohen, 1973; Evertson, Brophy, & Crawford, 1975; Klinzing et al., 1983;
22
Rosenshine, 1971; Tausch & Tausch, 1977), the aim was to link effectively theoretical knowledge to concepts of important nonverbal features, to guide analysis and to carry out actions skillfully. Also information was provided on the program-design, the training methods used, and their use for the improvement of nonverbal skills after the formal training course. Ability to Understand and Use Concepts as Organizing Tools: Discrimination Training, Skill Acquisition Exercises, Symbolic Modeling, and Simulations. Besides background knowledge interactants also need to be able to use concepts as organizational, analytical tools, when they are engaged in (or observing) communication processes. They must learn to recognize the key interaction patterns and to analyze them in terms of concepts. Once they can recognize these patterns, they can see how the immediate situation in a group fits with their background knowledge and thus generate promising hypotheses about what to do next. Furthermore, they must acquire cognitive representations that guide action. For both purposes lectures with pictures and life demonstrations focused on specific behaviors (symbolic and perceptual modeling). In addition, trainees were familiarized with techniques for the analysis of nonverbal cues. A program (Klinzing, 2003b) on decoding emotions from facial expressions was especially used for this purpose. Furthermore, decoding exercises, and skill acquisition exercises were offered. The latter should develop nonverbal skills by mimicking behaviors from the respective repertoire of each of the communication modes (e.g., facial expression, gesturing), by delivering news, fairy tales, reciting the alphabet or reading numbers in different emotional states in partner or group work; furthermore, the trainees were asked to identify nonverbal skills on the video recordings of practice sessions during the feedback phases. Hypothesis-Generation and Decision Making: Simulation, Development of Alternatives. The capacity for generating and testing hypotheses is the core of interacting as experimentation. Hypotheses about the consequences different lines of action will have for the individual interactant as well as for the overall course of the communication processes draw on the preceding knowledge and skill in formulating possibilities for action that seem most likely to help interactants most effectively to promote the aims and goals of a particular situation with a particular group of participants. Simulations of daily situations and the development of alternatives to the behaviors executed in the microtraining during the feedback sessions (Zifreund, 1966) were offered in the program. Capacity to Carry Out Actions Skillfully: Practice in Laboratory Settings. Background knowledge, concepts used as analytical and guiding tools, and promising hypotheses will do little to help interactants to express themselves nonverbally, unless they have the ability to carry through the actions that seem indicated, and to carry them through with the skill needed to make them match the interactants’ conception and intentions. The knowledge and abilities discussed so far are important preconditions, but are not enough in themselves. Skill in both thought and action is necessary for interacting as experimentation. Either, alone, can bring only well-considered fumbling or thoughtless action. To carry out skillfully the actions suggested by the hypothesis includes acquiring and refining skills and learning how to use them appropriately and effectively. Improvement in performance requires some form of practice. To make best use of interacting as experimentation, the settings for practice should - at least initially - be constrained, experimental, so that trainees can introduce controlled, planned variations and obtain focused feedback on their effects. Thus, for each part of the training program and its goals, practice in experimental settings, in a laboratory format, in groups of five to six peers (duration five to 10 minutes) were offered to the trainees. For part I of the program they consisted of conducting a conversation (e.g., the exchange of gossips, or narration of fairy tales), for part II in delivering an oration from a
23
given manuscript, and for part III in presenting difficult to read fables and interpreting them nonverbally from different points of view. For each microtraining session intensive and informative feedback by videotape recordings, structured observation by the participants, and discussions were provided. Ability to Learn from the Execution of Behavior: Reflective Discussions. To learn from the execution of behavior in the practice session in laboratory format is essential for improving the trainees’ thought and action. It involves assessing whether the interactants have carried out the actions effectively and appropriately, reflecting on and evaluating the consequences of that action, and using that reflection as one basis for the next cycle of hypothesis-generating and testing. These discussions were conducted in small groups reflecting on the execution of behaviors and their consequences in the microtraining during the feedback sessions.
The first two abilities are primarily cognitive; the last combines cognitive processes with
action. The capacity for generating hypotheses bridges thought and action. Hypotheses come
primarily from knowledge and analysis of the situation, and can then be thought through and
tested in action (see Klinzing & Floden, 1990).
Since, from a cognitive perspective, these five functions of interaction/teaching are
complementary and overlapping (Bandura, 1986), it seems logical to integrate them into the
design of a program. Moreover, neglecting one function (e.g., having background knowledge
and/or the reflection-based decision making ability without technical skills, or having the
technical skills accomplished without knowledge and the ability to reflect and to make
decisions on the effective and appropriate use of technical skills in a given situation) seems to
hinder the development of the interacting/teaching ability (Klinzing & Floden, 1990).
The first training was conducted with school principals (Study 1) as a two day intensive
course (first day: 13.5 hours; second day: 8.5 hours training); the same program was offered
to university students (Study 2) and was also conducted as an intensive course after the end of
the term in three and a half days (eight to nine hours daily, 35 hours in total).
The Studies
The two studies, integrated into regular, two credit-hour courses for inservice training
(school principals), for the preparation of pedagogues, or secondary school teachers
(university students), were to assess the effectiveness of the program and its evaluation by the
24
participants. They were conducted at an inservice institution in Northrhein-Westfalia and at
the University of Tuebingen (FRG).
The following effects were hypothesized for both studies (Hypotheses are stated as null-
hypotheses).
Hypotheses
The hypotheses for both studies were addressed to decoding abilities, encoding abilities,
accuracy on de-/encoding/self-realism as an important aspect of general social competence,
effects of the training program on attitudes (directiveness) and personality characteristics
(extraversion), and the evaluation of the program. Following a common practice in projects of
the kind reported here (Klinzing, 1982; Klinzing, Klinzing-Eurich & Floden, 1989), the
opportunity was seized to investigate experimental hypotheses which go beyond testing the
effectiveness and evaluation of the training approaches: differences between groups, gender
effects, relationships between encoding and decoding skill, and selected personality and
psychosocial correlates of skilled nonverbal receivers and senders.
1. Improvement of Decoding Ability: Accurateness in Decoding Emotions and Affects: 1.1 There will be no significant (p< .05) differences between treatment conditions (nonverbal
behavior training versus no training) on Nonverbal Sensitivity at the time of the posttest (assessed by PONS);
1.2 There will be no significant (p< .05) differences between treatment conditions on the
accuracy of decoding emotions from facial expressions in intuitive (immediate judgment of one second) and analytic judgments (repeated judgment after six seconds) at the time of the posttest (assessed by the Test on Decoding Emotions from Facial Expressions);
1.3 There will be no significant (p< .05) improvement from intuitive to analytic at the time of
the posttest in both treatment conditions (assessed by the Test on Decoding Emotions from Facial Expressions);
1.4 There will be no significant (p< .05) differences between treatment conditions for the
improvement from intuitive to analytic judgment and the proportion of positive changes from intuitive to analytic judgment to all changes (assessed by the Test on Decoding Emotions from Facial Expressions).
2. Improvement of Encoding Ability: Expressiveness and Other-Orientation: 2.1 There will be no significant (p< .05) differences between treatment conditions (nonverbal
behavior training versus no training) in the performance tests at the time of the posttests on self-rated and alter-rated competence: “Expressiveness”;
25
2.2 There will be no significant (p< .05) differences between treatment conditions in the performance tests at the time of the posttest on self-rated and alter-rated competence: “Other-Orientation”.
3. Improvement of Accuracy of Decoding and Encoding (Increase of Self-Realism as an
Aspect of General Social Competence): Reduction of Discrepancies Between Experienced Performance and Observed Performance).
3.1 There will be no significant (p< .05) differences between treatment conditions (nonverbal
behavior training versus no training) at the time of the posttest on Accuracy of De-/Encoding (Self-Realism = reduction of discrepancies of self-rated and alter-rated competence) for “Expressiveness”;
3.2 There will be no significant (p< .05) differences between treatment conditions at the time
of the posttest on Accuracy of De-/Encoding (Self-Realism) for “Other-Orientation”. 4. Changes in Personality Characteristics and Attitudes: Directiveness (Rigid or Imposing
Attitudes), and Extraversion (Study 2 only).
4.1 There will be no significant (p< .05) differences between treatment conditions (nonverbal behavior training versus no training) at the time of the posttest on Extraversion;
4.2 There will be no significant (p< .05) differences between treatment conditions at the time
of the posttest on Directiveness (rigid, imposing attitudes).
5. Evaluation of the Program: 5.1 There will be no favorable evaluation of the training course by the participants at the end
of the training;
5.2 There will be no favorable rating of the training course by the participants six months after the end of the training.
6. Examination of Differences of and Relationships Among Variables Beyond Testing the Effectiveness of the Program and Its Evaluation: Differences Between Groups, Female and Male Students, Relationships between Decoding and Encoding Abilities, and Nonverbal Skill and Selected Personality and Psycho-Social Characteristics.
6.1 Differences between Groups (School Principals and University Students): 6.1.1.1 There will be no significant (p< .05) differences between school principals and
university students in Nonverbal Sensitivity (PONS); 6.1.1.2 There will be no significant (p< .05) differences between school principals and
university students in the Accuracy of Decoding Emotions from Facial Expressions: intuitive and analytic decoding, improvements from intuitive to analytic judgment, and positive changes from intuitive to analytic judgment to all changes.
6.1.2 There will be no significant (p< .05) differences between school principals and
university students in self-rated and alter-rated Expressiveness and Other Orientation; 6.1.3 There will be no significant (p< .05) differences between school principals and
university students for Accuracy of De-/Encoding (Self-Realism);
26
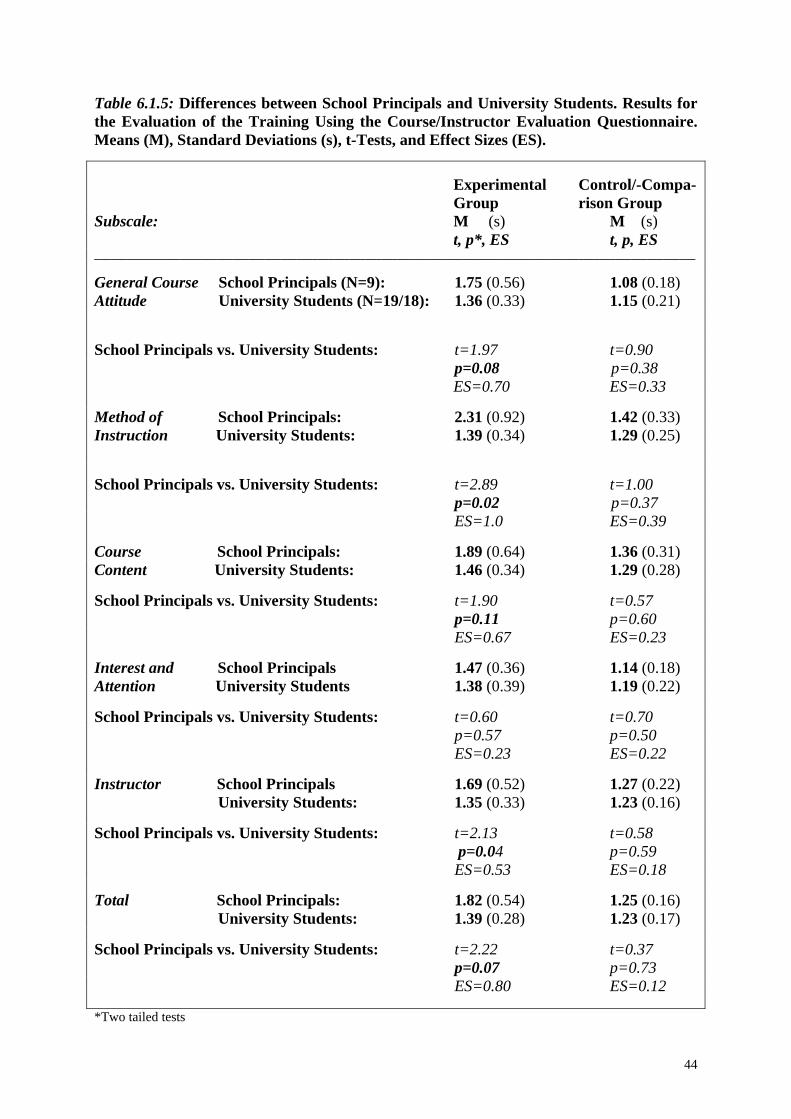
6.1.5 There will be no significant (p< .05) differences between school principals and university students for the evaluation of the program.
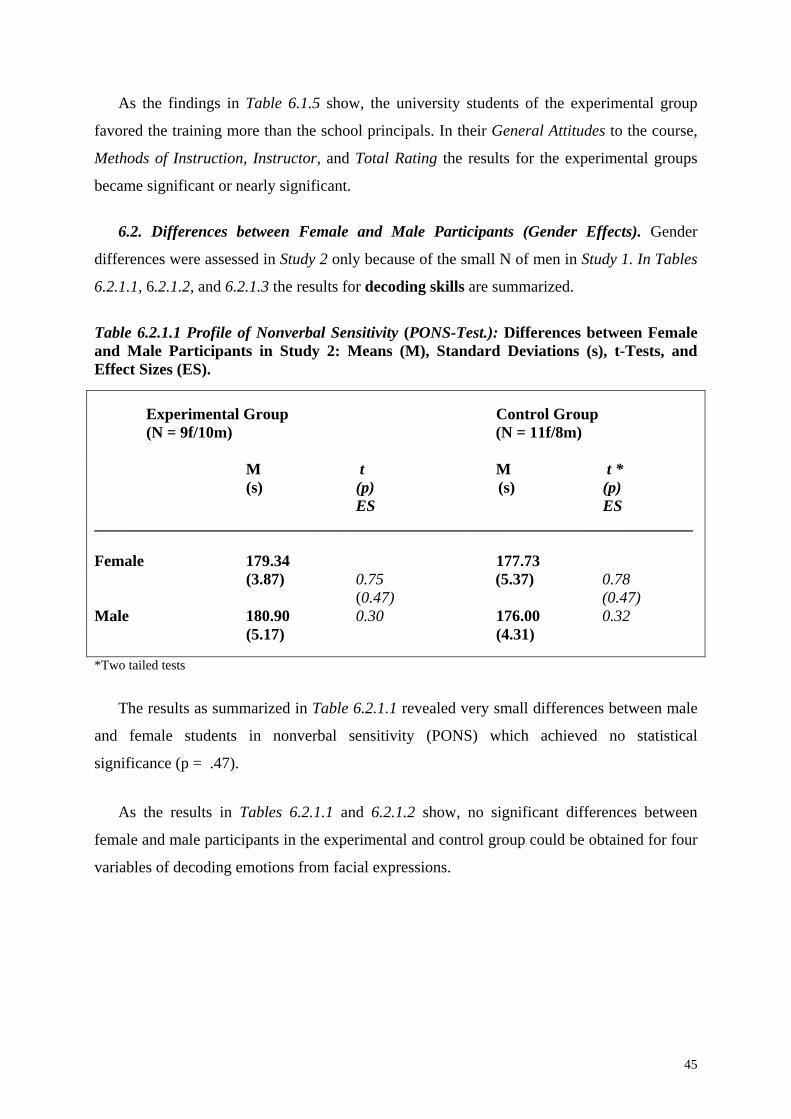
6.2 Differences between Male and Female Trainees: Gender Effects (Study 2). 6.2.1.1 There will be no significant (p< .05) differences between male and female participants
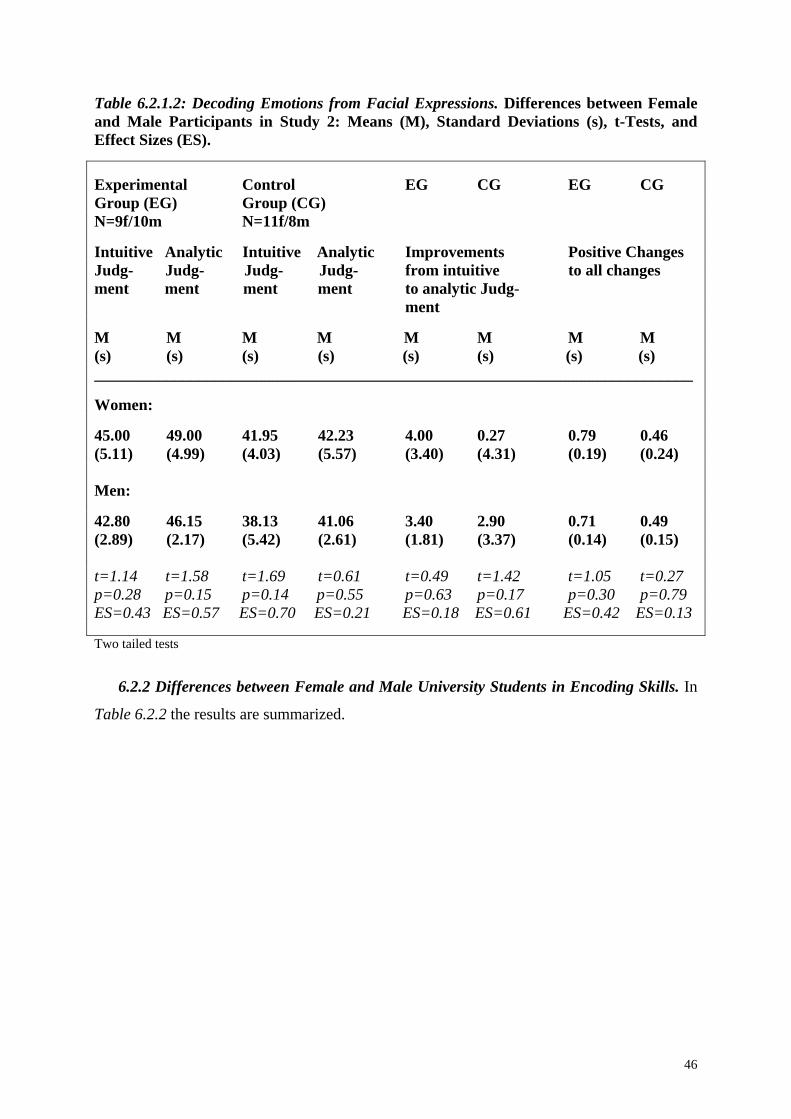
in Nonverbal Sensitivity (PONS); 6.2.1.2 There will be no significant (p< .05) differences between male and female participants
in the Accuracy of Decoding Emotions from Facial Expressions: intuitive and analytic decoding, improvements from intuitive to analytic judgment, and positive changes from intuitive to analytic judgment to all changes;
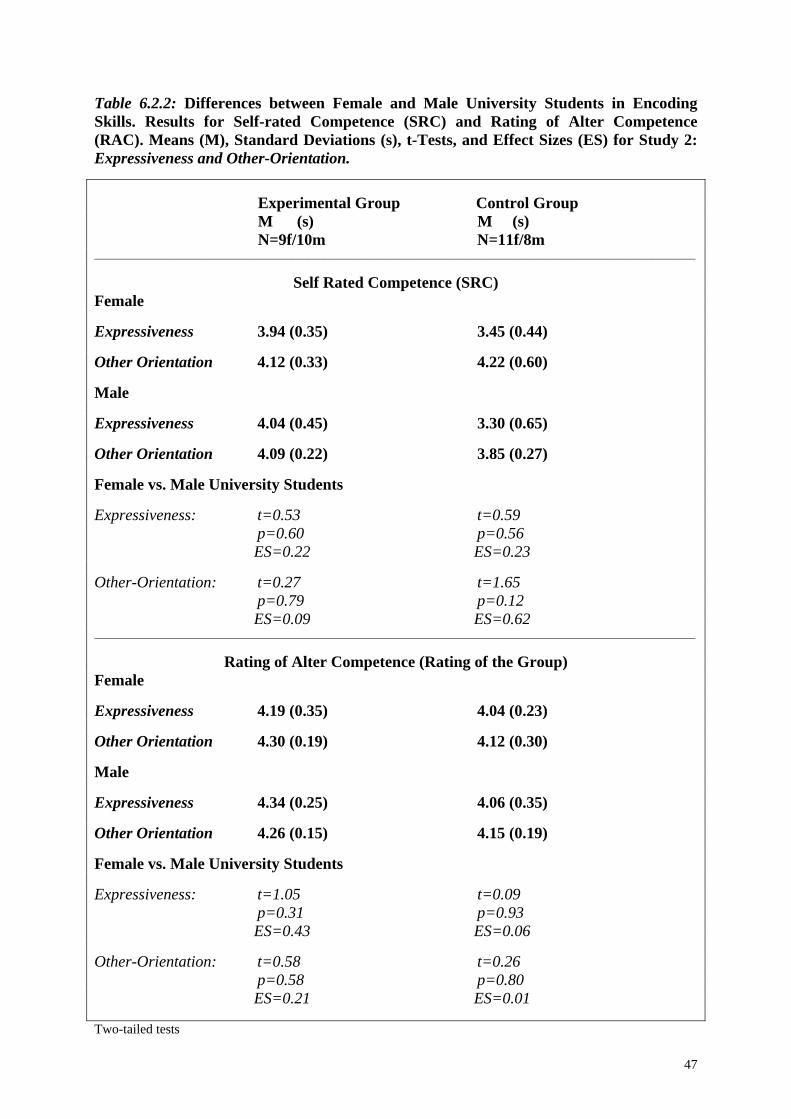
6.2.2 There will be no significant (p< .05) differences between male and female university
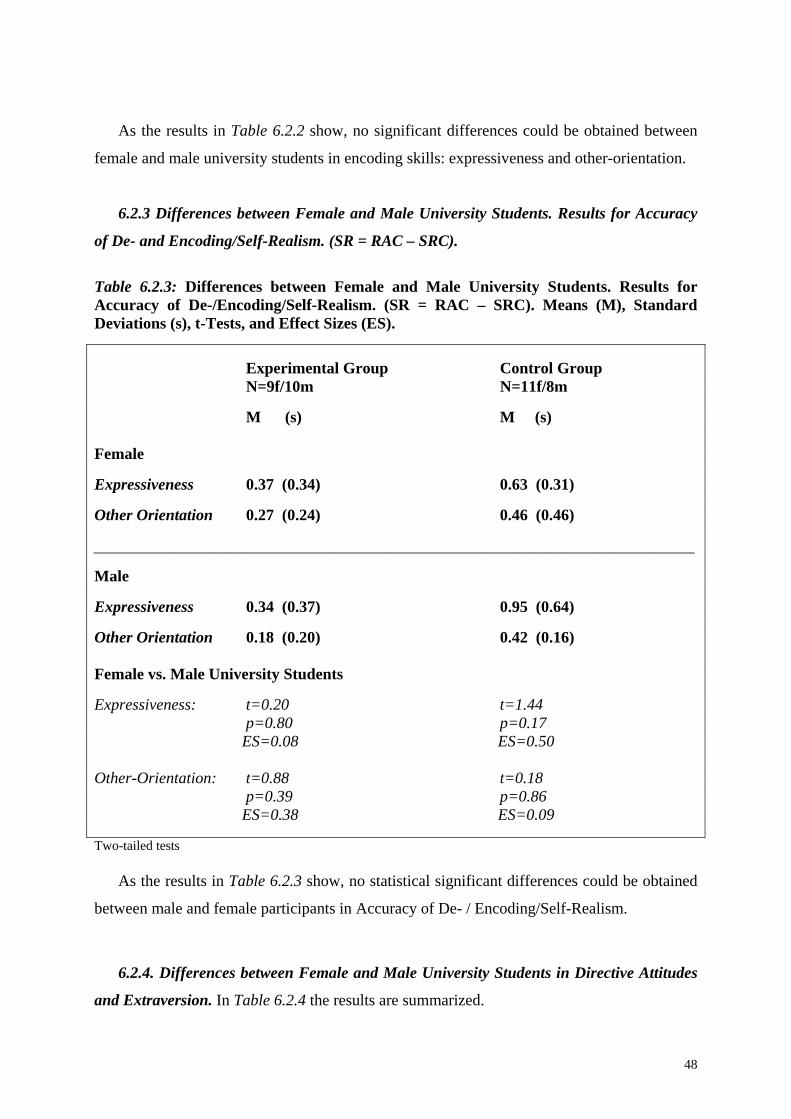
students in Self and Alter Rated Expressiveness and Other-Orientation; 6.2.3 There will be no significant (p< .05) differences between male and female university
students in Accuracy of De-/Encoding (Self-Realism); 6.2.4 There will be no significant (p< .05) differences between female and male university
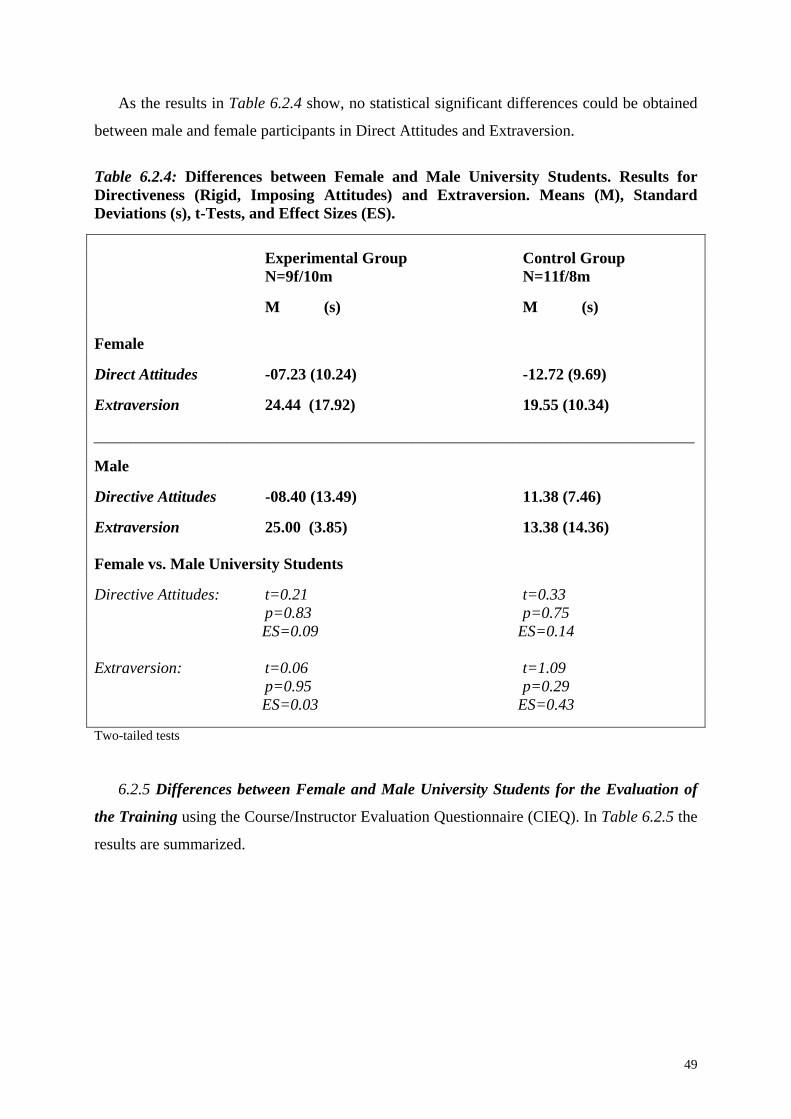
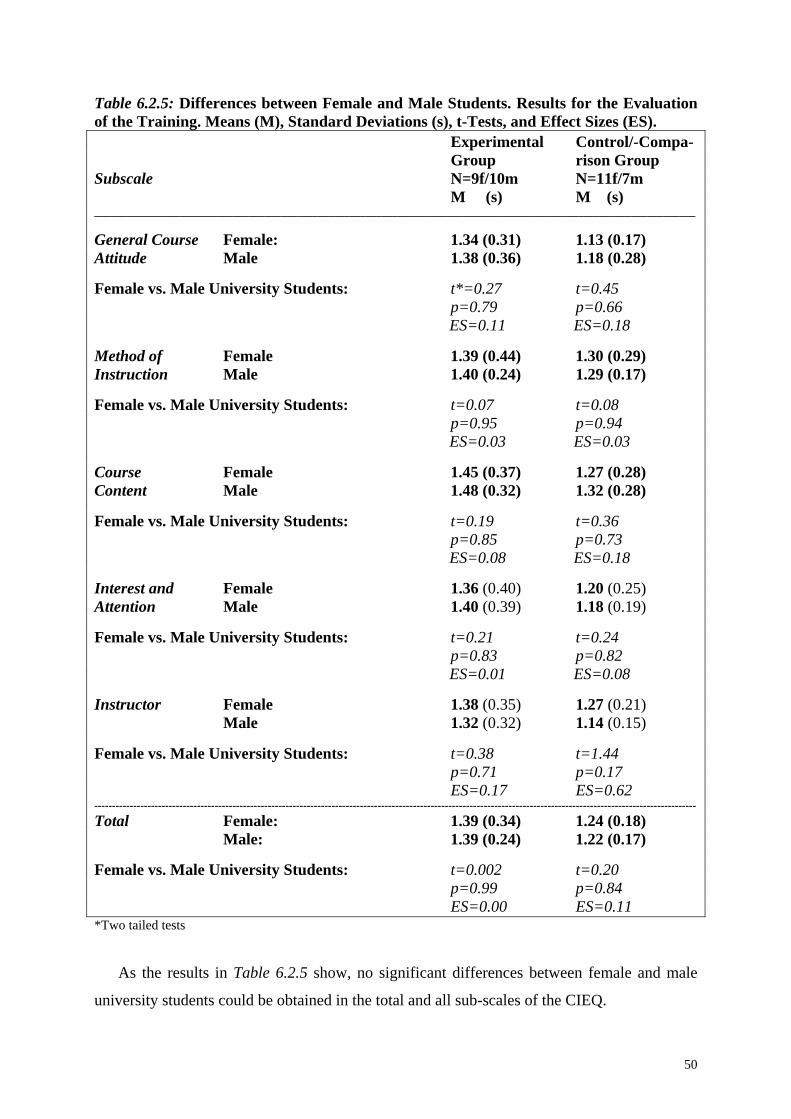
students in Directiveness (rigid, imposing attitudes) and Extraversion; 6.2.5 There will be no significant (p< .05) differences between female and male university
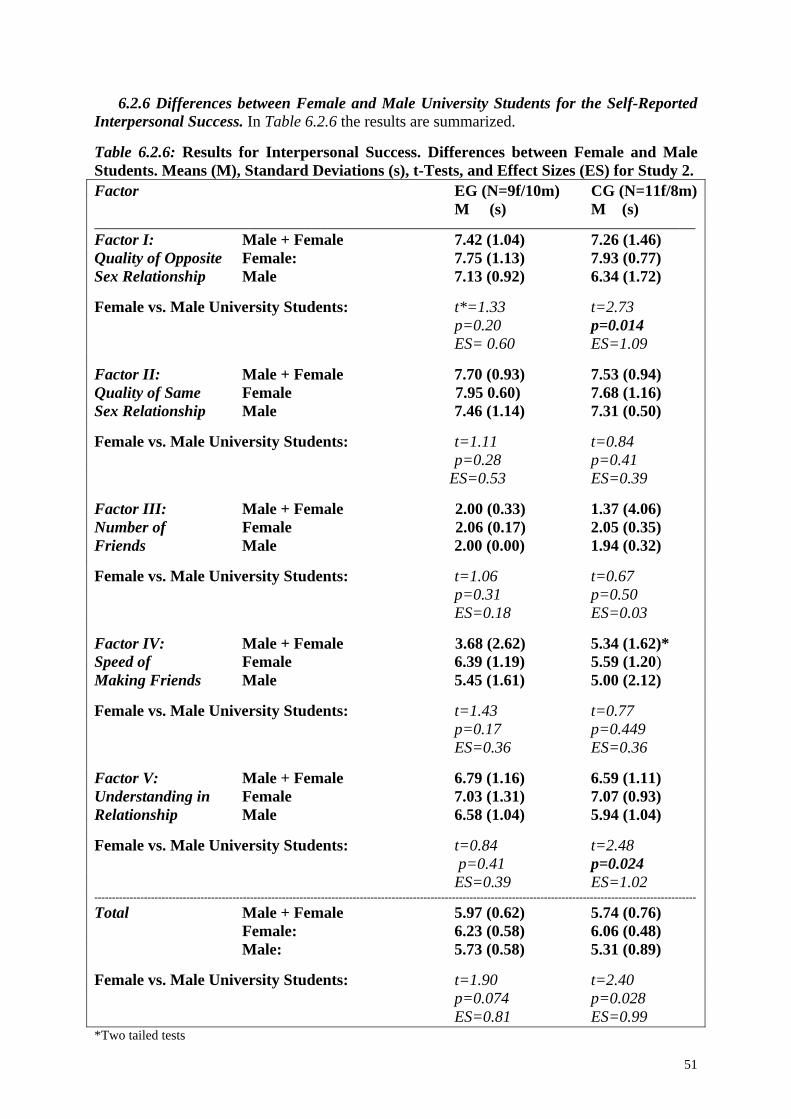
students in the evaluation of the program; 6.2.6 There will be no significant (p< .05) differences between female and male university
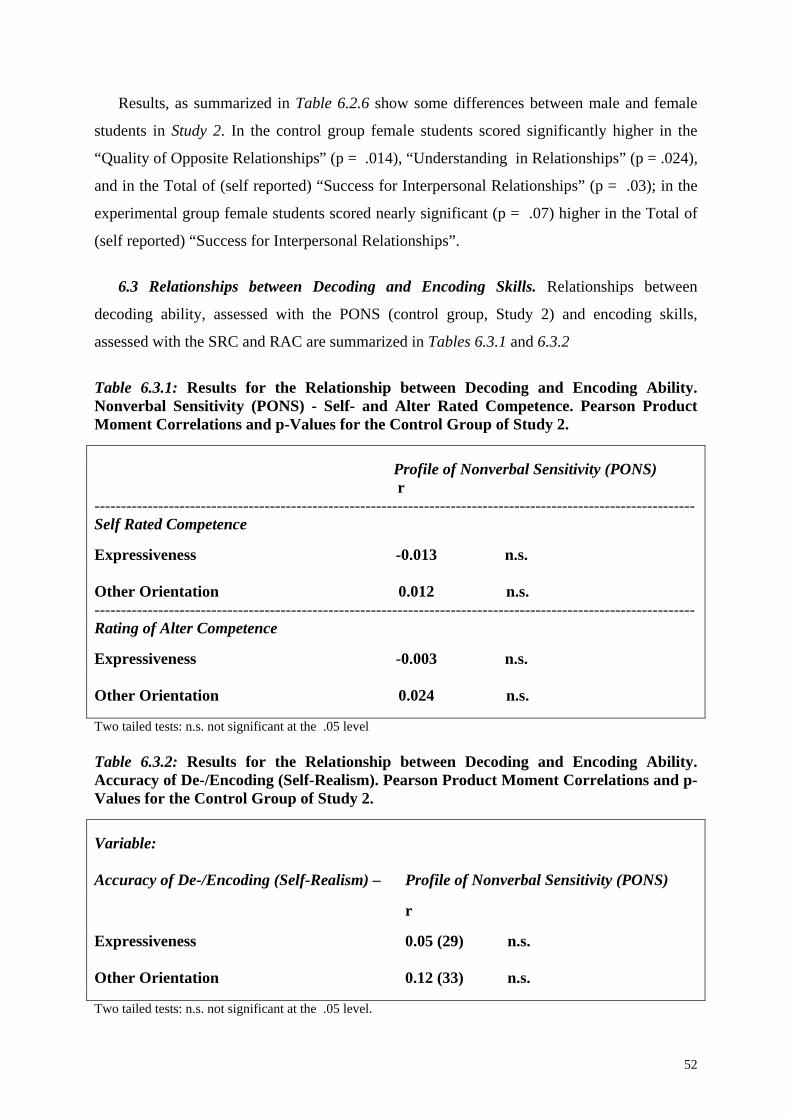
students for (self-reported) Interpersonal Success; 6.3 Relationships between De- and Encoding Abilities. 6.3.1 There will be no significant (p< .05) relationships between Decoding (PONS) and
Encoding skills (SRC, RAC, Study 1 and 2); 6.3.2 There will be no significant (p< .05) relationships between Decoding (PONS) and the
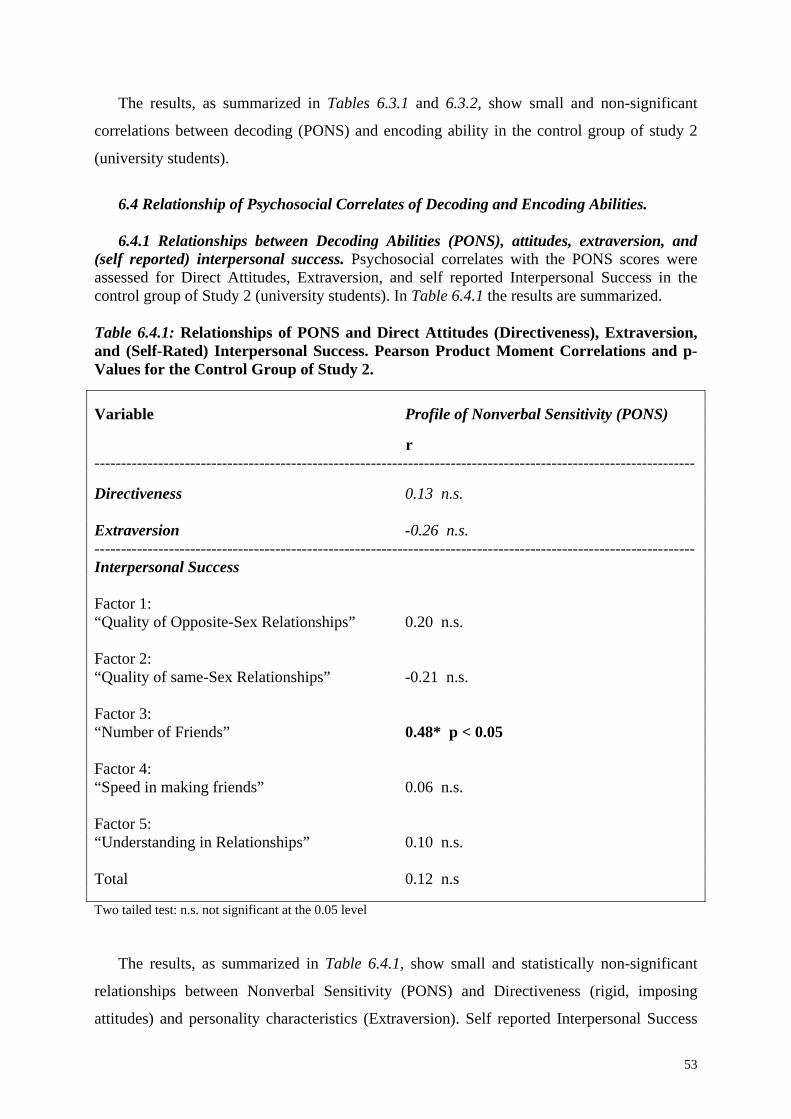
Accuracy of De-/Encoding (Self-Realism) (Study 1 and 2). 6.4 Relationships between Psychosocial Variables and Decoding and Encoding Abilities: 6.4.1 There will be no significant (p< .05) relationships between Decoding Abilities (PONS)
and Extraversion, Directiveness (rigid, imposing attitudes), and factors of (self-reported) Interpersonal Success;
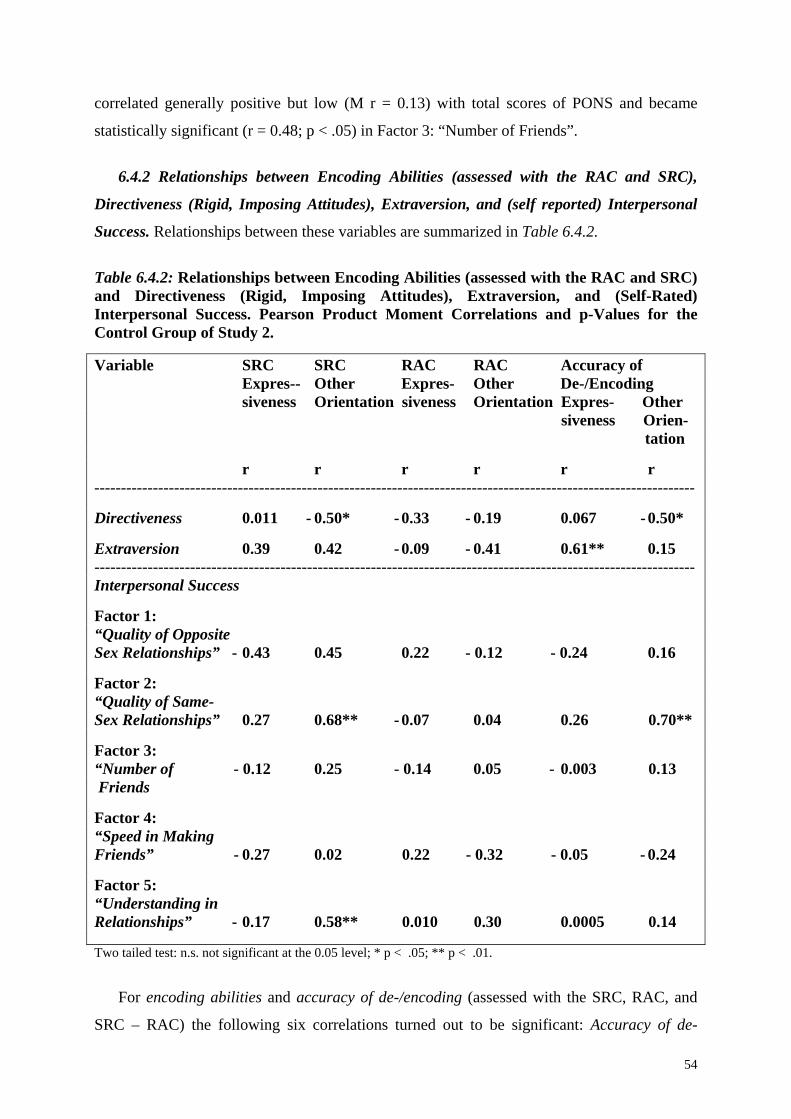
6.4.2 There will be no significant (p< .05) relationships between Encoding Abilities (SRC,
ARC) and Extraversion, Directiveness (rigid, imposing attitudes), and factors of (self reported) Interpersonal Success.
Methods and Data Source
Design of the Studies. The effects of the program were investigated using a post-test-only-
control-group design in both studies. Participants were stratified by gender, and then
randomly assigned within strata to the experimental conditions. In both studies, the control
groups which had no training at this point of time received after their tests a similar training
27
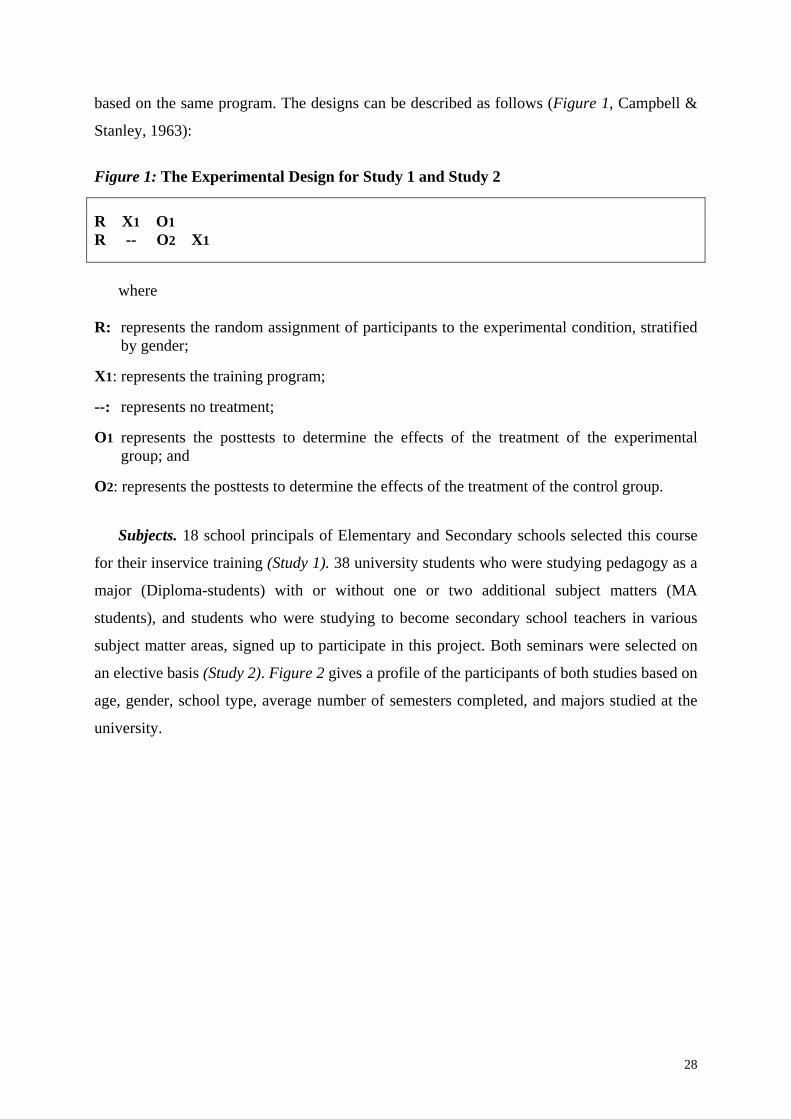
based on the same program. The designs can be described as follows (Figure 1, Campbell &
Stanley, 1963):
Figure 1: The Experimental Design for Study 1 and Study 2 R X1 O1 R -- O2 X1
where R: represents the random assignment of participants to the experimental condition, stratified
by gender; X1: represents the training program; --: represents no treatment; O1 represents the posttests to determine the effects of the treatment of the experimental
group; and O2: represents the posttests to determine the effects of the treatment of the control group. Subjects. 18 school principals of Elementary and Secondary schools selected this course
for their inservice training (Study 1). 38 university students who were studying pedagogy as a
major (Diploma-students) with or without one or two additional subject matters (MA
students), and students who were studying to become secondary school teachers in various
subject matter areas, signed up to participate in this project. Both seminars were selected on
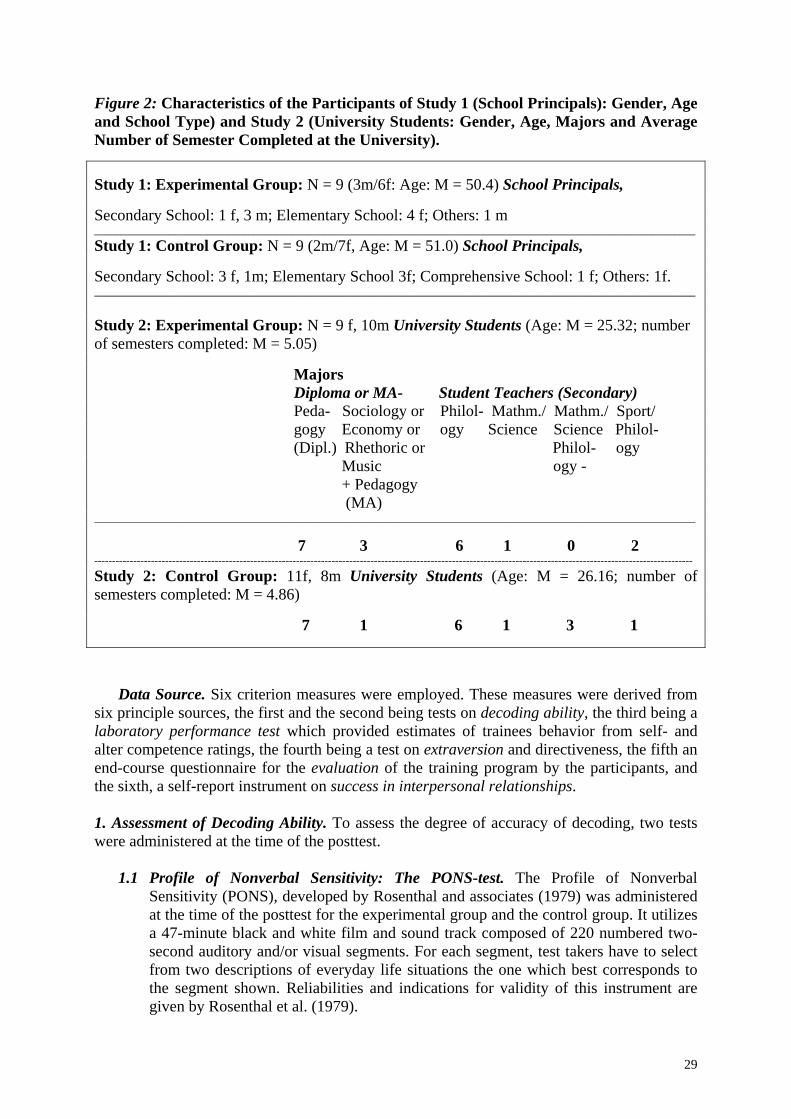
an elective basis (Study 2). Figure 2 gives a profile of the participants of both studies based on
age, gender, school type, average number of semesters completed, and majors studied at the
university.
28
Figure 2: Characteristics of the Participants of Study 1 (School Principals): Gender, Age and School Type) and Study 2 (University Students: Gender, Age, Majors and Average Number of Semester Completed at the University). Study 1: Experimental Group: N = 9 (3m/6f: Age: M = 50.4) School Principals, Secondary School: 1 f, 3 m; Elementary School: 4 f; Others: 1 m _________________________________________________________________________________________________________________ Study 1: Control Group: N = 9 (2m/7f, Age: M = 51.0) School Principals, Secondary School: 3 f, 1m; Elementary School 3f; Comprehensive School: 1 f; Others: 1f. _________________________________________________________________________________________________________________ Study 2: Experimental Group: N = 9 f, 10m University Students (Age: M = 25.32; number of semesters completed: M = 5.05) Majors Diploma or MA- Student Teachers (Secondary) Peda- Sociology or Philol- Mathm./ Mathm./ Sport/ gogy Economy or ogy Science Science Philol- (Dipl.) Rhethoric or Philol- ogy Music ogy - + Pedagogy (MA) _________________________________________________________________________________________________________________ 7 3 6 1 0 2 ------------------------------------------------------------------------------------------------------------------------------------------------------------------------- Study 2: Control Group: 11f, 8m University Students (Age: M = 26.16; number of semesters completed: M = 4.86)
7 1 6 1 3 1
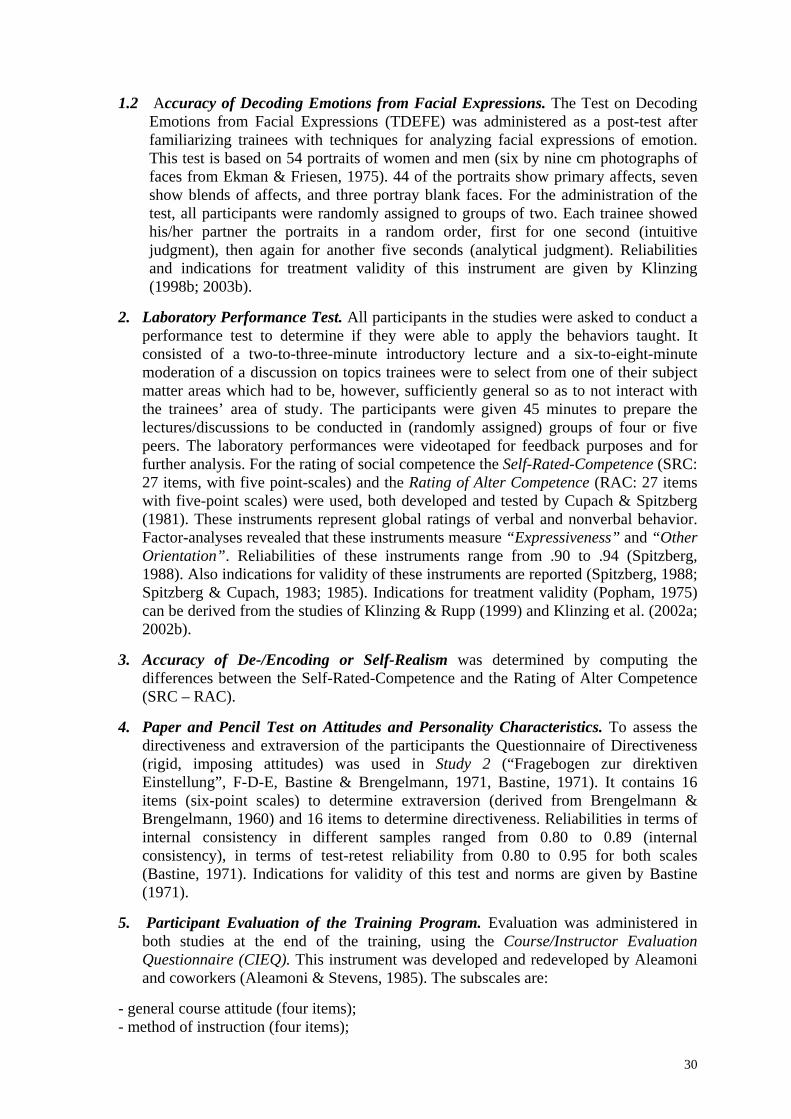
Data Source. Six criterion measures were employed. These measures were derived from six principle sources, the first and the second being tests on decoding ability, the third being a laboratory performance test which provided estimates of trainees behavior from self- and alter competence ratings, the fourth being a test on extraversion and directiveness, the fifth an end-course questionnaire for the evaluation of the training program by the participants, and the sixth, a self-report instrument on success in interpersonal relationships. 1. Assessment of Decoding Ability. To assess the degree of accuracy of decoding, two tests were administered at the time of the posttest.
1.1 Profile of Nonverbal Sensitivity: The PONS-test. The Profile of Nonverbal
Sensitivity (PONS), developed by Rosenthal and associates (1979) was administered at the time of the posttest for the experimental group and the control group. It utilizes a 47-minute black and white film and sound track composed of 220 numbered two-second auditory and/or visual segments. For each segment, test takers have to select from two descriptions of everyday life situations the one which best corresponds to the segment shown. Reliabilities and indications for validity of this instrument are given by Rosenthal et al. (1979).
29
1.2 Accuracy of Decoding Emotions from Facial Expressions. The Test on Decoding Emotions from Facial Expressions (TDEFE) was administered as a post-test after familiarizing trainees with techniques for analyzing facial expressions of emotion. This test is based on 54 portraits of women and men (six by nine cm photographs of faces from Ekman & Friesen, 1975). 44 of the portraits show primary affects, seven show blends of affects, and three portray blank faces. For the administration of the test, all participants were randomly assigned to groups of two. Each trainee showed his/her partner the portraits in a random order, first for one second (intuitive judgment), then again for another five seconds (analytical judgment). Reliabilities and indications for treatment validity of this instrument are given by Klinzing (1998b; 2003b).
2. Laboratory Performance Test. All participants in the studies were asked to conduct a
performance test to determine if they were able to apply the behaviors taught. It consisted of a two-to-three-minute introductory lecture and a six-to-eight-minute moderation of a discussion on topics trainees were to select from one of their subject matter areas which had to be, however, sufficiently general so as to not interact with the trainees’ area of study. The participants were given 45 minutes to prepare the lectures/discussions to be conducted in (randomly assigned) groups of four or five peers. The laboratory performances were videotaped for feedback purposes and for further analysis. For the rating of social competence the Self-Rated-Competence (SRC: 27 items, with five point-scales) and the Rating of Alter Competence (RAC: 27 items with five-point scales) were used, both developed and tested by Cupach & Spitzberg (1981). These instruments represent global ratings of verbal and nonverbal behavior. Factor-analyses revealed that these instruments measure “Expressiveness” and “Other Orientation”. Reliabilities of these instruments range from .90 to .94 (Spitzberg, 1988). Also indications for validity of these instruments are reported (Spitzberg, 1988; Spitzberg & Cupach, 1983; 1985). Indications for treatment validity (Popham, 1975) can be derived from the studies of Klinzing & Rupp (1999) and Klinzing et al. (2002a; 2002b).
3. Accuracy of De-/Encoding or Self-Realism was determined by computing the
differences between the Self-Rated-Competence and the Rating of Alter Competence (SRC – RAC).
4. Paper and Pencil Test on Attitudes and Personality Characteristics. To assess the
directiveness and extraversion of the participants the Questionnaire of Directiveness (rigid, imposing attitudes) was used in Study 2 (“Fragebogen zur direktiven Einstellung”, F-D-E, Bastine & Brengelmann, 1971, Bastine, 1971). It contains 16 items (six-point scales) to determine extraversion (derived from Brengelmann & Brengelmann, 1960) and 16 items to determine directiveness. Reliabilities in terms of internal consistency in different samples ranged from 0.80 to 0.89 (internal consistency), in terms of test-retest reliability from 0.80 to 0.95 for both scales (Bastine, 1971). Indications for validity of this test and norms are given by Bastine (1971).
5. Participant Evaluation of the Training Program. Evaluation was administered in
both studies at the end of the training, using the Course/Instructor Evaluation Questionnaire (CIEQ). This instrument was developed and redeveloped by Aleamoni and coworkers (Aleamoni & Stevens, 1985). The subscales are:
- general course attitude (four items); - method of instruction (four items);
30
- course content (four items); - interest and attention (four items), and - instructor (five items). Information regarding reliabilities, aspects of validity, and norms are given by Aleamoni & Stephens (1986). Studies on the German version of this instrument confirm the findings of Aleamoni and coworkers (Klinzing et al., 2002b). This instrument was administered directly after the end of the training and again by mail five to six months later. 6. Other Instruments. To examine correlates of nonverbal decoding and encoding skills (in addition to the instruments described above) the Self-Rating on Success in Current Relationships was administered in Study 2. This instrument consists of 16 items (nine-point scales). Factor analyses revealed five factors: 1. “Quality of Opposite Sex Relationships“; 2. “Quality of Same-Sex Relationships“; 3. “Number of Friends“; 4. “Speed in Making Friends“; 5. “Understanding in Relationships“, (Rosenthal et al., 1979). Reliabilities and indications of validity of this instrument are given by Rosenthal et al. (1979).
All data sources used in the studies possess sufficient validity and reliability.
Data Analysis
The data for hypotheses of group 1 to 5 were analyzed using t-tests. For hypotheses of
group 6 Pearson product-moment correlations were computed. It was hypothesized that all
comparisons would be at the p< .05 level of confidence.
Results
1. Results on Decoding Ability. Results of these analyses are summarized in Tables 1.1,
1.2, 1.3, and 1.4.
1.1 The results for the Profile of Nonverbal Sensitivity (PONS) are summarized in Table
1.1.
31
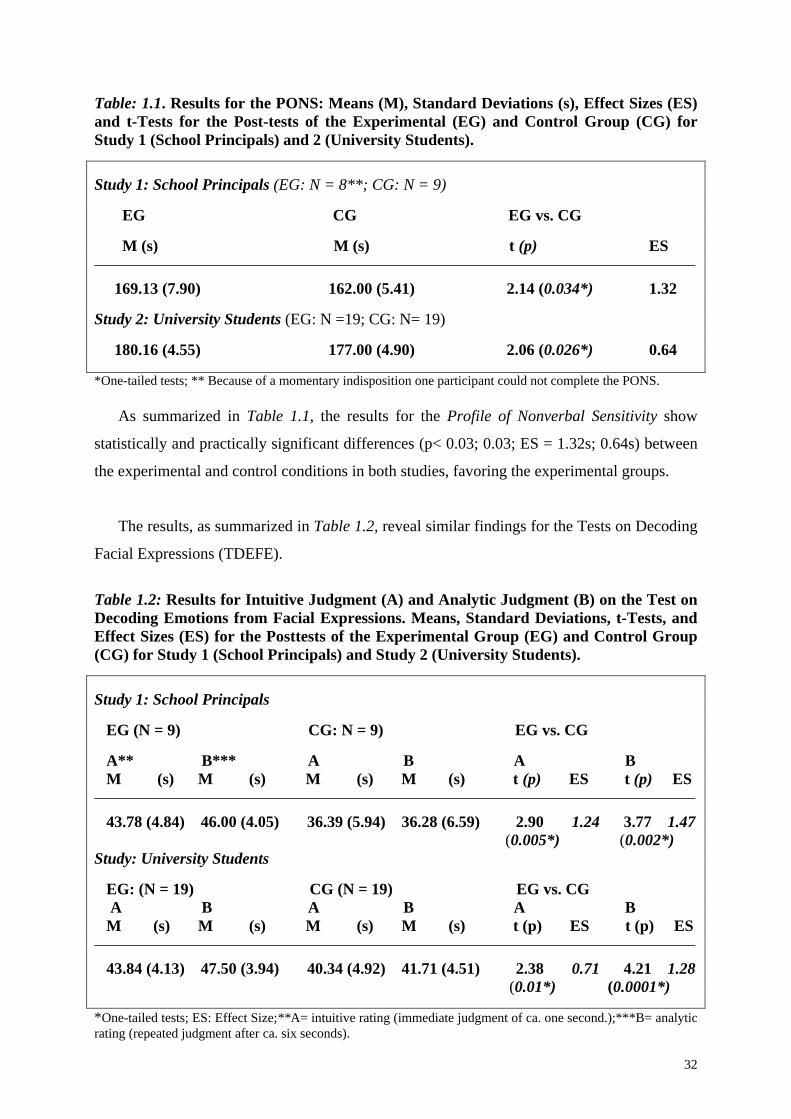
Table: 1.1. Results for the PONS: Means (M), Standard Deviations (s), Effect Sizes (ES) and t-Tests for the Post-tests of the Experimental (EG) and Control Group (CG) for Study 1 (School Principals) and 2 (University Students). Study 1: School Principals (EG: N = 8**; CG: N = 9) EG CG EG vs. CG M (s) M (s) t (p) ES _________________________________________________________________________________________________________________ 169.13 (7.90) 162.00 (5.41) 2.14 (0.034*) 1.32 Study 2: University Students (EG: N =19; CG: N= 19) 180.16 (4.55) 177.00 (4.90) 2.06 (0.026*) 0.64 *One-tailed tests; ** Because of a momentary indisposition one participant could not complete the PONS. As summarized in Table 1.1, the results for the Profile of Nonverbal Sensitivity show
statistically and practically significant differences (p< 0.03; 0.03; ES = 1.32s; 0.64s) between
the experimental and control conditions in both studies, favoring the experimental groups.
The results, as summarized in Table 1.2, reveal similar findings for the Tests on Decoding
Facial Expressions (TDEFE).
Table 1.2: Results for Intuitive Judgment (A) and Analytic Judgment (B) on the Test on Decoding Emotions from Facial Expressions. Means, Standard Deviations, t-Tests, and Effect Sizes (ES) for the Posttests of the Experimental Group (EG) and Control Group (CG) for Study 1 (School Principals) and Study 2 (University Students). Study 1: School Principals EG (N = 9) CG: N = 9) EG vs. CG A** B*** A B A B M (s) M (s) M (s) M (s) t (p) ES t (p) ES _________________________________________________________________________________________________________________ 43.78 (4.84) 46.00 (4.05) 36.39 (5.94) 36.28 (6.59) 2.90 1.24 3.77 1.47 (0.005*) (0.002*) Study: University Students EG: (N = 19) CG (N = 19) EG vs. CG A B A B A B M (s) M (s) M (s) M (s) t (p) ES t (p) ES _________________________________________________________________________________________________________________ 43.84 (4.13) 47.50 (3.94) 40.34 (4.92) 41.71 (4.51) 2.38 0.71 4.21 1.28 (0.01*) (0.0001*) *One-tailed tests; ES: Effect Size;**A= intuitive rating (immediate judgment of ca. one second.);***B= analytic rating (repeated judgment after ca. six seconds).
32
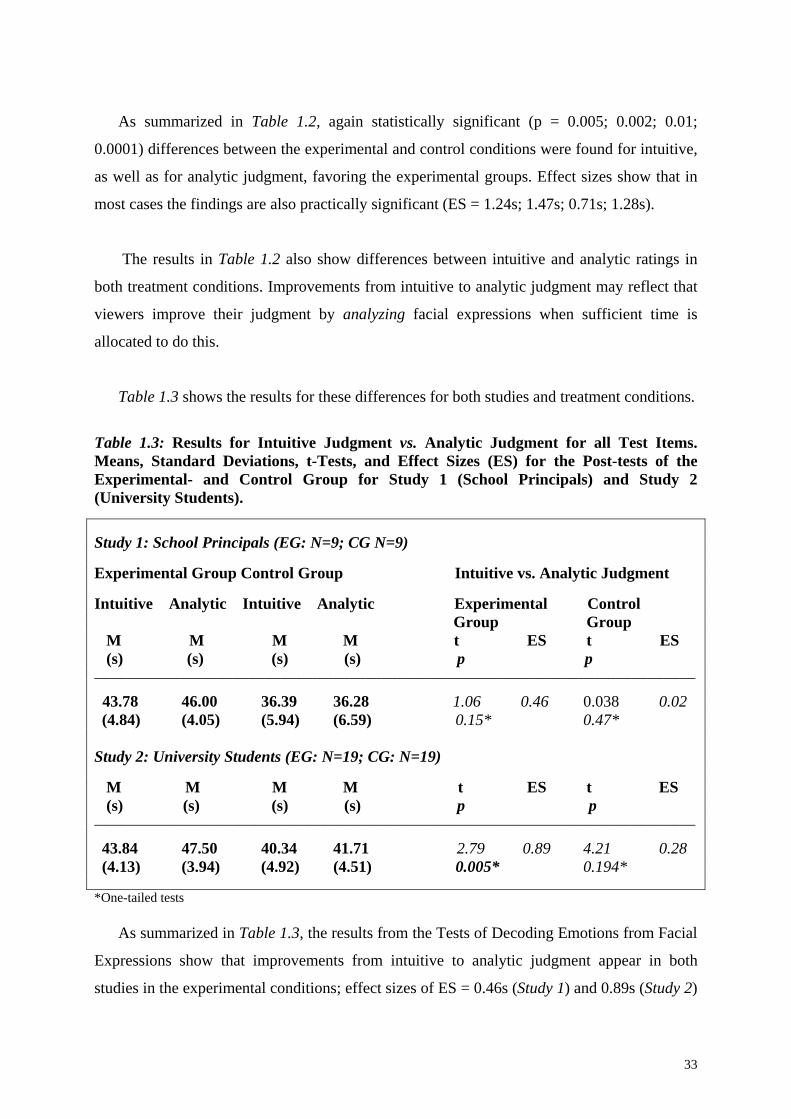
As summarized in Table 1.2, again statistically significant (p = 0.005; 0.002; 0.01;
0.0001) differences between the experimental and control conditions were found for intuitive,
as well as for analytic judgment, favoring the experimental groups. Effect sizes show that in
most cases the findings are also practically significant (ES = 1.24s; 1.47s; 0.71s; 1.28s).
The results in Table 1.2 also show differences between intuitive and analytic ratings in
both treatment conditions. Improvements from intuitive to analytic judgment may reflect that
viewers improve their judgment by analyzing facial expressions when sufficient time is
allocated to do this.
Table 1.3 shows the results for these differences for both studies and treatment conditions.
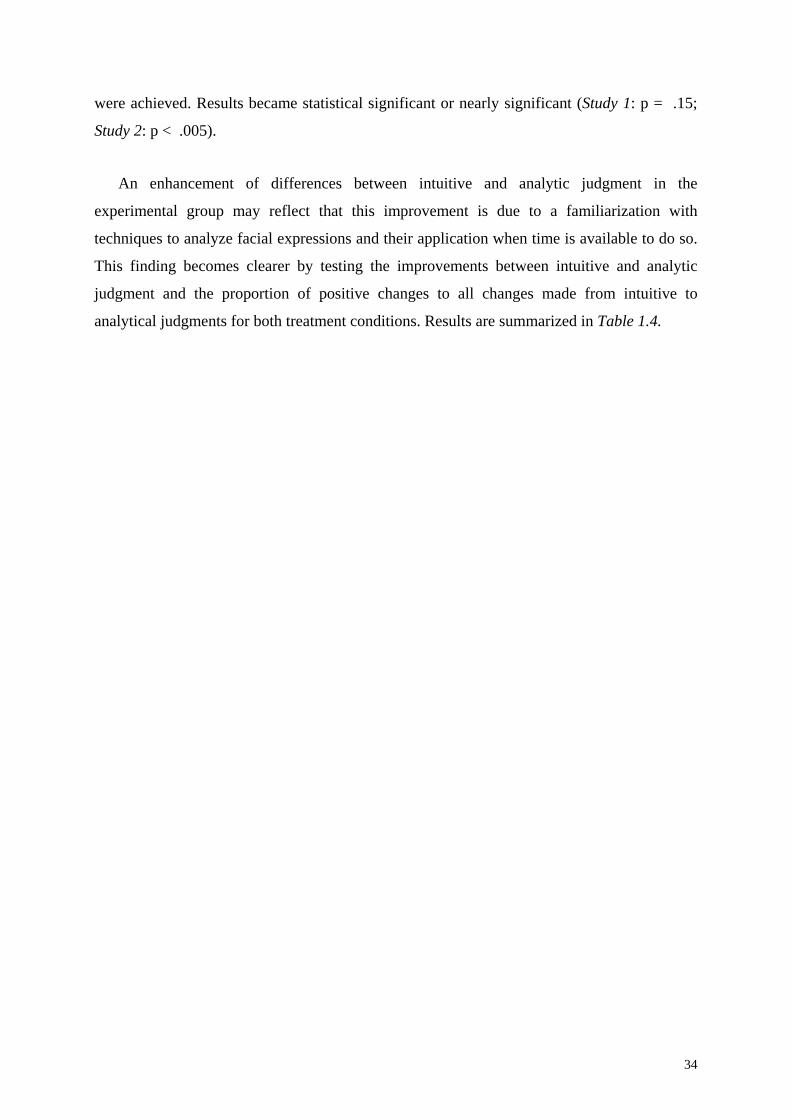
Table 1.3: Results for Intuitive Judgment vs. Analytic Judgment for all Test Items. Means, Standard Deviations, t-Tests, and Effect Sizes (ES) for the Post-tests of the Experimental- and Control Group for Study 1 (School Principals) and Study 2 (University Students). Study 1: School Principals (EG: N=9; CG N=9) Experimental Group Control Group Intuitive vs. Analytic Judgment Intuitive Analytic Intuitive Analytic Experimental Control Group Group M M M M t ES t ES (s) (s) (s) (s) p p _________________________________________________________________________________________________________________ 43.78 46.00 36.39 36.28 1.06 0.46 0.038 0.02 (4.84) (4.05) (5.94) (6.59) 0.15* 0.47* Study 2: University Students (EG: N=19; CG: N=19) M M M M t ES t ES (s) (s) (s) (s) p p _________________________________________________________________________________________________________________ 43.84 47.50 40.34 41.71 2.79 0.89 4.21 0.28 (4.13) (3.94) (4.92) (4.51) 0.005* 0.194* *One-tailed tests As summarized in Table 1.3, the results from the Tests of Decoding Emotions from Facial
Expressions show that improvements from intuitive to analytic judgment appear in both
studies in the experimental conditions; effect sizes of ES = 0.46s (Study 1) and 0.89s (Study 2)
33
were achieved. Results became statistical significant or nearly significant (Study 1: p = .15;
Study 2: p < .005).
An enhancement of differences between intuitive and analytic judgment in the
experimental group may reflect that this improvement is due to a familiarization with
techniques to analyze facial expressions and their application when time is available to do so.
This finding becomes clearer by testing the improvements between intuitive and analytic
judgment and the proportion of positive changes to all changes made from intuitive to
analytical judgments for both treatment conditions. Results are summarized in Table 1.4.
34
Table 1.4: Results for the Differences of Change and the Proportion Positive Changes from Intuitive Judgment (A) to Analytic Judgment (B) to all Changes. Means, Standard Deviations, t-Tests, and Effect Sizes (ES) for Study 1 (School Principals) and 2 (University Students). Study 1: School Principals Variable Control Experimental Experimental-/Control Group Group Group (N=9) (N=9) t-test* ES M M t/(p) (s) (s) -------------------------------------------------------------------------------------------------------------------------------------------------------------------------- Differences between: -Intuitive and -0.06 2.23 1.55 0.55s Analytic (4.17) (1.46) (0.07) Judgment -Positive 0.40 0.70 2.92 1.58s changes/ (0.19) (0.23) (0.005) all changes** Study 2: University Students Variable Control Experimental Experimental-/Control Group Group Group (N=19) (N=19) t-test ES M M t/(p) (s) (s) ----------------------------------------------------------------------------------------------------------------- Differences between: -Intuitive and 1.37 3.68 2.09 0.57s Analytic (4.06) (2.62) (0.0022) Judgment -Positive 0.75 1.47 4.56 1.40s changes/ (0.17) (0.20) (0.00005) all changes** *One tail tests; **positive changes/positive changes + negative changes + changes without consequences to the correctness or incorrectness of judging. As shown in Table 1.4, the differences in the improvement from intuitive to analytic
judgment turned out to be statistically significant (p < .07; .002; ES= 0.55s; 0.57s), favoring
the experimental groups in both studies. This finding is confirmed by calculating the
35
proportion of positive changes to all changes made from intuitive to analytical judgments:
Due to training, the amount of positive changes from intuitive to analytic decoding improved
significantly among school principals (p = .005; ES = 1.58s) and university students (p =
.00005; ES = 1.40s).
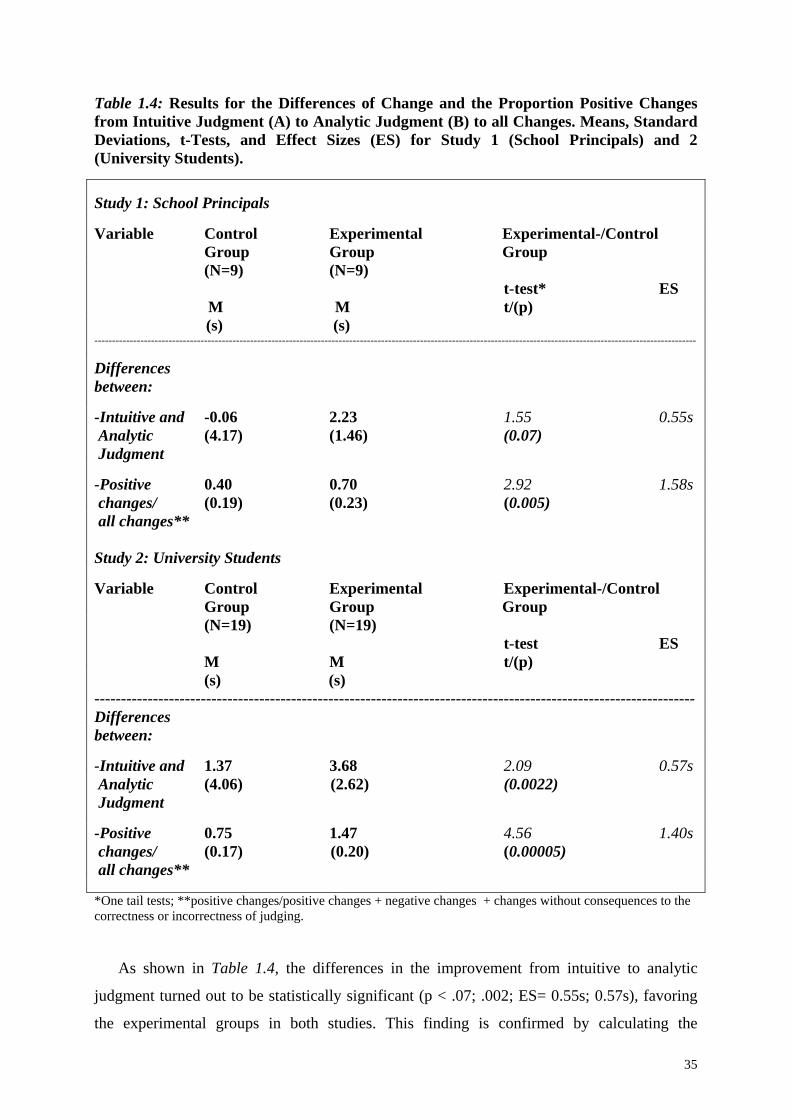
2. Results for Encoding Abilities: Self-rated Competence and Rating-of-Alter-
Competence for Expressiveness and Other Orientation. The results of these analyses are
summarized for Study 1 and Study 2 in Table 2.1 and 2.2.
Table 2.1: Results for Self-rated Competence (SRC) and Rating of Alter Competence (RAC). Means (M), Standard Deviations (s), t-Tests, and Effect Sizes (ES) for Study 1 (School Principals) and 2 (University Students): Expressiveness. Study 1: EG (N=9) CG (N=9) EG vs. CG (School Principals) M (s) M (s) t (p)* ES _________________________________________________________________________________________________________________
Expressiveness 4.37 (0.16) 4.13 (0.26) 2.27 (p = 0.019) 0.92s _________________________________________________________________________________________________________________ Study 2: EG (N=19) CG (N=19) EG vs. CG (Univ. students) M (s) M (s) t (p) ES _________________________________________________________________________________________________________________
As the results in Table 2.1 indicate, there are significant improvements in both studies for
self-rated as well as for alter-rated competence in expressiveness (p=0.002; 0.02; 0.0002;
0.02) due to the training.
36
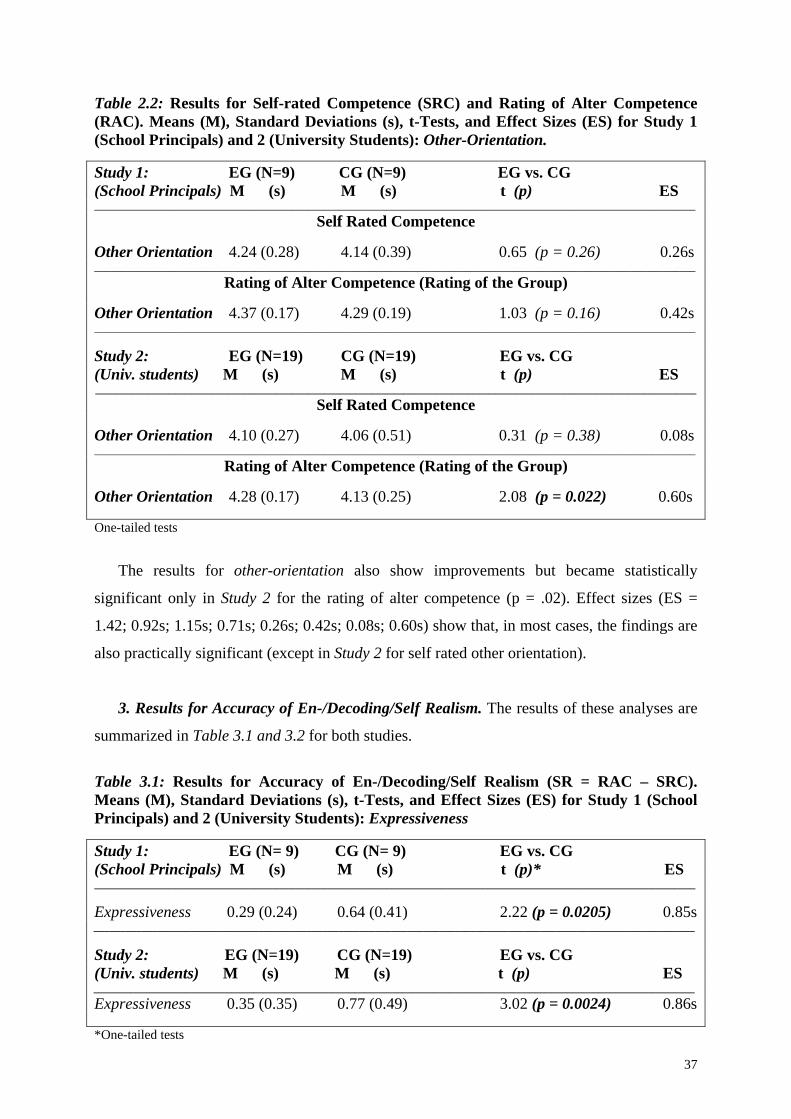
Table 2.2: Results for Self-rated Competence (SRC) and Rating of Alter Competence (RAC). Means (M), Standard Deviations (s), t-Tests, and Effect Sizes (ES) for Study 1 (School Principals) and 2 (University Students): Other-Orientation.
Study 1: EG (N=9) CG (N=9) EG vs. CG (School Principals) M (s) M (s) t (p) ES _________________________________________________________________________________________________________________
Other Orientation 4.37 (0.17) 4.29 (0.19) 1.03 (p = 0.16) 0.42s _________________________________________________________________________________________________________________ Study 2: EG (N=19) CG (N=19) EG vs. CG (Univ. students) M (s) M (s) t (p) ES _________________________________________________________________________________________________________________
The results for other-orientation also show improvements but became statistically
significant only in Study 2 for the rating of alter competence (p = .02). Effect sizes (ES =
1.42; 0.92s; 1.15s; 0.71s; 0.26s; 0.42s; 0.08s; 0.60s) show that, in most cases, the findings are
also practically significant (except in Study 2 for self rated other orientation).
3. Results for Accuracy of En-/Decoding/Self Realism. The results of these analyses are
summarized in Table 3.1 and 3.2 for both studies.
Table 3.1: Results for Accuracy of En-/Decoding/Self Realism (SR = RAC – SRC). Means (M), Standard Deviations (s), t-Tests, and Effect Sizes (ES) for Study 1 (School Principals) and 2 (University Students): Expressiveness
Study 1: EG (N= 9) CG (N= 9) EG vs. CG (School Principals) M (s) M (s) t (p)* ES _________________________________________________________________________________________________________________
Expressiveness 0.29 (0.24) 0.64 (0.41) 2.22 (p = 0.0205) 0.85s _________________________________________________________________________________________________________________ Study 2: EG (N=19) CG (N=19) EG vs. CG (Univ. students) M (s) M (s) t (p) ES _________________________________________________________________________________________________________________ Expressiveness 0.35 (0.35) 0.77 (0.49) 3.02 (p = 0.0024) 0.86s *One-tailed tests
37
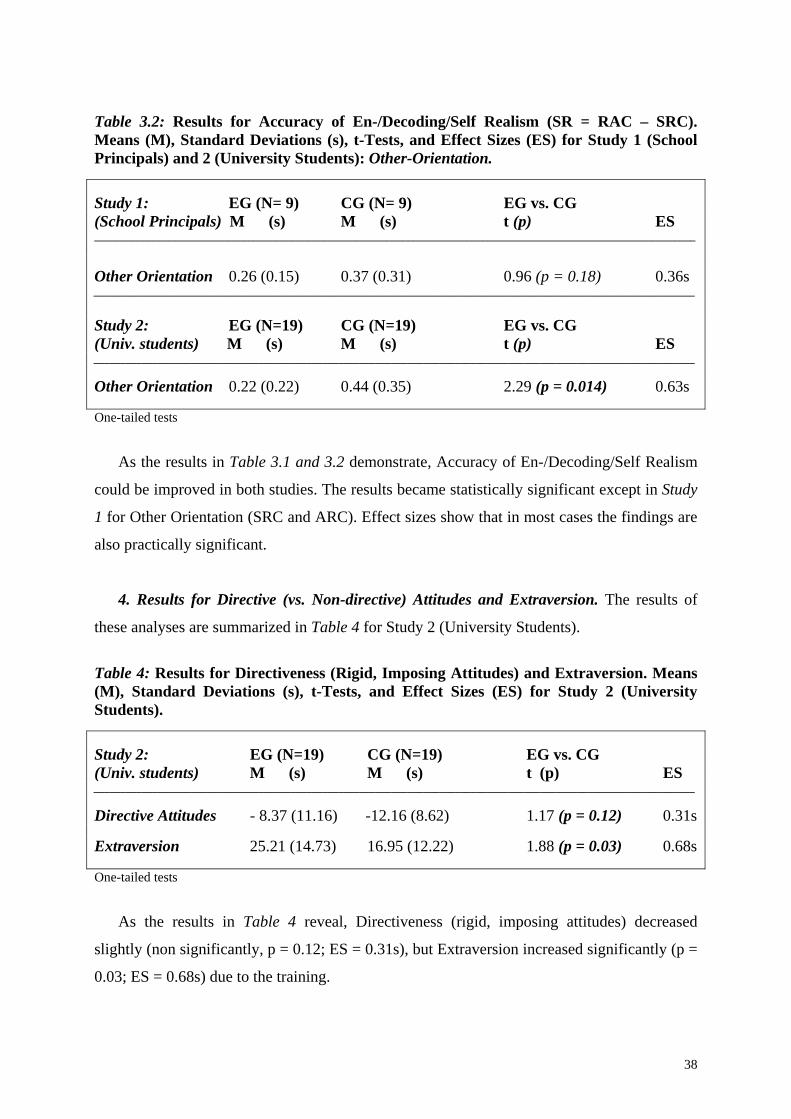
Table 3.2: Results for Accuracy of En-/Decoding/Self Realism (SR = RAC – SRC). Means (M), Standard Deviations (s), t-Tests, and Effect Sizes (ES) for Study 1 (School Principals) and 2 (University Students): Other-Orientation. Study 1: EG (N= 9) CG (N= 9) EG vs. CG (School Principals) M (s) M (s) t (p) ES _________________________________________________________________________________________________________________
Other Orientation 0.26 (0.15) 0.37 (0.31) 0.96 (p = 0.18) 0.36s _________________________________________________________________________________________________________________ Study 2: EG (N=19) CG (N=19) EG vs. CG (Univ. students) M (s) M (s) t (p) ES _________________________________________________________________________________________________________________ Other Orientation 0.22 (0.22) 0.44 (0.35) 2.29 (p = 0.014) 0.63s One-tailed tests
As the results in Table 3.1 and 3.2 demonstrate, Accuracy of En-/Decoding/Self Realism
could be improved in both studies. The results became statistically significant except in Study
1 for Other Orientation (SRC and ARC). Effect sizes show that in most cases the findings are
also practically significant.
4. Results for Directive (vs. Non-directive) Attitudes and Extraversion. The results of
these analyses are summarized in Table 4 for Study 2 (University Students).
Table 4: Results for Directiveness (Rigid, Imposing Attitudes) and Extraversion. Means (M), Standard Deviations (s), t-Tests, and Effect Sizes (ES) for Study 2 (University Students). Study 2: EG (N=19) CG (N=19) EG vs. CG (Univ. students) M (s) M (s) t (p) ES _________________________________________________________________________________________________________________ Directive Attitudes - 8.37 (11.16) -12.16 (8.62) 1.17 (p = 0.12) 0.31s Extraversion 25.21 (14.73) 16.95 (12.22) 1.88 (p = 0.03) 0.68s One-tailed tests
As the results in Table 4 reveal, Directiveness (rigid, imposing attitudes) decreased
slightly (non significantly, p = 0.12; ES = 0.31s), but Extraversion increased significantly (p =
0.03; ES = 0.68s) due to the training.
38
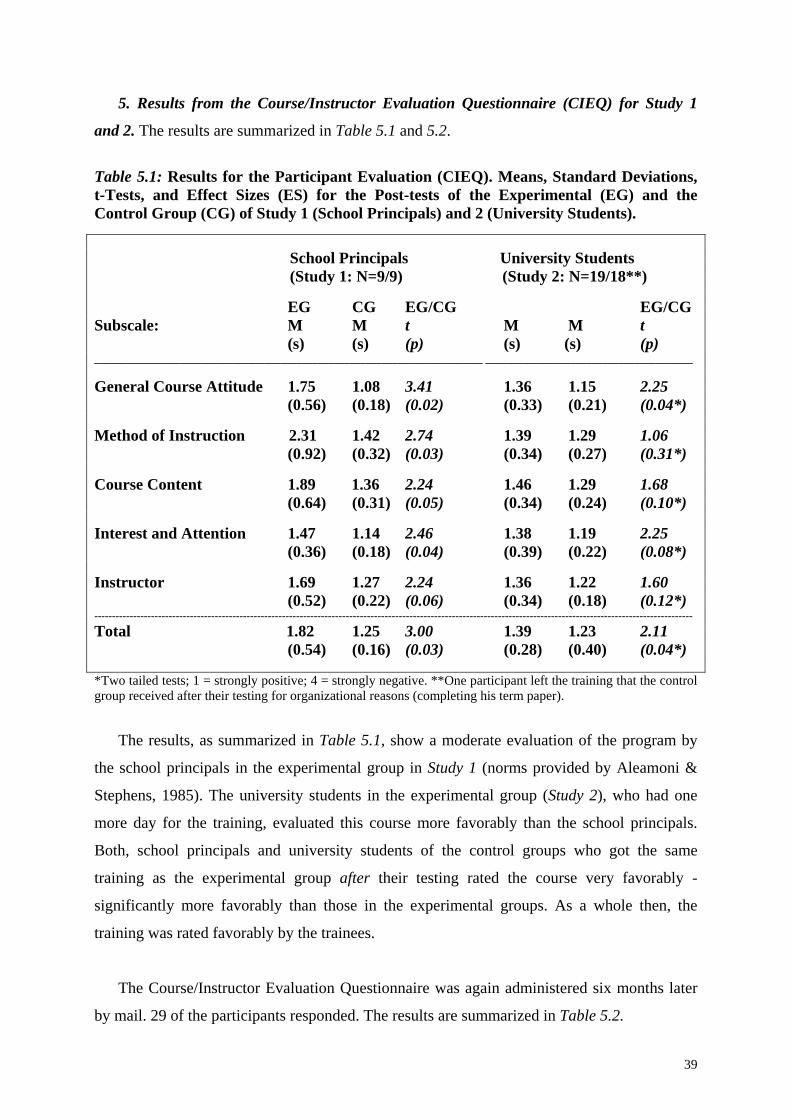
5. Results from the Course/Instructor Evaluation Questionnaire (CIEQ) for Study 1
and 2. The results are summarized in Table 5.1 and 5.2.
Table 5.1: Results for the Participant Evaluation (CIEQ). Means, Standard Deviations, t-Tests, and Effect Sizes (ES) for the Post-tests of the Experimental (EG) and the Control Group (CG) of Study 1 (School Principals) and 2 (University Students). School Principals University Students (Study 1: N=9/9) (Study 2: N=19/18**) EG CG EG/CG EG/CG Subscale: M M t M M t (s) (s) (p) (s) (s) (p) _________________________________________________________________________ _______________________________________ General Course Attitude 1.75 1.08 3.41 1.36 1.15 2.25 (0.56) (0.18) (0.02) (0.33) (0.21) (0.04*) Method of Instruction 2.31 1.42 2.74 1.39 1.29 1.06 (0.92) (0.32) (0.03) (0.34) (0.27) (0.31*) Course Content 1.89 1.36 2.24 1.46 1.29 1.68 (0.64) (0.31) (0.05) (0.34) (0.24) (0.10*) Interest and Attention 1.47 1.14 2.46 1.38 1.19 2.25 (0.36) (0.18) (0.04) (0.39) (0.22) (0.08*) Instructor 1.69 1.27 2.24 1.36 1.22 1.60 (0.52) (0.22) (0.06) (0.34) (0.18) (0.12*) ------------------------------------------------------------------------------------------------------------------------------------------------------------------------- Total 1.82 1.25 3.00 1.39 1.23 2.11 (0.54) (0.16) (0.03) (0.28) (0.40) (0.04*) *Two tailed tests; 1 = strongly positive; 4 = strongly negative. **One participant left the training that the control group received after their testing for organizational reasons (completing his term paper).
The results, as summarized in Table 5.1, show a moderate evaluation of the program by
the school principals in the experimental group in Study 1 (norms provided by Aleamoni &
Stephens, 1985). The university students in the experimental group (Study 2), who had one
more day for the training, evaluated this course more favorably than the school principals.
Both, school principals and university students of the control groups who got the same
training as the experimental group after their testing rated the course very favorably -
significantly more favorably than those in the experimental groups. As a whole then, the
training was rated favorably by the trainees.
The Course/Instructor Evaluation Questionnaire was again administered six months later
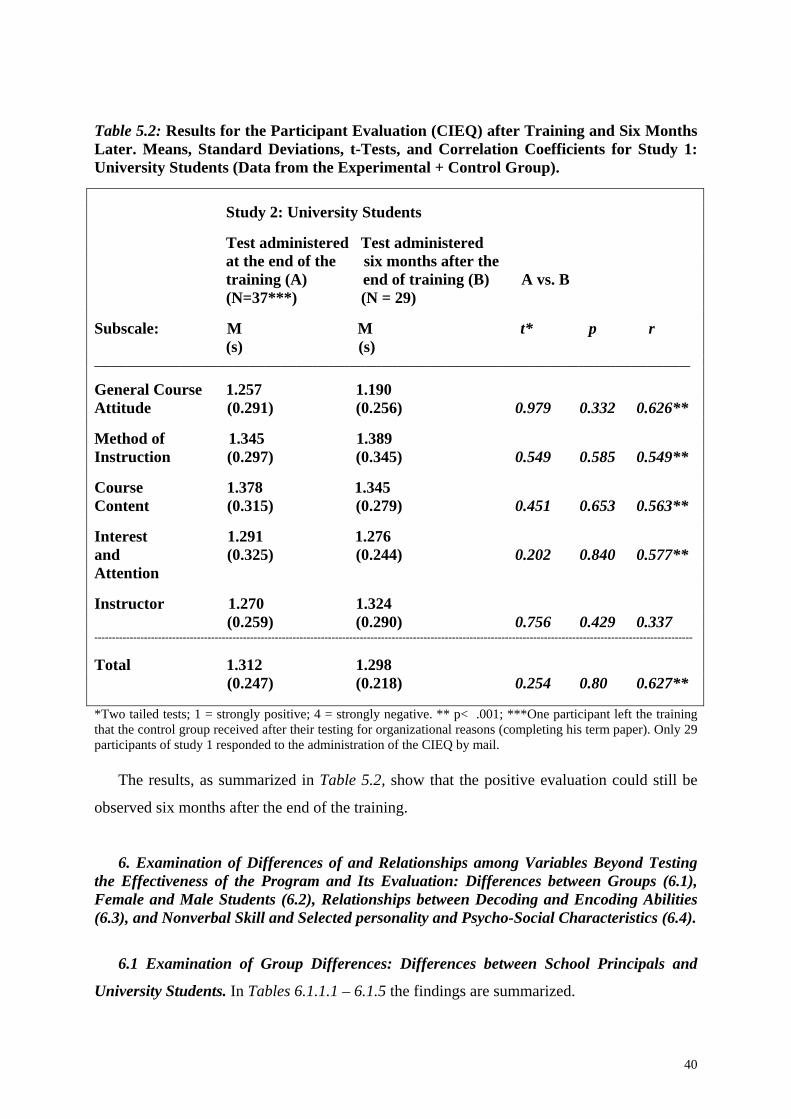
by mail. 29 of the participants responded. The results are summarized in Table 5.2.
39
Table 5.2: Results for the Participant Evaluation (CIEQ) after Training and Six Months Later. Means, Standard Deviations, t-Tests, and Correlation Coefficients for Study 1: University Students (Data from the Experimental + Control Group). Study 2: University Students Test administered Test administered at the end of the six months after the training (A) end of training (B) A vs. B (N=37***) (N = 29) Subscale: M M t* p r (s) (s) ________________________________________________________________________________________________________________ General Course 1.257 1.190 Attitude (0.291) (0.256) 0.979 0.332 0.626** Method of 1.345 1.389 Instruction (0.297) (0.345) 0.549 0.585 0.549** Course 1.378 1.345 Content (0.315) (0.279) 0.451 0.653 0.563** Interest 1.291 1.276 and (0.325) (0.244) 0.202 0.840 0.577** Attention Instructor 1.270 1.324 (0.259) (0.290) 0.756 0.429 0.337 ------------------------------------------------------------------------------------------------------------------------------------------------------------------------- Total 1.312 1.298 (0.247) (0.218) 0.254 0.80 0.627** *Two tailed tests; 1 = strongly positive; 4 = strongly negative. ** p< .001; ***One participant left the training that the control group received after their testing for organizational reasons (completing his term paper). Only 29 participants of study 1 responded to the administration of the CIEQ by mail. The results, as summarized in Table 5.2, show that the positive evaluation could still be
observed six months after the end of the training.
6. Examination of Differences of and Relationships among Variables Beyond Testing the Effectiveness of the Program and Its Evaluation: Differences between Groups (6.1), Female and Male Students (6.2), Relationships between Decoding and Encoding Abilities (6.3), and Nonverbal Skill and Selected personality and Psycho-Social Characteristics (6.4).
6.1 Examination of Group Differences: Differences between School Principals and
University Students. In Tables 6.1.1.1 – 6.1.5 the findings are summarized.
40
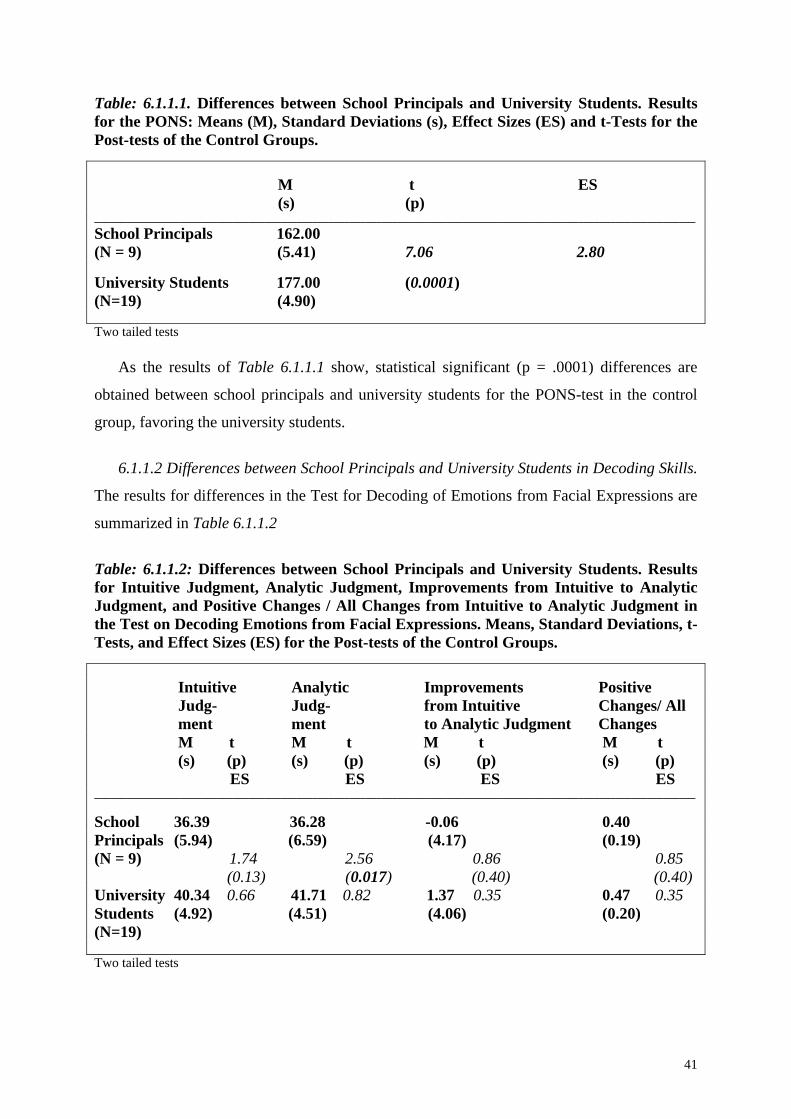
Table: 6.1.1.1. Differences between School Principals and University Students. Results for the PONS: Means (M), Standard Deviations (s), Effect Sizes (ES) and t-Tests for the Post-tests of the Control Groups. M t ES (s) (p) _________________________________________________________________________________________________________________ School Principals 162.00 (N = 9) (5.41) 7.06 2.80 University Students 177.00 (0.0001) (N=19) (4.90) Two tailed tests As the results of Table 6.1.1.1 show, statistical significant (p = .0001) differences are
obtained between school principals and university students for the PONS-test in the control
group, favoring the university students.
6.1.1.2 Differences between School Principals and University Students in Decoding Skills.
The results for differences in the Test for Decoding of Emotions from Facial Expressions are
summarized in Table 6.1.1.2
Table: 6.1.1.2: Differences between School Principals and University Students. Results for Intuitive Judgment, Analytic Judgment, Improvements from Intuitive to Analytic Judgment, and Positive Changes / All Changes from Intuitive to Analytic Judgment in the Test on Decoding Emotions from Facial Expressions. Means, Standard Deviations, t-Tests, and Effect Sizes (ES) for the Post-tests of the Control Groups. Intuitive Analytic Improvements Positive Judg- Judg- from Intuitive Changes/ All ment ment to Analytic Judgment Changes M t M t M t M t (s) (p) (s) (p) (s) (p) (s) (p) ES ES ES ES _________________________________________________________________________________________________________________ School 36.39 36.28 -0.06 0.40 Principals (5.94) (6.59) (4.17) (0.19) (N = 9) 1.74 2.56 0.86 0.85 (0.13) (0.017) (0.40) (0.40) University 40.34 0.66 41.71 0.82 1.37 0.35 0.47 0.35 Students (4.92) (4.51) (4.06) (0.20) (N=19) Two tailed tests
41
The results as summarized in Table 6.1.1.2 show statistical significant differences
between school principals and university students in analytical judgment in the control groups
(p = .02). Results for intuitive judgment became only nearly significant (p = .13). No
statistical differences could be found for the improvement from intuitive to analytic judgment
(p < .40).
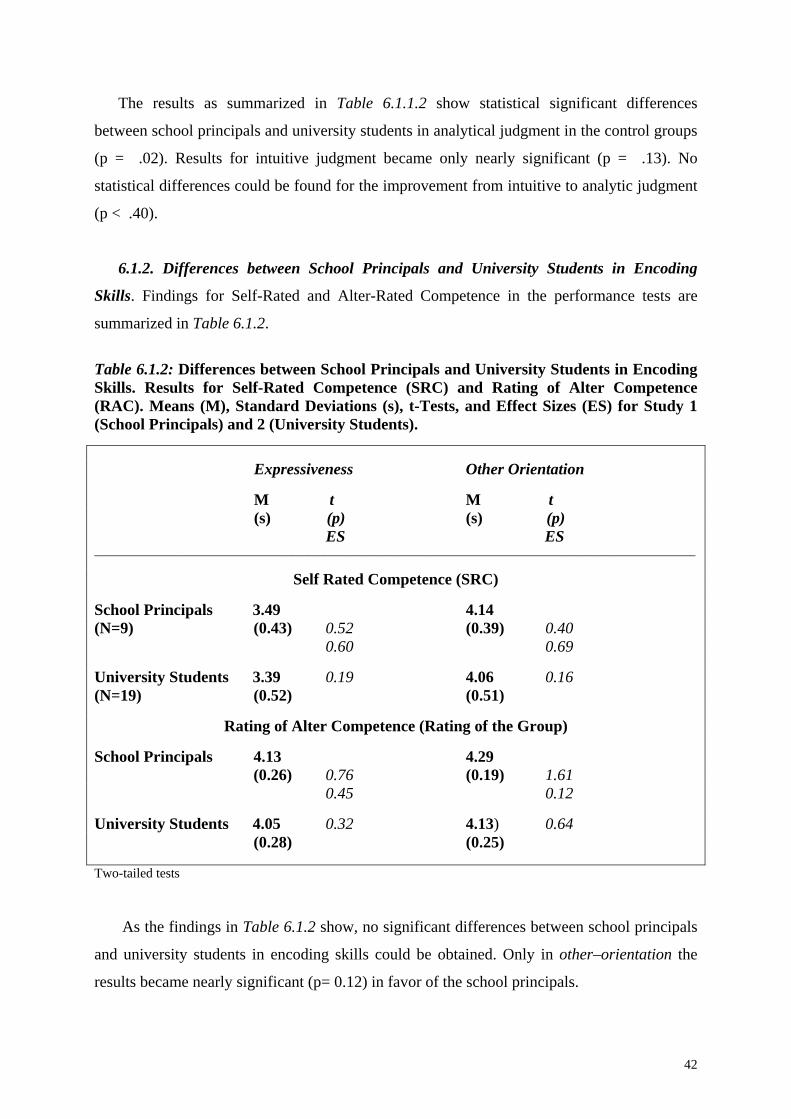
6.1.2. Differences between School Principals and University Students in Encoding
Skills. Findings for Self-Rated and Alter-Rated Competence in the performance tests are
summarized in Table 6.1.2.
Table 6.1.2: Differences between School Principals and University Students in Encoding Skills. Results for Self-Rated Competence (SRC) and Rating of Alter Competence (RAC). Means (M), Standard Deviations (s), t-Tests, and Effect Sizes (ES) for Study 1 (School Principals) and 2 (University Students). Expressiveness Other Orientation M t M t (s) (p) (s) (p) ES ES _________________________________________________________________________________________________________________
Self Rated Competence (SRC)
School Principals 3.49 4.14 (N=9) (0.43) 0.52 (0.39) 0.40 0.60 0.69 University Students 3.39 0.19 4.06 0.16 (N=19) (0.52) (0.51)
Rating of Alter Competence (Rating of the Group)
School Principals 4.13 4.29 (0.26) 0.76 (0.19) 1.61 0.45 0.12 University Students 4.05 0.32 4.13) 0.64 (0.28) (0.25) Two-tailed tests As the findings in Table 6.1.2 show, no significant differences between school principals
and university students in encoding skills could be obtained. Only in other–orientation the
results became nearly significant (p= 0.12) in favor of the school principals.
42
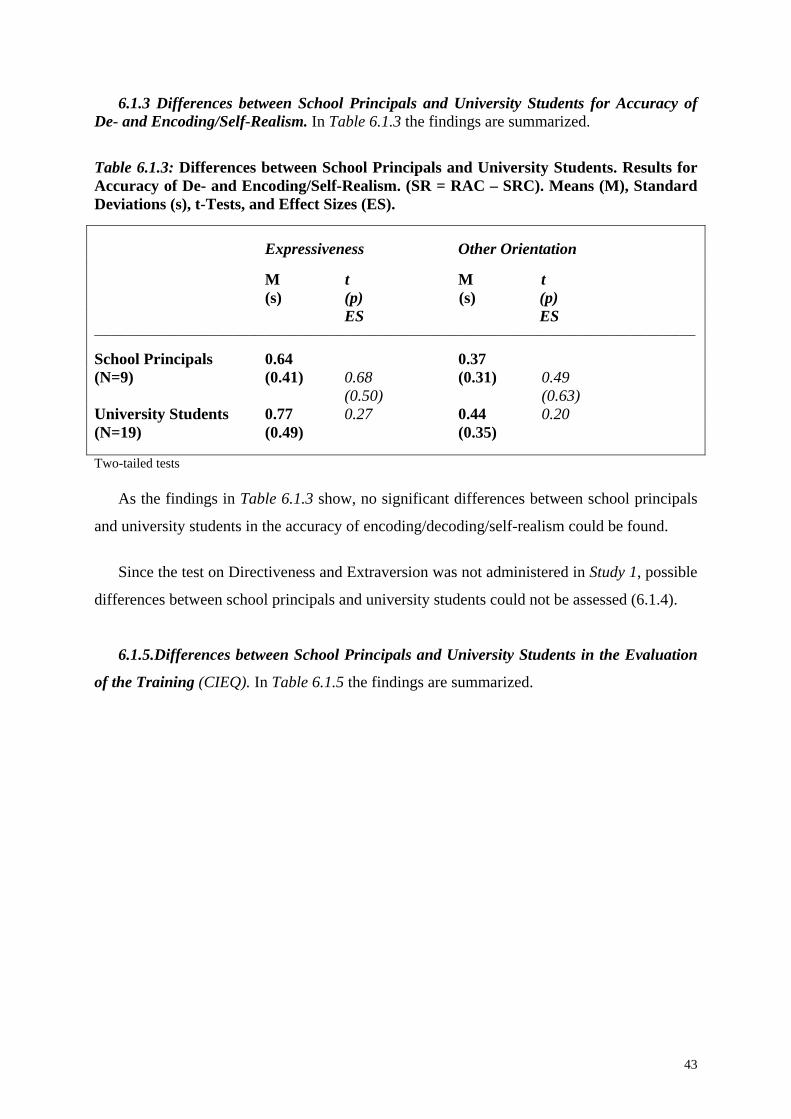
6.1.3 Differences between School Principals and University Students for Accuracy of De- and Encoding/Self-Realism. In Table 6.1.3 the findings are summarized.
Table 6.1.3: Differences between School Principals and University Students. Results for Accuracy of De- and Encoding/Self-Realism. (SR = RAC – SRC). Means (M), Standard Deviations (s), t-Tests, and Effect Sizes (ES). Expressiveness Other Orientation M t M t (s) (p) (s) (p) ES ES _________________________________________________________________________________________________________________
School Principals 0.64 0.37 (N=9) (0.41) 0.68 (0.31) 0.49 (0.50) (0.63) University Students 0.77 0.27 0.44 0.20 (N=19) (0.49) (0.35) Two-tailed tests As the findings in Table 6.1.3 show, no significant differences between school principals
and university students in the accuracy of encoding/decoding/self-realism could be found.
Since the test on Directiveness and Extraversion was not administered in Study 1, possible
differences between school principals and university students could not be assessed (6.1.4).
6.1.5.Differences between School Principals and University Students in the Evaluation
of the Training (CIEQ). In Table 6.1.5 the findings are summarized.
43
Table 6.1.5: Differences between School Principals and University Students. Results for the Evaluation of the Training Using the Course/Instructor Evaluation Questionnaire. Means (M), Standard Deviations (s), t-Tests, and Effect Sizes (ES). Experimental Control/-Compa- Group rison Group Subscale: M (s) M (s) t, p*, ES t, p, ES _________________________________________________________________________________________________________________ General Course School Principals (N=9): 1.75 (0.56) 1.08 (0.18) Attitude University Students (N=19/18): 1.36 (0.33) 1.15 (0.21) School Principals vs. University Students: t=1.97 t=0.90 p=0.08 p=0.38 ES=0.70 ES=0.33 Method of School Principals: 2.31 (0.92) 1.42 (0.33) Instruction University Students: 1.39 (0.34) 1.29 (0.25) School Principals vs. University Students: t=2.89 t=1.00 p=0.02 p=0.37 ES=1.0 ES=0.39 Course School Principals: 1.89 (0.64) 1.36 (0.31) Content University Students: 1.46 (0.34) 1.29 (0.28) School Principals vs. University Students: t=1.90 t=0.57 p=0.11 p=0.60 ES=0.67 ES=0.23 Interest and School Principals 1.47 (0.36) 1.14 (0.18) Attention University Students 1.38 (0.39) 1.19 (0.22) School Principals vs. University Students: t=0.60 t=0.70 p=0.57 p=0.50 ES=0.23 ES=0.22 Instructor School Principals 1.69 (0.52) 1.27 (0.22) University Students: 1.35 (0.33) 1.23 (0.16) School Principals vs. University Students: t=2.13 t=0.58 p=0.04 p=0.59 ES=0.53 ES=0.18 Total School Principals: 1.82 (0.54) 1.25 (0.16) University Students: 1.39 (0.28) 1.23 (0.17) School Principals vs. University Students: t=2.22 t=0.37 p=0.07 p=0.73 ES=0.80 ES=0.12 *Two tailed tests
44
As the findings in Table 6.1.5 show, the university students of the experimental group
favored the training more than the school principals. In their General Attitudes to the course,
Methods of Instruction, Instructor, and Total Rating the results for the experimental groups
became significant or nearly significant.
6.2. Differences between Female and Male Participants (Gender Effects). Gender
differences were assessed in Study 2 only because of the small N of men in Study 1. In Tables
6.2.1.1, 6.2.1.2, and 6.2.1.3 the results for decoding skills are summarized.
Table 6.2.1.1 Profile of Nonverbal Sensitivity (PONS-Test.): Differences between Female and Male Participants in Study 2: Means (M), Standard Deviations (s), t-Tests, and Effect Sizes (ES). Experimental Group Control Group (N = 9f/10m) (N = 11f/8m) M t M t * (s) (p) (s) (p) ES ES ___________________________________________________________________________ Female 179.34 177.73 (3.87) 0.75 (5.37) 0.78 (0.47) (0.47) Male 180.90 0.30 176.00 0.32 (5.17) (4.31) *Two tailed tests
The results as summarized in Table 6.2.1.1 revealed very small differences between male
and female students in nonverbal sensitivity (PONS) which achieved no statistical
significance (p = .47). As the results in Tables 6.2.1.1 and 6.2.1.2 show, no significant differences between
female and male participants in the experimental and control group could be obtained for four
variables of decoding emotions from facial expressions.
45
Table 6.2.1.2: Decoding Emotions from Facial Expressions. Differences between Female and Male Participants in Study 2: Means (M), Standard Deviations (s), t-Tests, and Effect Sizes (ES). Experimental Control EG CG EG CG Group (EG) Group (CG) N=9f/10m N=11f/8m Intuitive Analytic Intuitive Analytic Improvements Positive Changes Judg- Judg- Judg- Judg- from intuitive to all changes ment ment ment ment to analytic Judg- ment M M M M M M M M (s) (s) (s) (s) (s) (s) (s) (s) ___________________________________________________________________________ Women: 45.00 49.00 41.95 42.23 4.00 0.27 0.79 0.46 (5.11) (4.99) (4.03) (5.57) (3.40) (4.31) (0.19) (0.24) Men: 42.80 46.15 38.13 41.06 3.40 2.90 0.71 0.49 (2.89) (2.17) (5.42) (2.61) (1.81) (3.37) (0.14) (0.15) t=1.14 t=1.58 t=1.69 t=0.61 t=0.49 t=1.42 t=1.05 t=0.27 p=0.28 p=0.15 p=0.14 p=0.55 p=0.63 p=0.17 p=0.30 p=0.79 ES=0.43 ES=0.57 ES=0.70 ES=0.21 ES=0.18 ES=0.61 ES=0.42 ES=0.13 Two tailed tests
6.2.2 Differences between Female and Male University Students in Encoding Skills. In
Table 6.2.2 the results are summarized.
46
Table 6.2.2: Differences between Female and Male University Students in Encoding Skills. Results for Self-rated Competence (SRC) and Rating of Alter Competence (RAC). Means (M), Standard Deviations (s), t-Tests, and Effect Sizes (ES) for Study 2: Expressiveness and Other-Orientation. Experimental Group Control Group M (s) M (s) N=9f/10m N=11f/8m _________________________________________________________________________________________________________________
Self Rated Competence (SRC)
Female Expressiveness 3.94 (0.35) 3.45 (0.44) Other Orientation 4.12 (0.33) 4.22 (0.60) Male Expressiveness 4.04 (0.45) 3.30 (0.65) Other Orientation 4.09 (0.22) 3.85 (0.27)
Female vs. Male University Students Expressiveness: t=0.53 t=0.59 p=0.60 p=0.56 ES=0.22 ES=0.23 Other-Orientation: t=0.27 t=1.65 p=0.79 p=0.12 ES=0.09 ES=0.62 _________________________________________________________________________________________________________________
Rating of Alter Competence (Rating of the Group) Female
Expressiveness 4.19 (0.35) 4.04 (0.23) Other Orientation 4.30 (0.19) 4.12 (0.30) Male
Female vs. Male University Students Expressiveness: t=1.05 t=0.09 p=0.31 p=0.93 ES=0.43 ES=0.06 Other-Orientation: t=0.58 t=0.26 p=0.58 p=0.80 ES=0.21 ES=0.01 Two-tailed tests
47
As the results in Table 6.2.2 show, no significant differences could be obtained between
female and male university students in encoding skills: expressiveness and other-orientation.
6.2.3 Differences between Female and Male University Students. Results for Accuracy
of De- and Encoding/Self-Realism. (SR = RAC – SRC).
Table 6.2.3: Differences between Female and Male University Students. Results for Accuracy of De-/Encoding/Self-Realism. (SR = RAC – SRC). Means (M), Standard Deviations (s), t-Tests, and Effect Sizes (ES). Experimental Group Control Group N=9f/10m N=11f/8m M (s) M (s) Female Expressiveness 0.37 (0.34) 0.63 (0.31) Other Orientation 0.27 (0.24) 0.46 (0.46) _________________________________________________________________________________________________________________ Male Expressiveness 0.34 (0.37) 0.95 (0.64) Other Orientation 0.18 (0.20) 0.42 (0.16) Female vs. Male University Students Expressiveness: t=0.20 t=1.44 p=0.80 p=0.17 ES=0.08 ES=0.50 Other-Orientation: t=0.88 t=0.18 p=0.39 p=0.86 ES=0.38 ES=0.09 Two-tailed tests As the results in Table 6.2.3 show, no statistical significant differences could be obtained
between male and female participants in Accuracy of De- / Encoding/Self-Realism.
6.2.4. Differences between Female and Male University Students in Directive Attitudes
and Extraversion. In Table 6.2.4 the results are summarized.
48
As the results in Table 6.2.4 show, no statistical significant differences could be obtained
between male and female participants in Direct Attitudes and Extraversion.
Table 6.2.4: Differences between Female and Male University Students. Results for Directiveness (Rigid, Imposing Attitudes) and Extraversion. Means (M), Standard Deviations (s), t-Tests, and Effect Sizes (ES). Experimental Group Control Group N=9f/10m N=11f/8m M (s) M (s) Female Direct Attitudes -07.23 (10.24) -12.72 (9.69) Extraversion 24.44 (17.92) 19.55 (10.34) _________________________________________________________________________________________________________________ Male Directive Attitudes -08.40 (13.49) 11.38 (7.46) Extraversion 25.00 (3.85) 13.38 (14.36) Female vs. Male University Students Directive Attitudes: t=0.21 t=0.33 p=0.83 p=0.75 ES=0.09 ES=0.14 Extraversion: t=0.06 t=1.09 p=0.95 p=0.29 ES=0.03 ES=0.43 Two-tailed tests 6.2.5 Differences between Female and Male University Students for the Evaluation of
the Training using the Course/Instructor Evaluation Questionnaire (CIEQ). In Table 6.2.5 the
results are summarized.
49
Table 6.2.5: Differences between Female and Male Students. Results for the Evaluation of the Training. Means (M), Standard Deviations (s), t-Tests, and Effect Sizes (ES). Experimental Control/-Compa- Group rison Group Subscale N=9f/10m N=11f/7m M (s) M (s) _________________________________________________________________________________________________________________ General Course Female: 1.34 (0.31) 1.13 (0.17) Attitude Male 1.38 (0.36) 1.18 (0.28) Female vs. Male University Students: t*=0.27 t=0.45 p=0.79 p=0.66 ES=0.11 ES=0.18 Method of Female 1.39 (0.44) 1.30 (0.29) Instruction Male 1.40 (0.24) 1.29 (0.17) Female vs. Male University Students: t=0.07 t=0.08 p=0.95 p=0.94 ES=0.03 ES=0.03 Course Female 1.45 (0.37) 1.27 (0.28) Content Male 1.48 (0.32) 1.32 (0.28) Female vs. Male University Students: t=0.19 t=0.36 p=0.85 p=0.73 ES=0.08 ES=0.18 Interest and Female 1.36 (0.40) 1.20 (0.25) Attention Male 1.40 (0.39) 1.18 (0.19) Female vs. Male University Students: t=0.21 t=0.24 p=0.83 p=0.82 ES=0.01 ES=0.08 Instructor Female 1.38 (0.35) 1.27 (0.21) Male 1.32 (0.32) 1.14 (0.15) Female vs. Male University Students: t=0.38 t=1.44 p=0.71 p=0.17 ES=0.17 ES=0.62 -------------------------------------------------------------------------------------------------------------------------------------------------------------------------- Total Female: 1.39 (0.34) 1.24 (0.18) Male: 1.39 (0.24) 1.22 (0.17) Female vs. Male University Students: t=0.002 t=0.20 p=0.99 p=0.84 ES=0.00 ES=0.11 *Two tailed tests
As the results in Table 6.2.5 show, no significant differences between female and male
university students could be obtained in the total and all sub-scales of the CIEQ.
50
6.2.6 Differences between Female and Male University Students for the Self-Reported Interpersonal Success. In Table 6.2.6 the results are summarized. Table 6.2.6: Results for Interpersonal Success. Differences between Female and Male Students. Means (M), Standard Deviations (s), t-Tests, and Effect Sizes (ES) for Study 2. Factor EG (N=9f/10m) CG (N=11f/8m) M (s) M (s) _________________________________________________________________________________________________________________ Factor I: Male + Female 7.42 (1.04) 7.26 (1.46) Quality of Opposite Female: 7.75 (1.13) 7.93 (0.77) Sex Relationship Male 7.13 (0.92) 6.34 (1.72) Female vs. Male University Students: t*=1.33 t=2.73 p=0.20 p=0.014 ES= 0.60 ES=1.09 Factor II: Male + Female 7.70 (0.93) 7.53 (0.94) Quality of Same Female 7.95 0.60) 7.68 (1.16) Sex Relationship Male 7.46 (1.14) 7.31 (0.50) Female vs. Male University Students: t=1.11 t=0.84 p=0.28 p=0.41 ES=0.53 ES=0.39 Factor III: Male + Female 2.00 (0.33) 1.37 (4.06) Number of Female 2.06 (0.17) 2.05 (0.35) Friends Male 2.00 (0.00) 1.94 (0.32) Female vs. Male University Students: t=1.06 t=0.67 p=0.31 p=0.50 ES=0.18 ES=0.03 Factor IV: Male + Female 3.68 (2.62) 5.34 (1.62)* Speed of Female 6.39 (1.19) 5.59 (1.20) Making Friends Male 5.45 (1.61) 5.00 (2.12) Female vs. Male University Students: t=1.43 t=0.77 p=0.17 p=0.449 ES=0.36 ES=0.36 Factor V: Male + Female 6.79 (1.16) 6.59 (1.11) Understanding in Female 7.03 (1.31) 7.07 (0.93) Relationship Male 6.58 (1.04) 5.94 (1.04) Female vs. Male University Students: t=0.84 t=2.48 p=0.41 p=0.024 ES=0.39 ES=1.02 -------------------------------------------------------------------------------------------------------------------------------------------------------------------------- Total Male + Female 5.97 (0.62) 5.74 (0.76) Female: 6.23 (0.58) 6.06 (0.48) Male: 5.73 (0.58) 5.31 (0.89) Female vs. Male University Students: t=1.90 t=2.40 p=0.074 p=0.028 ES=0.81 ES=0.99 *Two tailed tests
51
Results, as summarized in Table 6.2.6 show some differences between male and female
students in Study 2. In the control group female students scored significantly higher in the
“Quality of Opposite Relationships” (p = .014), “Understanding in Relationships” (p = .024),
and in the Total of (self reported) “Success for Interpersonal Relationships” (p = .03); in the
experimental group female students scored nearly significant (p = .07) higher in the Total of
(self reported) “Success for Interpersonal Relationships”.
6.3 Relationships between Decoding and Encoding Skills. Relationships between
decoding ability, assessed with the PONS (control group, Study 2) and encoding skills,
assessed with the SRC and RAC are summarized in Tables 6.3.1 and 6.3.2
Table 6.3.1: Results for the Relationship between Decoding and Encoding Ability. Nonverbal Sensitivity (PONS) - Self- and Alter Rated Competence. Pearson Product Moment Correlations and p-Values for the Control Group of Study 2. Profile of Nonverbal Sensitivity (PONS) r ----------------------------------------------------------------------------------------------------------------- Self Rated Competence Expressiveness -0.013 n.s. Other Orientation 0.012 n.s. ----------------------------------------------------------------------------------------------------------------- Rating of Alter Competence Expressiveness -0.003 n.s. Other Orientation 0.024 n.s. Two tailed tests: n.s. not significant at the .05 level Table 6.3.2: Results for the Relationship between Decoding and Encoding Ability. Accuracy of De-/Encoding (Self-Realism). Pearson Product Moment Correlations and p-Values for the Control Group of Study 2. Variable: Accuracy of De-/Encoding (Self-Realism) – Profile of Nonverbal Sensitivity (PONS) r Expressiveness 0.05 (29) n.s. Other Orientation 0.12 (33) n.s. Two tailed tests: n.s. not significant at the .05 level.
52
The results, as summarized in Tables 6.3.1 and 6.3.2, show small and non-significant
correlations between decoding (PONS) and encoding ability in the control group of study 2
(university students).
6.4 Relationship of Psychosocial Correlates of Decoding and Encoding Abilities. 6.4.1 Relationships between Decoding Abilities (PONS), attitudes, extraversion, and (self reported) interpersonal success. Psychosocial correlates with the PONS scores were assessed for Direct Attitudes, Extraversion, and self reported Interpersonal Success in the control group of Study 2 (university students). In Table 6.4.1 the results are summarized. Table 6.4.1: Relationships of PONS and Direct Attitudes (Directiveness), Extraversion, and (Self-Rated) Interpersonal Success. Pearson Product Moment Correlations and p-Values for the Control Group of Study 2. Variable Profile of Nonverbal Sensitivity (PONS) r ----------------------------------------------------------------------------------------------------------------- Directiveness 0.13 n.s. Extraversion -0.26 n.s. ----------------------------------------------------------------------------------------------------------------- Interpersonal Success Factor 1: “Quality of Opposite-Sex Relationships” 0.20 n.s. Factor 2: “Quality of same-Sex Relationships” -0.21 n.s. Factor 3: “Number of Friends” 0.48* p < 0.05 Factor 4: “Speed in making friends” 0.06 n.s. Factor 5: “Understanding in Relationships” 0.10 n.s. Total 0.12 n.s Two tailed test: n.s. not significant at the 0.05 level The results, as summarized in Table 6.4.1, show small and statistically non-significant
relationships between Nonverbal Sensitivity (PONS) and Directiveness (rigid, imposing
attitudes) and personality characteristics (Extraversion). Self reported Interpersonal Success
53
correlated generally positive but low (M r = 0.13) with total scores of PONS and became
statistically significant (r = 0.48; p < .05) in Factor 3: “Number of Friends”.
6.4.2 Relationships between Encoding Abilities (assessed with the RAC and SRC),
Directiveness (Rigid, Imposing Attitudes), Extraversion, and (self reported) Interpersonal
Success. Relationships between these variables are summarized in Table 6.4.2.
Table 6.4.2: Relationships between Encoding Abilities (assessed with the RAC and SRC) and Directiveness (Rigid, Imposing Attitudes), Extraversion, and (Self-Rated) Interpersonal Success. Pearson Product Moment Correlations and p-Values for the Control Group of Study 2.
Variable SRC SRC RAC RAC Accuracy of Expres-- Other Expres- Other De-/Encoding siveness Orientation siveness Orientation Expres- Other siveness Orien- tation r r r r r r ----------------------------------------------------------------------------------------------------------------- Directiveness 0.011 - 0.50* - 0.33 - 0.19 0.067 - 0.50*
(self-realism), rigid, imposing attitudes (directiveness) and personality characteristics
(extraversion). The present research program also presented an opportunity to examine
differences between groups (school principals and university students), gender effects, and
relationships between decoding and encoding skills, as well as between nonverbal skill and
psychosocial variables. 28 hypotheses (stated as null-hypotheses) were examined using true
experimental designs and data sources with sufficient validity and reliability.
The results of the two studies are promising. The findings support that the five main
objectives of the training program could be achieved.
55
The combination of training techniques provided in the program, brought about
considerable training effects for decoding skills (the first objective of the program), assessed
with the Profile of Nonverbal Sensitivity (PONS, ES = 1.32s; 0.64s) and a test on Decoding
Emotions from Facial Expressions (TDEFE: ES = 1.24s; 1.47s; 0.71s; 1.28s), which became
statistically significant (PONS: p< .034; .026; TDEFE: .005; .002; .01; .0001) in all cases.
The PONS-test results could be achieved despite the fact that the training procedures were not
aimed at the precise dimensions of that criterion test.
Interestingly, both studies show improvements from intuitive to analytic judgment under both experimental conditions. These improvements were significantly enhanced (p = . 07; .002; ES = 0.55s; 0.57s) indicating that the training program not only improved the more global, intuitive, and unreliable approach, but also successfully supported the analytic approach to decoding. The significant enhancement of these differences and that of correct changes from intuitive to analytic decoding in the treatment condition (p = .005; .00005; ES = 1.58s; 1.40s) may reflect the successful application of these techniques to analyze facial expressions when sufficient time is allocated to do this.
Null-Hypotheses 1.1, 1.2, 1.3 and 1.4 can be rejected. These results are in line with
German (Klinzing, 1988a; 1988b; 1998b; 2003a; 2003b) and international research (Klinzing,
2003c; Klinzing & Tisher, 1986).
The second training objective, the improvement of encoding skills in terms of
Expressiveness and Other-Orientation, was achieved significantly for self-rated as well as for
alter-rated “Expressiveness” in both studies (Study 1: p= .002; .02; ES = 1.42s; 0.92s. Study
2: p = .0002; .02; ES = 1.15s; 0.71s). Null-Hypothesis 2.1 can also be rejected: These
findings confirm earlier results obtained by Klinzing and associates (e.g., Klinzing, 1988a;
1988b; Klinzing et al., 1983; Klinzing et al., 1984) and are also in line with international
research (Klinzing & Tisher, 1986; Klinzing 1999; 2002). The results for “Other-
Orientation” achieved statistical significance only in alter-rated “Other-Orientation” in
Study 2 (p = .02; ES = 0.60s). The other findings are in the desired direction, but did not
become statistically significant (p = .26; .16; .38; ES = 0.26s; 0.42s; 0.08s). Null-Hypothesis
2.2 can only partly be rejected. This finding is disappointing. More opportunities to practice
the behaviors contributing to other-orientation should be provided in the program.
Accuracy of De-/Encoding (reflecting also an aspect of general social competence: Self-
Realism) could significantly be improved in both studies (third objective of the program). The
results achieved statistical significance in all cases (p = .02; .002; .01; ES = 0.85s, 0.86s,
56
0.63s), except in Study 1 for “other orientation” (p = .18; ES = 0.36s). Thus, Null-
Hypotheses 3.1 and 3.2 could also be rejected, at least for the most part. These findings
confirm those by Fuller & Manning (1973) and results of training programs in which also self
confrontation by video recordings have been used (e.g., Klinzing & Rupp, 1999; Klinzing et
al., 2002a; 2002b).
It was expected that with the improvement of nonverbal skills also attitudes and
personality characteristics would be improved (fourth objective). Extraversion was
significantly improved (p < .03; ES = 0.68s), but also - at least slightly (not significantly) –
directiveness (rigid, or imposing attitudes) was decreased (p< .12; ES = 0.31s). Null-
Hypothesis 4.1 can be rejected, but Null-Hypothesis 4.2 can not be rejected.
Evaluation of the Program. Participants of the experimental group of Study 1 (school
principals) evaluated the training program – as compared to the norms provided by Aleamoni
& Stephens (1986) and student ratings of training programs of similar structure (Klinzing,
1998a; Klinzing & Rupp, 1999) – only moderately high (overall rating: M = 1.82 on a four
point scale). The control groups received the same training after their testing and rated the
training significantly more favorably (Total: M = 1.25; p = .03). The same pattern emerged in
Study 2 with university students. Again, the control group rated the training significantly
better than the experimental group (Total: M = 1.23 vs. M= 1.39; p = .04). Because the
control participants did not experience the stress of test procedures at the end of the training,
they probably evaluated the training program significantly more positively than the
experimental groups. On the whole, the training was rated favorably by the trainees (Total: M
= 1.31). Null-Hypothesis 5.1 could be rejected. The positive evaluation by the university
students could still be observed six months after the end of the training (M = 1.297). Null-
Hypothesis 5.2 could also be rejected.
For the experimental hypotheses which went beyond testing the effectiveness and
evaluation of the training program (Hypotheses in groups 6.1, 6.2, 6.3 and 6.4), some
interesting results could be obtained.
Differences between Groups. Significant differences emerged between school principals
and university students in decoding abilities, in favor of the latter (PONS-results: p = 0.0001);
TDEFE-results, analytic judgment: p = 0.02; intuitive judgment: p = 0.13). Null-Hypotheses
6.1.1.1 and 6.1.1.2 can be rejected. The differences between these groups confirm age- and
57
status-related changes in attention, memory, and perception (Rosenthal et al., 1979; Knapp &
Hall, 2002). Whether personnel in occupations involving intensive social interaction really
“lose” some of their nonverbal sensitivity when they advance professionally (they may have,
for example, fewer direct contacts to other people or clients) has to be investigated in
longitudinal studies. In encoding abilities, however, no or only nearly significant differences
were found between these groups (expressiveness, other orientation: p = 0.12 – 0.69, accuracy
of de-/encoding: p = 0.50 – 0.63). Null-Hypotheses 6.1.2 and 6.1.3 can not be rejected.
Significant or nearly significant differences were found in the evaluation of the training:
university students of the experimental group had nearly significant higher general course
attitudes (p = 0.08) and rated the method of instruction (p = 0.02), the course content (p =
0.11) and the instructor (p = 0.04) more positively (total evaluation: p = 0.07) than the school
principals in the experimental group. Null-Hypothesis 6.1.5 be rejected, at least in part.
Differences between Female and Male Students. In contradiction to research, especially
done in the USA (Hall, 1998), no significant differences between male and female university
students were found in decoding abilities (PONS: p = 0.47; Test for Decoding Emotions from
Facial Expressions: p = .14 – .79). Also for encoding abilities no significant differences
could be found (SRC, expressiveness: p = 0.56, other orientation: p = .12, RAC,
expressiveness: p = .93, other orientation: p = .80; Accuracy in De-/Encoding/Self-Realism:
p = .50; .63). A similar pattern emerged for other variables: no significant differences were
found in Rigid, Imposing Attitudes (p = .75), Extraversion (p = .29), and the evaluation of
the training (p = .11 - .95) among German students of education. Null-Hypotheses 6.2.1.1,
6.2.1.2, 6.2.2, 6.2.3, 6.2.4 and 6.2.5 could not be rejected. These findings confirm those
obtained in other German studies (Klinzing, 1998b; 2003a; 2003b; Klinzing et al., 1984;
Schiefer et al., 1984) and may be explained by cultural differences between the USA and
Germany. Only for the Self-Rating of Interpersonal Success some gender differences could be
observed in the control group: female students rated themselves more favorably than male
students for “Total Interpersonal Success” (p = .03), “Quality of Opposite Sex Relationships”
(p = .01), and “Understanding in Relationships” (p = .02). Null-Hypothesis 6.2.6 can be
rejected, at least in part.
Relationships between Decoding and Encoding Abilities. Are decoding and encoding
separate skills or do they belong to a general communication ability? In real face-to-face-
communication decoding and encoding are not separate, interactants decode and encode
58
simultaneously. Does it follow that proficiency in one skill makes one proficient in the other?
(Knapp & Hall, 2002). In the present study relationships between decoding and encoding
skills (PONS and ratings of competence), turned out to be small and non–significant. Null-
Hypotheses 6.3.1 and 6.3.2 can not be rejected. This finding points in the same direction as
the conclusion drawn by Knapp & Hall (2002) in their review of studies on this topic (see
above).
Relationships between Psychosocial Variables and Decoding and Encoding Abilities.
Results for relationships between decoding abilities (Nonverbal Sensitivity, PONS) and
psychosocial variables (Directiveness, rigid, imposing attitudes; Extraversion) turned out to
be small and statistically non-significant (r’s = 0.13; -0.26). Self reported Interpersonal
Success, however, correlated generally positive but low (M r = 0.13) with total PONS scores
and became statistically significant (r = 0.48; p < .05) in Factor 3: “Number of Friends”. Null-
Hypothesis 6.4.1 can not be rejected. These findings point at least in the same direction as
those obtained by Rosenthal et al. (1979).
For encoding abilities (SRC, RAC; SRC – RAC) the following relationships were
obtained: As was expected, accuracy of de-/encoding for expressiveness was positively
related to extraversion (r = 0.61; p < .01). Furthermore, as also was expected, self-rated
Other Orientation (r = -0.50; p < .05) was significantly negatively related (r = -0.50; p < .01)
to Directiveness (rigid, imposing attitudes), but positively related to “Quality of Same Sex
Relationship” (p < .68) and “Understanding in Relationships” (r = 0.58; p < .01). Accuracy
of De-/Encoding (Other-Orientation) was as well significantly negatively related to
Directiveness (r = 0.50; p< .05) and significantly positively related to “Quality of Same-Sex
Relationships” (r = 0.70; p < .01). Null-Hypothesis 6.4.2 can be – at least partly – rejected.
These findings are plausible and may be added to the body of related research. Replication of
these findings with the same and other measures of encoding ability are needed and in
preparation.
In conclusion, the results of these studies suggest that training of the kind described above
will not only be well adopted by the participants but will also increase the probability that
nonverbal communication skills, i.e., accuracy in decoding and encoding (expressiveness,
other orientation, nonverbal accuracy of de-/encoding), and furthermore, psychosocial
characteristics (extraversion), can be acquired with high proficiency. These improvements can
be achieved within an administrator and teacher inservice program as well as within a module
59
in a preservice methods course (Klinzing, 2002; Klinzing & Klinzing-Eurich, 1988).
The pressure for more communicative competence in many professions, as well as in the
teaching profession, makes it especially important to continue to build our knowledge on how
education can enhance communicative ability, specifically nonverbal skill. Laboratory
experiences should therefore occupy an important place in educational programs.
This paper has suggested that laboratory experiences can have a wide application.
Additional research and development should be carried out to see how our understanding of
this component of education, especially of teacher education, can be extended to encompass a
wide range of goals for preparation in many professions.
Such productive learning environments may help teacher training institutions to become
not only learning organizations but, at the same time, research organizations to respond more
effectively to the demands of developments in our societies.
___________________________________________________________________________ (1) Special thanks are owed to the participating principals and university students for their cooperation.
60
References
Abercromby, K. (1968). Paralanguage. British Journal of Communication, 3, 55 – 59. Abrami, P.C., Leventhal, L., & Perry, R.P. (1982). Educational seduction. Review of Educational Research, 52, 446 – 464. Ahlbrand W.P. (1976): Ausdrucksverhalten des Lehrers und Einstellung der Schüler zum Unterricht (Teacher nonverbal expressions and students’ attitudes to instruction). In W. Zifreund, ed., Training des Lehrverhaltens und Interaktionsanalyse. Weinheim, FRG: Beltz. 111-131. Aibauer, R. (1954). Die Lehrpersönlichkeit in der Vorstellung der Schüler (The teacher personality as perceived by students). Regensburg, FRG. Aleamoni, L.M. & Stephens, J.J. (1986). Arizona course/instructor evaluation questionnaire (CIEQ). Results interpretation manual form 76. Second edition. Tucson, AZ: University of Arizona, Office of Instructional Research and Development. Argyle, M. (2002). Körpersprache & Kommunikation. 8. Aufl. (Bodily communication. 8th ed.). Paderborn, FRG: Junfermann. Armento, B. J. (1977). Teacher behaviors related to student achievement on a social science concept test. Journal of Teacher Education, 28, 2, 46-52. Aspy, D.N. (1972). Toward a technology for humanizing education. Champaign, IL: Research Press. Bandura, A. (1977). Social learning theory. Englewood Cliffs; NJ.: Prentice-Hall. Bandura, A. (1986). Social foundations of thought and action. A social cognitive theory. Englewood Cliffs: NJ: Prentice Hall. Barr, A.S. (1948). The measurement and prediction of teaching efficiency: A summary of investigations. Journal of Experimental Education, 16, 201-283. Bastine, R. (1971). Fragebogen zur direktiven Einstellung F-D-E. Handanweisung. (Questionnaire of rigid, imposing attitudes. Test manual). Göttingen: Hogrefe. Bastine, R. & Brengelmann, J.C. (1971). Fragebogen F-D-E (Questionnaire of rigid, imposing attitudes). Göttingen: Hogrefe. Baumgärtner A. M. (1969). Wie sich Schüler heute ihre Lehrer wünschen (How students wish that teachers should be today). München. Berenbaum, H. & Rotter, A. (1992). The relationship between spontaneous facial expressions of emotions and voluntary control of facial muscles. Journal of Nonverbal Behavior, 13, 179 – 190. Berliner, D. C. (1985). Laboratory settings and the study of teacher education. Journal of Teacher Education, 36(6), 2 – 8. Bettencourt, E. M. (1979). Effects of training teachers in enthusiasm on student achievement and attitudes. Unpublished doctoral dissertation, University of Oregon (University Microfilm International, Ann Arbor, MI, No. 792 7226) Bishop, A.J. (1970). Simulating pedagogical decision making. Visual Education, Nov., 41- 43.
61
Borg, W. R. (1975). Protocol materials as related to teacher performance and pupil achievement. The Journal of Educational Research, 69, 23-29. Breed, G. (1971). Nonverbal behavior and teaching effectiveness. Final report. Vermillion: South Dekota University. (ERIC ED 182). Brengelmann, J.C. & Brengelmann, C. (1960). Deutsche Validierung von Fragebogen der Extraversion, neurotischen Tendenz und Rigidität (The German validation of questionnaires of extraversion, neuroticism, and rigidity). Zeitschrift für Experimentelle und Angewandte Psychologie, 7, 291 – 331. Brophy, J. E. & Evertson, C. M. (1974). Process-product correlations in the Texas Teacher Effectiveness Study: Final Report. The University of Texas at Austin. Buck, R., Miller, R.E., & Caul, E.F. (1974). Sex, personality and physiological variables in the communication of affect via facial expression. Journal of Personality and Social Psychology, 30, 587 – 596. Burgoon,, J.K. (1980). Nonverbal communication in the 1970s: An overview. In D. Nimmo, ed., Communication Yearbook 4 (pp. 179-197). New Brunswick, NJ: Transaction Books. Burgoon, J.K. (1985). Nonverbal signals. In M.L. Knapp & G.R. Miller, eds., Handbook of interpersonal communication. Beverly Hills: Sage Publications. Campbell, D.T. & Stanley, J.C. (1963). Experimental and quasi- experimental design for research on teaching. In N.L. Gage, ed., Handbook of research on teaching. Chicago, IL: Rand McNally, 171 - 246. Chambers, J. A. (1973). College teachers: Their effects on creativity of students. Journal of Educational Psychology, 57, 189-191. Coats, W. D. & Schmidchens, U. (1966). Audience recall as a function of speaker dynamism. Journal of Educational Psychologie, 57, 189-191. Cohen, S.J.(1973). Educational psychology: Practice what we teach. Educational Psychologist, 10 (2), 80-86. Coladarci, A.P. (1959). The teacher as hypothesis - maker. California Journal for Instructional Improvement, 2, 3-6. Collins, M.L. (1978). The effects of training for enthusiasm for the enthusiasm displayed by preservice elementary teachers. Paper presented at the Annual Meeting of the American Educational Research Association. Toronto. Copeland, W.D. (1982). Laboratory experiences in teacher education. In H. E. Mitzel, ed., Encyclopedia of educational research. 5th edition. New York, NY: Free Press. Conners, C. K. & Eisenberg, L. (1966). The effect of teacher behavior on verbal intelligence in operation headstart children. Baltimore: John Hopkins University School of Medicine. (ERIC ED 010 782). Cruickshank, D. R. & Metcalf, K. K. (1990). Training within teacher preparation. In W. R. Houston, ed., Handbook of research on teacher education. New York, NY: Macmillan, 469 – 497.
62
Cupach, W.R. & Spitzberg, B.H. (1981). Relational Competence: Measurement and validation. Paper presented at the Western Speech Communication Association Conference, San Jose, CA. Denight, J. A. & Gall, M. D. (1989). Effects of enthusiasm training on teachers and students at the high school level. Paper presented at the annual meeting off the American Educational Research Association. San Francisco. DePaulo, B.M. (1992). Nonverbal behavior and self-presentation. Psychological Bulletin, 111, 203 – 143. Dewey, J. (1904). The relation of theory to practice in education. In National Society for the Study of Education. The relation of theory to practice in the education of teachers. Third Yearbook. Part I. Bloomington: Public School Publishing Corp. DiMatteo, M.R. (1979). Nonverbal skill and the physician-patient relationship. In R. Rosenthal, ed., Skill in nonverbal communication: Individual differences (pp. 104 – 134). Cambridge, MA: Oelgeschlager, Gunn & Hain. DiMatteo, M.R., Hays, R.D., & Prince, L.M. (1986). Relationship of physicians’ nonverbal communication skill to patient satisfaction, appointment noncompliance, and physician workload. Health Psychology, 5, 581 – 594. DiMatteo, M.R., Taranta, A., Friedman, H. S., & Prince, L.M. (1980). Predicting patient satisfaction from physicians’ nonverbal communication skills. Medical Care, 18, 376 – 387. Driscoll, J. B. (1978). The effects of a teacher’ s eye contact, gestures, and voice intonation on student retention of factual material. Unpublished doctoral dissertation. University of Southern Mississippi. (University MICROFILMS International, Ann Arbor, MI, No. 7905119). Dunkin, M. J. (1995). Synthesizing research on teaching. In L. W. Anderson, ed., International encyclopedia of teaching and teacher education. 2nd edition (pp. 512 – 516). New York, NY: Pergamon/Elsevier Science Ltd.. Ehrensberger, R. (1945). An experimental study of the relative effectiveness of certain forms of emphasis in public speaking. Speech Monographs, 12, 94-111. Ekman, P. & Friesen, W.V. (1975). Unmasking the face. Englewood Cliffs, NJ: Prentice-Hall. Evertson, C.M., Brophy, J.E., & Crawford, W.J.(1975). Texas teacher effectiveness project: An investigation of selected presage-process relationships. (Report No. 75-16). Austin, TX: The University of Texas at Austin. The Research and Development Center for Teacher Education. Evertson, C. M., Anderson, L. M., & Brophy, J. E. (1978). Texas Junior High School Study: Final report of process-outcome relationships. Austin, TX: The University of Texas at Austin Research and Development Center for Teacher Education.. Fippinger, F. (1969). Untersuchungsergebnisse zum Lehrer-Image bei Hauptschülern (Research findings of the image of teachers in the 9-year elementary school). In Irle M. ed., Bericht über den 26. Kongress der Deutschen Gesselschaft für Psychologie Tübingen 1968. Göttingen: Hogrefe, 552-560.
63
Fittkau, B. (1969). Dimension des Lehrerverhaltens und ihre Bedeutung für die Auslösung von Angst und Sympathie bei Schülern (Dimensions of teacher behavior and their importance for the production of anxiety and sympathy in students). Zeitschrift für Entwicklungpsychologie und Pädagogische Psychologie, 1, 77-92. Fortune, J. C. (1967). The generality of presenting behaviors in teaching pre-school children. Memphis, Tenn.: Memphis State University (ERIC ED 016285). Friedman, H.S., Prince, L.M., Riggio, R.E., & DiMatteo, M.R. (1980). Understanding and assessing nonverbal expressiveness: The affective communication test. Journal of Personality and Social Psychology, 39, 333 –351. Friedman, H.S. & Riggio, R.E (1981). Effect of individual differences in nonverbal expressiveness on transmission of emotion. Journal of Nonverbal Behavior, 6, 96 – 104. Friedman, H.S., Riggio, R.E., & Segall, D.O. (1980). Personality and the enactment of emotion. Journal of Nonverbal Behavior, 5, 35 – 48. Friedman, H.S., Riggio, R.E., & Cassella, D.F. (1988). Nonverbal skills, personal charisma, and initial attraction. Personality and Social Psychology Bulletin, 14, 203 – 211. Fuller, F.F. & Manning, B.A. (1973). Self – confrontation reviewed: A conceptualisation for video playback in teacher education. Review of Educational Research, 4, 469 – 528. Gage, N. L. (1963). Paradigms for research on teaching. In N. L. Gage, ed., Handbook of research on teaching. Chicago: Rand McNally, 94-141. Gage, N.L. (1972). Teacher effectiveness and teacher education: The search for a scientific basis. Paolo Alto, CA: Pacific Books. Gauger, P. W. (1951). The effect of gesture and the presence or absence of the speaker in the listening comprehension of eleventh and twelfth grade high school pupils. Unpublished doctoral dissertation. University of Wisconsin (reported by Rosenshine, 1970). Gillett, M. & Gall, M. (1981). The effect of teacher enthusiasm on the at-task behavior of students in elementary grades. Paper presented at the annual meeting of the American Educational Research Association, Los Angeles. Glass, G.V., Coulter, D., Hartley, S. Hearold, S. Kalk, J., & Sherrez, L. (1977). Teacher “indirectness” and pupil achievement: An integration of findings. Boulder, University of Colorado: Laboratory of Educational Research,. Good, T. L. & Grouws D. A. (1975). Process-product relationship in fourth grade mathematics classrooms. Final report. National Institute of Education, Washington D.C. (ERIC ED 125 907). Hall, J.A. (1998). How big are nonverbal sex differences? The case of smiling and sensitivity to non-verbal cues. In D.J. Canary & K. Dindia, eds., Sex differences and similarities in communication: Critical essays and empirical investigations of sex and gender in interaction.(pp. 155 – 177). Mahwah, NJ: Erlbaum. Hodge, R. L. (1972). An empirical study on the acquisition of nonverbal teaching behaviors by secondary teacher candidates in a teaching laboratory. Unpublished doctoral dissertation. Austin: The University of Texas at Austin (University Microfilms No. 73-7571).
64
Jecker, J., Maccoby, N., & Breitrose, H.S., & Rose, D. (1964). Teacher accuracy in assessing cognitive visual feedback from students. Journal of Applied Psychology, 48, 6, 393 – 397. Jersild A. (1923). Modes of emphasis in public speaking. Journal of Applied Psychology, 12, 611 – 620. Kaufmann, P. (1976). The effects of nonverbal behavior on performance and attitudes in a college classroom. Dissertation Abstracts International, 37 (1-A), 235. Keilhacker, M. (1967). Der ideale Lehrer nach der Auffassung der Schüler (The ideal teacher in the perception of students). In K. Strunz, ed., Pädagogische Psychologie für höhere Schulen. 4th edition. München, Basel. Kleinmann, G. (1964). General science teacher’s questions, pupil and teacher behaviors, and pupil understanding of science. Unpublished doctoral dissertation. University of Virginia, Charlottesville (Universal Microfilms No. 65-2961). Klinzing, H. G. (1982) Training kommunikativer Fertigkeiten zur Gesprächsführung und für Unterricht (Training of skills for communication and teaching). Weil der Stadt, FRG: Lexika. Klinzing, H. G. (1984). Expressives nichtverbales Lehrerverhalten: Ein Forschungsbericht. (Expressive nonverbal behavior: A research review). Unterrichtswissenschaft, 12, 308-219. Klinzing, H.G. (1988a). Skill acquisition and reflection-based decision making in a teaching laboratory: An evaluation study. European Journal of Teacher Education, 11, 2/3, 167 –175. Klinzing, H.G. (1988b). Steigerung von Klarheit, Sozialem Klima, Interessantheit und nichtverbaler Ausdruckskraft bei Vorträgen durch systematisches Training: Eine quasi-experimentelle Untersuchung (The improvement of clarity, social climate, interestingness, and expressive nonverbal behavior by systematic training. A quasi-experimental investigation). In P. Hübner, ed., Teacher education and training in Europe. (pp. 75 – 94) Berlin: Universitätsdruckerei der Freien Universität Berlin. Klinzing, H.G. (1998a). Interagieren als Experimentieren. Entwicklung, Erprobung und Evaluation eines Programms zum Training von Präsentationstechniken zur Optimierung von Sachbeiträgen, Sachreden und belehrenden Reden (Interacting as experimentation. The development, testing, and evaluation of a program for the training of presentation skills to improve lecturing). In: H.G. Klinzing, Hrsg. Neue Lernverfahren. Zweite Festschrift für Walter Zifreund aus Anlaß seiner Emeritierung. (pp. 231-339) .Tübingen: DGVT-Verlag. Klinzing, H. G. (1998b). Training der Beobachtungs- und Interpretationsfähigkeit nichtverbaler Zeichen und Signale in der Mimik (Training of decoding and interpreting nonverbal signs and signals in facial expressions). In H. G. Klinzing, ed., Neue Lernverfahren. Zweite Festschrift für Walther Zifreund aus Anlaß seiner Emeritierung (New learning methods. Second commemorative volume for Walther Zifreund on the occasion of his retirement). (pp. 341 – 355). Tübingen, FRG: DGVT-Verlag. Klinzing, H. G. (1999). Expressive Nonverbal Behavior and Its Training: Practical Recommendations for Teacher Education from Research. Paper presented at the 24th annual conference of the Association for Teacher Education in Europe. Leipzig, FRG. Klinzing, H. G. (2002). Wie effektiv ist Microteaching? Ein Überblick über fünfunddreißig Jahre Forschung. (How effective is microteaching?: A review of 35 years of research). Zeitschrift für Pädagogik, 48 (2), 194 – 214.
65
Klinzing, H.G. (2003a). Improving accuracy in interpreting nonverbal signs and signals in facial expressions by systematic training. In W. Hoerner, D. Schulz, &H.-W. Wollersheim, eds., Teacher‘s professional knowledge and reference disciplines of teacher education. (pp. 141 – 156). Leipzig: Leipziger Universitätsverlag. Klinzing, H.G. (2003b). Improving accuracy of decoding emotions from facial expressions by cooperative learning techniques. Two experimental studies. Paper presented at the annual meeting of the American Educational Research Association. Chicago. Klinzing, H. G. (2003c). Improving Accuracy in Decoding Nonverbal Signs and Signals .A Synthesis of Research with Consequent Recommendations for Teacher Education. Paper presented at the annual meeting of the Invisible College for Research on Teaching. Chicago, IL. Klinzing, H.G. & Floden, R.E. (1990). Learning to moderate discussions. In W.W. Wilen, ed., Teaching and learning through discussion (pp. 175 - 202). Springfield, IL: Thomas. Klinzing, H. G. & Gerada-Aloisio, B. (2004). Expressive Nonverbal Behavior and Its Training. Paper presented at the annual meeting of the Invisible College for Research on Teaching. San Diego. Klinzing, H.G. & Jackson, I. (1987). Training teachers in nonverbal sensitivity and nonverbal behaviors. International Journal of Educational Research, 2, 589-600. Klinzing, H.G. & Klinzing-Eurich, G. (1988). Lehrerausbildung im Labor: Ein Überblick über die Forschung in der Bundesrepublik Deutschland (Teacher training in laboratory settings. A review of research in the FRG). In A. Leuteritz & C.R. Weisbach, Hrsg., Konkrete Pädagogik. Festschrift für Walther Zifreund zum 60. Geburtstag (pp. 141-157) Tübingen: Attempto. Klinzing, H.G. & Rupp, A. (1999). Training of discussion-moderators. Development of a research-based training program and its evaluation for the improvement of discussion moderator behavior. Paper presented at the annual conference of the Association for Teacher Education in Europe (ATEE). Leipzig. Klinzing, H.G. & Tisher, R.P. (1986). Expressive non-verbal behaviors: A review of research on training with consequent recommendations for teacher education. In J. Raths & L. Katz, eds., Advances in Teacher Education, Vol. 2. (pp. 89 – 133). Norwood, NY: Ablex. Klinzing, H.G. & Tisher, R.P. (1993). The development of classroom teaching skills. In H.Vonk, L. Kremer-Hayon, & R. Fessler, eds., Teacher professional development. Lisse, NL: Swets & Zeitlinger, 167-195. Klinzing, H.G., Fitzner, T., Klinzing-Eurich, G. (1983). Effects of a training program on expressive nonverbal behavior. Paper presented at the annual meeting of the American Educational Research Association. Montreal. (ERIC ED 233 999). Klinzing, H.G., Klinzing-Eurich, G., & Floden, R.E. (1989). Integrating the functions of teaching laboratory practice: Skill acquisition and reflection-based decision making in improving expository teaching. Paper presented at the annual meeting of the American Educational Research Association, San Francisco, CA.
66
Klinzing, H.G., Kunkel, K., Schiefer, H. J., Steiger, S. (1984). The effects of nonverbal behavior training on teacher clarity, interest, assertiveness and persuasiveness during microteaching. Paper presented at the annual meeting of the American Educational Research Association. New Orleans, LA (ERIC ED 252 519). Klinzing, H.G. (with Norbert Edel, N. Birgit Hauck-Bühler, B. & Susanne Lin-Klitzing, S. Wunsch, R. & Rupp, A.) (2002a). Assessment of microteaching laboratory experiences in the context of the first and second phase of teacher education in Germany. Paper presented at the annual conference of the Association for Teacher Education in Europe (ATEE). Warsaw, PL. Klinzing, H. G. with Edel, N., Hauck-Bühler, B. & Lin-Klitzing, S. (2002b). Microteaching in der zweiten Phase der Lehrerausbildung (Referendariat). Zwei experimentelle Effektivitätsprüfungen und Evaluationen eines Intensivkursprogramms am Staatlichen Seminar für Schulpädagogik (Gymnasien), Esslingen, und an der Universität Tübingen.(Microteaching in the second Phase of teacher education (Referendariat). Two experimental investigations at the teacher training college (High School) in Esslingen and at the University of Tuebingen). Beitrag zur Beitrag zum Kongress der Deutschen Gesellschaft für Erziehungswissenschaft, München, FRG. Knapp, M.L. (1978). Nonverbal communication in human interaction. 2nd. edition. New York, NY: Holt, Rinehart, & Winston. Knapp, M.L. & Hall, J.A. (2002). Nonverbal communication in human interaction. 5th edition. Wadsworth: Thompson Learning, Inc. Land, M. L. (1980). Joint effects of teacher structure and teacher enthusiasm on student achievement. Paper presented at the Annual Meeting of the Southwest Educational Research Association. San Antonio, TX (ERIC ED 182 310). Lieberman, D.A., Rigo, T. G., & Campain, R. F. (1988). Age-related differences in nonverbal decoding ability. Communication Quarterly, 36, 290 – 297. Löwe, H. & Preuss, G. (1966). Die Lehrerpersönlichkeit im Urteil von Berufsschülern (The teacher personality judged by students of a vocational school). Berufsbildung, 495-499. 532-544. Mastin, V. E. (1963). Teacher enthusiasm. Jo earch, 56, 385-386.urnal of Educational Res McCoard, W. B. (1944). Speech factors as related to training efficiency. Speech Monographs, 11, 53-64. McConnel, J. W. (1977). Relationships between selected teacher behaviors and attitudes/achievement of algebrar classes. Paper presented at the annual meeting of the American Educational Research Association, New York, N.Y. (ERIC ED 141 118). Metcalfe, K. K. (1995). Laboratory experiences in teacher education. In L. W. Anderson, ed., International encyclopedia of teaching and teacher education. 2nd ed. New York: Pergamon, 578 – 582. Müller-Wolf, H. M. & Fittkau, B. (1971). Lehrverhalten von Hochschullehrern und seine Bedeutung für Einstellung und Verhalten von Studenten. Zeitschrift für Entwicklungspsychologie und Pädagogische Psychologie, 3, 165 – 180. Noller, P. (1980). Misunderstandings in marital communication: A study of couples’ nonverbal communication. Journal of Personality and Social Psychology, 39, 1135 – 1148.
67
Noller, P. & Gallois, C. (1986). Sending emotional messages in marriage: Non-verbal behaviour, sex and communication clarity. British Journal of Social Psychology, 25, 287-297. Otteson, J. P. & Otteson, C. R. (1980). Effects of teacher gaze on children`s story recall. Perceptual and Motor Skills, 50, 35-42. Pierce, W. & Halinski, R. (1974). An evaluation of microteaching training techniques using pupil outcomes as the evaluation criterion. Contemporary Education, 46, 1, 45-50. Popham, W. J. (1975). Educational evaluation. Englewood Cliffs, NJ: Prentice Hall. Raymond, A. (1973). The acquisition of nonverbal behaviors by preservice science teachers and their application during student teaching. Journal of Research in Science Teaching, 10, 1, 13-24. Riggio, R. E. & Friedman, H. S. (1986). Impression formation: The role of expressive behaviour. Journal of Personality and Social Psychology, 50, 421 – 427. Romine, S. (1974). Student and faculty perceptions of an effective university instructional climate. The Journal of Educational Research, 68, 139-143. Rosenshine, B. (1968). Behavioral predictors of effectiveness in explaining social studies material. Unpublished doctoral dissertation. Stanford University. Rosenshine, B. (1970). Enthusiastic teaching: A research review. School Review, 78, 499-514. Rosenshine, B. (1971). Teaching behaviors and student achievement. London, UK: National Foundation for Educational Research in England and Wales.. Rosenshine, B. & Furst, N. F. (1973). The use of direct observation to study teaching. In: M. W. Travers, ed., Second handbook of research on teaching. Chicago: Rand McNally, 122-183. Rosenthal, R., Hall, J. A., DiMatteo, M. R., Rogers, P. L., & Archer, D. (1979). Sensitivity to nonverbal communication. The PONS-test. Baltimore, MD: The John Hopkins University Press. Ryans, D. G. (1960). Characteristics of teachers. Washington: American Council of Education. Scherer, K. R. (1979). Die Funktionen des nonverbalen Verhaltens (The functions of nonverbal behavior). In K. R. Scherer & H. G. Wallbott, Hrsg., Nonverbale Kommunikation (pp. 25 – 32). Weinheim: Beltz. Schiefer, H. J., Kunkel,, K., Steiger, S., Revenstorf, D. & Klinzing, H. G. (1984). Training nichtverbaler Expressivität und deren geschlechtsspezifische Bedeutung für die Überzeugungskraft. Unterrichtswissenschaft, 12, 350 – 358. Seifert, K. H. (1974). Schülererwartung und Lehrererverhalten und ihre Bedeutung für die schulisch-berufliche Sozialisation (Expectations of students and their importance for the vocational socialisation). Die Deutsche Berufs- und Fachschule, 70, 3-27 Semmel, M. I. & Englert, C. S. (1978). A decision - making orientation applied to student teaching supervision. TEASE, 1, 18 – 36.
68
Shavelson, R. J. (1976). Teachers´ decision making. In N. L. Gage, ed., The psychology of teaching methods. The seventy-fifth year book of the National Society for the Study of Education. Chicago, IL: University of Chicago Press, 372-414. Snyder, M. (1974). Self-monitoring of expressive behavior. Journal of Personality and Social Psychology, 30, 526 – 537. Solomon D. (1966). Teacher Behavior Dimensions: Course Characteristics and Student Evaluation of Teachers. American Educational Research Journal, 3, 35-47. Solomon, D., Rosenberg, L., & Bedzek, , W. E.(1964). Teacher behavior and student learning. Journal of Educational Psychology, 55, 1, 23-30. Smith, H. A. (1979). Nonverbal communication in teaching. Review of Educational Research, 49, 4, 631- 672. Smith, H. A. (1995). Nonverbal teacher behavior. In L. W. Anderson, ed., International encyclopedia of teaching and teacher education. 2nd edition. New York, NY: Pergamon /Elsevier Science Ltd., 274 – 278. Spitzberg, B. H. (1988). Communication competence: Measures of perceived effectiveness. In Ch.T. Tardy, ed., A handbook for the study of human communication (pp 67-107). Norwood, N.J.: Ablex. Spitzberg, B. H. & Cupach, W. R. (1983). The relational competence construct: Development and research. Paper presented at the Speech Communication Association convention, Washington, DC (ED 246 490). Spitzberg, B. H. & Cupach, W. R. (1985). Conversational skill and locus of perception. Journal of Psychopathology and Behavioral Assessment, 7, 3, 207 – 220. Strasser, B. (1967). A conceptual model of instruction. Journal of Teacher Education, 18 (1), 63-74. Tausch, R., & Tausch, A. (1977). Erziehungspsychologie (Educational psychology). 7. Auflage. Göttingen, FRG: Hogrefe. Unruh, W. R. (1968). The modality and validity of cues to lecture effectiveness. In N. L. Gage, et al., eds., Explorations of the teacher’s effectiveness in explaining. Technical Report No. 4. Stanford, CA: Stanford Center for Research and Development in Teaching, School of Education, Stanford University. Wagner, H. L., Buck, R., & Winterbotham, M. (1993). Communication of specific emotions: Gender differences in sending accuracy and communication measures. Journal of Nonverbal Behavior, 17, 29 – 53. Wallen, N. E. (1966). Relationships between teacher characteristics and student behavior. Part III. Salt Lake City: University of Utah, (ERIC ED 010 390). Ware, J. E. & Williams, R. G. (1975). The Dr. Fox Effect: A study of lecturer effectiveness and ratings of instruction. Journal of Medical Education, 50, 149 – 156. Williams, R. G. & Ware, J. E. (1976). Validity of student ratings of instruction under different incentive conditions: A further study on the Dr. Fox Effect. Journal of Educational Psychology, 68, 1, 48 – 56.
69
Williams, R. G. & Ware, J. E. (1977). An extended visit with Dr. Fox. Validity of student satisfaction with instruction ratings after repeated exposures to a lecturer. American Educational Research Journal, 14, 4, 449 – 457. Woolbert, C. H. (1920). Effects of various modes of public reading. Journal of Applied Psychology, 4, 162-185. Woolfolk, A. E. (1978). Student learning and performance under varying conditions of teacher verbal and nonverbal evaluative communication. Journal of Educational Psychology, 70, 87 -94. Woolfolk, A. E. & Brooks, D.M. (1983). Nonverbal communication in teaching. Review of Research in Education, 10, 103-149. Wyckoff, E. M.(1973). Effect of stimulus variation on learning from lecture. The Journal of Experimental Education, 41, 3, 85-90. Young, E. M. (1973). Effect of teacher enthusiasm on vocational business education student achievement. Unpublished doctoral dissertation. Columbia: University of Missouri, (University Microfilms International, Ann Arbor, No.74-18676). Zaidel, S. & Mehrabian, A. (1969). The ability to communicate and infer positive and negative attitudes facially and vocally. Journal of Experimental Research in Personality, 3, 233 – 241. Zifreund, W. (1966). Konzept für ein Training des Lehrverhaltens mit Fernseh-Aufzeichnungen in Kleingruppen-Seminaren (A concept for a training of teaching behavior with video recordings in small group settings). Berlin: Cornelsen.
Address of the first author: Dr. rer. soc. habil. Hans Gerhard Klinzing (apl. Prof., University of Tuebingen; Hon. Prof., University of Stuttgart) Brahmsweg 19; D- 72076 Tuebingen, Germany Telephon/Fax: **49 7071 65430 Mobilphone: 0170 29 15430 e-mail: [email protected]@freenet.de