Intensive Variables in Kimberlite Magmas, Lac de Gras, Canada and Implications for Diamond Survival YANA FEDORTCHOUK AND DANTE CANIL * SCHOOL OF EARTH AND OCEAN SCIENCES, UNIVERSITY OF VICTORIA, PO BOX 3055, 3800 FINNERTY ROAD, VICTORIA, BC, V8W 3P6, CANADA RECEIVED OCTOBER 1, 2003; ACCEPTED MARCH 19, 2004 ADVANCE ACCESS PUBLICATION JULY 29, 2004 Crystallization temperatures ( T) and oxygen fugacities ( fO 2 ) of kimberlite magma are estimated from oxides included in olivine phenocrysts from the Leslie, Aaron, Grizzly and Torrie kimberlite pipes in the central Slave Province, Canada. Crystallization tem- peratures recorded by olivine–chromite pairs at an assumed pressure of 10 GPa are 1030–1170 C 50 C, with a mean of 1080 C. At these temperatures, the fO 2 of coexisting olivine and chromite is 2–3 log units less oxidized than the nickel–nickel oxide (NNO) buffer at a silica activity limited by the presence of monticellite. Mass balance of olivine, bulk-rock and liquid composi- tions in equilibrium with olivine phenocryst rims suggests that these kimberlites represent crystallization from a magma with 11–28 mol % of liquid, 10 mol % of earlier precipitated olivine phenocrysts and 62–79 mol % of mantle xenocryst olivine. The calculated T–fO 2 values indicate that diamonds entrained in the Lac de Gras kimber- lites were probably transported to the surface within the stability field of graphite but close to the graphite–CO 2 boundary. KEY WORDS: chromite; crystallization temperature; kimberlite; olivine; oxygen fugacity INTRODUCTION Kimberlites are exotic and complex rocks that, for a number of reasons, are attractive for study. First, the composition and intensive variables (e.g. T, f O 2 ) of these mantle-derived magmas shed light on the processes and conditions in their deep mantle source. Secondly, because kimberlites are the main, primary source of dia- monds, knowing these intensive variables constrains the likely presence and quality of diamonds in a pipe. Despite decades of study on kimberlites, there is still no comprehensive model for their origin and evolution (Mitchell, 1995). One of the major unknowns is the primary composition of kimberlite melt formed in the mantle. Kimberlite magma sampled at the surface is a hybrid of minerals formed by crystallization and xenoliths derived from the mantle and crust. There are no unambi- guous criteria to isolate material crystallized from the melt phase from that contributed by xenolithic material. The best approximations of natural primary magmas are aphanitic kimberlites, such as at Wesselton, South Africa (Shee, 1986) or Jericho, Canada (Price et al., 2000). Even in these special cases, it remains unclear whether volatile (H 2 O, CO 2 ) contents or their ratios have been preserved during emplacement. Experimental studies of natural and synthetic compositions can provide an esti- mate of liquidus temperatures for kimberlites (Edgar et al., 1988; Canil & Scarfe, 1990; Ringwood et al., 1992; Edgar & Charbonneau, 1993; Girnis et al., 1995; Dalton & Presnal, 1998), but these estimates can also be suspect because of the diversity in compositions chosen as starting material in the experiments, and the effect of uncon- strained primary CO 2 /H 2 O on resulting determinations of liquidus temperatures and mineralogy. Application of mineral geothermometers and oxygen barometers for the estimation of T and f O 2 in kimberlite magma is usually not possible, because of the high degree of alteration that many pipes experience during their emplacement. One possible measure of redox conditions in kimberlite is the chemical composition of ilmenite. Pipes that contain ilmenites with low Fe 3þ /Fe 2þ and high Mg are considered to have crystallized at low but undefined f O 2 conditions (Fipke et al., 1995). This JOURNAL OF PETROLOGY VOLUME 45 NUMBER 9 PAGES 1725–1745 2004 DOI: 10.1093/petrology/egh031 * Corresponding author. Telephone: 001 250 472 4180. Fax: 001 250 721 7200. E-mail: [email protected]Journal of Petrology 45(9) # Oxford University Press 2004; all rights reserved Downloaded from https://academic.oup.com/petrology/article/45/9/1725/1503427 by guest on 08 December 2021
Transcript
Intensive Variables in Kimberlite Magmas,Lac de Gras, Canada and Implications forDiamond Survival
YANA FEDORTCHOUK AND DANTE CANIL*
SCHOOL OF EARTH AND OCEAN SCIENCES, UNIVERSITY OF VICTORIA, PO BOX 3055, 3800 FINNERTY ROAD,
VICTORIA, BC, V8W 3P6, CANADA
RECEIVED OCTOBER 1, 2003; ACCEPTED MARCH 19, 2004ADVANCE ACCESS PUBLICATION JULY 29, 2004
Crystallization temperatures (T) and oxygen fugacities (fO2) of
kimberlite magma are estimated from oxides included in olivine
phenocrysts from the Leslie, Aaron, Grizzly and Torrie kimberlite
pipes in the central Slave Province, Canada. Crystallization tem-
peratures recorded by olivine–chromite pairs at an assumed pressure
of 1�0 GPa are 1030–1170�C � 50�C, with a mean of
�1080�C. At these temperatures, the fO2 of coexisting olivine
and chromite is 2–3 log units less oxidized than the nickel–nickel
oxide (NNO) buffer at a silica activity limited by the presence of
monticellite. Mass balance of olivine, bulk-rock and liquid composi-
tions in equilibrium with olivine phenocryst rims suggests that these
kimberlites represent crystallization from a magma with 11–28 mol %
of liquid, 10 mol % of earlier precipitated olivine phenocrysts and
62–79 mol % of mantle xenocryst olivine. The calculated T–fO2
values indicate that diamonds entrained in the Lac de Gras kimber-
lites were probably transported to the surface within the stability field
of graphite but close to the graphite–CO2 boundary.
Kimberlites are exotic and complex rocks that, for anumber of reasons, are attractive for study. First, thecomposition and intensive variables (e.g. T, fO2) ofthese mantle-derived magmas shed light on the processesand conditions in their deep mantle source. Secondly,because kimberlites are the main, primary source of dia-monds, knowing these intensive variables constrains thelikely presence and quality of diamonds in a pipe.
Despite decades of study on kimberlites, there is still nocomprehensive model for their origin and evolution(Mitchell, 1995). One of the major unknowns is theprimary composition of kimberlite melt formed in themantle. Kimberlite magma sampled at the surface is ahybrid of minerals formed by crystallization and xenolithsderived from the mantle and crust. There are no unambi-guous criteria to isolate material crystallized from themelt phase from that contributed by xenolithic material.The best approximations of natural primary magmas
are aphanitic kimberlites, such as at Wesselton, SouthAfrica (Shee, 1986) or Jericho, Canada (Price et al., 2000).Even in these special cases, it remains unclear whethervolatile (H2O, CO2) contents or their ratios have beenpreserved during emplacement. Experimental studies ofnatural and synthetic compositions can provide an esti-mate of liquidus temperatures for kimberlites (Edgar et al.,1988; Canil & Scarfe, 1990; Ringwood et al., 1992; Edgar& Charbonneau, 1993; Girnis et al., 1995; Dalton &Presnal, 1998), but these estimates can also be suspectbecause of the diversity in compositions chosen as startingmaterial in the experiments, and the effect of uncon-strained primary CO2/H2O on resulting determinationsof liquidus temperatures and mineralogy.Application of mineral geothermometers and oxygen
barometers for the estimation of T and fO2 in kimberlitemagma is usually not possible, because of the high degreeof alteration that many pipes experience during theiremplacement. One possible measure of redox conditionsin kimberlite is the chemical composition of ilmenite.Pipes that contain ilmenites with low Fe3þ/Fe2þ andhigh Mg are considered to have crystallized at low butundefined fO2 conditions (Fipke et al., 1995). This
JOURNAL OF PETROLOGY VOLUME 45 NUMBER 9 PAGES 1725–1745 2004 DOI: 10.1093/petrology/egh031
Journal of Petrology 45(9) # Oxford University Press 2004; all rights
reserved
Dow
nloaded from https://academ
ic.oup.com/petrology/article/45/9/1725/1503427 by guest on 08 D
ecember 2021
method has two shortcomings: it has only been empiri-cally developed for South African kimberlites and maynot apply to pipes from other provinces, such as those inNorth America (Orr & Luth, 2000); also, the paucity orabsence of ilmenite in some kimberlite pipes limits itsapplication (Fipke et al., 1995).We examined some extremely fresh kimberlites
from the Lac de Gras kimberlite field, in the NorthwestTerritories, Canada. Olivine phenocrysts in these kim-berlites contain inclusions of magnesiochromite, allowingapplication of Mg–Fe exchange thermometry and oxygenbarometry to examine T–fO2 evolution during emplace-ment of hypabyssal, diatreme and crater phases of pipe
development. We then highlight the influence of all ofthese variables on the preservation of diamond inkimberlite melt and the prediction of economic potentialof a kimberlite pipe.
GEOLOGY, SAMPLES AND
PETROGRAPHY
Geology
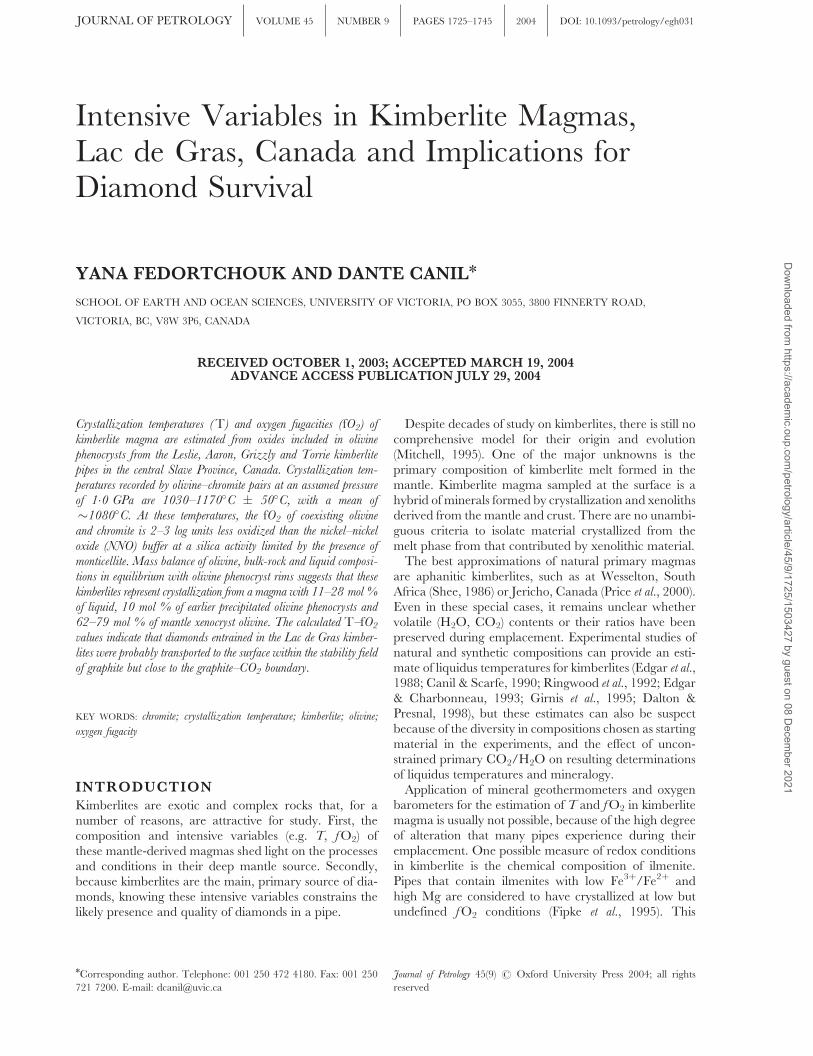
The Lac de Gras kimberlite field is located in the east-central part of the Archean Slave Province, Canada(Fig. 1). The Lac de Gras kimberlites have Eocene and
Fig. 1. Location map showing the distribution of kimberlite pipes in the Lac de Gras area (from Ward et al., 1995, and references therein).
JOURNAL OF PETROLOGY VOLUME 45 NUMBER 9 SEPTEMBER 2004
1726
Dow
nloaded from https://academ
ic.oup.com/petrology/article/45/9/1725/1503427 by guest on 08 D
ecember 2021
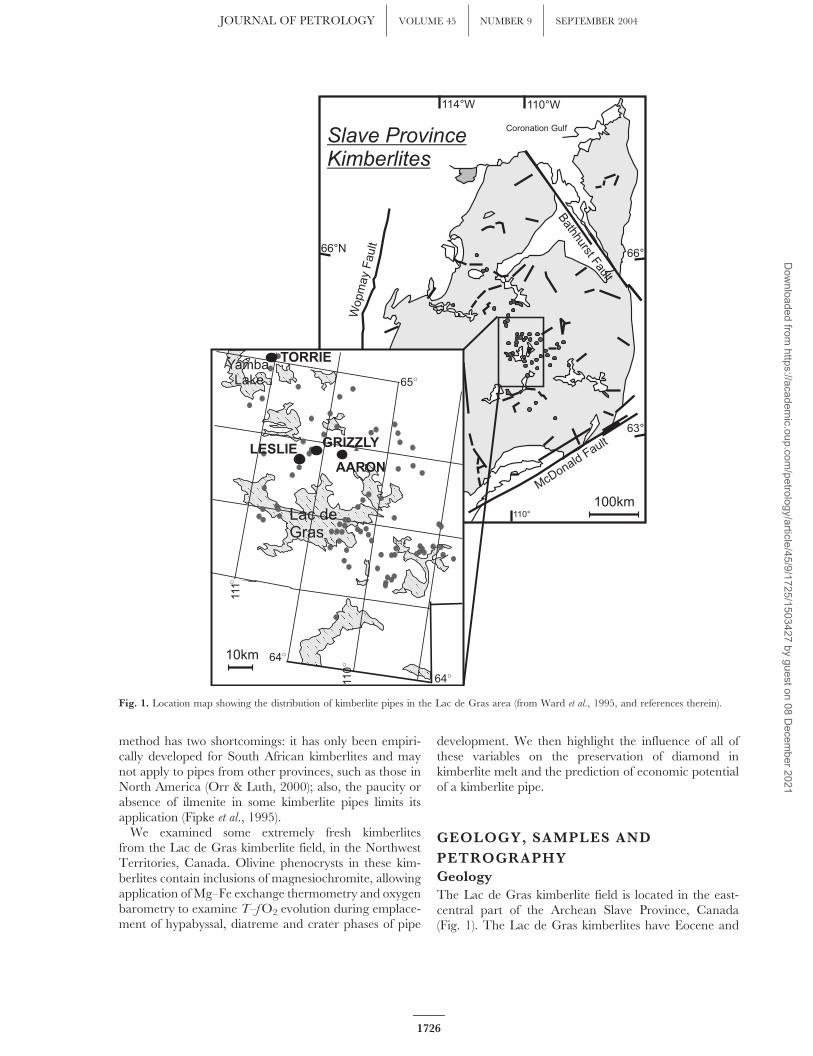
Late Cretaceous emplacement ages (Davis & Kjarsgaard,1997; Creaser et al., 2003) and intrude metamorphosedArchean sedimentary, volcanic and plutonic rocks (Wardet al., 1995; Pell, 1997). Most of the Slave Province kim-berlite pipes do not outcrop at the surface and are usuallysmall, ranging from 2 to 12 hectares in surface area (Pell,1997). The majority of these pipes are filled by craterfacies (pyroclastic and epiclastic) kimberlite intruded byhypabyssal facies magma (Kirkley et al., 1998; Pell, 1997).Diatreme facies kimberlite is rare in comparison withSouth African examples. This study examines freshkimberlite sampled in drill core from four kimberlitepipes: Grizzly, Torrie, Leslie and Aaron, with an empha-sis on the latter two (Fig. 1). The composition, age andother data for the four kimberlites are summarized inTable 1.The Leslie pipe is 7 hectares in area (Fig. 2a). It was
emplaced in porphyritic biotite granite and filled withvery fresh hypabyssal facies kimberlite to the presentland surface. Only a remnant of tuffitic kimberlite brec-cia is intersected at a depth of 400 m (Berg & Carlson,1998). The nearby pipes of the same age are filled withcrater facies kimberlite to a depth of at least 300 m (Berg& Carlson, 1998, and references therein). Thus, theabsence of crater facies at Leslie cannot be the result oferosion but rather reflects either an explosively formedopen vent that was subsequently filled by magmatic kim-berlite, or an earlier tuffitic kimberlite breccia phasedisplaced by a hypabyssal intrusion (Berg & Carlson,1998). Bulk-rock geochemical studies of Leslie samplesby Berg & Carlson (1998) indicate that geochemicalvariations represent one intrusive phase or multiplephases of chemically identical magma batches. The Lesliepipe incorporates both wall-rock granitoid and mantlexenoliths.The Aaron pipe is mainly filled with pelletal volcani-
clastic kimberlite that incorporates fragments of shale andbiotite- and garnet-bearing country rock. The south-eastwall of the pipe is composed of hypabyssal kimberlite
(Fig. 2c). The tuff and tuff breccia of the Torrie pipeintrude late Archean K-rich granitoids and have abun-dant clay and organic fragments (Orr & Luth, 2000).
Samples
Samples of the Leslie (LS-1 to -5) pipe were selected from81 pieces of core collected every 2–3 m from drill-holeLDC-09 (Fig. 2a) in the interval between 20 and 231 m.Sample LS-5 is located near the contact with wall rockand shows extensive serpentinization, whereas all fourothers are massive and extremely fresh hypabyssalkimberlite—well suited for study of their primary mineralcompositions.Aaron samples (AN-1 to -7) were chosen from 95 pieces
of core, collected every 1–2 m from drill-hole 97-57 inthe interval between 47 and 160 m (Fig. 2c) and representdifferent kimberlite facies. Samples AN-1, 2, 6 and 7 aregrey, hypabyssal kimberlite, with little or no alteration;AN-3 is more altered and contains xenoliths of countryrock; AN-4 and AN-5 are friable, green volcaniclastics,with serpentine alteration and abundant wall-rockxenoliths.Two samples from the Grizzly pipe (GR95-19 and
GR95-43) are fresh macrocrystal hypabyssal kimberlite(similar to the Leslie kimberlite). Four samples from theTorrie pipe (TQY 94-17-3, TQY 94-17-13, TQY 94-17-15, TQY 94-17-18) are organic-bearing kimberlite tuffand tuff breccia. Sample locations within the drill-corewere not recorded during collection of samples from thetwo latter pipes.
Petrography
All Leslie samples and the hypabyssal facies of theAaron pipe are macrocrystic hypabyssal monticellitekimberlite (Fig. 3a), according to the terminologyof Scott-Smith (1992). They contain abundantmacrocrysts and phenocrysts of olivine, macrocrysts ofgarnet surrounded by secondary reaction rims, pale to
Table 1: Composition and age of the Leslie, Aaron, Grizzly and Torrie kimberlites
Locality Age (Ma) Kimberlite facies Equilibration T & P of mantle xenoliths
Leslie pipe 52.7 � 2.9* Mainly hypabyssal with a remnant
of tuffitic kimberlite breccia (TKB)
Eclogites 725—1438�C at
2.5—8.5 GPa (Fung, 1998)
Aaron pipe 45.2 � 1.3* Pelletal volcaniclastic and hypabyssal
Torrie pipe Late Cretaceous—early Paleoceney Macrocrystic, heterolithic, volcaniclastic
kimberlite tuff and tuff breccia
849—1350�C at 2.4—6.0 GPa
(MacKenzie & Canil, 1999)
*Based on Rb—Sr systematics of phlogopite macrocrysts (Creaser et al., 2003).yFrom palynology (Nassichuk & McIntyre, 1995).
FEDORTCHOUK AND CANIL INTENSIVE VARIABLES IN KIMBERLITE MAGMAS
1727
Dow
nloaded from https://academ
ic.oup.com/petrology/article/45/9/1725/1503427 by guest on 08 D
ecember 2021
emerald green clinopyroxenes (� garnet inclusions,reaction rims), kink-banded altered biotite and mantle-derived micro-xenoliths, set in relatively fresh matrixof dominantly monticellite and late olivine. Anhedralolivine macrocrysts (up to several mm) constitute 20–45%of the rock and are oval, with minor serpentinizationalong margins and fractures.Olivine phenocrysts were distinguished using two cri-
teria: euhedral shape and parallel extinction undercrossed polars. They are small (0�2–1 mm), fresh andsometimes broken. Phenocrysts locally show distinctivezoning on back-scattered electron images (Fig. 3b),with the cores darker or brighter than the margins. The
interiors are often rounded and anhedral, indicating par-tial dissolution before overgrowth by a later generation ofolivine. The margins of phenocrysts often contain inclu-sions of euhedral (1–10 mm) aluminous magnesianchromite (Fig. 3f). The matrix includes fresh, euhedralmicrophenocrysts of olivine (up to 0�2 mm) and abun-dant monticellite (up to 80 mm) (Fig. 3c), surrounded by afine-grained aggregate of serpentine, with zoned perovs-kite, altered chromite, magnetite, late-stage phlogopite(in Leslie samples), Mg-rich ilmenite, calcite, apatite andminor sulfides (pyrite).Samples close to the contact with wall rocks are
more extensively altered. LS-5 from the Leslie pipe hasolivine macrocrysts and phenocrysts that show significantserpentinization along fractures and margins. Calcite andserpentine aggregates occur as pseudomorphs of olivinemicrophenocrysts and monticellite. The groundmass isaltered to calcite and abundant clayminerals and containslaths of phlogopite. Mineralogically, this rock is a macro-crystic, hypabyssal, calcite, serpentine kimberlite. SampleAN-3 from the contact between hypabyssal and vol-caniclastic kimberlite of the Aaron pipe is even morealtered. The olivine macrocrysts and phenocrysts areoften broken, highly fractured and serpentinized at themargins. Garnet macrocrysts are completely pseudo-morphed by chlorite.The volcaniclastic kimberlite of the Aaron pipe con-
tains abundant xenoliths of biotite-rich metamorphiccountry rock. Megacrysts and phenocrysts are brokenand fractured. Olivine phenocrysts with fresh coreshave margins partially or completely replaced by afine-grained, brownish-red aggregate (Fig. 3d), set in acarbonate-rich matrix. The matrix is not uniform, con-sisting of calcite–serpentine aggregates with abundantopaque minerals or dominated by calcite that formsrounded grains (Fig. 3e) surrounded by aggregates ofserpentine and clay minerals.Olivine phenocrysts in the Leslie, Aaron, Grizzly and
Torrie kimberlites contain numerous oxide inclusions.The inclusions (1–10 mm) are mainly of magnesiochro-mite, but Torrie olivines also contain inclusions of rutileand ilmenite. All oxide inclusions are located within therims of olivine phenocrysts and can often be found in thesame olivine grain (Fig. 3f ). The oxides do not show anyparticular distribution relative to one another and prob-ably crystallized at the same stage. The euhedral shape ofthe oxide minerals indicates crystallization from a melt.Petrographic study of the Leslie and Aaron samples
shows that in both of these pipes, the degree of secondaryalteration increases with depth in the borehole. LS-1, 2, 3and AN-1 are extremely fresh kimberlites, LS-4 andAN-2 are slightly altered, LS-5 and AN-3 more altered,and AN-4 and -5 are volcaniclastic kimberlite andshow extensive alteration and contamination by countryrock.
Fig. 2. (a) Cross-section of the Leslie kimberlite pipe showing thelocation of borehole LDC-09 and the samples used in this study.Inset (b) is a plan view of the Leslie pipe with drill-hole locations(from Berg & Carlson, 1998). (c) Cross-section of the Aaron kimberlitepipe showing location of drill-hole 97-57 and the samples used inthis study.
JOURNAL OF PETROLOGY VOLUME 45 NUMBER 9 SEPTEMBER 2004
1728
Dow
nloaded from https://academ
ic.oup.com/petrology/article/45/9/1725/1503427 by guest on 08 D
ecember 2021
(a) (b)
(c) (d)
(e)
(f)
Fig. 3. Back-scattered electron images of kimberlites with scale bars shown. (a) Macrocrystic hypabyssal monticellite kimberlite (LS-3). (b) Normaland reverse zoning in olivine phenocrysts (LS-2). (c) Microphenocrysts of olivine and monticellite in groundmass of hypabyssal facies kimberlite(LS-1). (d) Serpentinization of olivine rim in diatreme facies kimberlite (AN-4). (e) Calcite- and serpentine-rich groundmass in diatreme facieskimberlite (AN-4). (f ) Euhedral chromite and rutile inclusions in margins of olivine phenocryst from the Torrie kimberlite.
FEDORTCHOUK AND CANIL INTENSIVE VARIABLES IN KIMBERLITE MAGMAS
1729
Dow
nloaded from https://academ
ic.oup.com/petrology/article/45/9/1725/1503427 by guest on 08 D
ecember 2021
ANALYTICAL METHODS
Electron microprobe analyses of minerals were carried outwith a JEOL JXA 8900R electron microprobe (EMP) atthe University of Alberta (U of A) and a CAMECA SX50electron microprobe at the University of British Columbia(UBC). Major and minor elements were determined at15�0 kV acceleration voltage and a beam current of20�1 nA (UBC) and 15 nA (U of A) with a 5mm beam forolivines and a 1mm beam for chromites, ilmenites andrutile. Analytical conditions were 20 s of counting time onpeaks for all major elements, 60 s for Ni and 80 s for V andZn. Data reduction was done with the ‘PAP’ j(rZ)method(Pouchou & Pichoir, 1985). Natural and synthetic stan-dards were used for calibration. Analyses obtained for the
same chromite grain at both UBC and U of A differ by lessthan 5% for major elements, by up to 10% for Ti and bymore than 10% for V,Mn, Ni and Zn. The Fe3þ and Fe2þ
of the chromites and ilmenites were calculated on the basisof perfect stoichiometry (Droop, 1987).Whole-rock analyses were performed at the Geochem-
ical Laboratories of McGill University, Montreal,Quebec, using methods described by Price et al. (2000).The major and trace elements were measured by X-rayfluorescence (XRF ) spectrometry, and CO2 using aLECO induction furnace and absorption bulb. H2Owas calculated as difference between LOI and CO2.Oxygen and carbon isotope analyses of whole-rock and
carbonate fractions were performed at the University of
Table 2: Analyses of chromite inclusions in olivine phenocrysts from the Leslie, Aaron, Grizzly and Torrie
kimberlites
Sample MgO Al2O3 SiO2 CaO TiO2 V2O3 Cr2O3 MnO FeO Fe2O3* NiO ZnO Total Fe3þ/Fetot
na, not analyzed.*Fe3þ calculated using method of Droop (1987).yFe3þ calculated from Mossbauer spectroscopy (Kopylova & McCammon, 2003).
JOURNAL OF PETROLOGY VOLUME 45 NUMBER 9 SEPTEMBER 2004
1730
Dow
nloaded from https://academ
ic.oup.com/petrology/article/45/9/1725/1503427 by guest on 08 D
ecember 2021
Alberta, using a Finnigan MAT 252 mass spectrometer.Oxygen from silicate was extracted by the BrF5 technique(Clayton & Toshiko, 1983). C and O from carbonateswere liberated using phosphoric acid (McCrea, 1950).
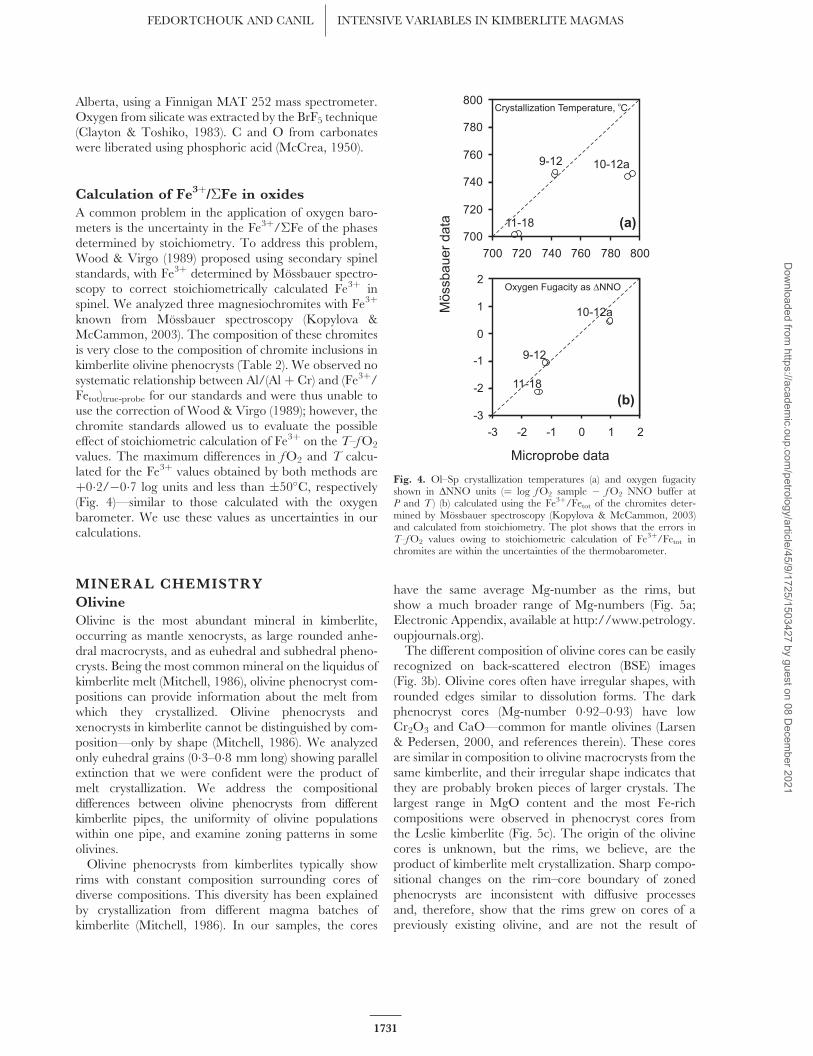
Calculation of Fe3þ/�Fe in oxides
A common problem in the application of oxygen baro-meters is the uncertainty in the Fe3þ/�Fe of the phasesdetermined by stoichiometry. To address this problem,Wood & Virgo (1989) proposed using secondary spinelstandards, with Fe3þ determined by Mossbauer spectro-scopy to correct stoichiometrically calculated Fe3þ inspinel. We analyzed three magnesiochromites with Fe3þ
known from Mossbauer spectroscopy (Kopylova &McCammon, 2003). The composition of these chromitesis very close to the composition of chromite inclusions inkimberlite olivine phenocrysts (Table 2). We observed nosystematic relationship between Al/(Al þ Cr) and (Fe3þ/Fetot)true-probe for our standards and were thus unable touse the correction of Wood & Virgo (1989); however, thechromite standards allowed us to evaluate the possibleeffect of stoichiometric calculation of Fe3þ on the T–fO2
values. The maximum differences in fO2 and T calcu-lated for the Fe3þ values obtained by both methods areþ0�2/�0�7 log units and less than �50�C, respectively(Fig. 4)—similar to those calculated with the oxygenbarometer. We use these values as uncertainties in ourcalculations.
MINERAL CHEMISTRY
Olivine
Olivine is the most abundant mineral in kimberlite,occurring as mantle xenocrysts, as large rounded anhe-dral macrocrysts, and as euhedral and subhedral pheno-crysts. Being the most common mineral on the liquidus ofkimberlite melt (Mitchell, 1986), olivine phenocryst com-positions can provide information about the melt fromwhich they crystallized. Olivine phenocrysts andxenocrysts in kimberlite cannot be distinguished by com-position—only by shape (Mitchell, 1986). We analyzedonly euhedral grains (0�3–0�8 mm long) showing parallelextinction that we were confident were the product ofmelt crystallization. We address the compositionaldifferences between olivine phenocrysts from differentkimberlite pipes, the uniformity of olivine populationswithin one pipe, and examine zoning patterns in someolivines.Olivine phenocrysts from kimberlites typically show
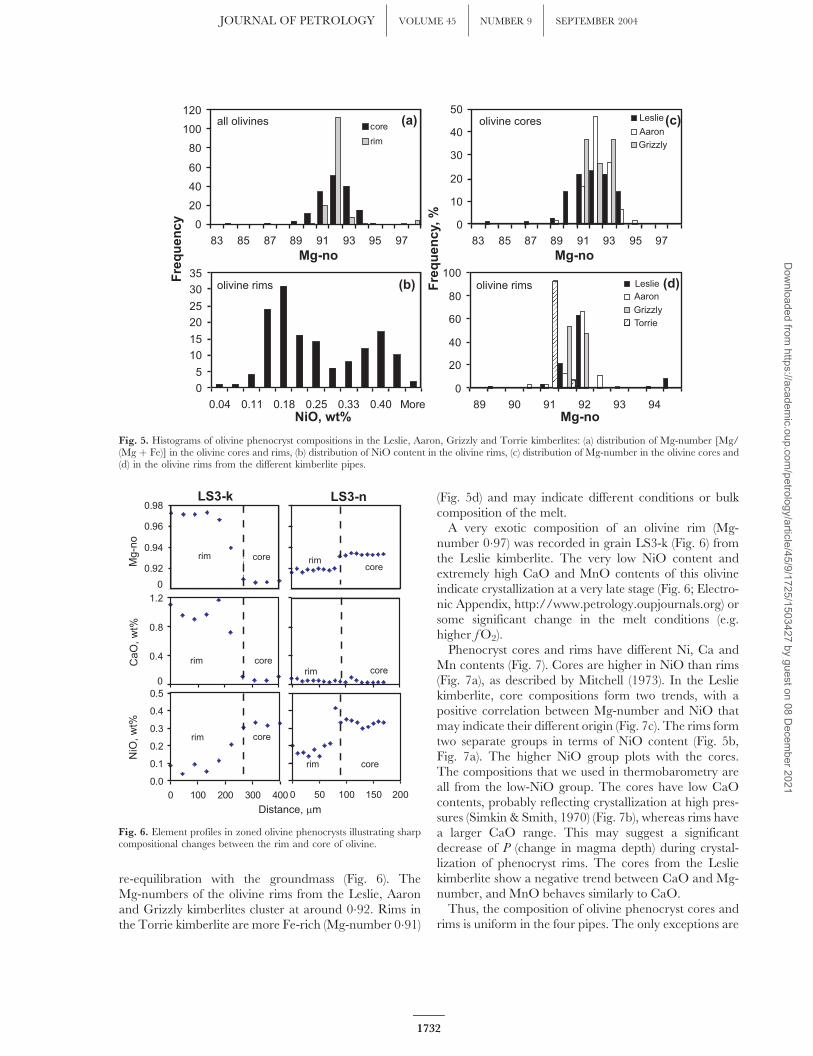
rims with constant composition surrounding cores ofdiverse compositions. This diversity has been explainedby crystallization from different magma batches ofkimberlite (Mitchell, 1986). In our samples, the cores
have the same average Mg-number as the rims, butshow a much broader range of Mg-numbers (Fig. 5a;Electronic Appendix, available at http://www.petrology.oupjournals.org).The different composition of olivine cores can be easily
recognized on back-scattered electron (BSE) images(Fig. 3b). Olivine cores often have irregular shapes, withrounded edges similar to dissolution forms. The darkphenocryst cores (Mg-number 0�92–0�93) have lowCr2O3 and CaO—common for mantle olivines (Larsen& Pedersen, 2000, and references therein). These coresare similar in composition to olivine macrocrysts from thesame kimberlite, and their irregular shape indicates thatthey are probably broken pieces of larger crystals. Thelargest range in MgO content and the most Fe-richcompositions were observed in phenocryst cores fromthe Leslie kimberlite (Fig. 5c). The origin of the olivinecores is unknown, but the rims, we believe, are theproduct of kimberlite melt crystallization. Sharp compo-sitional changes on the rim–core boundary of zonedphenocrysts are inconsistent with diffusive processesand, therefore, show that the rims grew on cores of apreviously existing olivine, and are not the result of
Fig. 4. Ol–Sp crystallization temperatures (a) and oxygen fugacityshown in DNNO units (¼ log fO2 sample � fO2 NNO buffer atP and T ) (b) calculated using the Fe3þ/Fetot of the chromites deter-mined by Mossbauer spectroscopy (Kopylova & McCammon, 2003)and calculated from stoichiometry. The plot shows that the errors inT–fO2 values owing to stoichiometric calculation of Fe3þ/Fetot inchromites are within the uncertainties of the thermobarometer.
FEDORTCHOUK AND CANIL INTENSIVE VARIABLES IN KIMBERLITE MAGMAS
1731
Dow
nloaded from https://academ
ic.oup.com/petrology/article/45/9/1725/1503427 by guest on 08 D
re-equilibration with the groundmass (Fig. 6). TheMg-numbers of the olivine rims from the Leslie, Aaronand Grizzly kimberlites cluster at around 0�92. Rims inthe Torrie kimberlite are more Fe-rich (Mg-number 0�91)
(Fig. 5d) and may indicate different conditions or bulkcomposition of the melt.A very exotic composition of an olivine rim (Mg-
number 0�97) was recorded in grain LS3-k (Fig. 6) fromthe Leslie kimberlite. The very low NiO content andextremely high CaO and MnO contents of this olivineindicate crystallization at a very late stage (Fig. 6; Electro-nic Appendix, http://www.petrology.oupjournals.org) orsome significant change in the melt conditions (e.g.higher fO2).Phenocryst cores and rims have different Ni, Ca and
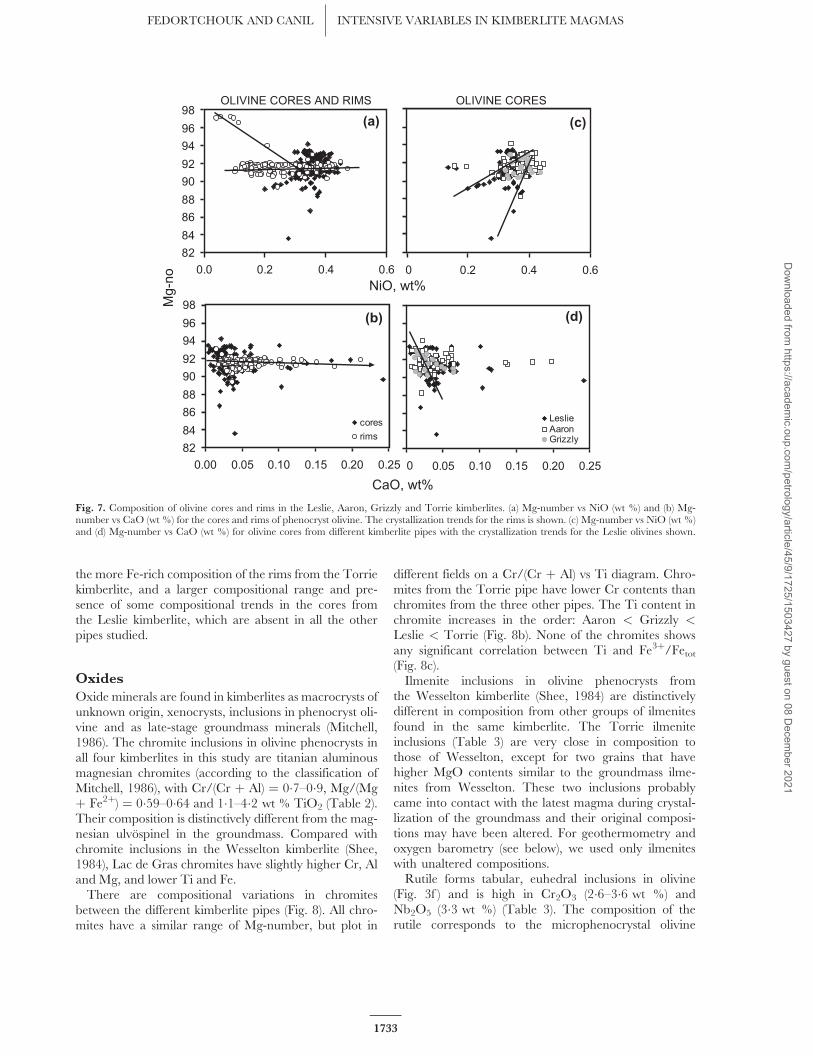
Mn contents (Fig. 7). Cores are higher in NiO than rims(Fig. 7a), as described by Mitchell (1973). In the Lesliekimberlite, core compositions form two trends, with apositive correlation between Mg-number and NiO thatmay indicate their different origin (Fig. 7c). The rims formtwo separate groups in terms of NiO content (Fig. 5b,Fig. 7a). The higher NiO group plots with the cores.The compositions that we used in thermobarometry areall from the low-NiO group. The cores have low CaOcontents, probably reflecting crystallization at high pres-sures (Simkin & Smith, 1970) (Fig. 7b), whereas rims havea larger CaO range. This may suggest a significantdecrease of P (change in magma depth) during crystal-lization of phenocryst rims. The cores from the Lesliekimberlite show a negative trend between CaO and Mg-number, and MnO behaves similarly to CaO.Thus, the composition of olivine phenocryst cores and
rims is uniform in the four pipes. The only exceptions are
Fig. 5. Histograms of olivine phenocryst compositions in the Leslie, Aaron, Grizzly and Torrie kimberlites: (a) distribution of Mg-number [Mg/(Mg þ Fe)] in the olivine cores and rims, (b) distribution of NiO content in the olivine rims, (c) distribution of Mg-number in the olivine cores and(d) in the olivine rims from the different kimberlite pipes.
Fig. 6. Element profiles in zoned olivine phenocrysts illustrating sharpcompositional changes between the rim and core of olivine.
JOURNAL OF PETROLOGY VOLUME 45 NUMBER 9 SEPTEMBER 2004
1732
Dow
nloaded from https://academ
ic.oup.com/petrology/article/45/9/1725/1503427 by guest on 08 D
the more Fe-rich composition of the rims from the Torriekimberlite, and a larger compositional range and pre-sence of some compositional trends in the cores fromthe Leslie kimberlite, which are absent in all the otherpipes studied.
Oxides
Oxide minerals are found in kimberlites as macrocrysts ofunknown origin, xenocrysts, inclusions in phenocryst oli-vine and as late-stage groundmass minerals (Mitchell,1986). The chromite inclusions in olivine phenocrysts inall four kimberlites in this study are titanian aluminousmagnesian chromites (according to the classification ofMitchell, 1986), with Cr/(Cr þ Al) ¼ 0�7–0�9, Mg/(Mgþ Fe2þ) ¼ 0�59–0�64 and 1�1–4�2 wt % TiO2 (Table 2).Their composition is distinctively different from the mag-nesian ulvospinel in the groundmass. Compared withchromite inclusions in the Wesselton kimberlite (Shee,1984), Lac de Gras chromites have slightly higher Cr, Aland Mg, and lower Ti and Fe.There are compositional variations in chromites
between the different kimberlite pipes (Fig. 8). All chro-mites have a similar range of Mg-number, but plot in
different fields on a Cr/(Cr þ Al) vs Ti diagram. Chro-mites from the Torrie pipe have lower Cr contents thanchromites from the three other pipes. The Ti content inchromite increases in the order: Aaron < Grizzly <Leslie < Torrie (Fig. 8b). None of the chromites showsany significant correlation between Ti and Fe3þ/Fetot(Fig. 8c).Ilmenite inclusions in olivine phenocrysts from
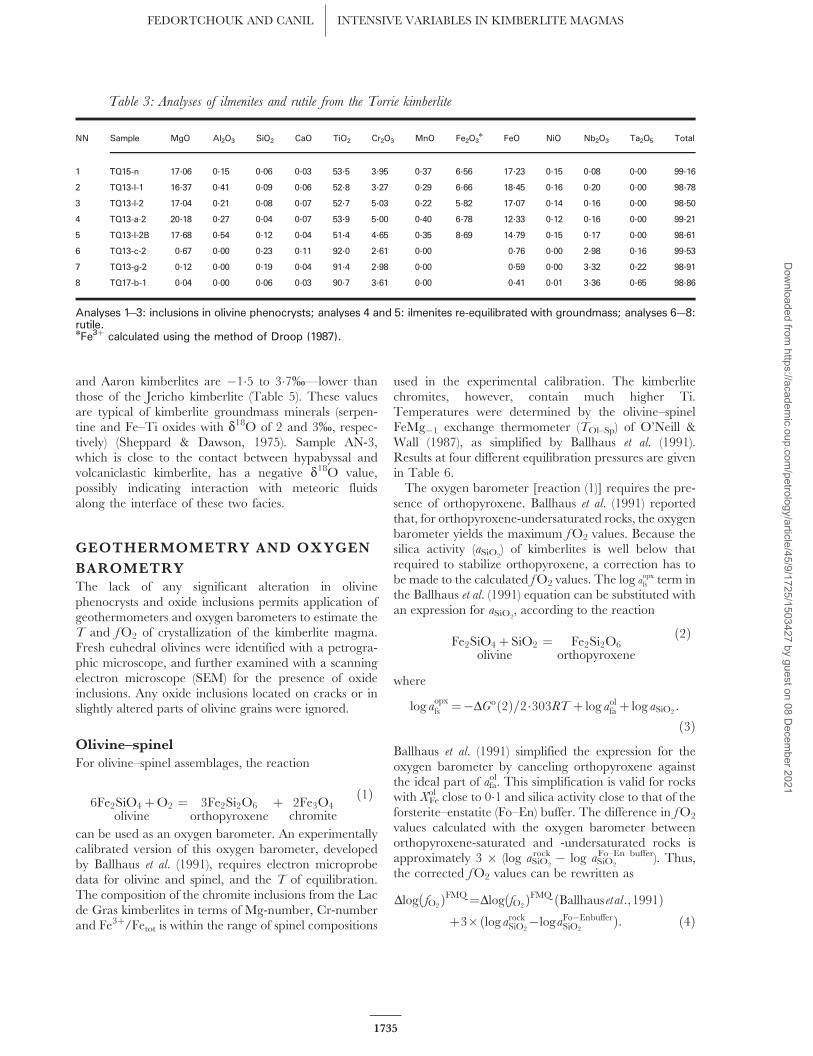
the Wesselton kimberlite (Shee, 1984) are distinctivelydifferent in composition from other groups of ilmenitesfound in the same kimberlite. The Torrie ilmeniteinclusions (Table 3) are very close in composition tothose of Wesselton, except for two grains that havehigher MgO contents similar to the groundmass ilme-nites from Wesselton. These two inclusions probablycame into contact with the latest magma during crystal-lization of the groundmass and their original composi-tions may have been altered. For geothermometry andoxygen barometry (see below), we used only ilmeniteswith unaltered compositions.Rutile forms tabular, euhedral inclusions in olivine
(Fig. 3f ) and is high in Cr2O3 (2�6–3�6 wt %) andNb2O5 (3�3 wt %) (Table 3). The composition of therutile corresponds to the microphenocrystal olivine
Fig. 7. Composition of olivine cores and rims in the Leslie, Aaron, Grizzly and Torrie kimberlites. (a) Mg-number vs NiO (wt %) and (b) Mg-number vs CaO (wt %) for the cores and rims of phenocryst olivine. The crystallization trends for the rims is shown. (c) Mg-number vs NiO (wt %)and (d) Mg-number vs CaO (wt %) for olivine cores from different kimberlite pipes with the crystallization trends for the Leslie olivines shown.
FEDORTCHOUK AND CANIL INTENSIVE VARIABLES IN KIMBERLITE MAGMAS
1733
Dow
nloaded from https://academ
ic.oup.com/petrology/article/45/9/1725/1503427 by guest on 08 D
ecember 2021
paragenesis, according to the classification of Mitchell(1995).
GEOCHEMISTRY
Major element chemistry
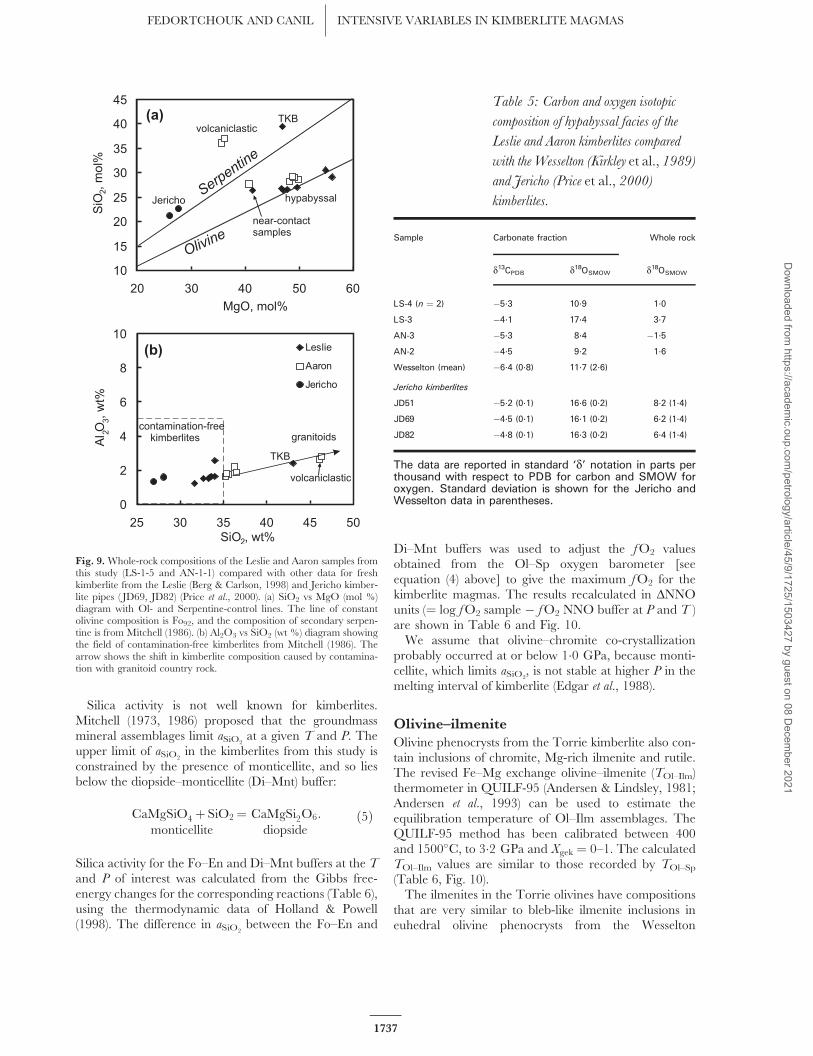
Major element compositions for the Leslie and Aaronsamples from this study are compared with others fromthe literature, in Table 4 and Fig. 9. Compared withprimitive magma compositions from the Jericho
kimberlite, all samples from this study have higherMgO and SiO2 contents (Fig. 9a). All hypabyssal sampleslie on an olivine-control line, whereas near-contact sam-ples (LS-5 and AN-3) are displaced from this trend,towards a serpentine-control line.The covariation of Al2O3 and SiO2 is commonly used
to distinguish contamination in kimberlites (Mitchell,1986). All Leslie hypabyssal samples lie within thecontamination-free field (Fig. 9b), whereas the Aaronhypabyssal samples overlap this field. The Aaron volcani-clastic and Leslie tuffisitic kimberlite breccia sampleslie along a trend consistent with contamination fromgranitoid country rocks (Ward et al., 1995). In allhypabyssal samples, the Si/Mg atomic ratio, which canbe used as an indicator of crustal contamination (Ilupin &Lutz, 1971; Mitchell, 1986), is less than 0�88 (Table 4)—characteristic for uncontaminated rocks. Another mea-sure of crustal contamination and/or weathering is theContamination Index (C.I.) ¼ (SiO2 þ Al2O3 þ Na2)/(MgO þ 2K2O). A value of C.I. of less than 1 corre-sponds to uncontaminated fresh kimberlites (Clement,1982). In volcaniclastic samples from Aaron, Si/Mg isgreater than 0�88 and C.I. greater than 1 (Table 4),indicative of country-rock contamination or alteration,consistent with the Al2O3�SiO2 plot (Fig. 9b). The Leslietuffitic kimberlite breccia (Berg & Carlson, 1998) hashigher C.I. and probably reflects contamination. TheCr and Ni content of hypabyssal samples is higher thanthat in volcaniclastic samples.
Stable isotopes
Stable isotopes were used to estimate the influence ofmeteoric and magmatic fluids on the emplacement andcrystallization of kimberlite magma in the Leslie andAaron pipes. The carbonate fraction of the Leslieand Aaron kimberlites has a mean d13CPDB of �4�9%,which is similar to the isotopic composition of mantle-derived material (e.g. Kirkley et al., 1989) and close tothe Jericho (Price et al., 2000) and Wesselton kimberlite(Kirkley et al., 1989) carbon isotope ratios (Table 5). Thed18OSMOW of the carbonate fraction for samples AN-2, 3and LS-4 has a mean of 9�5%, and falls within the fieldof the Wesselton kimberlite representing primary mantleratios. LS-3 shows enrichment in d18O that is similar tothe Jericho carbonates. The nature of this enrichment isnot well understood, but it is not likely to be a result ofinteraction with meteoric waters (which have negatived18O) or of surface weathering processes (d18O �26�5%, Sheppard & Dawson, 1975). Other possibleexplanations for d18O enrichment in carbonates includeoxygen isotope exchange with magmatic fluid. Extensivecrystallization of groundmass serpentine (d18O � 2%)prior to carbonate crystallization could also shift theisotopic ratios of residual liquids to higher d18O (Kirkleyet al., 1989). The whole-rock d18O values for the Leslie
Fig. 8. Composition of aluminous magnesian chromite inclusions in(cations per formula unit) olivine phenocrysts from the Leslie, Aaron,Grizzly and Torrie kimberlites. (a) Cr/(CrþAl) vs Mg-number; (b) Cr/(CrþAl) vs Ti; (c) Ti vs Fe3þ/Fetotal.
JOURNAL OF PETROLOGY VOLUME 45 NUMBER 9 SEPTEMBER 2004
1734
Dow
nloaded from https://academ
ic.oup.com/petrology/article/45/9/1725/1503427 by guest on 08 D
ecember 2021
and Aaron kimberlites are �1�5 to 3�7%—lower thanthose of the Jericho kimberlite (Table 5). These valuesare typical of kimberlite groundmass minerals (serpen-tine and Fe–Ti oxides with d18O of 2 and 3%, respec-tively) (Sheppard & Dawson, 1975). Sample AN-3,which is close to the contact between hypabyssal andvolcaniclastic kimberlite, has a negative d18O value,possibly indicating interaction with meteoric fluidsalong the interface of these two facies.
GEOTHERMOMETRY AND OXYGEN
BAROMETRY
The lack of any significant alteration in olivinephenocrysts and oxide inclusions permits application ofgeothermometers and oxygen barometers to estimate theT and fO2 of crystallization of the kimberlite magma.Fresh euhedral olivines were identified with a petrogra-phic microscope, and further examined with a scanningelectron microscope (SEM) for the presence of oxideinclusions. Any oxide inclusions located on cracks or inslightly altered parts of olivine grains were ignored.
Olivine–spinel
For olivine–spinel assemblages, the reaction
6Fe2SiO4 þO2
olivine¼ 3Fe2Si2O6
orthopyroxeneþ 2Fe3O4
chromite
ð1Þ
can be used as an oxygen barometer. An experimentallycalibrated version of this oxygen barometer, developedby Ballhaus et al. (1991), requires electron microprobedata for olivine and spinel, and the T of equilibration.The composition of the chromite inclusions from the Lacde Gras kimberlites in terms of Mg-number, Cr-numberand Fe3þ/Fetot is within the range of spinel compositions
used in the experimental calibration. The kimberlitechromites, however, contain much higher Ti.Temperatures were determined by the olivine–spinelFeMg�1 exchange thermometer (TOl–Sp) of O’Neill &Wall (1987), as simplified by Ballhaus et al. (1991).Results at four different equilibration pressures are givenin Table 6.The oxygen barometer [reaction (1)] requires the pre-
sence of orthopyroxene. Ballhaus et al. (1991) reportedthat, for orthopyroxene-undersaturated rocks, the oxygenbarometer yields the maximum fO2 values. Because thesilica activity (aSiO2
) of kimberlites is well below thatrequired to stabilize orthopyroxene, a correction has tobe made to the calculated fO2 values. The log a
opxfs term in
the Ballhaus et al. (1991) equation can be substituted withan expression for aSiO2
Ballhaus et al. (1991) simplified the expression for theoxygen barometer by canceling orthopyroxene againstthe ideal part of aolfa. This simplification is valid for rockswith Xol
Fe close to 0�1 and silica activity close to that of theforsterite–enstatite (Fo–En) buffer. The difference in fO2
values calculated with the oxygen barometer betweenorthopyroxene-saturated and -undersaturated rocks isapproximately 3 � (log aSiO2
rock � log aSiO2
Fo–En buffer). Thus,the corrected fO2 values can be rewritten as
Dlogð fO2ÞFMQ¼DlogðfO2
ÞFMQ ðBallhaus et al:;1991Þþ3�ðlog arockSiO2
�logaFo�EnbufferSiO2
Þ: ð4Þ
Table 3: Analyses of ilmenites and rutile from the Torrie kimberlite
NN Sample MgO Al2O3 SiO2 CaO TiO2 Cr2O3 MnO Fe2O3* FeO NiO Nb2O3 Ta2O5 Total
Analyses 1—3: inclusions in olivine phenocrysts; analyses 4 and 5: ilmenites re-equilibrated with groundmass; analyses 6—8:rutile.*Fe3þ calculated using the method of Droop (1987).
FEDORTCHOUK AND CANIL INTENSIVE VARIABLES IN KIMBERLITE MAGMAS
1735
Dow
nloaded from https://academ
ic.oup.com/petrology/article/45/9/1725/1503427 by guest on 08 D
JOURNAL OF PETROLOGY VOLUME 45 NUMBER 9 SEPTEMBER 2004
1736
Dow
nloaded from https://academ
ic.oup.com/petrology/article/45/9/1725/1503427 by guest on 08 D
ecember 2021
Silica activity is not well known for kimberlites.Mitchell (1973, 1986) proposed that the groundmassmineral assemblages limit aSiO2
at a given T and P. Theupper limit of aSiO2
in the kimberlites from this study isconstrained by the presence of monticellite, and so liesbelow the diopside–monticellite (Di–Mnt) buffer:
CaMgSiO4 þ SiO2 ¼ CaMgSi2O6:monticellite diopside
ð5Þ
Silica activity for the Fo–En and Di–Mnt buffers at the Tand P of interest was calculated from the Gibbs free-energy changes for the corresponding reactions (Table 6),using the thermodynamic data of Holland & Powell(1998). The difference in aSiO2
between the Fo–En and
Di–Mnt buffers was used to adjust the fO2 valuesobtained from the Ol–Sp oxygen barometer [seeequation (4) above] to give the maximum fO2 for thekimberlite magmas. The results recalculated in DNNOunits (¼ log fO2 sample � fO2 NNO buffer at P and T )are shown in Table 6 and Fig. 10.We assume that olivine–chromite co-crystallization
probably occurred at or below 1�0 GPa, because monti-cellite, which limits aSiO2
, is not stable at higher P in themelting interval of kimberlite (Edgar et al., 1988).
Olivine–ilmenite
Olivine phenocrysts from the Torrie kimberlite also con-tain inclusions of chromite, Mg-rich ilmenite and rutile.The revised Fe–Mg exchange olivine–ilmenite (TOl–Ilm)thermometer in QUILF-95 (Andersen & Lindsley, 1981;Andersen et al., 1993) can be used to estimate theequilibration temperature of Ol–Ilm assemblages. TheQUILF-95 method has been calibrated between 400and 1500�C, to 3�2 GPa and Xgek ¼ 0–1. The calculatedTOl–Ilm values are similar to those recorded by TOl–Sp
(Table 6, Fig. 10).The ilmenites in the Torrie olivines have compositions
that are very similar to bleb-like ilmenite inclusions ineuhedral olivine phenocrysts from the Wesselton
Fig. 9. Whole-rock compositions of the Leslie and Aaron samples fromthis study (LS-1-5 and AN-1-1) compared with other data for freshkimberlite from the Leslie (Berg & Carlson, 1998) and Jericho kimber-lite pipes ( JD69, JD82) (Price et al., 2000). (a) SiO2 vs MgO (mol %)diagram with Ol- and Serpentine-control lines. The line of constantolivine composition is Fo92, and the composition of secondary serpen-tine is from Mitchell (1986). (b) Al2O3 vs SiO2 (wt %) diagram showingthe field of contamination-free kimberlites from Mitchell (1986). Thearrow shows the shift in kimberlite composition caused by contamina-tion with granitoid country rock.
Table 5: Carbon and oxygen isotopic
composition of hypabyssal facies of the
Leslie and Aaron kimberlites compared
with theWesselton (Kirkley et al., 1989)
and Jericho (Price et al., 2000)
kimberlites.
Sample Carbonate fraction Whole rock
d13CPDB d18OSMOW d18OSMOW
LS-4 (n ¼ 2) �5.3 10.9 1.0
LS-3 �4.1 17.4 3.7
AN-3 �5.3 8.4 �1.5
AN-2 �4.5 9.2 1.6
Wesselton (mean) �6.4 (0.8) 11.7 (2.6)
Jericho kimberlites
JD51 �5.2 (0.1) 16.6 (0.2) 8.2 (1.4)
JD69 �4.5 (0.1) 16.1 (0.2) 6.2 (1.4)
JD82 �4.8 (0.1) 16.3 (0.2) 6.4 (1.4)
The data are reported in standard ‘d’ notation in parts perthousand with respect to PDB for carbon and SMOW foroxygen. Standard deviation is shown for the Jericho andWesselton data in parentheses.
FEDORTCHOUK AND CANIL INTENSIVE VARIABLES IN KIMBERLITE MAGMAS
1737
Dow
nloaded from https://academ
ic.oup.com/petrology/article/45/9/1725/1503427 by guest on 08 D
ecember 2021
kimberlites (Shee, 1984), and are distinctively differentfrom macrocryst and groundmass ilmenites. Some of theTorrie ilmenite inclusions contain >18 wt % MgO andcorrespond to groundmass ilmenites (Shee, 1984), prob-ably resulting from re-equilibration with the groundmass.In the QUILF-95 calculations, these ilmenites show anabsence of equilibrium and were not used in the T–fO2
calculations.
Ilmenite–rutile
Coexisting ilmenite and rutile inclusions in the Torrieolivine phenocrysts serve as an oxygen barometer,based on the reaction
2Fe2O3
ilmeniteþ 4TiO2
rutile¼ 4FeTiO3 þO2
ilmeniteð6Þ
(Zhao et al., 1999). We calculated activities aIlmFeTiO3and
aIlmFe2O3from Ghiorso & Sack (1995) for each ilmenite
inclusion, using TOl–Ilm at 1�0 GPa. The aRutTiO2is the mole
fraction of TiO2 in rutile. The ilmenite compositions on
which the rutile–ilmenite barometer is calibrated aremore Fe-rich than the Torrie ilmenites. Nevertheless, theestimated fO2 values are similar to those calculated fromthe Ol–Sp oxygen barometer when uncorrected for thelower aSiO2
in kimberlites (Table 6, Fig. 10).
DISCUSSION
Crystallization temperatures and redoxregime in kimberlite magma
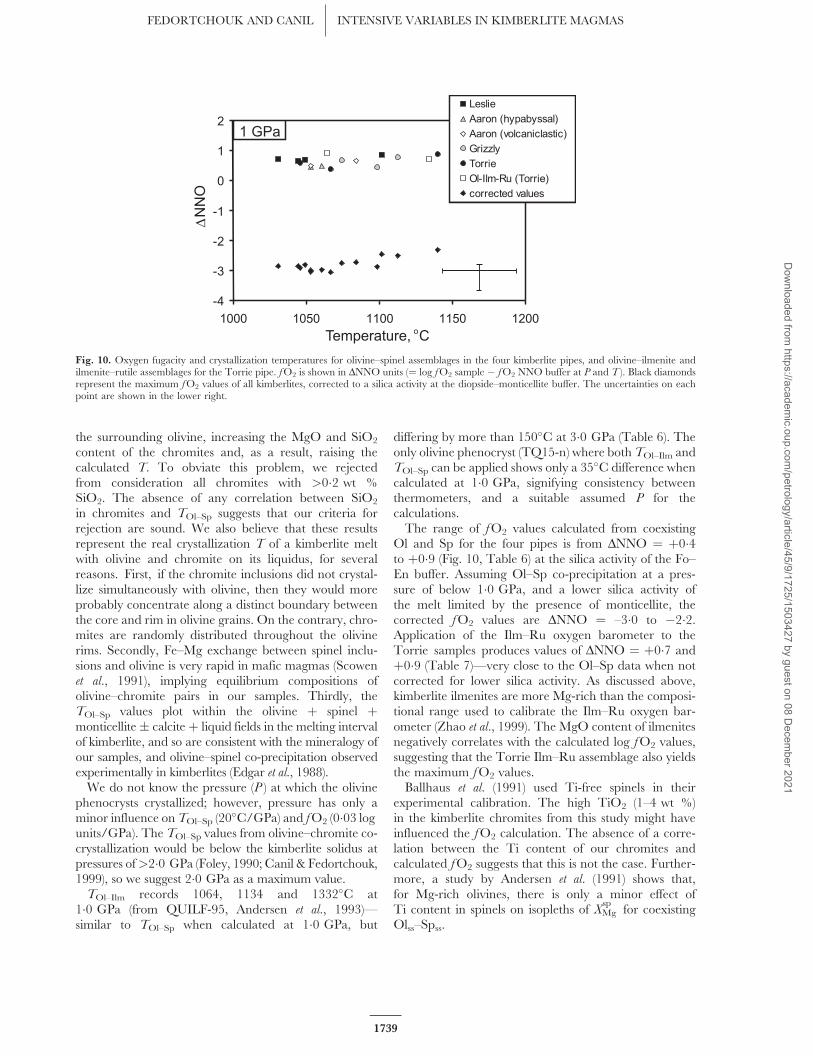
The values of TOl–Sp calculated at 1�0 GPa for olivinerims in the Leslie, Aaron, Grizzly and Torrie kimberlitesare between 1030 and 1170�C, with a mean valueof 1080�C (Fig. 10). The whole range of calculatedTOl–Sp for the four pipes is within the uncertainty of�50�C. As expected, TOl–Sp correlates positively withthe Mg content of the chromites, but such a correla-tion can also be an artefact of analyzing small chro-mite inclusions (5–10 mm) in an Mg-rich host phasesuch as olivine. The potential exists for excitation of
Table 6: Equilibrium temperatures and oxygen fugacities calculated for Leslie, Aaron, Grizzly and
Torrie kimberlites by Ol–Sp, Ol–Ilm and Ru–Ilm thermobarometery
aTemperatures calculated from FeMg—1 Ol—Sp thermometer of O’Neill & Wall (1987) and Ballhaus et al. (1991).bOxygen fugacities at 1 GPa calculated relative to FMQ buffer from the oxygen barometer by Ballhaus et al. (1991).cSilica activity of diopside—monticellite (Di—Mont) and enstatite—forsterite (En—Fo) buffers calculated usingthermodynamic data of Holland & Powell (1998).dCorrected maximum values of oxygen fugacities of kimberlites calculated for silica activity of diopside—monticellite buffer.eTemperatures calculated for olivine—ilmenite assemblage by QUILF-95.fOxygen fugacities at 1 GPa calculated from equation (6) Zhao et al. (1999).
JOURNAL OF PETROLOGY VOLUME 45 NUMBER 9 SEPTEMBER 2004
1738
Dow
nloaded from https://academ
ic.oup.com/petrology/article/45/9/1725/1503427 by guest on 08 D
ecember 2021
the surrounding olivine, increasing the MgO and SiO2
content of the chromites and, as a result, raising thecalculated T. To obviate this problem, we rejectedfrom consideration all chromites with >0�2 wt %SiO2. The absence of any correlation between SiO2
in chromites and TOl–Sp suggests that our criteria forrejection are sound. We also believe that these resultsrepresent the real crystallization T of a kimberlite meltwith olivine and chromite on its liquidus, for severalreasons. First, if the chromite inclusions did not crystal-lize simultaneously with olivine, then they would moreprobably concentrate along a distinct boundary betweenthe core and rim in olivine grains. On the contrary, chro-mites are randomly distributed throughout the olivinerims. Secondly, Fe–Mg exchange between spinel inclu-sions and olivine is very rapid in mafic magmas (Scowenet al., 1991), implying equilibrium compositions ofolivine–chromite pairs in our samples. Thirdly, theTOl–Sp values plot within the olivine þ spinel þmonticellite� calciteþ liquid fields in the melting intervalof kimberlite, and so are consistent with the mineralogy ofour samples, and olivine–spinel co-precipitation observedexperimentally in kimberlites (Edgar et al., 1988).We do not know the pressure (P ) at which the olivine
phenocrysts crystallized; however, pressure has only aminor influence on TOl–Sp (20
�C/GPa) and fO2 (0�03 logunits/GPa). The TOl–Sp values from olivine–chromite co-crystallization would be below the kimberlite solidus atpressures of>2�0 GPa (Foley, 1990; Canil & Fedortchouk,1999), so we suggest 2�0 GPa as a maximum value.TOl–Ilm records 1064, 1134 and 1332�C at
1�0 GPa (from QUILF-95, Andersen et al., 1993)—similar to TOl–Sp when calculated at 1�0 GPa, but
differing by more than 150�C at 3�0 GPa (Table 6). Theonly olivine phenocryst (TQ15-n) where both TOl–Ilm andTOl–Sp can be applied shows only a 35
�C difference whencalculated at 1�0 GPa, signifying consistency betweenthermometers, and a suitable assumed P for thecalculations.The range of fO2 values calculated from coexisting
Ol and Sp for the four pipes is from DNNO ¼ þ0�4to þ0�9 (Fig. 10, Table 6) at the silica activity of the Fo–En buffer. Assuming Ol–Sp co-precipitation at a pres-sure of below 1�0 GPa, and a lower silica activity ofthe melt limited by the presence of monticellite, thecorrected fO2 values are DNNO ¼ –3�0 to �2�2.Application of the Ilm–Ru oxygen barometer to theTorrie samples produces values of DNNO ¼ þ0�7 andþ0�9 (Table 7)—very close to the Ol–Sp data when notcorrected for lower silica activity. As discussed above,kimberlite ilmenites are more Mg-rich than the composi-tional range used to calibrate the Ilm–Ru oxygen bar-ometer (Zhao et al., 1999). The MgO content of ilmenitesnegatively correlates with the calculated log fO2 values,suggesting that the Torrie Ilm–Ru assemblage also yieldsthe maximum fO2 values.Ballhaus et al. (1991) used Ti-free spinels in their
experimental calibration. The high TiO2 (1–4 wt %)in the kimberlite chromites from this study might haveinfluenced the fO2 calculation. The absence of a corre-lation between the Ti content of our chromites andcalculated fO2 suggests that this is not the case. Further-more, a study by Andersen et al. (1991) shows that,for Mg-rich olivines, there is only a minor effect ofTi content in spinels on isopleths of XMg
spfor coexisting
Olss–Spss.
Fig. 10. Oxygen fugacity and crystallization temperatures for olivine–spinel assemblages in the four kimberlite pipes, and olivine–ilmenite andilmenite–rutile assemblages for the Torrie pipe. fO2 is shown in DNNO units (¼ log fO2 sample � fO2 NNO buffer at P and T ). Black diamondsrepresent the maximum fO2 values of all kimberlites, corrected to a silica activity at the diopside–monticellite buffer. The uncertainties on eachpoint are shown in the lower right.
FEDORTCHOUK AND CANIL INTENSIVE VARIABLES IN KIMBERLITE MAGMAS
1739
Dow
nloaded from https://academ
ic.oup.com/petrology/article/45/9/1725/1503427 by guest on 08 D
ecember 2021
Figure 11a shows that the Ol–Sp assemblages in themargins of olivine phenocrysts record fO2 values similarto those estimated by Mitchell (1973, 1986) for olivineand magnetite in the groundmass of kimberlite. Thissuggests that during kimberlite crystallization from 1100(Ol–Sp phenocrysts) to 600�C (groundmass), the fO2 ofthe melt evolved parallel to the NNO buffer.
Estimation of kimberlite melt compositionand amount of accumulated olivine
Olivine–liquid equilibria at known crystallizationtemperatures in our samples can provide constraints onkimberlite melt compositions along their liquid line ofdescent, and on the proportions of liquid and olivinefrom different sources (xenocrysts and phenocrysts) dur-ing crystallization. The partitioning of MgO and FeObetween olivine and melt is a function of T, P and meltcomposition (e.g. Langmuir et al., 1992). Using the com-position of olivine phenocrysts in our kimberlites andtheir crystallization temperatures, we can determine theMgO and FeO content in the kimberlite liquid that wasin equilibrium with these phenocrysts. Different expres-sions for this relationship have been proposed (Roeder &
Emslie, 1970; Ford et al., 1983; Langmuir et al., 1992;Beattie, 1994; Sugawara, 2000). The effect of alkalis inthe melt is incorporated in the expression of Langmuiret al. (1992):
LnðX olMgO=X
liqMgOÞ¼ 6921=T þ 0�034Na
þ 0�63Kþ 0�1154P � 3�27ð7Þ
where T is in Kelvin, P is in kilobars and compositionalterms are in cation mole percent. The calculated MgOcontents (mol %) for the Leslie and Aaron kimberliteliquids in equilibrium with the olivine phenocrysts areshown in Fig. 12. Because of the presence of H2O andCO2, kimberlites may crystallize Mg-rich olivines at a T
that is much lower than that of other mantle-derivedmagmas, resulting in an underestimation of the MgOcontent in the liquid in equilibrium with olivine.Therefore, the values shown in Fig. 12 are lower limitsfor kimberlite melt composition.Some constraints can be placed on the proportions of
liquid and olivine (xenocrysts and phenocrysts) duringcrystallization of the olivine phenocryst rims. Mass-balance of bulk-rock MgO and FeO of the unalteredkimberlite samples (LS-1, 2, 3, 4 and AN-1, 2, 6, 7)
Fig. 11. Stability fields of graphite (G) and CO2 in log fO2–T space,calculated at (a) 0�1 GPa and (b) 1 GPa compared with T–fO2 datafrom the Lac de Gras kimberlites, recalculated at these pressures andcorrected for silica activity. Positions of the NNO (Ballhaus et al., 1991)and D/GCO buffers (Frost & Wood, 1997) are shown for comparison.T–fO2 estimates for kimberlite groundmass, calculated for olivine–magnetite assemblages, from Mitchell (1986) are plotted for comparison.
Table 7: Proportions of magma
constituents and melt composition
during crystallization of an
Ol–Sp assemblage calculated for the
composition of the primary kimberlite
melt corresponding to the aphanitic
kimberlites from the Jericho pipe
(NWT,Canada,Price et al.,2000)
and Wesselton mine, South Africa
(Wesselton Edgar et al., 1988)
Primary melt J-69 J-82 W
Magma composition during Ol rim crystallization
Mantle olivine 75 73 63
Phenocryst olivine 10 10 10
Melt 15 16 27
Melt equilibrated with Ol—Sp assemblage
MgO 12.2 15.7 25.5
FeO 3.7 4.8 7.7
Product of Ol fractional crystallization
Ol phenocrysts 41 37 26
Melt 59 63 74
JOURNAL OF PETROLOGY VOLUME 45 NUMBER 9 SEPTEMBER 2004
1740
Dow
nloaded from https://academ
ic.oup.com/petrology/article/45/9/1725/1503427 by guest on 08 D
ecember 2021
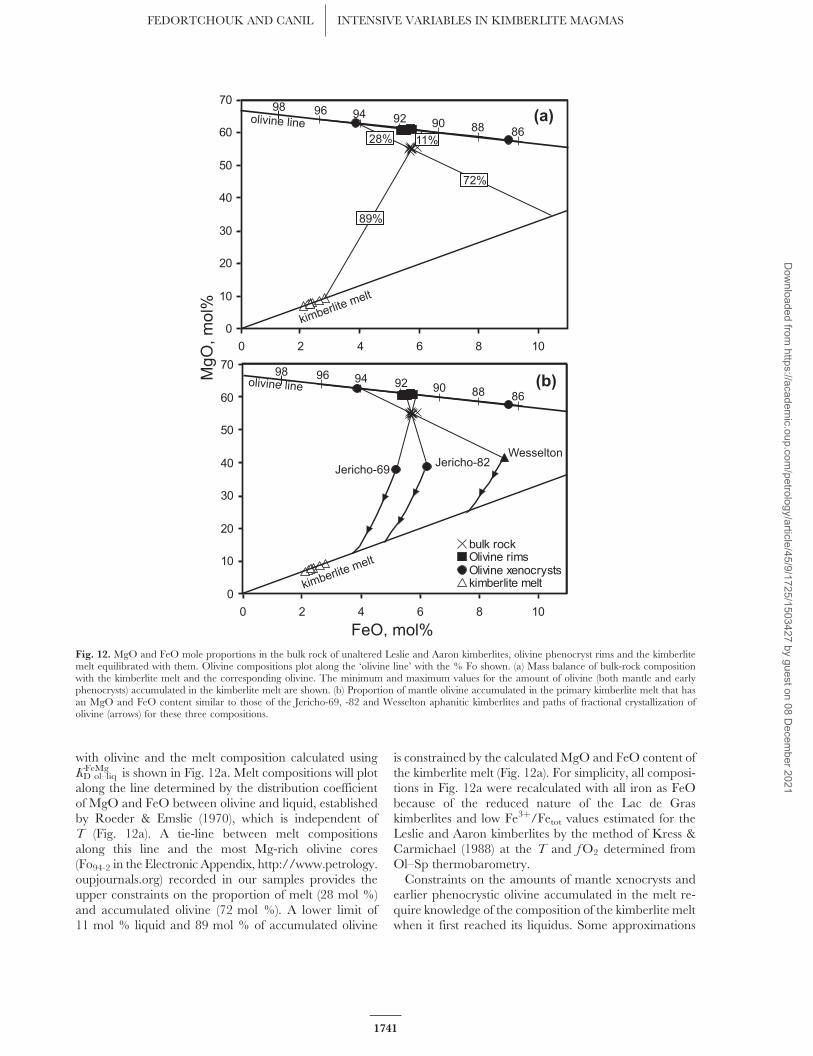
with olivine and the melt composition calculated usingKD ol–liqFeMg is shown in Fig. 12a. Melt compositions will plot
along the line determined by the distribution coefficientof MgO and FeO between olivine and liquid, establishedby Roeder & Emslie (1970), which is independent ofT (Fig. 12a). A tie-line between melt compositionsalong this line and the most Mg-rich olivine cores(Fo94�2 in the Electronic Appendix, http://www.petrology.oupjournals.org) recorded in our samples provides theupper constraints on the proportion of melt (28 mol %)and accumulated olivine (72 mol %). A lower limit of11 mol % liquid and 89 mol % of accumulated olivine
is constrained by the calculated MgO and FeO content ofthe kimberlite melt (Fig. 12a). For simplicity, all composi-tions in Fig. 12a were recalculated with all iron as FeObecause of the reduced nature of the Lac de Graskimberlites and low Fe3þ/Fetot values estimated for theLeslie and Aaron kimberlites by the method of Kress &Carmichael (1988) at the T and fO2 determined fromOl–Sp thermobarometry.Constraints on the amounts of mantle xenocrysts and
earlier phenocrystic olivine accumulated in the melt re-quire knowledge of the composition of the kimberlite meltwhen it first reached its liquidus. Some approximations
Fig. 12. MgO and FeO mole proportions in the bulk rock of unaltered Leslie and Aaron kimberlites, olivine phenocryst rims and the kimberlitemelt equilibrated with them. Olivine compositions plot along the ‘olivine line’ with the % Fo shown. (a) Mass balance of bulk-rock compositionwith the kimberlite melt and the corresponding olivine. The minimum and maximum values for the amount of olivine (both mantle and earlyphenocrysts) accumulated in the kimberlite melt are shown. (b) Proportion of mantle olivine accumulated in the primary kimberlite melt that hasan MgO and FeO content similar to those of the Jericho-69, -82 and Wesselton aphanitic kimberlites and paths of fractional crystallization ofolivine (arrows) for these three compositions.
FEDORTCHOUK AND CANIL INTENSIVE VARIABLES IN KIMBERLITE MAGMAS
1741
Dow
nloaded from https://academ
ic.oup.com/petrology/article/45/9/1725/1503427 by guest on 08 D
for the primary kimberlite melt are aphanitic kimberlitesfrom the Wesselton mine (South Africa) (Edgar et al.,1988) and from the Jericho pipe (Northwest Territories,Canada) (Price et al., 2000). The MgO/FeO ratios of theJericho and Wesselton primary kimberlite liquids evolveduring olivine fractional crystallization along the lines(indicated by arrows) shown in Fig. 12b and reach theMgO/FeO ratio of the kimberlite melts equilibrated withthe Ol–Sp assemblage in this study after crystallization of41 and 37 mol % ( Jericho), and 26 mol % (Wesselton) ofolivine (Table 7).The tie-lines between the compositions of the Jericho
and Wesselton aphanitic kimberlites and mantle olivinegive the proportion of xenocrysts accumulated in thesemelts (Fig. 12b). The amount of earlier generations ofphenocrysts present in the melt by the time of Ol–Sp co-precipitation in rims can be then calculated (Table 7). Forall three inferred primary melt compositions, the moleproportion of olivine phenocrysts present in the kimberlitemelt during Ol–Sp crystallization is 10 mol % (Table 7),regardless of the primary composition of the kimberlitemelt, which is unknown. Kimberlites in this study containbetween 11 and 28 mol % liquid, 10 mol % of the earliergenerations of phenocrysts, and 62–79 mol % of accu-mulated mantle olivine.
Application to diamond dissolution
Diamonds in transit to the Earth’s surface in kimberlitecan undergo transformation into graphite, or oxidationinto CO2 or carbonate. These processes are widelyobserved in natural diamonds as resorption, resulting inrounded crystals, etching or frosting, and can lead to thecomplete destruction of diamond, with significantdecreases in the economic grade of a kimberlite pipe. Itis not well understood whether the resorption of dia-monds occurs in the mantle during kimberlite accumula-tion and ascent to shallower levels (Harris, 1987; Tayloret al., 1995), or during emplacement in kimberlite magma(Robinson et al., 1989). There is also the potential forreaction of diamonds with heated meteoric waters duringsurface eruptions (Sheppard & Dawson, 1975).High-temperature kimberlite melt is a very reactive
medium for diamonds and can possibly cause resorption.The degree and kinetics of diamond dissolution are con-trolled by T, fO2 and fCO2 (e.g. Arima, 1998). Assumingthat Ol–Sp co-crystallization occurred below 1�0 GPa,the maximum fO2 values of kimberlite magmas (at asilica activity of the Di–Mnt buffer) are in the graphitestability field very close to the position of the D/GCObuffer (Fig. 11). With a decrease in P, fO2 values shift intothe field of CO2 stability. Thus, any diamonds liberatedfrom xenoliths at depth would have experienced dissolu-tion in the graphite stability field, whereas those cominginto contact with the magma at the latest stages of
eruption might have been resorbed in the CO2 stabilityfield. Diamond dissolution experiments in silicate melt atconditions within the graphite stability field (Sonin et al.,1997; Arima, 1998) produced resorption features that aresimilar to those recorded in natural diamonds, in agree-ment with our fO2 data.This study allows us to evaluate the possible T–P–fO2
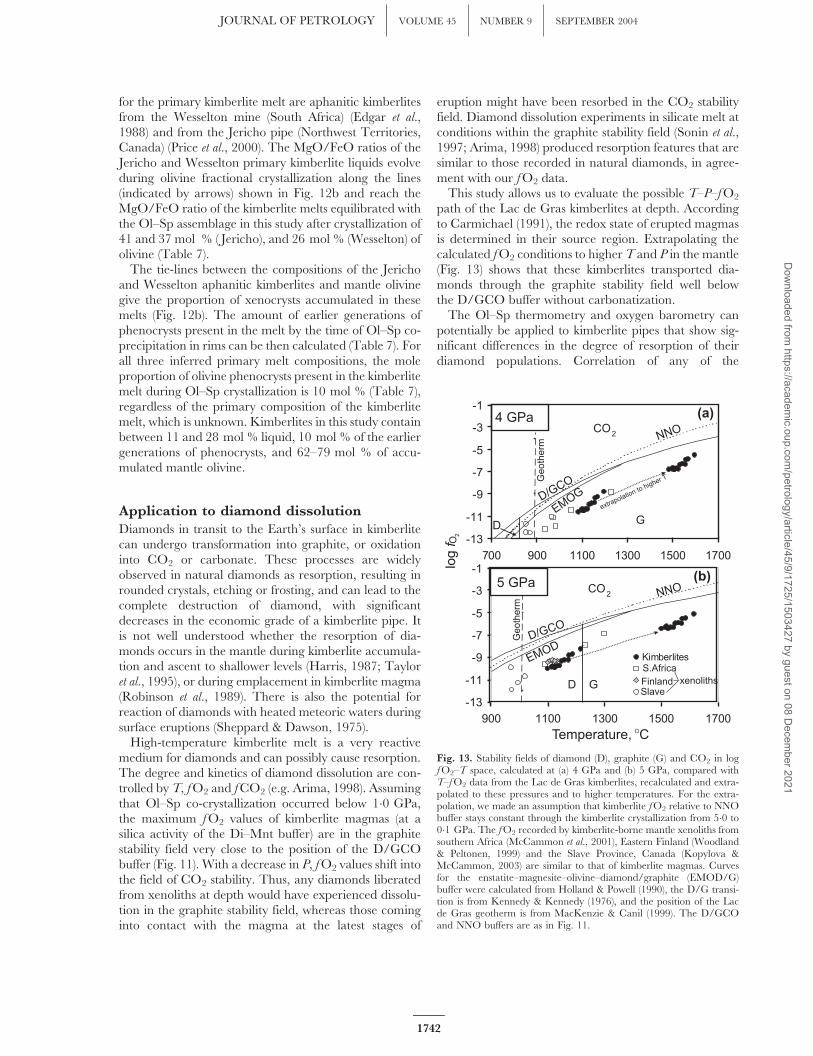
path of the Lac de Gras kimberlites at depth. Accordingto Carmichael (1991), the redox state of erupted magmasis determined in their source region. Extrapolating thecalculated fO2 conditions to higher T and P in the mantle(Fig. 13) shows that these kimberlites transported dia-monds through the graphite stability field well belowthe D/GCO buffer without carbonatization.The Ol–Sp thermometry and oxygen barometry can
potentially be applied to kimberlite pipes that show sig-nificant differences in the degree of resorption of theirdiamond populations. Correlation of any of the
Fig. 13. Stability fields of diamond (D), graphite (G) and CO2 in logfO2–T space, calculated at (a) 4 GPa and (b) 5 GPa, compared withT–fO2 data from the Lac de Gras kimberlites, recalculated and extra-polated to these pressures and to higher temperatures. For the extra-polation, we made an assumption that kimberlite fO2 relative to NNObuffer stays constant through the kimberlite crystallization from 5�0 to0�1 GPa. The fO2 recorded by kimberlite-borne mantle xenoliths fromsouthern Africa (McCammon et al., 2001), Eastern Finland (Woodland& Peltonen, 1999) and the Slave Province, Canada (Kopylova &McCammon, 2003) are similar to that of kimberlite magmas. Curvesfor the enstatite–magnesite–olivine–diamond/graphite (EMOD/G)buffer were calculated from Holland & Powell (1990), the D/G transi-tion is from Kennedy & Kennedy (1976), and the position of the Lacde Gras geotherm is from MacKenzie & Canil (1999). The D/GCOand NNO buffers are as in Fig. 11.
JOURNAL OF PETROLOGY VOLUME 45 NUMBER 9 SEPTEMBER 2004
1742
Dow
nloaded from https://academ
ic.oup.com/petrology/article/45/9/1725/1503427 by guest on 08 D
ecember 2021
dissolution features in diamonds with the T and fO2 ofkimberlite magmas may help to better understand thenature of the resorption process, or possibly to predict thedegree of diamond preservation in a particular pipe.
CONCLUSIONS
Inclusions of chromite are common in the rims of olivinephenocrysts in hypabyssal and volcaniclastic kimberlitesfrom the Leslie, Aaron, Grizzly and Torrie pipes in theLac de Gras area and can be used for estimation of T andfO2 in kimberlite magmas.TOl–Sp shows that the rims of olivine phenocrysts crys-
tallized at 1030�C (Leslie) to 1170�C (Torrie) at a max-imum fO2 of DNNO �3�0 to �2�2 (calculated at1�0 GPa and silica activity of the melt limited by thepresence of monticellite).Mass balance of the melt equilibrated with olivine
phenocryst rims and the bulk-rock suggests crystallizationof the olivine–chromite assemblage from a magma thatcontained between 11 and 28 mol % of liquid, 10 mol %of earlier-precipitated olivine phenocrysts and between62 and 79 mol % of mantle xenocryst olivine.The T–fO2 values obtained for four Lac de Gras
kimberlites show that the diamonds entrained in thesekimberlites ascended in the stability fields of graphite. Atthe latest stages of eruption (below 0�1 GPa), movementinto the CO2 stability field is possible.
ACKNOWLEDGEMENTS
We sincerely thank Jon Carlson and BHP BillitonDiamonds Inc. for access to drill-core, for support andsuggestions during sampling and permission to publish.L. Shi and M. Raudsepp provided assistance with EMPanalyses at U of A and UBC, respectively. M. Raudseppis thanked for valuable suggestions during microprobework. We especially thank M. Kopylova andC. McCammon for providing us with the chromite grainswith Fe3þ measured by Mossbauer spectroscopy. Themanuscript has been improved by the review ofN. Green, A. Woodland and J. K. Russell. This researchwas supported by a UVic graduate scholarship to Y.F.and NSERC of Canada Discovery grant to D.C.
SUPPLEMENTARY DATA
Supplementary data for this paper are available onJournal of Petrology online.
REFERENCES
Andersen, D. J. & Lindsley, D. H. (1981). A valid Margules formulation
for an asymmetric ternary solution: revision of the olivine–ilmenite
thermometer, with applications. Geochimica et Cosmochimica Acta 45,
847–853.
Andersen, D. J., Bishop, F. C. & Lindsley, D. H. (1991). Internally
consistent solution models for Fe–Mg–Mn–Ti oxides: Fe–Mg–Ti
oxides and olivine. American Mineralogist 76, 427–444.
Andersen, D. J., Lindsley, D. H. & Davidson, P. M. (1993). QUILF: a
PASCAL program to assess equilibria among Fe–Mg–Ti oxides,
pyroxenes, olivine, and quartz. Computers in Geosciences 19, 1333–1350.
Arima, M. (1998). Experimental study of growth and resorption of
diamond in kimberlitic melts at high pressures and temperatures. In:
7th International Kimberlite Conference, Cape Town, pp. 32–34.
Ballhaus, C., Berry, R. F. & Green, D. H. (1991). High pressure
experimental calibration of the olivine–orthopyroxene–spinel oxy-
gen geobarometer: implications for the oxidation state of the upper
mantle. Contributions to Mineralogy and Petrology 107, 27–40.
Beattie, P. (1994). Systematics and energetics of trace element
partitioning between olivine and silicate melts: implications for the
nature of mineral/melt partitioning. Chemical Geology 117, 57–71.
Berg, G. W. & Carlson, J. A. (1998). The Leslie kimberlite pipe of Lac
de Gras, Northwest Territories, Canada. In: 7th International Kimberlite
Conference, Cape Town, pp. 81–83.
Boyd, F. R. & Canil, D. (1997). Peridotite xenoliths from the Slave
Craton, Northwest Territories. In: Seventh Annual V. M. Goldschmidt
Conference. Houston, TX: Lunar and Planetary Institute, pp. 34–35.
Canil, D. & Fedortchouk, Y. (1999). Garnet dissolution and the emplace-
ment of kimberlites. Earth and Planetary Science Letters 167, 227–237.
Canil, D. & Scarfe, C. M. (1990). Phase relations in peridotite þ CO2
systems to 12 GPa: implications for the origin of kimberlite and
carbonate stability in the Earth’s upper mantle. Journal of Geophysical
Research 95, 15805–15816.
Carmichael, I. S. E. (1991). The redox states of basic and silicic
magmas: a reflection of their source regions? Contributions to Mineralogy
and Petrology 106, 129–141.
Clement, C. R. (1982). A comparative geological study of some major
kimberlite pipes in the Northern Cape and Orange Free State. Ph.D.
thesis, University of Cape Town.
Clayton, R. N. & Toshiko, K. M. (1983). Oxygen isotopes in eucrites,
shergottites, nakhlites, and chassignites. Earth and Planetary Science
Letters 62, 1–6.
Creaser, R., Gr€uutter, H., Carlson, J. & Crawford, B. (2003).
Macrocrystal phlogopite Rb–Sr dates for the Ekati property
kimberlites, Slave Province, Canada: evidence for multiple intrusive
episodes in the Paleocene and Eocene. In: 8th International Kimberlite
Conference, Victoria.
Dalton, J. A. & Presnall, D. C. (1998). The continuum of primary
carbonatitic–kimberlitic melt compositions in equilibrium with
lherzolite: data from the system CaO–MgO–Al2O3–SiO2–CO2 at
6 GPa. Journal of Petrology 39(11 & 12), 1953–1964.
Davis, W. J. & Kjarsgaard, B. A. (1997). A Rb–Sr isochron age
for kimberlite from the recently discovered Lac de Gras
Field, Slave Province, Northwest Canada. Journal of Geology 105,
503–509.
Droop, G. T. R. (1987). A general equation for estimating Fe3þ
concentrations in ferromagnesian silicates and oxides from micro-
probe analyses, using stoichiometric criteria. Mineralogical Magazine
51, 431–435.
Edgar, A. D., Arima, M., Baldwin, D. K., Bell, D. R., Shee, S. R.,
Skinner, E. M. W. & Walker, E. C. (1988). High pressure–high
temperature melting experiments on a SiO2-poor, CaO-rich
aphanitic kimberlite from the Wesselton mine, Kimberley, South
Africa. American Mineralogist 73, 524–533.
Edgar, A. D. & Charbonneau, H. E. (1993). Melting experiments on a
SiO2-poor, CaO-rich aphanitic kimberlite from 5–10 GPa and their
bearing on source of kimberlite magmas. American Mineralogist 78,
132–142.
FEDORTCHOUK AND CANIL INTENSIVE VARIABLES IN KIMBERLITE MAGMAS
1743
Dow
nloaded from https://academ
ic.oup.com/petrology/article/45/9/1725/1503427 by guest on 08 D
ecember 2021
Fipke, C. E., Gurney, J. J. & Moore, R. O. (1995). Diamond
exploration techniques emphasising indicator mineral geochemistry
and Canadian examples. Geological Survey of Canada Bulletin 423, 1–86.
Foley, S. F. (1990). A review and assessment of experiments on
kimberlites, lamproites and lamprophyres as a guide to their origin.
Earth and Planetary Science Letters 99, 57–80.
Ford, C. E., Russell, D. G., Craven, J. A. & Fisk, M. R. (1983).
Olivine–liquid equilibria: temperature, pressure and composition
dependence of the crystal/liquid cation partition coefficients for Mg,
Fe2þ, Ca and Mn. Journal of Petrology 24(3), 256–265.
Frost, D. J. & Wood, B. J. (1997). Experimental measurements of
the fugacity of CO2 and graphite/diamond stability from 35 to
77 kbar at 925 to 1650�C. Geochimica et Cosmochimica Acta 61(8),
1565–1574.
Fung, A. T. (1998). Petrochemistry of upper mantle eclogites from the
Grizzly, Leslie, Pigeon and Sable kimberlites in the Slave Province,
Canada. In: 7th International Kimberlite Conference, Cape Town,
pp. 230–232.
Ghiorso, M. S. & Sack, R. O. (1995). Chemical mass transfer in
magmatic processes. IV: a revised and internally consistent
thermodynamic model for the interpolation and extrapolation of
liquid–solid equilibria in magmatic systems at elevated temperatures
and pressures. Contributions to Mineralogy and Petrology 119, 197–212.
Girnis, A. V., Brey, G. P. & Ryabchikov, I. D. (1995). Origin of Group
1A kimberlites: fluid-saturated melting experiments at 45–55 kbar.
Earth and Planetary Science Letters 134(3–4), 283–296.
Harris, J. W. (1987). Recent physical, chemical, and isotopic research
of diamond. In: Nixon, P. H (ed.) Mantle Xenoliths. Chichester: John
Wiley, pp. 477–500.
Holland, T. J. B. & Powell, R. (1990). An enlarged and updated
internally consistent thermodynamic dataset with uncertainties and
correlations: the system K2O–Na2O–CaO–MgO–MnO–FeO–
Fe2O3–Al2O3–TiO2–SiO2–C–H–O2. Journal of Metamorphic Geology
8, 89–124.
Holland, T. J. B. & Powell, R. (1998). An internally consistent
thermodynamic data set for phases of petrological interest. Journal of
Metamorphic Geology 16, 309–343.
Ilupin, I. P. & Lutz, B. G. (1971). The chemical composition of
kimberlite and questions on the origin of kimberlite magmas.
Sovetskaya Geologiya 6, 61–73.
Kennedy, C. S. & Kennedy, G. C. (1976). The equilibrium boundary
between graphite and diamond. Journal of Geophysical Research 81(14),
2467–2470.
Kirkley, M. B., Kolebaba, M. R., Carlson, J. A., Gonzales, A. M.,
Dyck, D. R. & Dierker, C. (1998). Kimberlite emplacement
processes interpreted from Lac de Gras examples. In: 7th International
Kimberlite Conference, Cape Town, pp. 429–431.
Kirkley, M. B., Smith, H. S. & Gurney, J. J. (1989). Kimberlite
carbonates: a carbon and oxygen stable isotope study. In: Ross, J.
(ed.) Kimberlites and Related Rocks. Sydney, NSW: Geological Society of
Australia, pp. 264–281.
Kress, V. C. & Carmichael, I. S. E. (1988). Stoichiometry of the iron-
oxidation reaction in silicatemelts.AmericanMineralogist73, 1267–1274.
Kopylova, M. G. & McCammon, C. (2003). Composition and the
redox state of the slave peridotitic mantle. In: 8th International
Kimberlite Conference, Victoria.
Langmuir, C. H., Klein, E. M. & Plank, T. (1992). Petrological
systematics of mid-ocean ridge basalts: constraints on melt generation
beneath ocean ridges. In: Phipps Morgan, J., Blackman, D. K. &
Sinton, J. M (eds) Mantle Flow and Melt Generation at Mid-Ocean Ridges.
Washington, DC: American Geophysical Union, pp. 183–280.
Larsen, L. M. & Pedersen, A. K. (2000). Processes in high-Mg, high-T
magmas; evidence from olivine, chromite and glass in
Palaeogene picrites from West Greenland. Journal of Petrology 41(7),
1071–1098.
MacKenzie, J. M. & Canil, D. (1999). Composition and thermal
evolution of cratonic mantle beneath the central Archean Slave
Province, NWT, Canada. Contributions to Mineralogy and Petrology 134,
313–324.
McCammon, C. A., Griffin, W. L., Shee, S. R. & O’Neill, H. S. C.
(2001). Oxidation during metasomatism in ultramafic xenoliths
from the Wesselton kimberlite, South Africa: implications for the
survival of diamond. Contributions to Mineralogy and Petrology 141,
287–296.
McCrea, J. M. (1950). On the isotope chemistry of carbonates and a
paleotemperature scale. Journal of Chemical Physics 18, 849–857.
Mitchell, R. H. (1973). Composition of olivine, silica activity and
oxygen fugacity in kimberlite. Lithos 6, 65–81.
Mitchell, R. H. (1986). Kimberlites: Mineralogy, Geochemistry, and Petrology.
New York: Plenum.
Mitchell, R. H. (1995). Kimberlites, Orangeites, and Related Rocks. New York:
Plenum.
Nassichuk, W. W. & McIntyre, D. J. (1995). Cretaceous and Tertiary
fossils discovered in kimberlites at Lac de Gras in the Slave Province,
Northwest Territories. In: Interior Plains and Arctic Canada—Plaines
interieures et region arctique du Canada. Ottawa, Ont.: Geological Survey
of Canada, pp. 109–114.
O’Neill, H. & Wall, V. J. (1987). The olivine–orthopyroxene–spinel
oxygen geobarometer, the nickel precipitation curve, and the
oxygen fugacity of the Earth’s upper mantle. Journal of Petrology 28,
1169–1191.
Orr, P. & Luth, R. W. (2000). Petrology and oxygen-isotope
geochemistry of the Yamba Lake kimberlite rocks, NWT. Canadian
Journal of Earth Sciences 37, 1053–1071.
Pell, J. A. (1997). Kimberlites in the Slave Craton, Northwest
Territories, Canada. Geoscience Canada 24, 77–90.
Pouchou, J. L. & Pichoir, F. (1985). PAP f(rZ) procedure for improved


![magmas at the tantra] étates](https://static.documents.pub/doc/80x56/5849d3ee1a28aba93a946d17/magmas-at-the-tantra-etates.jpg)


![Genome-wide analysis of GRAS transcription factor gene ... · GRAS members in G. arboreum, 82 GRAS members in G. raimondii, 33 GRAS members in A. thaliana [9], 42 GRAS members in](https://static.documents.pub/doc/80x56/5e395335b8357078586104d1/genome-wide-analysis-of-gras-transcription-factor-gene-gras-members-in-g-arboreum.jpg)


