Census 2000 Evaluation M.2 September 9, 2003 Effectiveness of Variables Used in the Model to Detect Discrepant Results During Reinterview and the Identification of New Variables FINAL REPORT This evaluation reports the results of research and analysis undertaken by the U.S. Census Bureau. It is part of a broad program, the Census 2000 Testing, Experimentation, and Evaluation (TXE) Program, designed to assess Census 2000 and to inform 2010 Census planning. Findings from the Census 2000 TXE Program reports are integrated into topic reports that provide context and background for broader interpretation of results. Carrie Johanson Decennial Statistical Studies Division
Transcript
Census 2000 Evaluation M.2September 9, 2003
Effectiveness of Variables Used in the Model to Detect Discrepant Results During Reinterview and the Identification of New Variables
FINAL REPORTThis evaluation reports the results of research and analysis undertaken by the U.S. CensusBureau. It is part of a broad program, the Census 2000 Testing, Experimentation, and Evaluation(TXE) Program, designed to assess Census 2000 and to inform 2010 Census planning. Findingsfrom the Census 2000 TXE Program reports are integrated into topic reports that provide contextand background for broader interpretation of results.
errors? . . . . . . . . . . . . . . . . . . . . . . . . . . . . . . . . . . . . . . . . . . . . . . . . . . . . . . . . . . . . 134.9 What is the contribution of each of the Census 2000 variables in identifying cases with
discrepant results? . . . . . . . . . . . . . . . . . . . . . . . . . . . . . . . . . . . . . . . . . . . . . . . . . . . 154.10 How do training and personal characteristics of the enumerators with discrepancies
compare to all of the NRFU enumerators? . . . . . . . . . . . . . . . . . . . . . . . . . . . . . . . . 154.11 Could any of these new variables be used to predict or target enumerators who would be
Table 4.1.1 Totals and percent of cases selected for reinterview by sample type . . . . . . . . . . . . 7
Table 4.2.1 Enumerators selected for reinterview by sample type, categorized by total number offorms selected for reinterview for the enumerator . . . . . . . . . . . . . . . . . . . . . . . . . . . . . . . . . . . 8
Table 4.3.1 Number of times each of the D908 variables contributed to an enumerator being anoutlier and the number of unique outlier enumerators for each variable . . . . . . . . . . . . . . . . . . . 9
Table 4.5.1 Percent of selected reinterview cases with complete reinterview, by sample type . 11
Table 4.6.1 Error rates for completed reinterview cases by sample type and type of error . . . . 12
Table 4.7.1 Percentage of enumerators with completed reinterview cases by categories of error 13
Table 4.8.1 Percent of cases contributing to enumerators with error cases, by sample type andnumber of forms selected for reinterview . . . . . . . . . . . . . . . . . . . . . . . . . . . . . . . . . . . . . . . . . 14
The Census 2000 Nonresponse Followup Reinterview program included three components: a random reinterview, an administrative reinterview, and a supplemental reinterview. A portion of completed enumerator questionnaires were selected to be reinterviewed, and once the reinterview was conducted, the unit status and household roster were compared to the original enumeration. The purpose of the reinterview program was to identify faulty data collection, both intentional and unintentional.
This evaluation looks at the effectiveness of the administrative reinterview and the contributions of the characteristics, or variables, used to identify enumerators for administrative reinterview.
The random reinterview component was designed to verify work from each enumerator. Virtually all enumerators who completed a minimum of ten enumerator questionnaires had one or more of their questionnaires selected for random reinterview. Random reinterviews represented 93.09 percent of the cases selected for the reinterview program. The remainder of the reinterview cases were administrative and supplemental reinterview cases (4.34 percent and 2.57 percent, respectively).
Outlier enumerators were identified for administrative reinterview by comparing questionnaire characteristics of each enumerator against the average for their area. A high vacancy rate, a high rate of partial interviews, a high delete rate, a high rate of questionnaires with a population count of one, and differences in average population per household were variables used in the comparison. The reports identifying these outlier enumerators were run once a week. Over the entire Nonresponse Followup Operation, 291,441 enumerators were flagged as outliers for one of the reasons above. This is 62.57 percent of enumerators with completed work. Not all of these enumerators had cases selected for administrative reinterview. At the discretion of supervisors, approximately five percent of enumerators flagged for administrative reinterview had administrative cases selected, or 3.5 percent of all Nonresponse Followup enumerators.
Supplemental reinterview could be used any time there was reason to suspect cases might not be completed correctly. Supplemental cases with complete reinterview information show a higher frequency of enumerator error between the original enumeration and the reinterview (11.30 percent) than random and administrative cases (9.42 percent and 9.67 percent, respectively). This higher incidence of error identification shows the effectiveness of the supplemental reinterview component.
At the individual case level, administrative and random reinterview found a similar proportion of cases with discrepancies. Of the enumerators in administrative reinterview, 52.09 percent had one or more cases in error. This is much higher than the percent of enumerators in random reinterview with error cases. The range of error rates for enumerators, depending on the number of random reinterview cases selected, was approximately 10 to 14 percent.
iv
We ran a discriminant regression model to evaluate the effectiveness of various variables in the administrative reinterview. We regressed the presence of an error against the variables used for the Census 2000 administrative reinterview and some new variables. The new variables were enumerator-level characteristics: hours in training, education level, test score, any additional language ability, and previous enumeration experience. We were looking for interactions that might help us improve the model we use to identify outlier enumerators for the administrative reinterview.
Of the characteristics reviewed for the administrative sample, the high delete variable had the biggest impact for identifying enumerators with error . However, our regression models showed that very little of the variance associated with the dependent variable (presence of error) was explained by the independent variables of interest. This indicates that we could expect the dependent variable to behave similarly for randomly selected enumerators and enumerators identified as outliers.
Interpreting these results is difficult because of operational limitations. Our analysis shows that administrative reinterview was definitely effective in identifying enumerators with error, yet the contribution of the variables we used to select the enumerators was not meaningful. This is partially explained by the fact that although we targeted enumerators based on work characteristics, our selection of cases for reinterview did not reflect the characteristic(s) that caused the enumerators’ outlier status. Other studies and academic experts have shown that a targeted reinterview can be very beneficial. An example of targeted reinterview would be if an enumerator was an outlier for high deletes, then deleted cases were specifically reinterviewed. Using targeted case selection will likely make the administrative reinterview more effective.
We recommend reducing the number of enumerators identified as outliers. This can be accomplished by increasing the critical cut-off levels or accounting for multiple tests and the recurring time periods. Reducing the outliers identified by the administrative test will create a smaller workload to review. This, in turn, should increase the percentage of enumerators reinterviewed, and the effectiveness of the administrative reinterview program in identifying enumerators with discrepant results.
v
1. BACKGROUND
1.1 What were the components to the Census 2000 reinterview program?
The Census 2000 Quality Assurance (QA) programs for the Nonresponse Followup (NRFU) operation included reinterviews of selected cases. The objective of the reinterview program was to identify faulty data collection, both intentional and unintentional. We achieved this objective through the combination of an administrative sample, a randomly selected sample of each enumerator’s questionnaires, and/or a supplemental reinterview.
The Local Census Office (LCO) reinterview staff reinterviewed a selection of seven random cases
from each enumerator’s workload. This was an automated selection process. One of the first ten
cases an enumerator completed was randomly selected. Systematically, another six were selected
from the enumerator’s workload until the random batch was completed. So, if fewer than seven
cases were selected for an enumerator, the enumerator should have completed fewer than 70
questionnaires. The random reinterview was designed to identify enumerators not producing
quality work early in the operation, to minimize faulty data collection and rework.
If an enumerator’s work characteristics were out of tolerance when compared to the work
characteristics of the other enumerators in the same work area, then that enumerator was identified
as an outlier on an Administrative Reinterview Trouble Report (D908). The work characteristics
reviewed were:
a. Average population per household b. Vacancy Rate c. Partial Interview Rate d. Delete Rate e. Population Count of One Rate
The D908 report was reviewed by the Office Operations Supervisor (OOS) for Reinterview in the office. Unless a justification was given, enumerators were to be identified for administrative reinterview in the tracking database. The next ten cases submitted by that enumerator were
selected for reinterview. The administrative reinterview was designed to use available information
about the enumerator and their work characteristics to identify faulty data collection.
Supplemental reinterview could be used at any time. Crew Leaders used their discretion to identify
enumerators for supplemental reinterview. A large number of forms with unknown telephone
numbers, a lot of work completed in a short amount of time, or forms returned without the
appearance of normal wear and tear may be reasons to select enumerators for supplemental
reinterview. Once an enumerator was identified in the system for supplemental reinterview, the
next ten cases submitted by that enumerator were selected for reinterview.
1
Each case was assigned a sample type of random, administrative, or supplemental. Each batch was
also assigned a batch sample type of random, administrative, or supplemental. Generally a random
batch contained all random selection cases and an administrative batch all administrative selected
cases. A batch could have been started as a random batch and then converted to an administrative
batch. In those situations an administrative batch contained both random and administrative cases.
1.2 How was Census 2000 reinterview conducted?
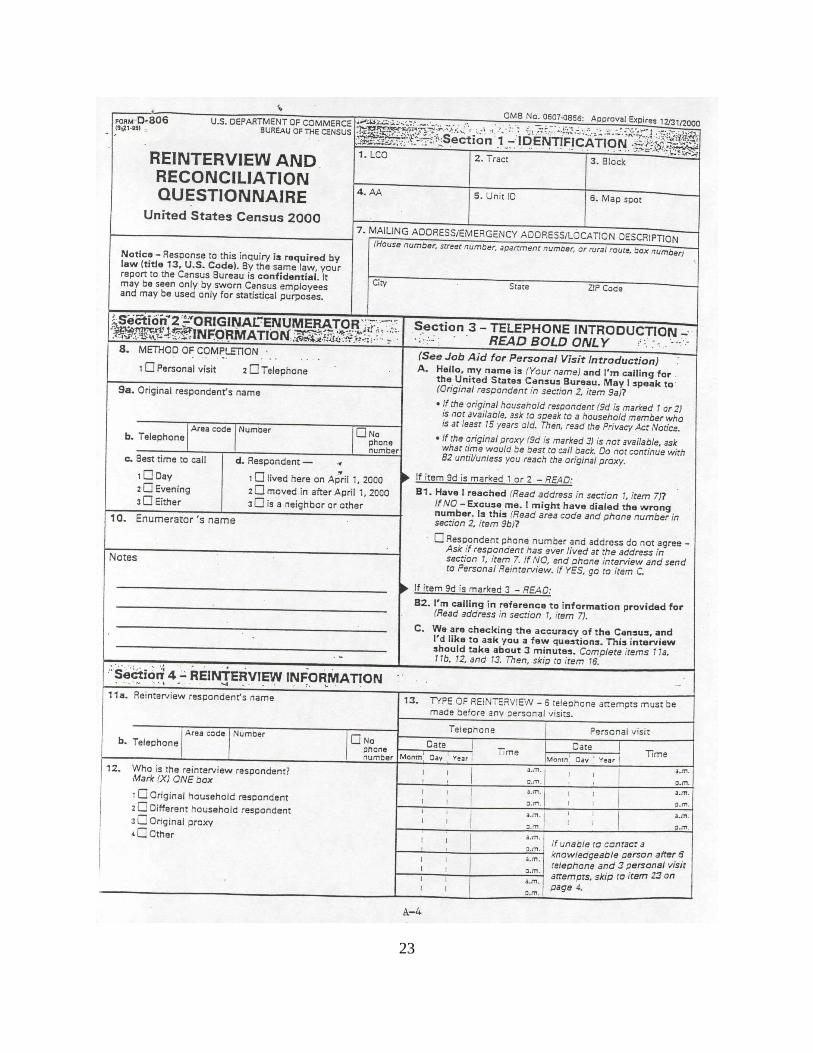
Once a case, or enumerator questionnaire, was selected for reinterview, a label was printed for a
Reinterview and Reconciliation Questionnaire (D806). Both the enumerator questionnaire and the
D806 were moved to a transcription area, where office clerks transcribed some basic information
(e.g. address, unit status, householder names) from the enumerator questionnaire to the D806 form.
Telephone reinterviewers made up to six attempts to contact the household respondent by
telephone to conduct the reinterview. When a telephone reinterview was not successful, up to three
personal visits were attempted by reinterview enumerators in an attempt to conduct the reinterview.
During the reinterview, reinterviewers collected unit status and householder names. The
reinterview staff would then make a decision by comparing the original enumeration data to the
reinterview data. Reinterview enumerators were to classify cases as ‘reject’ when the housing unit status collected in reinterview did not match the original unit status and/or at least 50 percent of the reinterview household roster could not be matched to the original household roster. These ‘reject’ cases were considered cases with discrepant results. Additional questions were asked to determine the reason for the discrepancy. Discrepant cases were then to be further classified as containing falsification, enumerator error, or respondent error.
Upon confirmation of discrepant results, the LCO management staff applied corrective action to
the questionnaires and the enumerators, as appropriate.
During analysis, some cases were found to contain appropriate information to reject the case, yet
no classification of the discrepancy is given. For this evaluation, errors were considered any
discrepancies not attributed to respondent error. Error cases include data falsification, enumerator error, and unexplained cases.
1.3 How were data about Census 2000 reinterview selection and results obtained for the evaluation?
Summary data files of the outlier enumerators from the administrative reinterview were delivered
to the Decennial Statistical Studies Division (DSSD) in D908 files by the Technologies
Management Office (TMO) on a weekly basis during the NFRU operation.
2
Summary data files of the cases selected for reinterview were delivered to DSSD in D191 files by
TMO on a weekly basis during the NRFU operation. The D191 files are considered the master
reference file for all cases selected for reinterview (D191 Master).
The D806 forms were sent to the National Processing Center (NPC) during and upon completion
of the NRFU operation. Both key from image (KFI) and key from paper (KFP) technologies were
used to capture the forms. Minimal data, including reinterview results and housing unit
identification numbers, were captured from each form. Additional data were captured for a sample
of forms. All data capture operations were subject to quality control measures.
The D191 forms are paper forms that were used to record batch level decision information. These
forms were data captured at the NPC by KFI technology. Data from these forms are referred to as
batch results.
2. METHODS
2.1 How were forms identified for data capture?
Every NRFU Reinterview form received at NPC went through the first step (Step 1) of the D806 data capture. Forms were identified by their housing unit identification number (Unit ID) and the preliminary reinterview decision (to accept or reject the case) was data captured for every form. Based on the results of Step 1 data capture and batch results, we selected a sample of cases for more complete data capture (Step 2).
For Step 2 data capture, some cases were considered certainty cases and others were selected by a 10 percent systematic sample of the forms (forms were not sorted in any particular order). There were three reasons a case might be selected with certainty to be in the sample of cases for Step 2:
• If the case was part of an administrative batch • If there was any evidence of error in the batch • If the preliminary reinterview decision on the form was “Reject.”
2.2 How were cases weighted to account for data capture?
Results from Step 2 data capture were merged with files containing the complete Step 1 data capture results and all cases selected for Reinterview (D191 Master). This combined file was then priority unduplicated by Unit ID. (The unique identifier for Step 1 and Step 2 data capture was an image ID, as we may have had more than one form for a unique Unit ID.) We were not able to determine the sample type (random, administrative, supplemental) or the enumerator who completed the enumerator questionnaire in every case. In some cases the D806 was missing adequate information to make the linkage. In addition, some reinterview cases were received at the NPC that were not in the D191 Master file. This was a relatively small number of forms, and they were excluded from most of the analysis (see Table A in the Appendix).
3
Summaries for administrative case-level data are actual results. Since all administrative cases were selected with certainty for Step 2 data capture, results contain all administrative reinterview data available and are not sample-based results.
Case-level random reinterview and supplemental reinterview results are presented as estimates. Certainty cases were maintained with a weight of one. The remaining cases in the Step 2 data capture were weighted and combined with the certainty cases to produce data estimates.
The distribution of random, administrative, and supplemental cases selected for reinterview is 93.09 percent, 4.34 percent, and 2.57 percent, as identified by the D191 master file. When reporting a combined percentage for the reinterview operation, these weights are used to accurately represent the sample types in the relative magnitude they contribute to all the reinterview cases.
Care is taken to give percentages so administrative cases are not over-represented. Counts can be found in Table A in the Appendix.
How were enumerator summaries made?
The data files used for this evaluation do not represent every enumerator. Since the data capture sample was based on forms, the 10 percent sample of forms mentioned above over-represents enumerators who had more cases selected for reinterview. The sample selection was not designed to make estimates of enumerator-level results. Summaries given are based on a 10 percent sample of forms and are provided for enumerators with fewer than ten forms selected for reinterview and those with ten or more. This division seems to be important for two reasons. The first reason has to do with the enumerators and their probability of having a case with complete data capture. With a ten percent sample, we anticipate most enumerators with ten or more cases in reinterview to be represented in the second category (ten or more). Because of the selection process for Step 2 data capture, not all enumerators have data represented in the first category of fewer than ten cases in reinterview. This category division also made sense in looking at the data. The more cases reinterviewed, the more likely an error was identified. This division helps show that impact and would help draw conclusions in the event that not all the case-level sample types were correctly assigned.
In order not to over-represent enumerators with certainty cases, including administrative cases and discrepant results, the file used for enumerator-level summaries is slightly different from the file used for case-level summaries. A file was created with a 10 percent sample of all forms, and estimates were not projected, but rather derived from available information, with all cases given an equal representation.
4
2.3
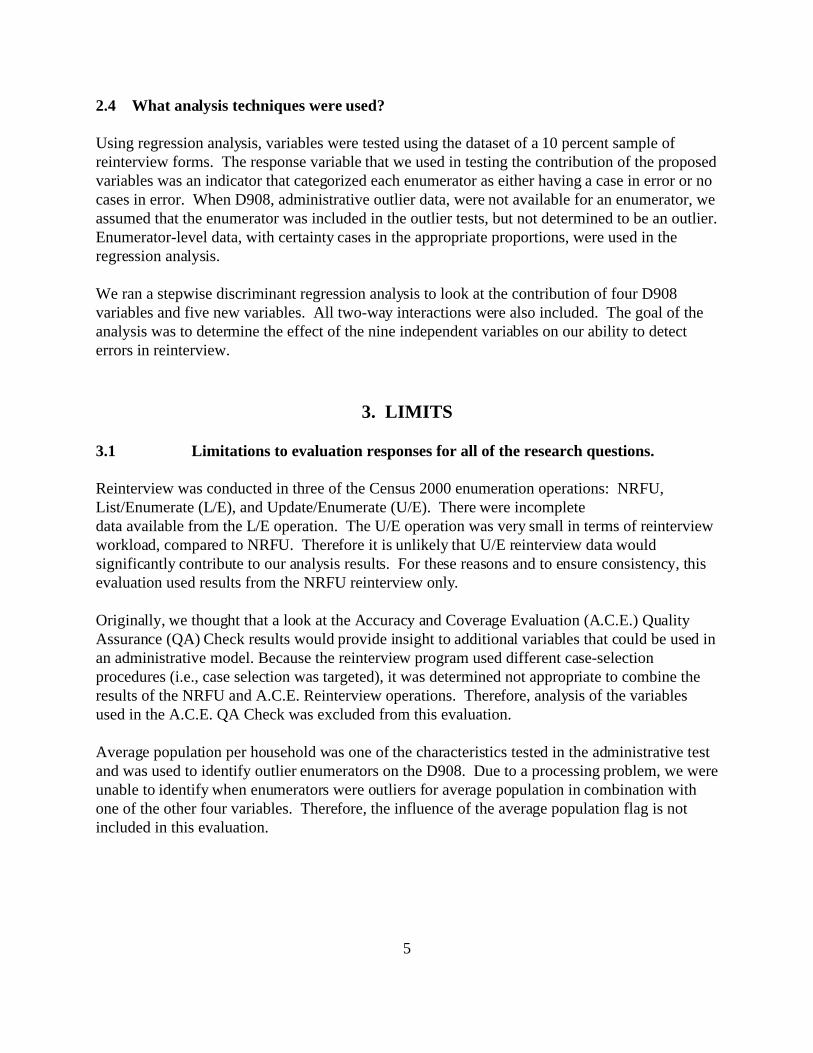
2.4 What analysis techniques were used?
Using regression analysis, variables were tested using the dataset of a 10 percent sample of reinterview forms. The response variable that we used in testing the contribution of the proposed variables was an indicator that categorized each enumerator as either having a case in error or no cases in error. When D908, administrative outlier data, were not available for an enumerator, we assumed that the enumerator was included in the outlier tests, but not determined to be an outlier. Enumerator-level data, with certainty cases in the appropriate proportions, were used in the regression analysis.
We ran a stepwise discriminant regression analysis to look at the contribution of four D908 variables and five new variables. All two-way interactions were also included. The goal of the analysis was to determine the effect of the nine independent variables on our ability to detect errors in reinterview.
3. LIMITS
3.1 Limitations to evaluation responses for all of the research questions.
Reinterview was conducted in three of the Census 2000 enumeration operations: NRFU,List/Enumerate (L/E), and Update/Enumerate (U/E). There were incomplete data available from the L/E operation. The U/E operation was very small in terms of reinterviewworkload, compared to NRFU. Therefore it is unlikely that U/E reinterview data wouldsignificantly contribute to our analysis results. For these reasons and to ensure consistency, thisevaluation used results from the NRFU reinterview only.
Originally, we thought that a look at the Accuracy and Coverage Evaluation (A.C.E.) QualityAssurance (QA) Check results would provide insight to additional variables that could be used inan administrative model. Because the reinterview program used different case-selectionprocedures (i.e., case selection was targeted), it was determined not appropriate to combine theresults of the NRFU and A.C.E. Reinterview operations. Therefore, analysis of the variablesused in the A.C.E. QA Check was excluded from this evaluation.
Average population per household was one of the characteristics tested in the administrative testand was used to identify outlier enumerators on the D908. Due to a processing problem, we wereunable to identify when enumerators were outliers for average population in combination withone of the other four variables. Therefore, the influence of the average population flag is notincluded in this evaluation.
5
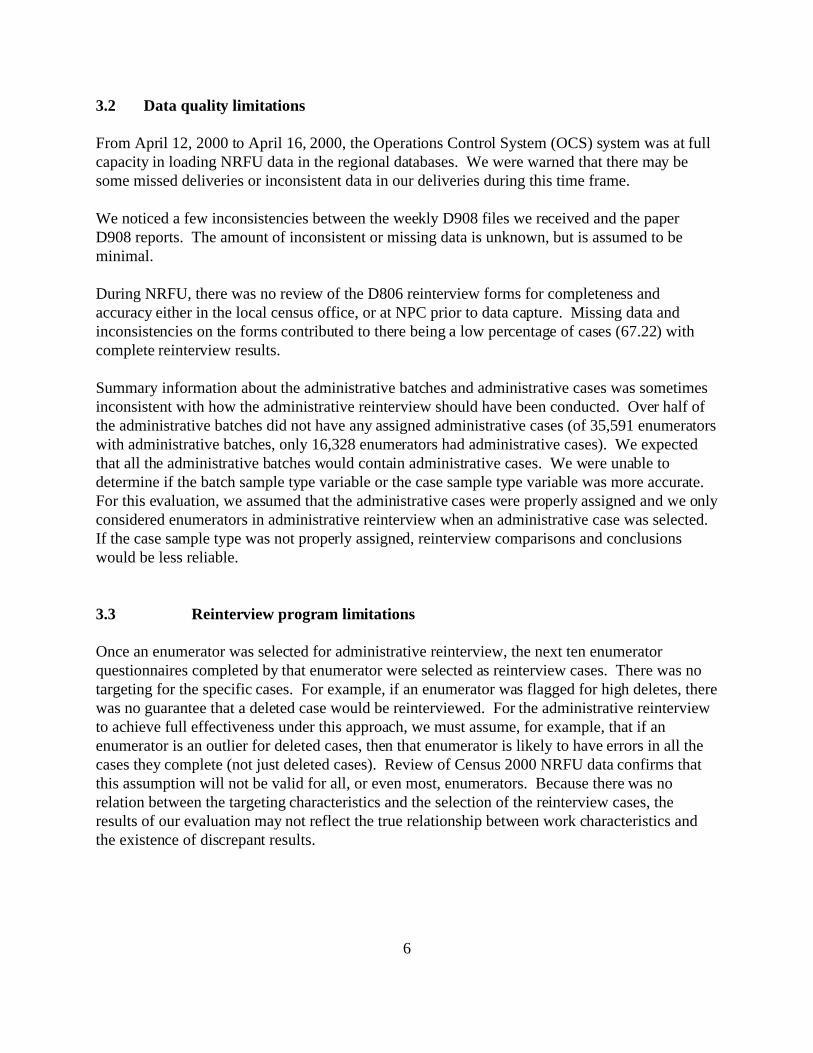
3.2 Data quality limitations
From April 12, 2000 to April 16, 2000, the Operations Control System (OCS) system was at full capacity in loading NRFU data in the regional databases. We were warned that there may be some missed deliveries or inconsistent data in our deliveries during this time frame.
We noticed a few inconsistencies between the weekly D908 files we received and the paper D908 reports. The amount of inconsistent or missing data is unknown, but is assumed to be minimal.
During NRFU, there was no review of the D806 reinterview forms for completeness and accuracy either in the local census office, or at NPC prior to data capture. Missing data and inconsistencies on the forms contributed to there being a low percentage of cases (67.22) with complete reinterview results.
Summary information about the administrative batches and administrative cases was sometimes inconsistent with how the administrative reinterview should have been conducted. Over half of the administrative batches did not have any assigned administrative cases (of 35,591 enumerators with administrative batches, only 16,328 enumerators had administrative cases). We expected that all the administrative batches would contain administrative cases. We were unable to determine if the batch sample type variable or the case sample type variable was more accurate. For this evaluation, we assumed that the administrative cases were properly assigned and we only considered enumerators in administrative reinterview when an administrative case was selected. If the case sample type was not properly assigned, reinterview comparisons and conclusions would be less reliable.
3.3 Reinterview program limitations
Once an enumerator was selected for administrative reinterview, the next ten enumerator questionnaires completed by that enumerator were selected as reinterview cases. There was no targeting for the specific cases. For example, if an enumerator was flagged for high deletes, there was no guarantee that a deleted case would be reinterviewed. For the administrative reinterview to achieve full effectiveness under this approach, we must assume, for example, that if an enumerator is an outlier for deleted cases, then that enumerator is likely to have errors in all the cases they complete (not just deleted cases). Review of Census 2000 NRFU data confirms that this assumption will not be valid for all, or even most, enumerators. Because there was no relation between the targeting characteristics and the selection of the reinterview cases, the results of our evaluation may not reflect the true relationship between work characteristics and the existence of discrepant results.
6
4. RESULTS
4.1 What was the Census 2000 NRFU Reinterview workload?
Data were provided to the DSSD from the Census 2000 OCS system maintained by TMO for the purpose of managing cases in the field. Each case assigned to reinterview was tracked through stages of completion. In NRFU, 2,546,359 cases were selected for reinterview. Each case can be attributed to being selected by random, administrative, or supplemental reinterview. A random batch generally consisted of seven reinterview cases and ten cases were to be selected for administrative and supplemental batches. If the random batch was not yet completed and the enumerator was selected to be in administrative reinterview, the whole batch was considered to be an administrative batch, even though individual cases within the batch might have been selected for both random and administrative reinterview.
The following table provides the selected NRFU reinterview workload and indicates the individual case sample type for each case.
Table 4.1.1 Totals and percent of cases selected for reinterview by sample type
Total cases Random Administrative Supplemental selected for (Sample Type 1) (Sample Type 2) (Sample Type 3) reinterview
2,546,359 2,370,316 110,597 65,436
Percent of cases selected 100.00 % 93.09 % 4.34 % 2.57 % for reinterview
4.2 How many enumerators were selected for Reinterview?
The Decennial Management Division reported in its NRFU assessment report, 622,951 enumerators assigned as staff for NRFU. Reinterview data show that 465,769 enumerators were selected to have cases reinterviewed for some reason. The random reinterview was designed to reinterview a sample of cases for every enumerator. A case was selected randomly from the first ten cases completed. It is likely that the enumerators never selected for reinterview completed fewer than ten cases. Of enumerators who completed ten or more questionnaires (465,769 is a reasonable estimate), almost all enumerators had cases in random reinterview. Enumerators could be identified for administrative or supplemental reinterview at any time. Once cases were selected as administrative or supplemental reinterview, the enumerator was exempt from the random reinterview.
7
The following is a table of the enumerators selected for reinterview. The counts are of enumerators with one or more cases of the sample type specified in the column heading. The rows specify which enumerators are included in the category (all enumerators, those with less than ten cases selected for reinterview, and those with ten or more). The percentages represent the percent of the enumerators in that row that had any cases in the specified sample type. Enumerators may have reinterview cases of more than one sample type, so row percentages will not add to 100 percent.
Table 4.2.1 Enumerators selected for reinterview by sample type, categorized by total number of forms selected for reinterview for the enumerator
All Enumerators
Row percent Column percent
Enumerators with fewer than 10 cases in reinterview
Row percent Column percent
Enumerators with 10 or more cases in reinterview
Row percent Column percent
Enumerators Random - 1 Administrative - 2 Supplemental - 3 selected for reinterview
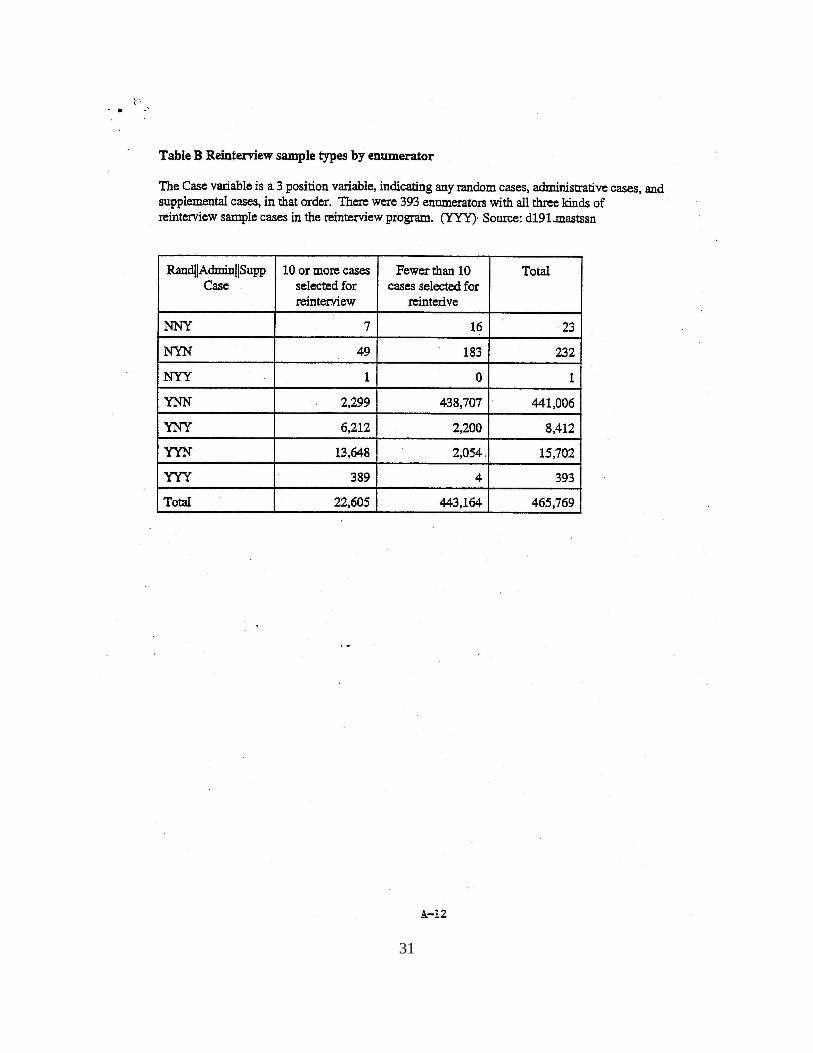
More than 95 percent of the enumerators selected for reinterview had fewer than ten cases selected. It is consistent with the reinterview selection process that a higher percentage of enumerators with more than ten cases selected would have administrative or supplemental cases. Of the enumerators who had ten or more cases selected for reinterview, only 2,299 (10.17 percent) had no administrative or supplemental cases (see Table B, Reinterview case sample types by enumerator in the Appendix). Since the random reinterview was designed to select only seven cases, these results are not consistent with how random cases were to be selected. This is not a problem, except it shows another inconsistency of either the reinterview selection or recording. We continue to assume that case-level sample assignment is accurate and make sample type comparisons, although this may not be accurate in all cases.
8
Of the enumerators with an administrative case, 86.28 percent (14,087/16,328) had a total of ten or more cases selected. For enumerators with a supplemental case, 74.86 percent had ten or more cases selected. One reason for less than ten cases selected for administrative or supplemental reinterview would be that an enumerator did not complete ten or more enumerator questionnaires after selection for the reinterview. Employment with the Census Bureau may have been terminated or no additional work assigned.
4.3 How many enumerators were identified as outliers by the administrative test?
The test to determine the administrative sample was run 11 times during the NRFU operation, each week from May 7, 2000 to July 16, 2000. Each week an enumerator had completed questionnaires, their information was compared against the averages for their Crew Leader District (CLD). The D908 identified enumerators whose work was significantly different from the other enumerators in their CLD. The items compared were:
• Average population per household • Delete Rate • Population Count of One Rate • Vacancy Rate • Partial Interview Rate
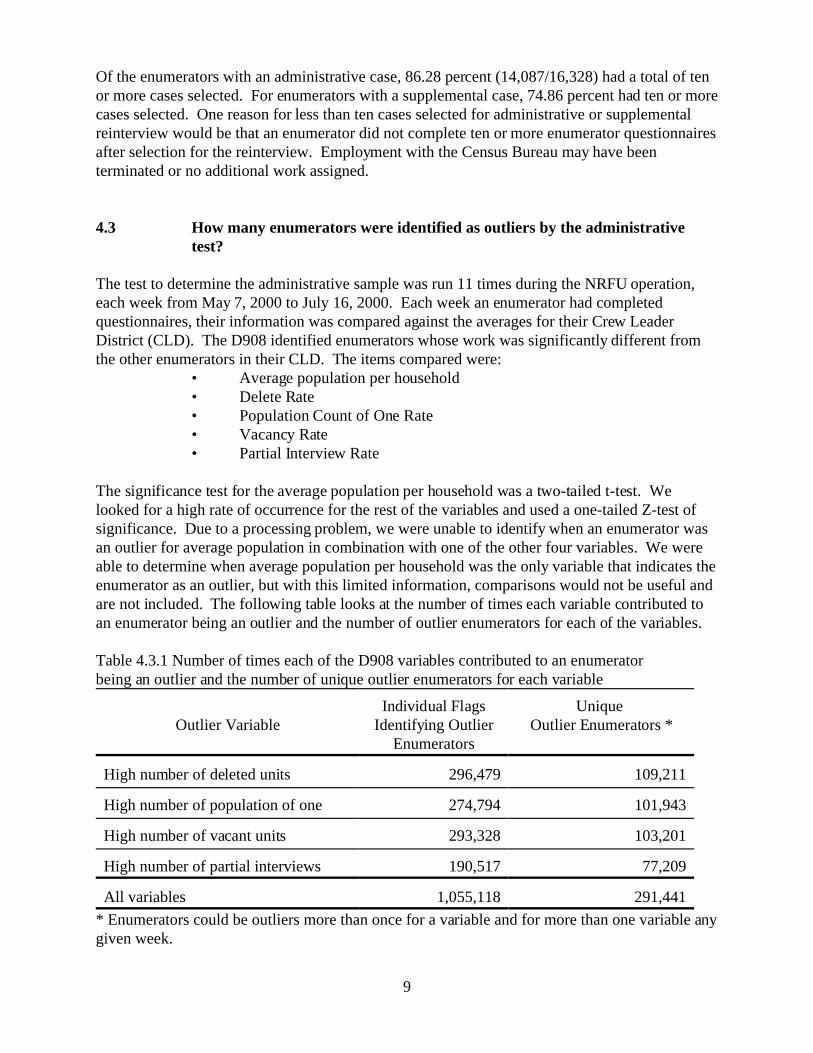
The significance test for the average population per household was a two-tailed t-test. We looked for a high rate of occurrence for the rest of the variables and used a one-tailed Z-test of significance. Due to a processing problem, we were unable to identify when an enumerator was an outlier for average population in combination with one of the other four variables. We were able to determine when average population per household was the only variable that indicates the enumerator as an outlier, but with this limited information, comparisons would not be useful and are not included. The following table looks at the number of times each variable contributed to an enumerator being an outlier and the number of outlier enumerators for each of the variables.
Table 4.3.1 Number of times each of the D908 variables contributed to an enumerator being an outlier and the number of unique outlier enumerators for each variable
* Enumerators could be outliers more than once for a variable and for more than one variable any given week.
9
There were 291,441 unique NRFU enumerators who were outliers for any reason during any of the 11 weeks. This is 62.57 percent of NRFU enumerators with completed work. The administrative model was designed to identify no more than 5 percent of enumerators as outliers for each variable, each week. The percentage of enumerators identified as outliers was higher than we anticipated.
Note: The L/E and U/E reinterview programs limited the administrative test to enumerators with 30 or more completed questionnaires. In NRFU, the enumerator could be an outlier for administrative reinterview based on any number of cases. If an enumerator completed work for more than one CLD, that enumerator could be an outlier in each CLD. Statistically, these situations make it more probable for an enumerator to be an outlier in NRFU.
What percent of the enumerators identified as outliers by the administrative test were selected for administrative reinterview?
The D908 outlier report was reviewed in the office by the OOS for Reinterview each week after it was printed. The OOS for Reinterview was instructed to place each enumerator in administrative reinterview unless there was a reasonable explanation for the characteristics being significantly different from the CLD average.
Of the 291,441 enumerators identified on the D908 reports, 14,696 had administrative cases selected for reinterview. This is 5.04 percent of the outlier enumerators. The QA plan did not set an expectation of the percent of enumerators to be selected for administrative reinterview, however it was not anticipated the majority of the outlier enumerators would be justified and exempted from the administrative reinterview.
The low percentage of enumerators who had administrative cases selected makes it difficult to evaluate the effectiveness of the administrative variables. This evaluation continues to look at the effect of those variables, although this low percentage may make it difficult to draw conclusions. We recommend that in the future, the administrative reinterview component contain more specific expectations on the allowable amount of exceptions that can be made.
The way the reinterview process was set up, the OOS for Reinterview decision to put enumerators into administrative reinterview was not automated. The OOS for Reinterview, or their clerical staff, had to take the time to manually enter each enumerator into the system to select them for the administrative reinterview.
There were some administrative cases selected for reinterview for enumerators who weren’t outliers on the D908. Two possible explanations are that either we were missing the D908 delivery or the cases were selected for administrative reinterview when they should have been categorized as supplemental.
Almost all (99.83 percent) of the outlier enumerators identified by the D908 reports had one or more cases selected to be in reinterview for any reason.
10
4.4
4.5 What percent of the selected reinterview cases contain useable results?
The reinterview data provided above were obtained from the D191 files (master record of all reinterview cases). Not all cases selected for reinterview were completed. This was evidenced by blank forms, forms without original enumeration information, or forms with no reinterview data. Many comments indicated that cases were not completed because the original questionnaire was shipped from the LCO before the transcription was completed. Cases never received at NPC, forms missing the housing unit identification number, or forms containing inconsistent data also contributed to the number of cases without complete reinterview data.
Approximately 70 percent of the reinterview forms received at NPC with any data had useable reinterview information. This is only 67.22 percent of the total NRFU Reinterview workload.
Table 4.5.1 Percent of selected reinterview cases with complete reinterview data, by sample type
Total Random Administrative Supplemental Cases Cases (actual) Cases
Percent of selectedreinterview cases with 67.22 % 67.09 % 69.61 % 50.58 %complete reinterviewdata
The incompletion rates are comparable for random and administrative sample types. Supplemental reinterview had a smaller proportion of cases with complete reinterview data. Thepercentage of supplemental cases missing original enumeration information was substantiallyhigher compared to random and administrative reinterview. Sometimes reinterview wasconducted by keeping the enumerator questionnaire with the D806 reinterview form and omittingthe transcription. This seems most convenient with supplemental cases and may explain thelower completion rates. Enumerators are generally selected for supplemental reinterview whenenumerator questionnaires have been recently turned into the LCO. The crew leader may beinvolved, or the reinterview staff may be alerted and the questionnaires may be hand-walkedthrough the phone interview. Although a reinterview may have been completed, and resultscompared with the original enumeration, these cases are not maintained in the analysis, sincethere is no documented comparison.
4.6 What percent of the completed reinterview cases contained discrepant results?
A case was to be determined to contain discrepant results when the housing unit status from the reinterview did not match the original status and/or at least 50 percent of the reinterview household roster did not match to the original household roster. The reinterview staff was instructed to “reject” those cases. Cases incorrectly “accepted” are categorized here as unexplained.
11
If the reinterviewer determined that the original enumerator deliberately entered falsified data, then
the case was identified as falsification. The case was identified as enumerator error if it was
determined that the incorrect data were mistakes made by the enumerator. The reinterview cases
were identified as respondent error if it was determined that the incorrect data were mistakes made
by the respondent. Some cases with discrepancies were not identified as falsification, enumerator
error, or respondent error and are categorized as unexplained. For this evaluation we are
concerned about discrepancies caused by enumerator error, both intentional and unintentional.
Errors are considered any discrepancy not attributed to respondent error. An estimated 9.51 percent of the total NRFU reinterview cases contained errors.
Table 4.6.1 Error rates for interview cases by sample type and type of error
Random Cases Administrative Cases
(Actual)
completed re
Categorization of discrepant results
Enumerator Error
Falsification
Unexplained
Respondent error
Enumerator error, falsification, or unexplained
4.80 %
1.72 %
2.86 %
1.73 %
4.83 %
1.81 %
2.98 %
1.92 %
9.42 % 9.67 %
Supplemental Cases
5.61 %
2.39 %
3.25 %
2.27 %
11.30 %
Practically, random reinterview was just as effective as administrative reinterview in identifying cases with error. Supplemental reinterview identified more error cases than administrative or random reinterview.
We have no reason to suspect that the incidence of error would have been any greater or less for
cases that were selected for reinterview, but did not contain complete reinterview results.
What percent of enumerators with complete reinterview results had any cases with errors?
Since data for only a sample of forms were data captured, we did not obtain data for every enumerator. The data capture sample was based on forms and not intended to be used to estimate enumerator-level statistics. We continue to give enumerator-level statistics, because the administrative test was performed at the enumerator level. The enumerator information that follows is not an estimate of all enumerators represented in reinterview, however it can provide useful insight to enumerator summaries based on the sample of forms with complete reinterview results. Enumerators with less cases in reinterview are under-represented in these summaries, but
12
4.7
the summaries reflect enumerators in the magnitude that they contributed to completing NRFU work.
Approximately 95 percent of enumerators had fewer than ten cases selected for reinterview. Of the enumerators in sample with fewer than ten cases selected for reinterview, 10.76 percent had one or more cases with errors, excluding respondent error. Of the enumerators in sample with ten or more cases selected for reinterview, 13.54 percent of enumerators had one or more cases with errors. Enumerators may have had cases attributed to more than one of the categories below.
4.7.1 Percentage of enumerators with completed reinterview cases by categories of errors
Categorization of errors Percent of Percent of enumerators with enumerators with
fewer than 10 or more cases 10 cases selected for selected for
reinterview reinterview
Enumerator Error 5.60 % 6.78 %
Falsification 1.95 % 2.98 %
Unexplained 3.34 % 4.20 %
Total 10.76 % * 13.54 % *
* These percentages do not sum to 10.76 percent and 13.54 percent, as enumerators may have had cases in more than one of the error categories.
Consistent with the case-level summaries in section 4.6, most of the errors were categorized as enumerator error. The more cases reinterviewed, the more likely to identify cases containing errors.
4.8 How effective was the administrative reinterview in identifying enumerators with errors?
Based on the sample of forms, the following types of cases were influential in identifying enumerators with cases in error. Row percentages may add up to more than 100 percent since more than one case may have been found in error for an enumerator.
13
Table 4.8.1 Percent of cases contributing to enumerators with error cases, by sample type and number of forms selected for reinterview.
Random Case Administrative Case Supplemental Case
Fewer than 10 cases selected for reinterview
10 or more cases selected for reinterview
99.42 % 0.32 % 0.26 %
45.83 % 39.89 % 15.96 %
For enumerators with fewer than ten cases selected for reinterview, almost all of the error cases were identified by a random reinterview case. For enumerators with ten or more cases selected for reinterview, the percent of cases in error identified by the administrative reinterview jumps from 0.32 percent to 39.89 percent. These results are expected because, as reported earlier, very few of the enumerators in the ‘fewer than 10 cases’ category had administrative cases selected and most of the enumerators in the ‘10 or more cases’ category had administrative cases selected.
In section 4.6, we indicated that at a reinterview case level, administrative reinterview is no more effective than random reinterview. The following table follows the progression of enumerators with administrative cases, or administrative enumerators.
Table 4.8.2 Frequencies of administrative enumerators across steps of reinterview and data capture process
Selected for reinterview
Any Step 2 data capture results
Any complete reinterview results
Any cases in error
Administrative Enumerators
16,328
15,360
15,020
7,824
Results at an enumerator level yield different results than the case-level summaries. We found errors in 52.09 percent of administrative enumerators with complete reinterview data. Administrative case-level error rates were 9.67 percent.
The numbers above include all available data captured for these enumerators. Data capture was designed to obtain all administrative cases and any cases with any apparent evidence of discrepancies. Cases in administrative batches are over-represented, so no direct comparison can be made between the administrative error rates and random reinterview rates for these specific enumerators. Error rates for enumerators with random reinterview will be close to the overall enumerator rates given in the previous section.
14
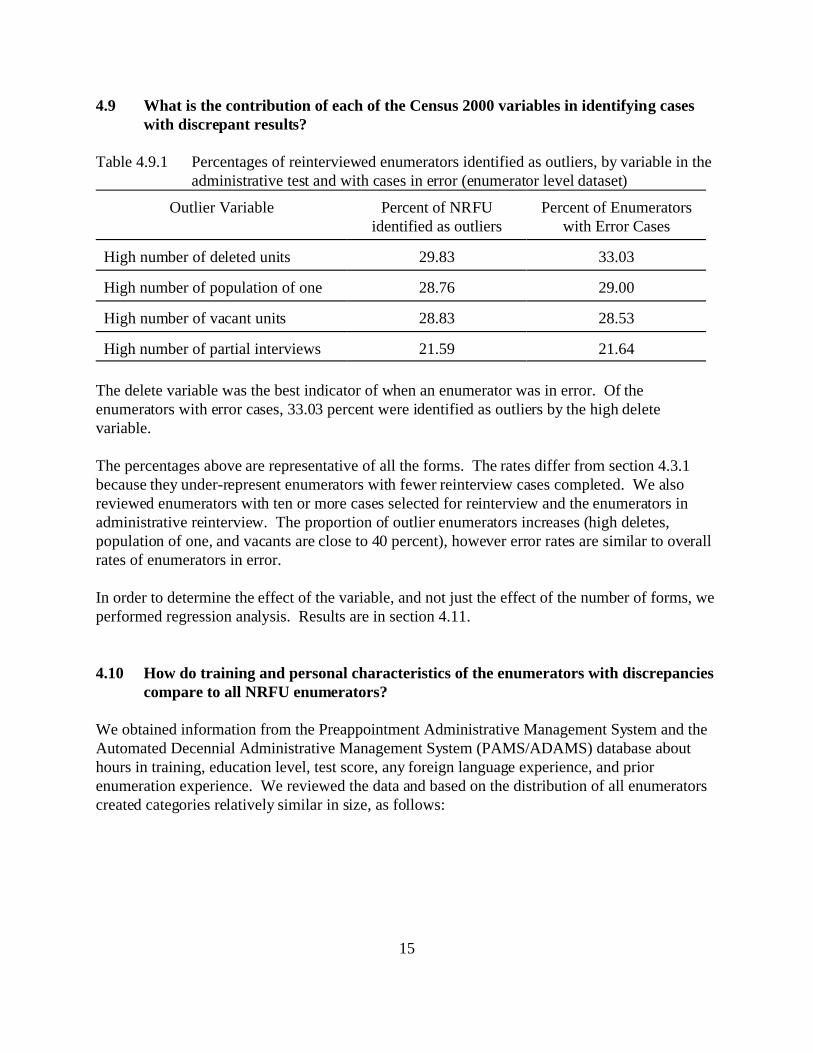
4.9 What is the contribution of each of the Census 2000 variables in identifying cases with discrepant results?
Table 4.9.1 Percentages of reinterviewed enumerators identified as outliers, by variable in the administrative test and with cases in error (enumerator level dataset)
Outlier Variable Percent of NRFU Percent of Enumerators identified as outliers with Error Cases
High number of deleted units 29.83 33.03
High number of population of one 28.76 29.00
High number of vacant units 28.83 28.53
High number of partial interviews 21.59 21.64
The delete variable was the best indicator of when an enumerator was in error. Of the enumerators with error cases, 33.03 percent were identified as outliers by the high delete variable.
The percentages above are representative of all the forms. The rates differ from section 4.3.1 because they under-represent enumerators with fewer reinterview cases completed. We also reviewed enumerators with ten or more cases selected for reinterview and the enumerators in administrative reinterview. The proportion of outlier enumerators increases (high deletes, population of one, and vacants are close to 40 percent), however error rates are similar to overall rates of enumerators in error.
In order to determine the effect of the variable, and not just the effect of the number of forms, we performed regression analysis. Results are in section 4.11.
4.10 How do training and personal characteristics of the enumerators with discrepancies compare to all NRFU enumerators?
We obtained information from the Preappointment Administrative Management System and the Automated Decennial Administrative Management System (PAMS/ADAMS) database about hours in training, education level, test score, any foreign language experience, and prior enumeration experience. We reviewed the data and based on the distribution of all enumerators created categories relatively similar in size, as follows:
15
Table 4.10.1 New variable descriptions and categories
Hours in training Less than 22 hours, 22 - 26 hours, and more than 26 hours
Education level
Test score
High school, some education past high school, and college graduate
Less than 90, 90 and above
Additional language ability Yes/No
Prior enumeration experience Yes/No
When the frequencies were compared between all NRFU enumerators in the sample and enumerators with discrepancies, proportions were close in every category.
Table 4.10.2 Distribution of all NRFU enumerators and enumerators with errors for each new variable
Percent of all NRFU Percent of enumerators with enumerators with reinterview results error cases
Less than 22 hours in training 37.95 37.05
22 - 26 hours in training 47.09 47.48
More than 26 hours in training 14.96 15.47
High school 50.85 52.42
Some education past high school 18.63 18.95
College graduate 30.53 28.63
Test score less than 90 38.24 42.18
Test score 90 and above 61.76 57.82
Additional language ability (Yes) 69.62 69.06
No additional language ability 30.38 30.94
Prior enumeration experience 81.88 81.29 (Yes)
No prior enumeration experience 18.12 18.71
These variables do not have a practical impact on whether or not an enumerator had error cases, but we performed regression analysis to look for significant interactions.
16
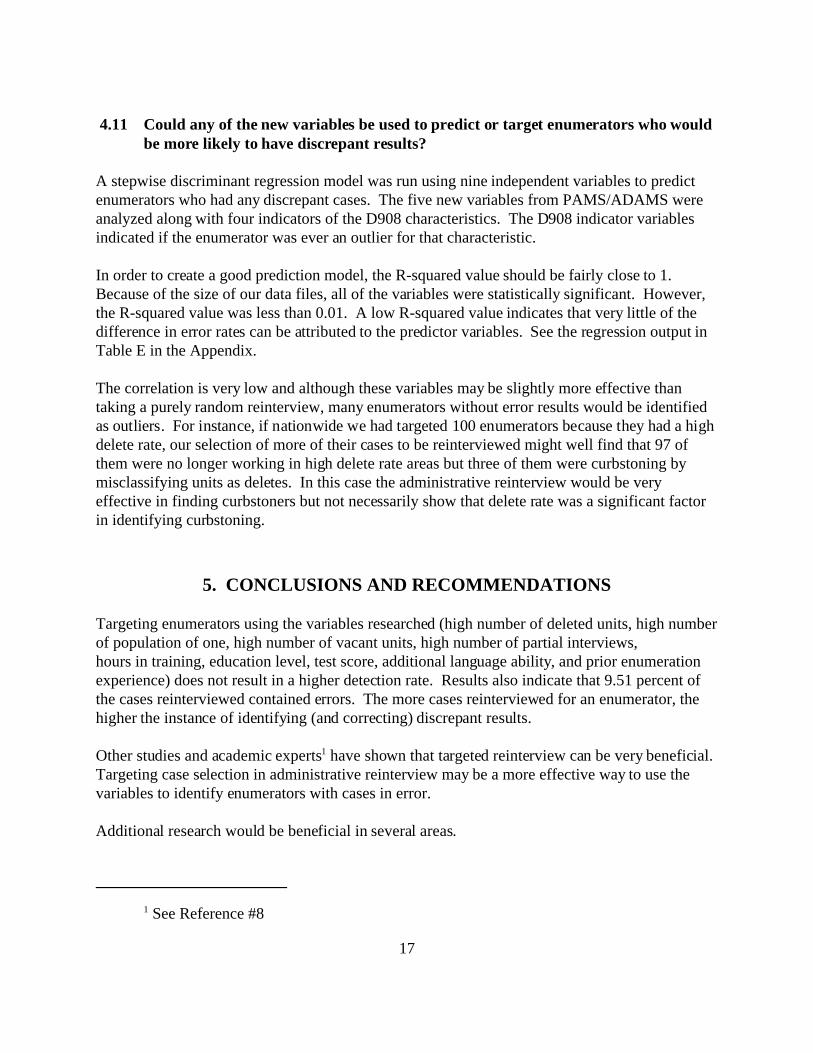
4.11 Could any of the new variables be used to predict or target enumerators who would be more likely to have discrepant results?
A stepwise discriminant regression model was run using nine independent variables to predict enumerators who had any discrepant cases. The five new variables from PAMS/ADAMS were analyzed along with four indicators of the D908 characteristics. The D908 indicator variables indicated if the enumerator was ever an outlier for that characteristic.
In order to create a good prediction model, the R-squared value should be fairly close to 1. Because of the size of our data files, all of the variables were statistically significant. However, the R-squared value was less than 0.01. A low R-squared value indicates that very little of the difference in error rates can be attributed to the predictor variables. See the regression output in Table E in the Appendix.
The correlation is very low and although these variables may be slightly more effective than taking a purely random reinterview, many enumerators without error results would be identified as outliers. For instance, if nationwide we had targeted 100 enumerators because they had a high delete rate, our selection of more of their cases to be reinterviewed might well find that 97 of them were no longer working in high delete rate areas but three of them were curbstoning by misclassifying units as deletes. In this case the administrative reinterview would be very effective in finding curbstoners but not necessarily show that delete rate was a significant factor in identifying curbstoning.
5. CONCLUSIONS AND RECOMMENDATIONS
Targeting enumerators using the variables researched (high number of deleted units, high numberof population of one, high number of vacant units, high number of partial interviews, hours in training, education level, test score, additional language ability, and prior enumerationexperience) does not result in a higher detection rate. Results also indicate that 9.51 percent ofthe cases reinterviewed contained errors. The more cases reinterviewed for an enumerator, thehigher the instance of identifying (and correcting) discrepant results.
Other studies and academic experts1 have shown that targeted reinterview can be very beneficial.Targeting case selection in administrative reinterview may be a more effective way to use thevariables to identify enumerators with cases in error.
Additional research would be beneficial in several areas.
1 See Reference #8
17
Further analysis of the D806 results could determine a classification of errors, such as an occupied unit classified as a delete, an incorrect roster, etc. These classifications could then be compared to the outlier variables and analyzed for correlations.
The D908 data were summarized into one indicator flag. Additional data are available to do analysis on cutoff scores, weekly effects, the number of short and long forms completed, and combined effect of the administrative variables. This would help in understanding the distribution and validating assumptions made in the design of the administrative model. We could look at the impact of enforcing a minimum of 30 completed cases or increasing the levels for outlier cutoffs, so that less enumerators are identified as outliers. The percent of outlier enumerators must be reduced to have an effective administrative reinterview.
REFERENCES
1) “Quality Assurance Software Specification for Generating the Random Sample for Detection of Fabrication and other Performance Errors during the Census 2000 Nonresponse Followup Operation.” Decennial Statistical Studies Division Census 2000 Procedures and Operations Memorandum Series II-5. May 26, 1999.
2) “Quality Assurance Software Specifications for Performing the Administrative Test for Detection of Fabrication or other Performance Errors during the Census 2000 Nonresponse Followup Operation.” Decennial Statistical Studies Division Census 2000 Procedures and Operations Memorandum Series II-8. June 6, 1999.
3) “Revised: Quality Assurance Specifications for the Census 2000 Nonresponse Followup Operation.” Decennial Statistical Studies Division Census 2000 Procedures and Operations Memorandum Series II-9R. August 28, 1999.
4) Rosemary Byrne, “Census 2000 A.C.E. QA Targeting Reports Specifications for Person Interviews.” Decennial Statistical Studies Division Census 2000 Procedures and Operations Memorandum Series Chapter S-QA-06, Feb 7, 2001.
5) “Data Requirements for Reinterview Documentation for the Operations of Nonresponse Followup, List/Enumerate, and Rural Update Enumerate.” Decennial Statistical Studies Division Census 2000 Procedures and Operations Memorandum Series II-18. January 4,2000
6) “Request for Data Capture and Cost Estimate of Step 1 D-806, Reconciliation and Reinterview Questionnaires (wand and key from paper).” Decennial Statistical Studies Division Census 2000 Procedures and Operations Memorandum Series II-M2-3. August 13, 2001.
18
7) “Request for Imaging and Data Capture of Reinterview and Reconciliation Questionnaire, D-806.” Decennial Statistical Studies Division Census 2000 Procedures and Operations Memorandum Series II-M2-4. November 27, 2001.
8) “Interviewer Falsification in Survey Research: Current Best Methods for Prevention, Detection and Repair of Its Effects.” AAPOR Standard Committee. Draft 3, April 21, 2003. http://www.aapor.org/interviewfalse.pdf