Trafikdage på Aalborg Universitet 2014 ISSN 1603-9696 1 Intentions to use bike-sharing for holiday cycling: an application of the Theory of Planned Behavior Sigal Kaplan, Francesco Manca, Thomas A.S. Nielsen, Carlo G. Prato Department of Transport, Technical University of Denmark Abstract This study explored the behavioral factors underlying tourist intentions to use urban bike-sharing for recreational cycling while on holiday. The analytical framework relied on the Theory of Planned Behavior relating tourist intentions to pro-cycling attitudes, interest in bicycle technology, pro-cycling subjective norms and perceived cycling ease. The case-study focused on the new bike-sharing system in Copenhagen (Denmark) and questioned 655 potential tourists about a hypothetical holiday scenario. Structural equation models revealed: (i) the great interest in using bike-sharing, frequently and for multiple purposes; (ii) the relation between holiday cycling and living in a cycling-friendly country, past cycling experience and habitual mode choice; (iii) the appeal of electric bicycles to tourists with high interest in bicycle technology, low perceived cycling ease and weak pro-cycling norms; (iv) the relation between frequent and multi-purpose cycling intentions and stronger pro-cycling attitudes and norms, and greater perceived likelihood that the holiday partners would cycle. 1. Introduction Bicycle tourism took roots in the late 19th century and remained a marginal niche for over a century until the last decade (Lamont, 2009). Nowadays, cycle holidays are gaining momentum, although they represent around 2-4% of the total holidays (Weston et al., 2012). Nevertheless, current trends in cycling demand and supply indicate a significant market potential for holiday cycling. Unlike cycle holidays where cycling is the main purpose, holiday cycling involves the occasional use of the bicycle as an alternative mode of transportation for exploring a destination (Ritchie, 1998; Downward and Lumsdon, 2001). From the demand perspective, alongside high cycling rates in established cycling countries in Europe (Pucher et al., 2010; Souffriau et al., 2011), the number of recreational cyclists is rapidly growing in car- oriented countries such as the U.S., Canada, and Australia (Moudon et al., 2005; Heesch et al., 2012). From the supply perspective, alongside the on-going development of national and European scenic cycling routes and networks, holiday cycling is widely accessible because many cities are initiating cycling-friendly policies, bike paths, and bike-sharing schemes (e.g., Pucher et al., 2010). Recent estimates of the market share of bicycle tourism in Europe on the basis of cycle holidays and daily cycling excursions revealed that, although
Transcript
Trafikdage på Aalborg Universitet 2014 ISSN 1603-9696 1
Intentions to use bike-sharing for holiday cycling:
an application of the Theory of Planned Behavior
Sigal Kaplan, Francesco Manca, Thomas A.S. Nielsen, Carlo G. Prato
Department of Transport, Technical University of Denmark
Abstract This study explored the behavioral factors underlying tourist intentions to use urban bike-sharing
for recreational cycling while on holiday. The analytical framework relied on the Theory of Planned
Behavior relating tourist intentions to pro-cycling attitudes, interest in bicycle technology, pro-cycling
subjective norms and perceived cycling ease. The case-study focused on the new bike-sharing system in
Copenhagen (Denmark) and questioned 655 potential tourists about a hypothetical holiday scenario.
Structural equation models revealed: (i) the great interest in using bike-sharing, frequently and for multiple
purposes; (ii) the relation between holiday cycling and living in a cycling-friendly country, past cycling
experience and habitual mode choice; (iii) the appeal of electric bicycles to tourists with high interest in
bicycle technology, low perceived cycling ease and weak pro-cycling norms; (iv) the relation between
frequent and multi-purpose cycling intentions and stronger pro-cycling attitudes and norms, and greater
perceived likelihood that the holiday partners would cycle.
1. Introduction Bicycle tourism took roots in the late 19th century and remained a marginal niche for over a
century until the last decade (Lamont, 2009). Nowadays, cycle holidays are gaining momentum, although
they represent around 2-4% of the total holidays (Weston et al., 2012). Nevertheless, current trends in
cycling demand and supply indicate a significant market potential for holiday cycling. Unlike cycle holidays
where cycling is the main purpose, holiday cycling involves the occasional use of the bicycle as an
alternative mode of transportation for exploring a destination (Ritchie, 1998; Downward and Lumsdon,
2001). From the demand perspective, alongside high cycling rates in established cycling countries in Europe
(Pucher et al., 2010; Souffriau et al., 2011), the number of recreational cyclists is rapidly growing in car-
oriented countries such as the U.S., Canada, and Australia (Moudon et al., 2005; Heesch et al., 2012). From
the supply perspective, alongside the on-going development of national and European scenic cycling routes
and networks, holiday cycling is widely accessible because many cities are initiating cycling-friendly policies,
bike paths, and bike-sharing schemes (e.g., Pucher et al., 2010). Recent estimates of the market share of
bicycle tourism in Europe on the basis of cycle holidays and daily cycling excursions revealed that, although
lgl
Maskinskrevet tekst
lgl
Tekstboks
Denne artikel er publiceret i det elektroniske tidsskrift Artikler fra Trafikdage på Aalborg Universitet (Proceedings from the Annual Transport Conference at Aalborg University) ISSN 1603-9696 www.trafikdage.dk/artikelarkiv
Trafikdage på Aalborg Universitet 2014 ISSN 1603-9696 2
countries with established cycling culture and high cycling rates remain the most appealing, other tourist
destinations such as Italy, Spain, Hungary and Poland are observing a rapid increase in cycle tourism
(Weston et al., 2012).
The interest in cycle tourism is relatively new and the use patterns of bicycle infrastructure for
tourism have been scarcely explored (Deenihan et al., 2013). Most of the existing studies focused on scenic
regional, national and European cycling routes and networks. Some studies analyzed the preferences of
recreational cyclists for route attributes. Ritchie (1998) showed that cyclists in New Zealand prefer circular
scenic routes with high road safety and low traffic congestion. Downward and Lumsdon (2001) found that
recreational cyclists in Staffordshire Moorlands seek scenic bike paths that are marked and traffic free, with
service and refreshment areas. Chen and Chen (2013) concluded that recreational cyclists in Taiwan prefer
bike paths with attractions, refreshment and maintenance areas. Other studies monitored the use patterns
of specific bicycle trails. Cope et al. (2003) described the cyclist population using the UK National Cycle
Network in terms of socio-economic characteristics, cycling experience and purpose. Lumsdon et al. (2004)
revealed that the North Sea cycle route in England is mainly used for short recreational trips and daily
excursions. Deenihan et al. (2013) provided details regarding the use of the Great Western Greenway in
Ireland by tourists and locals under various weather conditions. Two studies focused on GIS tools for the
development of recreational cycling. Souffriau et al. (2011) suggested a path-finding algorithm to help
cyclists plan their route in a web-based bicycle route planner for East Flanders in Belgium. Bíl et al. (2012)
created a unified GIS database representing the cycle infrastructure in the Czech Republic.
The current study is the first to explore the behavioral factors underlying the intentions to use
urban bike-sharing for recreational cycling by potential tourists during their holiday. The case study focuses
on the new generation bike-sharing system in Copenhagen (Denmark). The study aims at (i) evaluating the
market potential for tourists given an operational and pricing scheme and uncovering the motivators
underlying this potential, and (ii) understanding the attractiveness of the design characteristics for tourists
and comprehending the bike rental frequency and purpose. The analytical framework is based on the
Theory of Planned Behavior (TPB) linking behavioral intentions to attitudes, subjective norms and perceived
behavioral control (Ajzen, 1991). Because at the time of this study the bike-sharing system was only at the
pilot stage, the data for the analysis derived from a survey among an international sample of 655 adults
requested to state their intentions to use the new bike-sharing system during a hypothetical vacation in
Copenhagen. The analysis was conducted by means of structural equation modeling (SEM) because of its
suitability to encompass joint decisions and to accommodate latent attitudinal factors alongside observed
characteristics.
Addressing the factors underlying the intentions to use bike-sharing systems in cities is important
from both the tourist and the societal perspective. From the tourist perspective, bike-sharing systems
provide the possibility to use a healthy, enjoyable, and relatively inexpensive door-to-door transport mode
at the holiday destination. Cycling carries high physical and mental health benefits, even when considering
accident and air pollution risks for cycling in urban areas. The benefits are higher in cities with off-road bike
paths and when choosing routes with low-traffic volumes (Teschke et al., 2012). From the societal
perspective, considerable tourist influx impose a demand pressure on the city public transport and road
infrastructure, and generate negative externalities, in particular where the tourism intensity is high and the
transport system is not designed to accommodate such influx (Albalate and Bel, 2010). In such cities,
understanding the factors shaping tourist demand for bike-sharing systems could alleviate road congestion,
public transport overcrowding, air pollution and noise.
Currently there are 375 bike-sharing schemes operating in cities across 33 countries, including
iconic cycling cities such as Amsterdam and Copenhagen, and major tourist destinations that are not
Trafikdage på Aalborg Universitet 2014 ISSN 1603-9696 3
naturally associated with cycling such as London, Paris and Barcelona (Parks et al. , 2013). While cycle-hire
facilities are less important in rural areas for cycle tourists who usually bring their own bike (e.g., Simonsen
et al., 1998; Downward and Lumsdon, 2001), the market potential of such systems among the general
tourist population could be higher. A study conducted on the island of Bornholm in Denmark found that
20% of all the tourists hired a bicycle during their stay (Simonsen et al., 1998). While many bike-sharing
systems operate in major tourist destinations, studies on their market penetration focused on demand
from local residents (Shaheen et al., 2011; Bordagaray et al., 2012; Fishman et al., 2012), and thus their
main focus was on the system efficiency for utilitarian trips. Studies on bike-sharing use patterns in such
destinations do not differentiate between local residents and tourists (e.g., Kaltenbrunner et al., 2010;
Ogilvie and Goodman, 2012; O’Brien et al., 2013). The appeal of the new generation of bicycle-sharing
systems for holiday cycling has not been investigated.
The paper is structured as follows. The next section presents the behavioral framework and
mathematical modelling approach. Then, the context of the bike-sharing system in Copenhagen as the
tourist destination and the survey design are described. Last, results are presented and discussed, and
conclusions are drawn.
2. Methodology
2.1 Behavioral framework
The behavioral framework hypothesized in the current study to explain the cycling holiday
intentions of potential tourists in an established cycling city is shown in Figure 1.
Figure 1 – Behavioral framework
The hypothesized behavioral framework was built upon the TPB latent constructs (Ajzen, 1991) as
its core, due to its established behavioral support in a wide variety of behaviors. According to the theory,
favorable attitudes and subjective norms and greater perceived behavioral control of conducting the
behavior lead to stronger intentions to act. These intentions will eventually transform into observed
behavior, provided the availability of resources and the ability to choose one’s own behavior.
The investigated attitudes included positive attitudes towards cycling and towards the innovative
features of the bicycle sharing system. The positive attitudes towards holiday cycling consisted of interest
in experiencing cycling culture, interest in environmentally friendly and physically active holiday, and wish
to save time and money. The positive attitudes towards the bike-sharing system included the appeal of the
electric bicycles due to their high-tech vibe, speed and ease of riding and interest in using the GPS for
navigating.
Trafikdage på Aalborg Universitet 2014 ISSN 1603-9696 4
The subjective norms were related to the country of residence, and comprised subjective norms of
cycling and road behavior towards cycling, because the interweave of these norms has a direct impact on
cyclists’ fear of traffic and self-exclusion from cycling altogether (Chataway et al., 2014). The cycling norms
referred to utilitarian and recreational cycling behavior of family, friends and the community, and general
positive perception of cycling for recreation. The road behavior norms referred to drivers’ general respect
for cyclists, norms regarding cyclists prerogative to share the road, drivers’ willingness to share the road
with cyclists, and general perceptions in the community regarding cycling safety and security.
The perceived behavioral control in the context of transport mode choice intentions can be
interpreted as both the amount of choice involved in the action, namely choosing a transport mode on the
basis of availability constraints, and the perceived ease of the individual choosing a transport mode due to
physical ability and cognitive skills. In the current study, the second interpretation was adopted with
respect to cycling as a holiday travel mode. The perceived difficulies associated with holiday cycling were
related to cycling and use of the bike-sharing system. The perceived difficulties related to cycling were
discomfort due to cycling in hot or rainy weather, physical difficulty in cycling long distances and over the
course of several hours, risk of cycling in mixed traffic and across intersections, risk associated with cycling
along crowded cycling paths, and unease associated with wearing a helmet while cycling. The perceived
difficulties associated with using the bike-sharing system were related to locating the bicycle docking
stations, concerns associated with the automatic payment system, difficulty to use the GPS while cycling,
security concerns associated with the responsibility for the bicycles, and language barriers.
The TPB constructs were hypothesized to be related to four groups of observed individual
characteristics including demographics, habitual travel mode, cycling experience and previous holiday
cycling behavior. Positive cycling experience was found in a recent study to play a key role in the formation
of future intentions to cycle for utilitarian purposes (Sigurdardottir et al., 2013). In the current study, the
roles of habitual mode choice and previous holiday cycling behavior were explored with respect to holiday
cycling intentions.
In addition to the TPB latent constructs, the preferred holiday scenario was hypothesized to be
related to holiday cycling intentions. A recent study among adolescents in Denmark found that
hypothesized visions of the future were related to adolescent intentions to commute by bicycle or by car as
adults (Sigurdardottir et al., 2013). Therefore, this study investigated the hypothesis that potential tourists’
holiday cycling intentions are related to the vision of their holiday with respect to stay duration, preferred
accommodation, propensity to use motorized travel modes during the vacation, travel party size and
propensity of the travel partners to cycle.
2.2 Mathematical model
The hypothesized behavioral model structure was investigated by applying structural equation
modeling (SEM). This methodology and its application in travel behavior research in the last three decades
were reviewed by Golob (2003).
The model in this study contained three sets of equations: measurement equations, structural
equations linking the latent attitudinal constructs to individual socioeconomic characteristics, and
structural equations relating the latent attitudinal constructs to tourists’ holiday cycling intentions in
accordance with the path diagram of the hypothesized behavioral model shown in figure 1 and discussed in
the previous section. The parameters of the three sets of equations were estimated simultaneously by
using Maximum Likelihood with Huber-White covariance adjustment (Yuan and Bentler, 2000). Standard
errors were calculated by adopting the White’s sandwich-based method that produces robust statistics in
the presence of non-normality of indicators and categorical variables (White, 1980). Alongside the
traditional descriptive measure of chi-square test of absolute model fit, additional descriptive goodness-of-
Trafikdage på Aalborg Universitet 2014 ISSN 1603-9696 5
fit measures were the standardized root mean residual (SRMR) (Bollen, 1989) and the Root Mean Square of
Approximation (RMSEA) (Browne and Cudeck, 1993).
3. Data
3.1 Copenhagen bike-sharing
Copenhagen, the capital city of Denmark, has a vast off-road cycling infrastructure and an
established cycling culture and aims towards becoming the “world’s best bicycle city” (Gössling, 2013).
About 1.2 million kilometers are cycled daily in Copenhagen and the bicycle accounts for 36% of the trips to
work and education. Among Copenhageners, 84% have access to a bike, 68% cycle at least once a week,
and 30% of the preschool children arrive to school by bike. In a survey conducted by the city of
Copenhagen, 67% of the cyclists perceived the city as safe for cycling (Gössling, 2013).
The bicycle infrastructure in Copenhagen consists of roughly 350 kilometers of segregated cycle
tracks, 23 kilometers of on-road lanes, and 43 km of off-road green bike paths. A typical Copenhagen-style
bike path includes a unidirectional 2.2-2.5 meters wide path, separated from the road and the sidewalk by
height and by pavement type. There are nine types of cycling tracks and lanes and eight types of
intersection designs suitable for various land uses, street functions, traffic and cyclist volumes (e.g., Nelson,
2007). During 2010, about 20 million Euros were dedicated to improvements in bicycle infrastructure in
Copenhagen (City of Copenhagen, 2011). The infrastructure development is accompanied by campaigns
such as the “Cycling welcoming campaign” for encouraging new residents to cycle in Copenhagen, “Bike to
work” for boosting cycling to work, and “All kids bike” for promoting cycling to school (Cycling Embassy of
Denmark, 2012).
Recent cycling policy documents in Copenhagen showed a long-term commitment to maintain the
competitive edge of the bicycle through setting ridership goals, planning for bicycles, investing in
infrastructure and marketing campaigns, and monitoring programs with emphasis on travel time, safety,
security and comfort (City of Copenhagen, 2002, 2012). The plans include improving and extending the
bicycle network in terms of connectivity and quality, increasing the number of bicycle parking facilities,
developing regional bicycle highways, and improving the integration with public transport. Gössling (2013)
provides a detailed review of the policy measures and marketing strategies.
The new generation city and commuter bike-sharing system Gobike replaces the CityBike system
that was in operation from 1995 to 2011, and has a special focus on tourists in addition to the residents and
commuters. The system will offer 2,000 bicycles in 60 docking racks around the city located in public
transport stations, main tourist attractions, cruiseliner docks, and town squares. An electronic lock and
tracker will allow leaving the bicycle on the street outside the docking station, and a 24-hour service will
assist users. The bicycle will include unisex regular and electric bicycles with a 40 km battery range and a
speed restriction for increasing the safety of tourists, the possibility to rent a helmet and a child-seat. A
smartphone app will allow locating the nearest bicycle racks, checking bicycle availability, reserving a bike
and paying on-line by a subscription, credit card, and travel agency, cruiseliner or hotel vouchers. Tablet
computers mounted on the bike and operated in English will serve for booking and paying for the bike and
for two options of route planning. The first option will be a route planner showing the route between
chosen locations, allowing the user to choose between fast and scenic routes, and recommending coffee
shops for a break. The second option will offer three electronically guided tours around the city with
explanations of the attractions along the way. The tablet will also provide tips on attractions, train
timetables, and will allow buying tickets for public transport. The pilot for the system has been launched in
October 2013 and the system is expected to enter in operation during spring 2014.
Trafikdage på Aalborg Universitet 2014 ISSN 1603-9696 6
3.2 Survey design
The data were collected by means of a tailor-made web-based questionnaire. The survey contained
three parts.
The first part concerned individual information including age, gender, current country of residence,
past 5-year residence or longer in another country, frequency of bicycle, public transport and car use, and
questions related to cycling experience both daily and during vacations. The questions concerned cycling
experience in years, self-perception as a recreational cyclist, utilitarian cyclist or both, cycling during
previous holidays, and cycling during visits in perceived cycling-friendly cities.
The second part concerned engaging in a voluntary future-oriented mental time travel (FMTT)
exercise to construct a preferred hypothetical holiday scenario in Copenhagen. The questions concerned
the length of stay, accommodation type, accompanying party and the preference for holiday cycling. The
importance of the respondents constructing the hypothetical holiday scenario rather than being given a
scenario is twofold: firstly, it enables representing tourist holiday preferences heterogeneity; secondly,
FMTT is a cognitively demanding task that requires top-down schema-driven construction in order to
recombine episodic memories into a representation of the future (Berntsen and Bohn, 2010). The
hypothetical vacation scenario construction increases the realism and clarity of the holiday context, thus
facilitating the specific task of the hypothetical transport mode choice.
The third part focused on the intentions to use seven transport mode options provided the
preferred hypothetical holiday scenario and a short description of the system. The options included the
new bike-sharing system and reflected the actual transport mode and pricing options available for tourists
in Copenhagen. The questions concerned the likelihood of using each mode rather than the choice
between modes since various travel modes can be used during the same vacation. The car options were car
rental for one week (280€) or three days (150€). The public transit options were 3-day (25€ per person) and
1-day (10€ per person) city transit pass and a 10-trip transit card (27€ per person). The bike-sharing options
comprised a base fee of 10€ per person, an additional fee of 0.55€ per hour per person for a regular
bicycle, and 0.80€ per hour per person for an electric bicycle. Two additional questions elicited the cycling
frequency and the likelihood of cycling for various activities during the holiday including cultural activities,
shopping, sightseeing, wine and dine, and visiting family and friends. The likelihood of choosing each travel
mode and cycling to the various activities were measured on a 5-point Likert scale ranging from highly
unlikely to highly likely.
The last part of the questionnaire concerned the TBP latent constructs. The attitudes included
experiencing the Danish cycling culture, having an environmentally friendly and healthy vacation, having an
affordable vacation, and using the electric bicycle and the GPS pathfinder. The subjective norms concerned
the country of origin and targeted cycling by friends and family, cycling as a social norm and drivers’
attitudes towards sharing the road with cyclists. The perceived behavioral control referred to the perceived
ease of cycling and using the bike-sharing system: items related to the perceived cycling ease included
weather conditions, cycling time and distance, perceived cycling safety on-road and the possibility of
crowded cycle paths; items related to the bike-sharing system included difficulties related to technology
(e.g., using the GPS, the tablet computer and smartphone app), difficulty to find the bicycle docks and fear
of losing the bike. The TBP items were measured on a 5-point Likert scale ranging from strongly disagree to
strongly agree.
3.3 Survey administration
The survey administration to a sample of potential tourists was conducted during November 2013
via on-line social networks of students residing in Copenhagen due to three main reasons. Firstly, visiting
friends and relatives (VFR) at the holiday destination is an important motivator in both domestic and
Trafikdage på Aalborg Universitet 2014 ISSN 1603-9696 7
international tourism as a travel purpose and accommodation form (e.g., Backer, 2012), and in particular
when students studying abroad are concerned (e.g., Michael et al., 2004). Secondly, social networks are
gaining popularity for both branding and promoting urban tourist destinations (Zhou and Wang, 2014), as
well as for information search and organization of holiday trips by tourists (Parra-López et al., 2011). Last,
social networks offer the possibility to collect a large international sample with relative ease, low cost, high
quality and reliability (Efthymiou and Antoniou, 2012). In order to verify the sample reliability, the
respondents were offered to participate in a raffle of 10 “I love Copenhagen” T-shirts, as an incentive for
providing their contact details at the end of the survey.
Alongside the advantages of social networks as media for data collection among potential tourists,
the study is not without limitations. Firstly, the respondents are a non-representative sample of the
population and depend on internet accessibility. The distribution of the sample demographics, cycling
habits, and cycling experience, suggest that the sample exhibits heterogeneity across population segments,
which is in line with the approach taken by Efthymiou and Antoniou (2012) for transport survey
administration via social media. Secondly, the holiday scenario refers to an iconic cycling city, well-known
for its cycling culture and safe infrastructure, and in which the perceived safety is much higher compared to
emerging cycling cities (Chataway et al., 2014). Bearing these limitations in mind, the obtained results are
to be viewed as an indicative or diagnostic tool rather than a statistically representative sample of the
tourist population, and cannot be generalized to emerging cycling cities where the cycling culture is less
visible and the tension between cyclists and motorists is greater.
4. Results
4.1 Sample characteristics and preferred holiday scenario
The survey yielded 801 questionnaies, of which 655 (81.8%) questionnaires were completed
without missing data, and thus served for the data analysis and model estimation. The sample size is much
larger than Nunnally’s (1967) widely applied rule of thumb for SEM analysis, requiring 10 observation for
each of the 35 indicators used in this study in setting a lower bound for the sample size adequacy.
The sample consists of completed questionnaires from 35 countries, mainly from Europe but also
from other world regions. The sample demographics, habitual travel modes, cycling purpose and
experience are portrayed in Table 1. The respondents in the sample are interested in holiday cycling, as
47.8% visited cycling-friendly cities once or twice and 16.5% visit such cities often. Of the respondents who
visited cycling-friendly cities, 44.2% visited either Copenhagen or Amsterdam. While on holiday, 32.2% of
the respondents rented a bicycle once or twice and 7.0% rented a bicycle often. Only a small percentage
brought their own bicycle on vacation: 7.9% once or twice and 3.5% often. Regarding other travel modes
while on holiday, only 13.7% often rented a car, while 51.5% never rented a car and 85.6% often used
public transport.
In terms of the preferred holiday in Copenhagen, 73.1% prefer to stay approximately one week,
16.0% two weeks and 10.9% longer periods. The most commonly preferred accommodation forms are
Bed&Breakfast (33.1%), 3-star hotels (20.5%), family and friends (15.9%), and youth hostels (14.4%). Almost
all the respondents prefer to spend their vacation with other people: 54.5% with a friend or a spouse,
12.4% with several family members, and 31.8% with a group of friends. Among the respondents, 28.7%
perceive that their accompanying persons are highly likely to cycle, 36.8% that they are likely to cycle, and
19.8% that some of their accompanying persons are likely to cycle while others are not.
Trafikdage på Aalborg Universitet 2014 ISSN 1603-9696 8
Table 1 - Sample characteristics
Variable Categories (Percent)
Gender Male Female
45.2 54.8
Age < 25 25-34 35-44 45-54 55+
23.5 53.3 12.4 6.4 4.4
Residence in a cycling-friendly country
a
No Yes
79.7 20.3
Past long-term residence in a cycling-friendly country
b
No Yes
93.9 4.1%
Habitual car use frequency Daily
2-3 times weekly
Once a week
2-3 times monthly
Rarely
37.6 16.8 10.5 8.9 26.3
Habitual public transport use frequency
Daily 2-3 times
weekly Once a week
2-3 times monthly
Rarely
24.1 15.1 7.9 13.1 39.7
Habitual bicycle use frequency Daily
2-3 times weekly
Once a week
2-3 times monthly
Rarely
20.8 12.4 6.0 9.0 51.9
Habitual cycling purpose Non-cyclist Recreation Utilitarian Both
17.1 28.1 25.2 29.6
Cycling experience Non-cyclist < 1 year 2-3 years 3-4 years > 5 years
17.1 5.3 4.9 4.1 68.5
Notes: a According to the ranking of the European Cyclist Federation (i.e., Denmark, Netherlands, Sweden, Finland, Germany,
Belgium, Austria, Hungary, Slovakia and the United Kingdom) in addition to Switzerland, China, Japan, India and India; b five years or
more are considered as a long-term residence
4.2 Attitudes, norms and difficulties associated with cycling
The attitudes, subjective norms and perceived behavioral control related to holiday cycling were
obtained by means of exploratory factor analysis. Tests of internal consistency and sample adequacy
constituted the necessary preliminary conditions for obtaining meaningful factors. The Spearman
correlation matrix among the indicators provided the input for both the tests and the factor analysis. The
items obtained in the survey show good internal consistency (Cronbach's alpha = 0.709) and good sampling
adequacy according to Kaiser-Meyer-Olkin (KMO) measure, both at the overall (KMO = 0.797), and at the
single item level (KMO = 0.538 - 0.906). The Spearman correlations matrix contained correlations with
absolute value between 0.3-0.7, and the value of its determinant was 2.4E-5, establishing correlations
without multi-collinearity. The result of the Bartlett’s sphericity test rejected the null hypothesis of an
identity correlation matrix (p = 0.000).
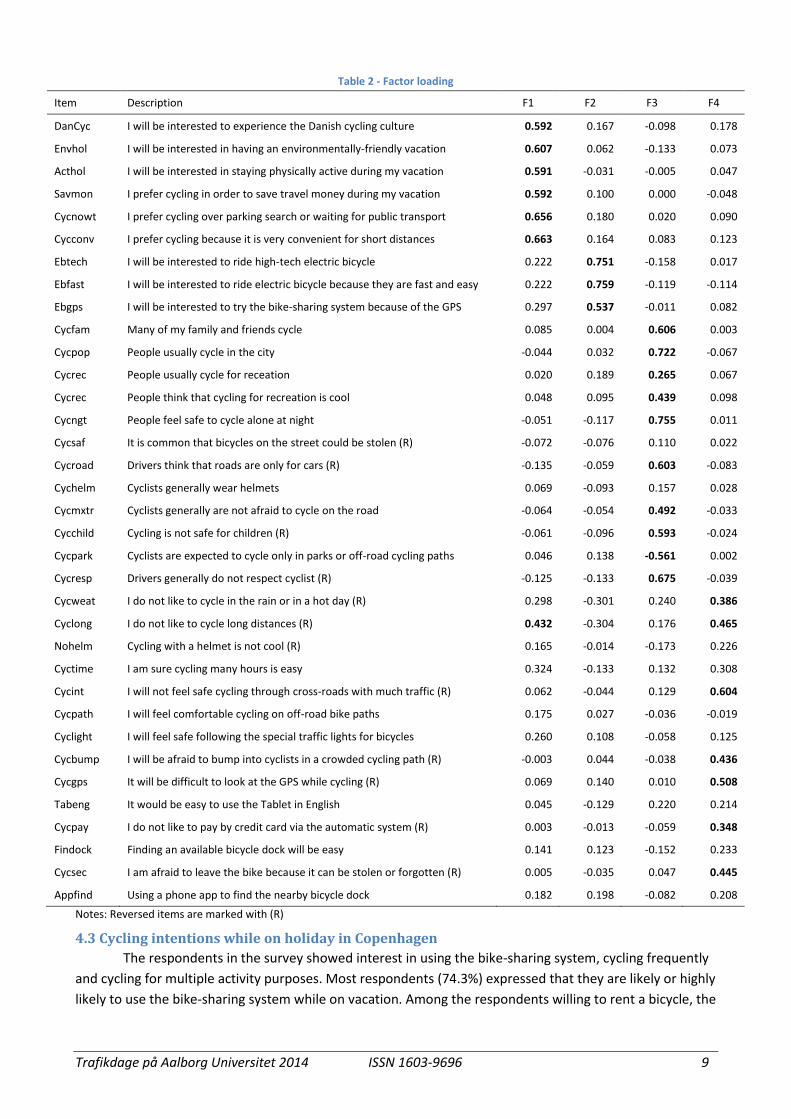
Exploratory principal axis factor analysis with subsequent orthogonal rotation (Varimax rotation
with Kaiser normalization) produced four factors according to the scree-plot analysis. The factor loadings
are presented in table 2 where, in order to facilitate factor labeling, the dominant items marked in bold
were defined as those with an absolute value of the loading greater than 0.35. The first factor (F1) was
named "pro-cycling attitudes" and related to health, environment and convenience. The second factor (F2)
was identified as "interest in bicycle technology". The third factor (F3) was labeled "pro-cycling subjective
norms" and referred to cycling norms and respect for cyclists. The last factor (F4) was defined "perceived
cycling ease" and concerned weather, distance, traffic, crowding on cycling path, use of GPS while cycling
and use of the automatic payment system.
Trafikdage på Aalborg Universitet 2014 ISSN 1603-9696 9
Table 2 - Factor loading
Item Description F1 F2 F3 F4
DanCyc I will be interested to experience the Danish cycling culture 0.592 0.167 -0.098 0.178
Envhol I will be interested in having an environmentally-friendly vacation 0.607 0.062 -0.133 0.073
Acthol I will be interested in staying physically active during my vacation 0.591 -0.031 -0.005 0.047
Savmon I prefer cycling in order to save travel money during my vacation 0.592 0.100 0.000 -0.048
Cycnowt I prefer cycling over parking search or waiting for public transport 0.656 0.180 0.020 0.090
Cycconv I prefer cycling because it is very convenient for short distances 0.663 0.164 0.083 0.123
Ebtech I will be interested to ride high-tech electric bicycle 0.222 0.751 -0.158 0.017
Ebfast I will be interested to ride electric bicycle because they are fast and easy 0.222 0.759 -0.119 -0.114
Ebgps I will be interested to try the bike-sharing system because of the GPS 0.297 0.537 -0.011 0.082
Cycfam Many of my family and friends cycle 0.085 0.004 0.606 0.003
Cycpop People usually cycle in the city -0.044 0.032 0.722 -0.067
Cycrec People usually cycle for receation 0.020 0.189 0.265 0.067
Cycrec People think that cycling for recreation is cool 0.048 0.095 0.439 0.098
Cycngt People feel safe to cycle alone at night -0.051 -0.117 0.755 0.011
Cycsaf It is common that bicycles on the street could be stolen (R) -0.072 -0.076 0.110 0.022
Cycroad Drivers think that roads are only for cars (R) -0.135 -0.059 0.603 -0.083
Cychelm Cyclists generally wear helmets 0.069 -0.093 0.157 0.028
Cycmxtr Cyclists generally are not afraid to cycle on the road -0.064 -0.054 0.492 -0.033
Cycchild Cycling is not safe for children (R) -0.061 -0.096 0.593 -0.024
Cycpark Cyclists are expected to cycle only in parks or off-road cycling paths 0.046 0.138 -0.561 0.002
Cycresp Drivers generally do not respect cyclist (R) -0.125 -0.133 0.675 -0.039
Cycweat I do not like to cycle in the rain or in a hot day (R) 0.298 -0.301 0.240 0.386
Cyclong I do not like to cycle long distances (R) 0.432 -0.304 0.176 0.465
Nohelm Cycling with a helmet is not cool (R) 0.165 -0.014 -0.173 0.226
Cyctime I am sure cycling many hours is easy 0.324 -0.133 0.132 0.308
Cycint I will not feel safe cycling through cross-roads with much traffic (R) 0.062 -0.044 0.129 0.604
Cycpath I will feel comfortable cycling on off-road bike paths 0.175 0.027 -0.036 -0.019
Cyclight I will feel safe following the special traffic lights for bicycles 0.260 0.108 -0.058 0.125
Cycbump I will be afraid to bump into cyclists in a crowded cycling path (R) -0.003 0.044 -0.038 0.436
Cycgps It will be difficult to look at the GPS while cycling (R) 0.069 0.140 0.010 0.508
Tabeng It would be easy to use the Tablet in English 0.045 -0.129 0.220 0.214
Cycpay I do not like to pay by credit card via the automatic system (R) 0.003 -0.013 -0.059 0.348
Findock Finding an available bicycle dock will be easy 0.141 0.123 -0.152 0.233
Cycsec I am afraid to leave the bike because it can be stolen or forgotten (R) 0.005 -0.035 0.047 0.445
Appfind Using a phone app to find the nearby bicycle dock 0.182 0.198 -0.082 0.208
Notes: Reversed items are marked with (R)
4.3 Cycling intentions while on holiday in Copenhagen
The respondents in the survey showed interest in using the bike-sharing system, cycling frequently
and cycling for multiple activity purposes. Most respondents (74.3%) expressed that they are likely or highly
likely to use the bike-sharing system while on vacation. Among the respondents willing to rent a bicycle, the
Trafikdage på Aalborg Universitet 2014 ISSN 1603-9696 10
majority (60.5%) does not have a preference between regular and electric bicycles, 31.3% has a clear
preference for renting a regular bicycle, and only 8.2% has a clear preference for an electric bicycle. Among
the respondents, 48.4% intend to cycle daily, while 36.5% intend to cycle 2-3 times a week and 15.1%
intend to cycle once a week or less. Regarding holiday cycling purposes, most respondents are likely or
highly likely to cycle in natural areas and parks (89.5%), around the city (86.0%), and with friends and family
(80.2%). The least popular cycling purposes are cycling for shopping activities (45.2%) and in the evenings
to bars and pubs (46.1%). Most respondents (82.3%) view themselves as cycling for at least four activity
purposes.
The Shapiro-Wilk normality test (Shapiro and Wilk, 1965), reported in the appendix, rejected the
null hypothesis that the sample comes from a normal distribution, and therefore the model parameters
were estimated simultaneously by using Maximum Likelihood with Huber-White covariance adjustment
(Yuan and Bentler, 2000). Standard errors were calculated by adopting the White’s sandwich-based method
that produces robust statistics in the presence of non-normality of indicators and categorical variables
(White, 1980).
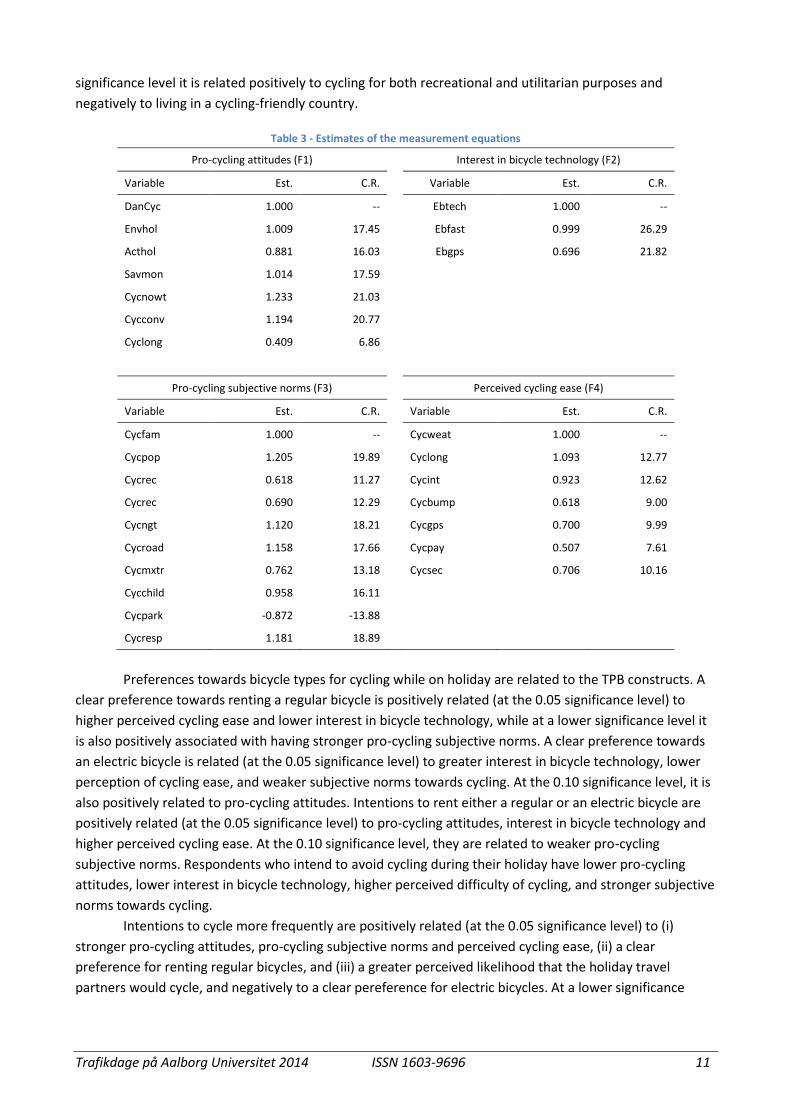
Tables 3 through 7 present the model parameter estimates and their critical ratios (C.R). Table 3
presents the measurement equations. Table 4 shows the structural equations linking the latent TPB
constructs tourists characteristics. Table 5 illustrates the structural equations linking the intentions to rent
different types of bicycle (i.e., regular, electric, regular/electric, neither) to the TPB constructs. Table 6
shows the structural equations relating the cycling frequency and multi-purpose cycling intentions to the
TPB constructs, preferred bicycle type, and relevant holiday scenario characteristics. Table 7 presents the
estimated covariance matrix for the latent variables.
Goodness-of-fit indices reveal that the model fits well, as the ratio between chi-square and degrees
of freedom is 2.67 (chi-square = 2957.476, df = 1105) which is well below the maximum acceptable value
recommended by Ullman (1996). In addition, the RMSEA is equal to 0.051 and the SRMR is equal to 0.064,
which are well below the maximum accepted values of 0.08 and 0.10 (Vandenberg and Lance, 2000). The
Construct Reliabilities were calculated for each construct and varied between 0.89 and 0.93, and the
Average Variance Explained was 0.58, which shows convergent validity in that the variance due to
measurement error is less than the variance due to the latent factors.
The TPB constructs are related to the respondents’ demographics, habitual mode choice and
holiday cycling experience.
Pro-cycling attitudes are stronger (at the 0.05 significance level) for respondents who (i) are female,
(ii) reside in a non-cycling-friendly country, (iii) cycle daily, (iv) are both recreational and utilitarian cyclists,
and (v) often rent bicycles on holidays. At a lower significance level, pro-cycling attitudes are linked
positively to frequent holidays in cycling-friendly cities and negatively to habitual weekly transit use.
Interest in bicycle technology is related (at the 0.05 significance level) to habitual daily car use and
rarely or never spending holidays in cycling-friendly cities. At a lower significance level, it is associated
negatively with current or past residence in a cycling-friendly country and positively with frequent bike
rental on holidays.
Positive subjective norms towards cycling are stronger (at the 0.05 significance level) for
respondents who (i) currently reside in cycling-friendly countries, (ii) cycle daily, (iii) are both recreational
and utilitarian cyclists. Habitual cycling with lower frequency is also positively associated with positive
subjective norms towards cycling, but at a lower significance level.
Perceived cycling ease is positively related (at the 0.05 significance level) to (i) male respondents,
(ii) habitual daily cyclists, (iii) experienced cyclists, and (iv) rarely renting bicycles on holiday, and is
negatively related (at the 0.05 significance level) to frequent daily or weekly car and transit use. At the 0.10
Trafikdage på Aalborg Universitet 2014 ISSN 1603-9696 11
significance level it is related positively to cycling for both recreational and utilitarian purposes and
negatively to living in a cycling-friendly country.
Table 3 - Estimates of the measurement equations
Pro-cycling attitudes (F1) Interest in bicycle technology (F2)