27


ICIRheocenter
S. Kubens19. Kolloquium und Workshop
Rheologische Messungen an Baustoffen
März 2010 in Regensburg
Interaction of cement and admixtures – and its
influence on rheological properties
Content
Objective and scope of projectCement-admixture interaction, rheology and routine cement production
State of scientific and technical knowledgePolymers and their dispersing power
Methods usedStandard tests, mineralogy, static and dynamic PSD, rheological
measurements, calorimetry, polymer adsorption, pore solution analysis and
microstructure
Results
Final remarks

Introduction
Annual concrete production is 8 billion cubic
metres and most of it contains dispersing
admixtures
Dispersing admixtures play an important role in
today’s concrete world
Interaction

Objective and scope of project
Tests on mortar showed a strong effect of
cement production on rheological properties
Cement is only
differing in
production date
Each mortar mix
repeated at least
3 times
0
100
200
300
400
500
24.02.05
23.05.05
01.11.06
28.11.06
04.12.06
Cement sample
Yie
ld s
tress (
Pa)
blank mix
mix containing polycarboxylate
Blank mix w/c = 0,46
No admixture
PC mix w/c = 0,36
0,11% PC1

Slump flow of mortar
Same mix design, only differing in production
date of cement (from same plant and same production line)
Water to cement ratio: 0,40
Polymer content: 0,20% PC1

Cement-admixture interaction in practice
Cement-admixture interaction
can result in too liquid or too
stiff concrete
Too stiff concrete loses its
self-levelling properties
Too liquid concrete will
segregate or increase form
pressure
Eco-SCC
Water to cement ratio: 0,60
Polymer content: 0,30% PC1

Aim of study
Measure and evaluate the effect
of variations during routine cement
production on the rheology of
mortar and concrete
Identify the constituents in cement
which lead to fluctuations in
rheology
Quantify the effect of production-
related variation on concrete
Essential for cement and concrete producers to guarantee a homogeneous
concrete production plus deeper understanding of cem-admix interaction
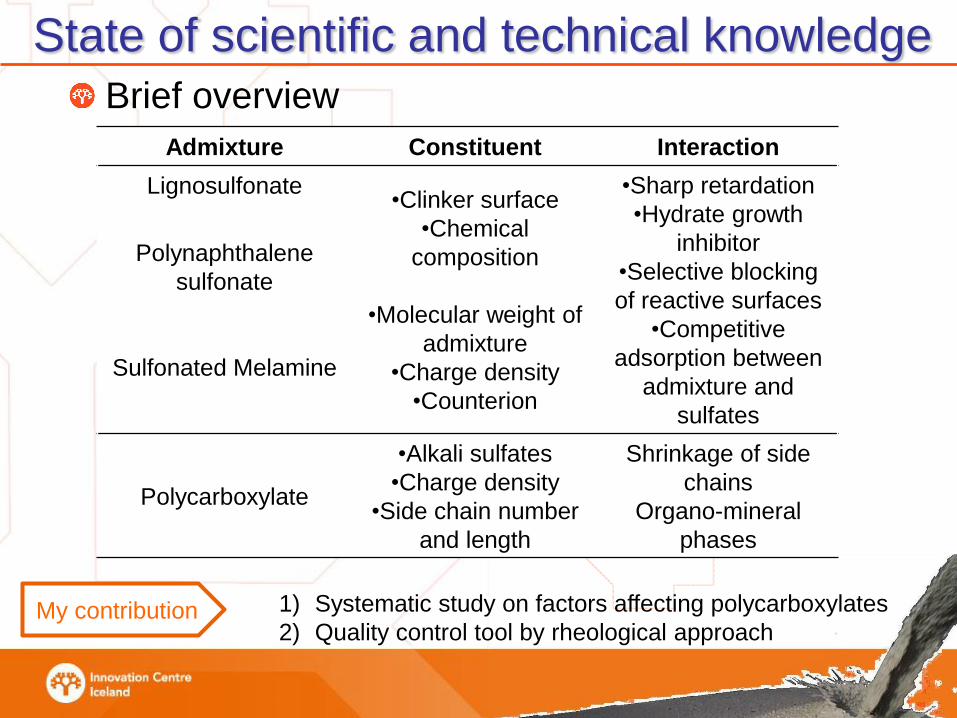
State of scientific and technical knowledge
Brief overview
Admixture Constituent Interaction
Lignosulfonate•Clinker surface
•Chemical
composition
•Molecular weight of
admixture
•Charge density
•Counterion
•Sharp retardation
•Hydrate growth
inhibitor
•Selective blocking
of reactive surfaces
•Competitive
adsorption between
admixture and
sulfates
Polynaphthalene
sulfonate
Sulfonated Melamine
Polycarboxylate
•Alkali sulfates
•Charge density
•Side chain number
and length
Shrinkage of side
chains
Organo-mineral
phases
My contribution 1) Systematic study on factors affecting polycarboxylates
2) Quality control tool by rheological approach

Methods used
Big picture
Calorimetry
Scanning
Electron
Microscopy
Chemistry,
Pore solution analysis,
adsorption data
Rheology
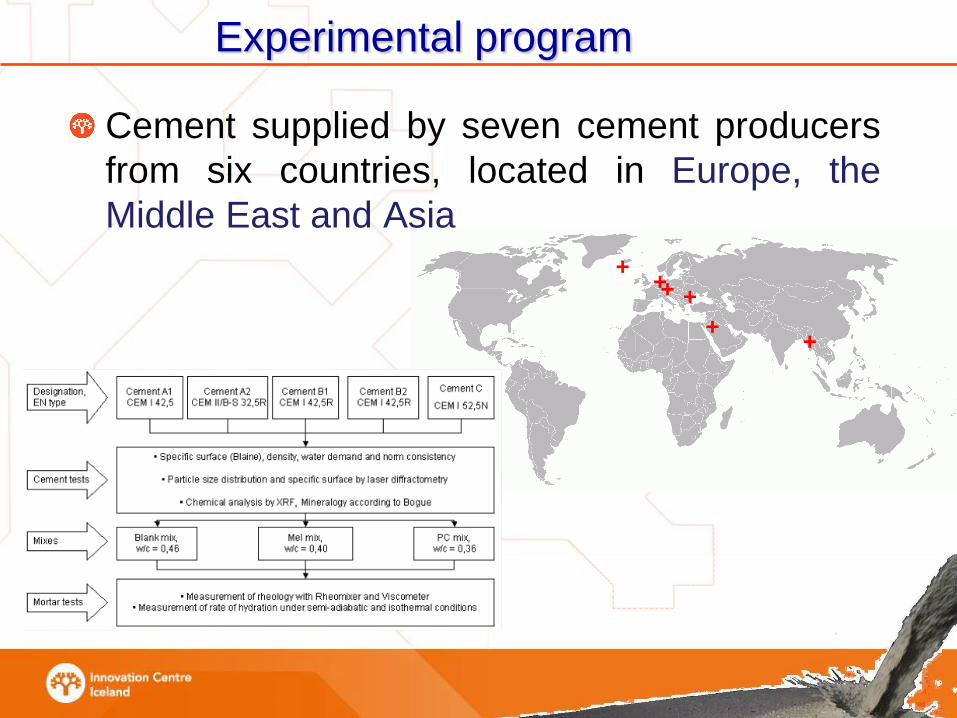
Experimental program
Cement supplied by seven cement producers
from six countries, located in Europe, the
Middle East and Asia
+
+
+
+
+
+

Results Yield stress of mortar
6 out of 29 deliveries showed a significant variation from the
mean within the test series
Water to cement ratio: 0,36
Polymer content: 0,11% PC1
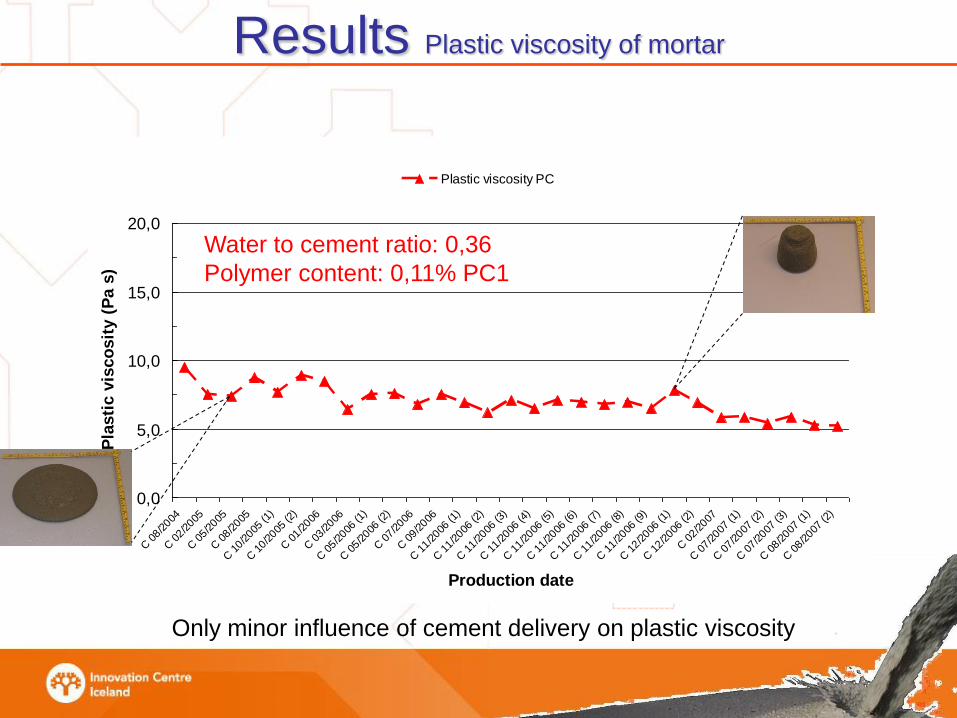
Results Plastic viscosity of mortar
0,0
5,0
10,0
15,0
20,0
C 0
8/2004
C 0
2/2005
C 0
5/2005
C 0
8/2005
C 1
0/2005
(1)
C 1
0/2005
(2)
C 0
1/2006
C 0
3/2006
C 0
5/2006
(1)
C 0
5/2006
(2)
C 0
7/2006
C 0
9/2006
C 1
1/2006
(1)
C 1
1/2006
(2)
C 1
1/2006
(3)
C 1
1/2006
(4)
C 1
1/2006
(5)
C 1
1/2006
(6)
C 1
1/2006
(7)
C 1
1/2006
(8)
C 1
1/2006
(9)
C 1
2/2006
(1)
C 1
2/2006
(2)
C 0
2/2007
C 0
7/2007
(1)
C 0
7/2007
(2)
C 0
7/2007
(3)
C 0
8/2007
(1)
C 0
8/2007
(2)
Production date
Pla
sti
c v
isco
sit
y (
Pa s
)
Plastic viscosity PC
Only minor influence of cement delivery on plastic viscosity
Water to cement ratio: 0,36
Polymer content: 0,11% PC1

Results Correlation mortar versus concrete
Low yield High yield High yieldLow yield
Production-related variations in SCC are around
10-12 cm in slump flow and ~50 Pa in yield value

Results Correlation mortar versus concrete
The devices used for rheological measurements
showed a good ability to predict the rheological
properties in concrete
On the contrary, standard tests on cement (such
as setting time and water demand) did not show
any indication of cement-admixture interaction
problem

Results constituents influencing rheology
Constituents which
influence blank mixes
have only minor or
sometimes opposite
effect in mixes with
admixturesBlank mix w/c = 0,46
No admixture
PC mix w/c = 0,36
0,11% PC1

Results aluminate phase was stable in reference cement
No influence of aluminate phase on yield value
was observed. In the reference cement, the
fluctuations in aluminate phase content were very
low.
Similar composition, but lets look on the hydration curves...

Results initital hydration process (reactive aluminate phase)
All ingredients were stored overnight in the
calorimeter -> temperature equilibrium.
Blank mix w/c = 0,46
No admixture
PC mix w/c = 0,36
0,11% PC1
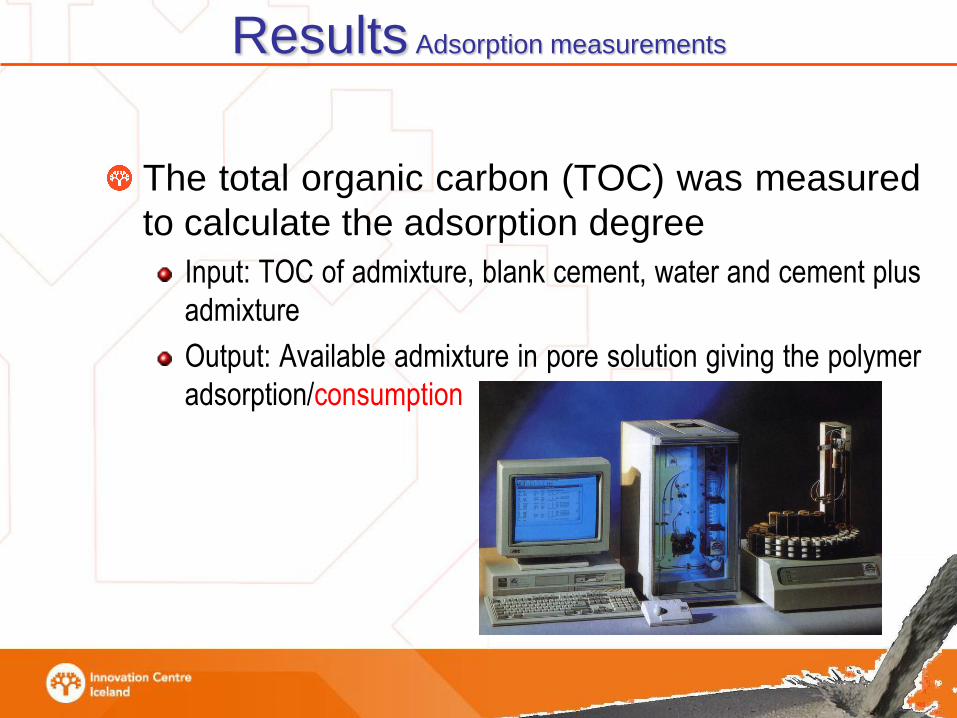
Results Adsorption measurements
The total organic carbon (TOC) was measured
to calculate the adsorption degree
Input: TOC of admixture, blank cement, water and cement plus
admixture
Output: Available admixture in pore solution giving the polymer
adsorption/consumption

Results TOC of blank cement
The TOC of blank cement is differing with
production date
0
50
100
150
200
250
300
350
TO
C (
pp
m)
of
bla
nk
pa
ste
s
Cement production date
Blank mix w/c = 0,46
No admixture

Results polymer adsorption on various cement
Cement with a high yield value (sticky mix)
adsorbed most polymers. Or in other words,
cements with a high yield value consumed
more polymers (intercalation?)
0
100
200
300
400
500
50 60 70 80 90 100Yie
ld s
tre
ss
of
mix
es
wit
h
PC
1 (
Pa)
Degree of adsorption of PC1 (%)
0
4
8
12
16
20
50 60 70 80 90 100P
las
tic
vis
co
sit
y o
f m
ixe
s
wit
h P
C1
(P
a s
)Degree of adsorption of PC1
(%)
PC mix w/c = 0,36
0,11% PC1
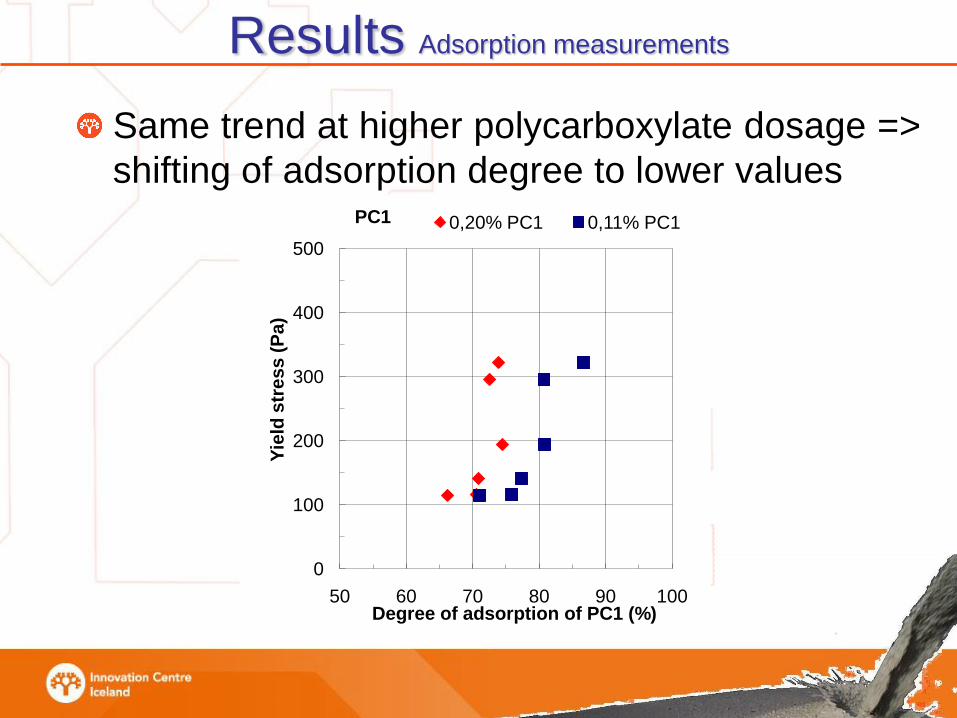
Results Adsorption measurements
Same trend at higher polycarboxylate dosage =>
shifting of adsorption degree to lower values
0
100
200
300
400
500
50 60 70 80 90 100
Yie
ld s
tress (
Pa)
Degree of adsorption of PC1 (%)
PC1 0,20% PC1 0,11% PC1
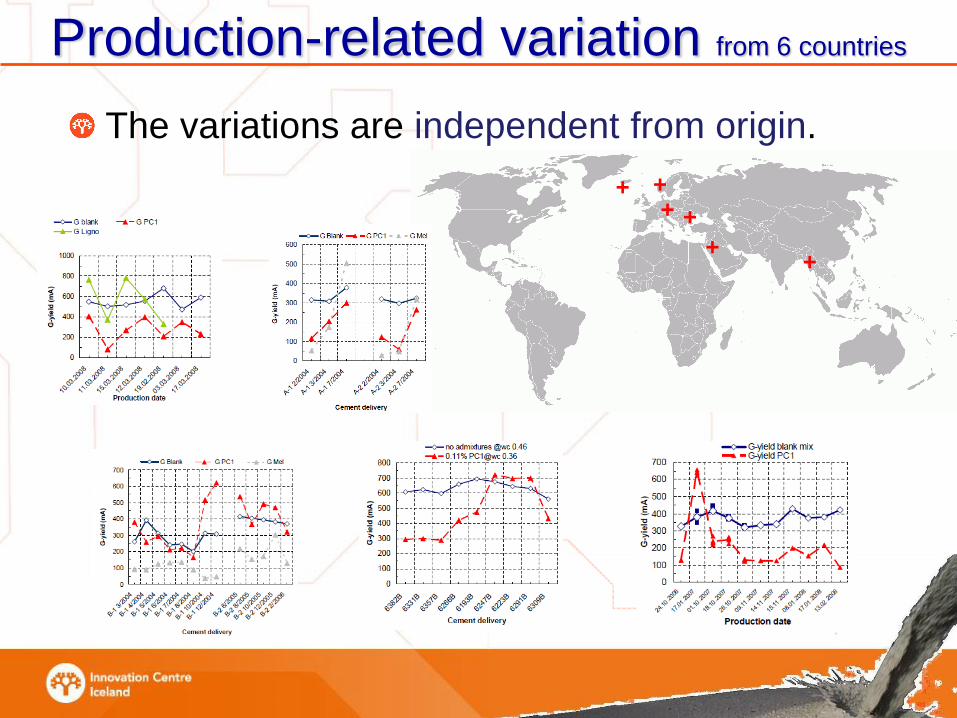
Production-related variation from 6 countries
The variations are independent from origin.
+
+
+
+
+
+

A schematic model to explain the variations
Yield stress
A property of the fluid at shear rate 0 (rest state).
It is hence mainly affected by attraction forces and
mechanical entangelments.
Plastic Viscosity
A property of the fluid already in motion.
It is hence mainly determined by parameters like
dynamic friction between the moving elements.

Yield stress
• Varying early hydration products influence the
attraction forces and mechanical entangelments
• Adsorption behaviour of polymers on cement surface
are most likely different from one delivery to another
Plastic Viscosity
• However, the influence of primary hydration products
and the lower adsorption degree on the dynamic
friction seem to be minor
A schematic model to explain the variations

Two mechanisms to explain the variations
Polymer consumption
due to excessive
ettringite
Mechanical
entanglements due to
syngenite formation

Questions?


