+ All Categories
Home > Documents > Interaction of IAPP and Insulin with Model Interfaces Studied Using Neutron Reflectometry

Interaction of IAPP and Insulin with Model Interfaces Studied Using Neutron Reflectometry

Date post: 24-Nov-2016
Category:
Upload: claus
View: 212 times
Download: 0 times
Share this document with a friend
9
Interaction of IAPP and Insulin with Model Interfaces Studied Using Neutron Reflectometry Christoph Jeworrek, Oliver Hollmann, Roland Steitz, Roland Winter, and Claus Czeslik * Fakulta ¨ t Chemie, Technische Universita ¨ t Dortmund, D-44221 Dortmund, Germany; and Helmholtz-Zentrum Berlin, D-14109 Berlin, Germany ABSTRACT The islet amyloid polypeptide (IAPP) and insulin are coproduced by the b-cells of the pancreatic islets of Langer- hans. Both peptides can interact with negatively charged lipid membranes. The positively charged islet amyloid polypeptide partially inserts into these membranes and subsequently forms amyloid fibrils. The amyloid fibril formation of insulin is also accel- erated by the presence of negatively charged lipids, although insulin has a negative net charge at neutral pH-values. We used water-polymer model interfaces to differentiate between the hydrophobic and electrostatic interactions that can drive these peptides to adsorb at an interface. By applying neutron reflectometry, the scattering-length density profiles of IAPP and insulin, as adsorbed at three different water-polymer interfaces, were determined. The islet amyloid polypeptide most strongly adsorbed at a hydrophobic poly-(styrene) surface, whereas at a hydrophilic, negatively charged poly-(styrene sulfonate) interface, the degree of adsorption was reduced by 50%. Almost no IAPP adsorption was evident at this negatively charged interface when we added 100 mM NaCl. On the other hand, negatively charged insulin was most strongly attracted to a hydrophilic, negatively charged interface. Our results suggest that IAPP is strongly attracted to a hydrophobic surface, whereas the few positive charges of IAPP cannot warrant a permanent immobilization of IAPP at a hydrophilic, negatively charged surface at an ionic strength of 100 mM. Furthermore, the interfacial accumulation of insulin at a hydrophilic, negatively charged surface may represent a favor- able precondition for nucleus formation and fibril formation. INTRODUCTION The islet amyloid polypeptide (IAPP) is a hormone that is synthesized by the b-cells of the pancreatic islets of Langer- hans. Naturally, it is involved in controlling the level of glucose in the blood. On the other hand, it is the main component of amyloid deposits occurring with type 2 dia- betes mellitus (1). The islet amyloid polypeptide is known to interact with negatively charged lipid membranes that contain, for instance, phosphatidylglycerol or phosphatidyl- serine lipids (2). This interaction was shown to accelerate amyloid fibril formation (3), and to trigger the permeabiliza- tion of lipid membranes (4). It was suggested that these two processes are independent of each other, i.e., membrane disruption can occur independent of the amyloid formation of IAPP (5). There is considerable experimental evidence that IAPP partially inserts into negatively charged lipid membranes (6,7), where transient a-helices are formed, before b-sheet and amyloid fibril formation set in (8). The islet amyloid polypeptide has 37 amino-acid residues and 3–4 positive charges at neutral pH-values. They are located on the N-terminal part of the polypeptide chain at positions 1 (Lys and a-C-NH 2 ), 11 (Arg), and 18 (His). These charges can bind favorably to negative charges of lipid headgroups. It was shown that the IAPP fragment of residues 1–19 inserts even better into a lipid membrane than full-length IAPP itself (6). As well as electrostatic interactions, once partially inserted, IAPP will certainly interact with lipid chains via hydrophobic interactions. So far, little is known about the relative contributions of electrostatic and hydrophobic interactions to the binding of IAPP to negatively charged lipid membranes. Using lipid membranes as a binding substrate for IAPP, a clear separa- tion of these two different kinds of interactions is virtually impossible. Therefore, in this study, the spontaneous adsorp- tion of IAPP was characterized at model interfaces that were prepared by coating solid silicon substrates with different polymer films. A hydrophobic poly-(styrene) film can serve to assess the importance of hydrophobic interactions as a driving force for IAPP adsorption at an interface, whereas positively or negatively charged hydrophilic polyelectrolyte layers can mimic electrostatic charges of lipid headgroups. When these polymer surfaces are brought into contact with a highly diluted IAPP solution (1 mM), IAPP adsorbs spon- taneously according to the strength of electrostatic or hydro- phobic driving forces. For comparison, a second peptide, insulin, was investigated in a similar way. Insulin is produced together with IAPP in the pancreatic b-cells. Insulin is a highly efficient inhibitor of IAPP amyloid fibrillation (9). Insulin does not form amyloid fibrils in vivo, but this process can be triggered easily in vitro by lowering the pH-value and raising the temperature (10,11), or by agitation in the presence of hydrophobic surfaces (12,13). These activating conditions represent a serious issue in the production and handling of insulin. A series of studies documented distinct aggregation pathways of insulin ending up in different amyloid fibril morphologies (14–17). It was also observed that the kinetics of insulin fibril formation at pH 7.4 and 60 C are significantly altered in the presence of lipid membranes, suggesting an insulin-lipid interaction Submitted June 2, 2008, and accepted for publication November 5, 2008. *Correspondence: [email protected] Editor: Jill Trewhella. Ó 2009 by the Biophysical Society 0006-3495/09/02/1115/9 $2.00 doi: 10.1016/j.bpj.2008.11.006 Biophysical Journal Volume 96 February 2009 1115–1123 1115
Transcript

Biophysical Journal Volume 96 February 2009 1115–1123 1115

Interaction of IAPP and Insulin with Model Interfaces Studied UsingNeutron Reflectometry

Christoph Jeworrek,† Oliver Hollmann,† Roland Steitz,‡ Roland Winter,† and Claus Czeslik†*†Fakultat Chemie, Technische Universitat Dortmund, D-44221 Dortmund, Germany; and ‡Helmholtz-Zentrum Berlin, D-14109 Berlin, Germany

ABSTRACT The islet amyloid polypeptide (IAPP) and insulin are coproduced by the b-cells of the pancreatic islets of Langer-hans. Both peptides can interact with negatively charged lipid membranes. The positively charged islet amyloid polypeptidepartially inserts into these membranes and subsequently forms amyloid fibrils. The amyloid fibril formation of insulin is also accel-erated by the presence of negatively charged lipids, although insulin has a negative net charge at neutral pH-values. We usedwater-polymer model interfaces to differentiate between the hydrophobic and electrostatic interactions that can drive thesepeptides to adsorb at an interface. By applying neutron reflectometry, the scattering-length density profiles of IAPP and insulin,as adsorbed at three different water-polymer interfaces, were determined. The islet amyloid polypeptide most strongly adsorbedat a hydrophobic poly-(styrene) surface, whereas at a hydrophilic, negatively charged poly-(styrene sulfonate) interface, thedegree of adsorption was reduced by 50%. Almost no IAPP adsorption was evident at this negatively charged interface whenwe added 100 mM NaCl. On the other hand, negatively charged insulin was most strongly attracted to a hydrophilic, negativelycharged interface. Our results suggest that IAPP is strongly attracted to a hydrophobic surface, whereas the few positive chargesof IAPP cannot warrant a permanent immobilization of IAPP at a hydrophilic, negatively charged surface at an ionic strength of100 mM. Furthermore, the interfacial accumulation of insulin at a hydrophilic, negatively charged surface may represent a favor-able precondition for nucleus formation and fibril formation.

INTRODUCTION

The islet amyloid polypeptide (IAPP) is a hormone that is

synthesized by the b-cells of the pancreatic islets of Langer-

hans. Naturally, it is involved in controlling the level of

glucose in the blood. On the other hand, it is the main

component of amyloid deposits occurring with type 2 dia-

betes mellitus (1). The islet amyloid polypeptide is known

to interact with negatively charged lipid membranes that

contain, for instance, phosphatidylglycerol or phosphatidyl-

serine lipids (2). This interaction was shown to accelerate

amyloid fibril formation (3), and to trigger the permeabiliza-

tion of lipid membranes (4). It was suggested that these two

processes are independent of each other, i.e., membrane

disruption can occur independent of the amyloid formation

of IAPP (5). There is considerable experimental evidence

that IAPP partially inserts into negatively charged lipid

membranes (6,7), where transient a-helices are formed,

before b-sheet and amyloid fibril formation set in (8). The

islet amyloid polypeptide has 37 amino-acid residues and

3–4 positive charges at neutral pH-values. They are located

on the N-terminal part of the polypeptide chain at positions 1

(Lys and a-C-NH2), 11 (Arg), and 18 (His). These charges

can bind favorably to negative charges of lipid headgroups.

It was shown that the IAPP fragment of residues 1–19 inserts

even better into a lipid membrane than full-length IAPP

itself (6). As well as electrostatic interactions, once partially

inserted, IAPP will certainly interact with lipid chains via

hydrophobic interactions.

Submitted June 2, 2008, and accepted for publication November 5, 2008.

*Correspondence: [email protected]

Editor: Jill Trewhella.

� 2009 by the Biophysical Society

0006-3495/09/02/1115/9 $2.00

So far, little is known about the relative contributions of

electrostatic and hydrophobic interactions to the binding of

IAPP to negatively charged lipid membranes. Using lipid

membranes as a binding substrate for IAPP, a clear separa-

tion of these two different kinds of interactions is virtually

impossible. Therefore, in this study, the spontaneous adsorp-

tion of IAPP was characterized at model interfaces that were

prepared by coating solid silicon substrates with different

polymer films. A hydrophobic poly-(styrene) film can serve

to assess the importance of hydrophobic interactions as a

driving force for IAPP adsorption at an interface, whereas

positively or negatively charged hydrophilic polyelectrolyte

layers can mimic electrostatic charges of lipid headgroups.

When these polymer surfaces are brought into contact with

a highly diluted IAPP solution (1 mM), IAPP adsorbs spon-

taneously according to the strength of electrostatic or hydro-

phobic driving forces.

For comparison, a second peptide, insulin, was investigated

in a similar way. Insulin is produced together with IAPP in the

pancreatic b-cells. Insulin is a highly efficient inhibitor of

IAPP amyloid fibrillation (9). Insulin does not form amyloid

fibrils in vivo, but this process can be triggered easily in vitro

by lowering the pH-value and raising the temperature (10,11),

or by agitation in the presence of hydrophobic surfaces

(12,13). These activating conditions represent a serious issue

in the production and handling of insulin. A series of studies

documented distinct aggregation pathways of insulin ending

up in different amyloid fibril morphologies (14–17). It was

also observed that the kinetics of insulin fibril formation at

pH 7.4 and 60�C are significantly altered in the presence of

lipid membranes, suggesting an insulin-lipid interaction

doi: 10.1016/j.bpj.2008.11.006

1116 Jeworrek et al.

(18). By adding the negatively charged lipid dioleoyl-sn-

glycero-phosphatidylserine (DOPS) to a lipid membrane,

the amyloid fibril formation of insulin could be accelerated.

This represents a rather puzzling effect, because insulin has

its isoelectric point at pH 5.3 (19), resulting in a negative

net charge at pH 7.4 and a net electrostatic repulsion to

DOPS lipid molecules. However, as will be shown here,

a much stronger adsorption of insulin occurs at a negatively

charged polyelectrolyte layer than at a positively charged one.

A series of techniques can be used to characterize protein

adsorbates at aqueous-solid interfaces, such as attenuated

total reflection-Fourier transform infrared (ATR-FTIR) spec-

troscopy, total internal reflection fluorescence (TIRF) spec-

troscopy, fluorescence microscopy, ellipsometry, and sum

frequency generation (SFG) spectroscopy, among others

(20). Whereas ATR-FTIR and TIRF spectroscopy are suit-

able for probing the secondary and tertiary structures of ad-

sorbed protein molecules, ellipsometry allows for a determi-

nation of the adsorbed mass with a high time resolution.

Applying SFG spectroscopy, the alignment of protein resi-

dues may be detected. Here, the interaction of IAPP and

insulin with various polymer surfaces was quantified, using

neutron reflectometry (21). This method is particularly suit-

able for probing the density profile of protein adsorbates at

aqueous-polymer interfaces for several reasons (22–24).

By using D2O as the solvent, a high contrast to the polymer

film and the adsorbed protein can be generated. When the

protein adsorbs on a polymer film, ultrasensitive detection

of very thin protein adsorbates in the A-region is possible,

which is important when studying small peptides such as

IAPP. Furthermore, due to its low energy, a neutron beam

does not cause any damage to biological samples, as may

be the case using x-rays, for example.

MATERIALS AND METHODS

Peptide solutions

Human IAPP was purchased from EMD Biosciences (La Jolla, CA). All

other chemicals were from Sigma-Aldrich (Taufkirchen, Germany). We dis-

solved 0.5 mg of IAPP in 1 mL of 2,2,2-trifluoroethanol, and we dried 128

mL of this solution on the inner side of a round-bottom flask, using a gentle

stream of nitrogen. Then we added 16 mL of buffer solution to obtain an

IAPP sample solution with a concentration of 1 mM. The buffer solution con-

tained 10 mM N-morpholinopropanesulfonic acid (MOPS) in D2O, and was

adjusted to pD 7.4 by adding NaOH (pD ¼ pH-meter reading þ 0.4 (25)).

An IAPP solution was used immediately after preparation for neutron reflec-

tometry. Bovine insulin was purchased from Sigma (catalog No. I5500,

Sigma, St. Louis, MO). An insulin stock solution was prepared in D2O

(pD 2.3) at a concentration of 1 mg/mL. Insulin sample solutions (0.1 mg/

mL ¼ 17 mM) were prepared by tenfold dilution of the stock solution, using

D2O-buffer solutions adjusted to pD 7.4 or 2.3.

Polymer surface coating

Silicon wafers were purchased from Siliciumbearbeitung Andrea Holm

(Tann, Germany). They were of an 8�5� 1.5 cm size, and the two large sides

were polished. The wafers were cleaned in a 1:1:4 mixture of NH3 (30%),

Biophysical Journal 96(3) 1115–1123

H2O2 (30%), and H2O, followed by intensive rinsing with pure water (modi-

fied Radio Corporation of America cleaning procedure (26)). Perdeuterated

poly-(styrene) (dPS, Fig. 1) was purchased from Polymer Standards Service

(Mainz, Germany). A dPS film on a silicon wafer was prepared by depositing

a 6-mg/mL dPS solution in toluene on one of the large, polished sides of the

silicon wafer. Then the silicon wafer was spun at 4500 rpm for 1 min (spin-

coater KW-4A from Chemat Technology, Northridge, CA). The polyelectro-

lytes poly-(ethylene imine) (PEI, molar mass ¼ 750,000 g mol�1, Fig. 1),

poly-(styrene sulfonate) (PSS, molar mass ¼ 70,000 g mol�1, Fig. 1), and

poly-(allylamine hydrochloride) (PAH, molar mass ¼ 70,000 g mol�1,

Fig. 1) were obtained from Sigma. A polyelectrolyte multilayer was built

up on a silicon wafer by the following steps (27): initial immersion of the

wafer into a PEI aqueous solution (0.01 mol/L monomers) for 20 min, alter-

nate immersion into PSS and PAH aqueous solutions (0.01 mol/L monomers,

1 mol/L sodium chloride) for 20 min, and intensive rinsing with pure water

after each polyelectrolyte deposition step. All polymer films were attached

to a silicon block via noncovalent bonds, such as electrostatic and hydro-

phobic interactions.

Neutron reflectometry

Neutron reflectivity measurements were performed at the Helmholtz-

Zentrum Berlin (Berlin, Germany), using the instrument V6 (28). The

neutron wavelength selected by a graphite monochromator was 4.66 A.

Higher-order wavelengths were suppressed by a Be filter cooled with liquid

nitrogen. The sample cell consisted of a silicon wafer coated with a polymer

film on the bottom surface (8 � 5 cm) and a Teflon trough, which was fixed

underneath and filled with the sample solution. The sample cell was heated

using a thermostating water jacket. Neutrons entered the silicon wafer

through one of the small sides, were reflected in part at the silicon-solution

interface, and left the silicon wafer through the other small side. Neutron

reflectivities were recorded with a fixed incident neutron beam in q/2q geom-

etry, using a 3He detector. Reflected intensities were normalized to the

number of incoming neutrons hitting the silicon-solution interface, which

yields the neutron reflectivity, and were scaled as a function of wavevector

transfer, Q ¼ (4p/l) sin q (l is the neutron wavelength, and q is the angle of

incidence), where q ranges from 0� to ~2.5�. Before each run, the sample cell

was rinsed and filled with freshly prepared sample solution, and was equil-

ibrated for at least 1 h.

RESULTS AND DISCUSSION

IAPP adsorption at polymer-water interfaces

Neutron reflectivities of water-polymer interfaces were

collected at pD 7.4 and 23�C in the absence and presence

of dissolved IAPP (1 mM). To check for electrostatic

FIGURE 1 Chemical structures of polymers used in this study.

IAPP and Insulin at Model Interfaces 1117

interactions, additional neutron reflectivities were measured

after adding 100 mM NaCl. Because it was reported that the

adsorption, rearrangement, and relaxation of IAPP at lipid

monolayers may take several hours (8), neutron reflectivity

curves of samples containing IAPP were measured after 8 h

of incubation (Fig. 2). These curves are characterized by

pronounced oscillations reflecting a high scattering-length

density contrast between the interfacial structures and the

sample solutions. All data were analyzed by fitting calculated

curves as based on layer models for interfacial structures.

The following results were obtained on a hydrophobic

dPS surface. A first neutron reflectivity curve was measured

when the dPS film was in contact with a 3:1 D2O/H2O

mixture as a sample solution in the absence of IAPP (data

not shown). This sample solution has a different scattering-

length density than dPS, so that the thickness and roughness

of the dPS film on the silicon wafer can be determined

precisely. The obtained neutron reflectivity curve can be

analyzed, assuming the one-layer model Si/dPS/solution.

In the fitting process, the scattering-length densities of the

three components were fixed to 2.07 � 10�6 A�2 (Si),

6.2 � 10�6 A�2 (dPS), and 4.6 � 10�6 A�2 (D2O/H2O)

(21,29), whereas the dPS thickness and the two roughness

values for both sides of the dPS film were varied. The ob-

tained scattering-length density profile is plotted in Fig. 3,

and the fitting parameters are listed in Table 1. A depletion

layer is likely to be formed at the dPS-solution interface in

the absence of a peptide (30). This depletion layer has a scat-

tering length density of ~5.7 � 10�6 A�2, and thus merges

into the dPS-solution interfacial roughness. In the next

step, the D2O/H2O mixture was exchanged by a 1-mM

IAPP solution in D2O, leading to the formation of an IAPP

FIGURE 2 Neutron reflectivity curves of silicon-polymer-solution inter-

faces with adsorbed IAPP (pD 7.4, 23�C, 8 h of incubation, no added

NaCl). Polymer films are composed of dPS, a polyelectrolyte multilayer

ending with PAH, and a polyelectrolyte multilayer ending with PSS. Fits are

shown as solid lines. The PAH and PSS data are shifted vertically for clarity.

adsorbate on the dPS surface. Because dPS and D2O have

approximately the same scattering-length density, the IAPP

adsorbate has a high contrast to both the polymer and the

solution. After 8 h of incubation, a neutron reflectivity curve

was measured (Fig. 2), which could be analyzed on the basis

of the two-layer model Si/dPS/IAPP adsorbate/IAPP solu-

tion (Table 1). The corresponding scattering-length density

profile is plotted in Fig. 3.

As seen in Fig. 3, IAPP forms a relatively thick protein

adsorbate (thickness d ¼ 29 A) that extends over the diffuse

dPS-solution interface. In the presence of IAPP, the forma-

tion of a depletion layer at the dPS-solution interface is not

expected to occur. The amphiphilic nature of the peptide

prohibits this phenomenon by accumulating at this interface.

The scattering-length density of the IAPP adsorbate may be

represented as:

radsorbate ¼ fproteinrprotein þ�1� fprotein

�rsolution (1)

where fprotein is the volume fraction of IAPP molecules in

the adsorbate, rprotein is the scattering-length density of an

IAPP molecule, and rsolution is the scattering length density

of the solution. For IAPP, rprotein was calculated as 3.56 �10�6 A�2, using the primary sequence of IAPP (31), neutron

scattering lengths published by the National Institute of Stan-

dards and Technology (29), and a specific volume of v ¼0.72 cm3 g�1 (corresponding to a molecular volume of

4680 A3 (7)). The rsolution is essentially given by the scat-

tering-length density of D2O (6.4 � 10�6 A�2), and radsorbate

is the scattering-length density of the IAPP adsorbate as

shown in Fig. 3 (5.3 � 10�6 A�2). Then the volume fraction

of IAPP in the adsorbate on a dPS film can be calculated

FIGURE 3 Scattering-length density (SLD) profiles of a silicon-dPS-

solution interface without and with adsorbed IAPP, as derived from neutron

reflectivity curves. Thick solid curve was obtained with a 3:1 D2O/H2O

mixture (denoted as HDO) in the absence of IAPP. Thin solid lines with

symbols reflect interfacial structures when the solution contains 1 mM

IAPP in D2O (pD 7.4, 23�C). In the latter case, an IAPP adsorbate forms

on the dPS surface.

Biophysical Journal 96(3) 1115–1123

1118 Jeworrek et al.

TABLE 1 Fitting parameters and adsorbed amounts of IAPP and insulin at different polymer surfaces under various conditions

T/�C pD cNaCl/mM rpol/10�6 A�2 dpol/A spol/A rads/10�6 A�2 dads/A sads/A G/mg m�2

dPS 6.2 254 8

dPS/IAPP 23 7.4 0 6.2 254 3 5.3 29 3 1.6

dPS/IAPP 23 7.4 100 6.2 254 3 5.3 31 3 1.7

PAH* 4.8 173 19

PAH/IAPPz 23 7.4 0 4.8 177 20 0.3

PAH/IAPPz 23 7.4 100 4.8 178 20 0.4

PSSy 4.7 154 22

PSS/IAPPz 23 7.4 0 4.7 163 23 0.8

PSS/IAPPz 23 7.4 100 4.7 156 23 0.2

dPS 6.2 219 18

dPS/insulin 20 7.4 0 6.2 213 3 5.7 55 3 1.7

dPS/insulin 20 2.3 100 6.2 200 3 5.7 59 3 1.7

dPS/insulin 60 2.3 100 6.2 200 3 5.7 62 3 1.8

PAH* 4.5 263 8

PAH/insulin 20 7.4 0 4.5 263 5 4.8 19 5 1.3

PAH/insulin 20 7.4 100 4.5 263 5 5.0 16 5 1.0

PSSy 4.3 296 9

PSS/insulin 20 7.4 0 4.3 296 5 4.5 30 5 2.5

PSS/insulin 20 7.4 100 4.3 296 5 4.5 34 5 2.9

PSS/insulin 60 7.4 100 4.3 296 5 4.9 23 5 1.6

The IAPP concentration in solution was 1 mM, the insulin concentration was 0.1 mg mL�1 (17 mM), and rpol, dpol, spol, rads, dads, sads represent scattering-

length density, thickness, and roughness of the polymer and adsorbate layers, respectively. The experimental error for the adsorbed amount, G, was estimated

as 50.2 mg m�2.

*Polyelectrolyte multilayer ending with PAH.yPolyelectrolyte multilayer ending with PSS.zPolyelectrolyte multilayer and IAPP are modeled as single layer.

from Eq. 1 as fprotein¼ 0.39. The adsorbed mass of IAPP per

interfacial area is then given as:

G ¼fproteind

v: (2)

With fprotein ¼ 0.39, d ¼ 29 A, and v ¼ 0.72 cm3 g�1, one

obtains G ¼ 1.6 mg m�2. This value is at the lower limit

of adsorbed amounts found for proteins. For example, G ¼1.8 mg m�2 for lysozyme (32), and G ¼ 2.7 mg m�2 for

RNase A (33), at a silica-water interface. Assuming hypothet-

ical spherical folding, IAPP would have a diameter of ~20 A.

A two-dimensional hexagonal packing of spherical IAPP

molecules would yield a monolayer coverage of 1.9 mg m�2.

When IAPP adopts a nonfolded, open conformation, the

monolayer capacity is likely to be smaller than this theoretical

value, in reasonable agreement with the observed amount of

1.6 mg m�2. Indeed, the conformation of IAPP in solution

is largely unordered (34). However, IAPP molecules are not

arranged side-by-side on a rough dPS surface, as can be

judged from the adsorbate thickness (29 A), which is larger

than a hypothetical IAPP diameter (20 A).

An additional neutron reflectivity curve was measured 8 h

after rinsing the sample cell with a 1-mM IAPP solution con-

taining 100 mM NaCl (data not shown). The corresponding

scattering-length density profile essentially overlaps that

measured without salt (Fig. 3). This result is consistent with

a pure hydrophobic interaction between IAPP and dPS, and

a lack of any slow rearrangements of IAPP molecules at the

hydrophobic dPS surface on a time scale of hours.

Biophysical Journal 96(3) 1115–1123

To probe the electrostatic driving forces of IAPP adsorp-

tion, polyelectrolyte multilayers were built up on a silicon

wafer. The structures of the multilayers are given as Si-

PEI-PSS-(PAH-PSS)2-PAH and Si-PEI-PSS-(PAH-PSS)2.

They are terminated with either positively charged PAH or

negatively charged PSS. In both cases, a first neutron reflec-

tivity curve was measured with D2O-buffer solution without

IAPP, to determine the scattering-length density, the thick-

ness, and the roughness of each polyelectrolyte multilayer

(Table 1). The corresponding scattering-length density

profiles are shown in Fig. 4. The IAPP was then adsorbed

at these polymer films by filling the sample cell with a 1-

mM IAPP solution. Neutron reflectivity curves were

measured after 8 h of incubation (Fig. 2). In the fitting anal-

ysis of these data, a one-layer model Si/multilayer/solution

could be used. Adsorbed IAPP could be modeled simply

by increasing the thickness of the multilayer. No additional

layer had to be assigned to adsorbed IAPP (Table 1).

Because the scattering-length densities of an IAPP adsorbate

(Fig. 3) and a polyelectrolyte multilayer (Fig. 4) are similar,

this simplification is a reasonable approach. The obtained

scattering-length density profiles are also plotted in Fig. 4.

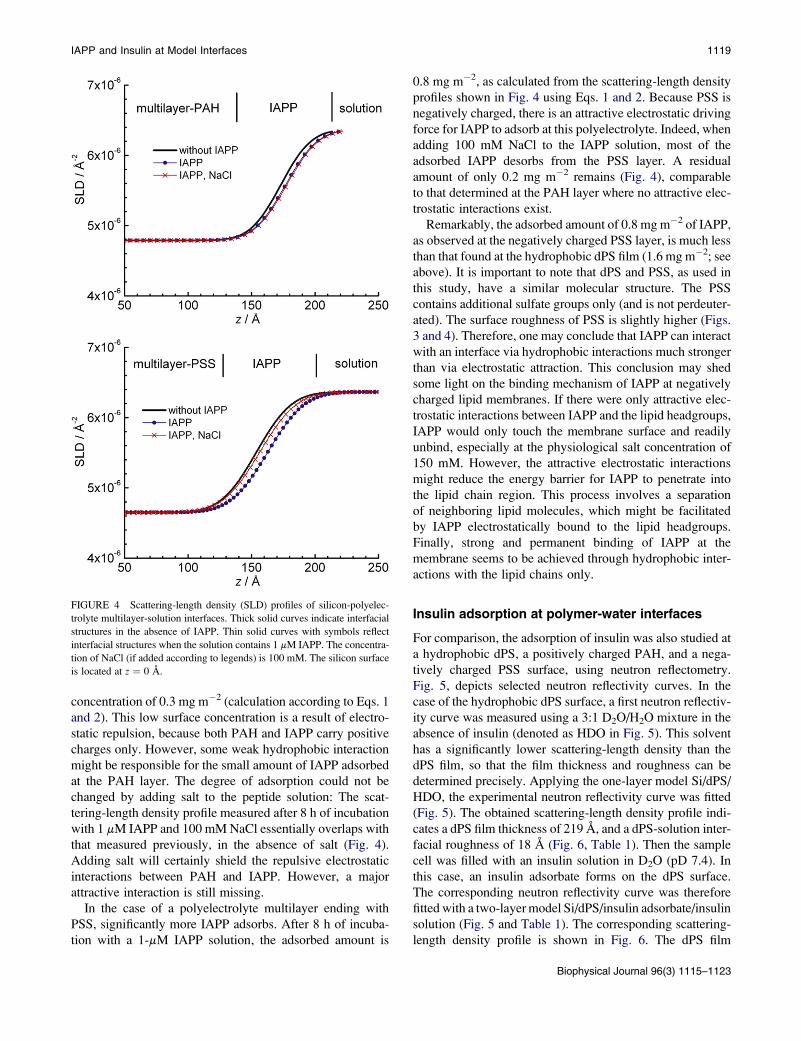
On a polyelectrolyte multilayer ending with positively

charged PAH, only very small amounts of IAPP are ad-

sorbed. The film thickness increases from 173 to 177 A

only (Table 1), i.e., just beyond the experimental error

of this parameter (~3 A). The change in scattering-length

density profile upon addition of IAPP to the solution

after 8 h of incubation (Fig. 4) yields an IAPP surface

IAPP and Insulin at Model Interfaces 1119

concentration of 0.3 mg m�2 (calculation according to Eqs. 1

and 2). This low surface concentration is a result of electro-

static repulsion, because both PAH and IAPP carry positive

charges only. However, some weak hydrophobic interaction

might be responsible for the small amount of IAPP adsorbed

at the PAH layer. The degree of adsorption could not be

changed by adding salt to the peptide solution: The scat-

tering-length density profile measured after 8 h of incubation

with 1 mM IAPP and 100 mM NaCl essentially overlaps with

that measured previously, in the absence of salt (Fig. 4).

Adding salt will certainly shield the repulsive electrostatic

interactions between PAH and IAPP. However, a major

attractive interaction is still missing.

In the case of a polyelectrolyte multilayer ending with

PSS, significantly more IAPP adsorbs. After 8 h of incuba-

tion with a 1-mM IAPP solution, the adsorbed amount is

FIGURE 4 Scattering-length density (SLD) profiles of silicon-polyelec-

trolyte multilayer-solution interfaces. Thick solid curves indicate interfacial

structures in the absence of IAPP. Thin solid curves with symbols reflect

interfacial structures when the solution contains 1 mM IAPP. The concentra-

tion of NaCl (if added according to legends) is 100 mM. The silicon surface

is located at z ¼ 0 A.

0.8 mg m�2, as calculated from the scattering-length density

profiles shown in Fig. 4 using Eqs. 1 and 2. Because PSS is

negatively charged, there is an attractive electrostatic driving

force for IAPP to adsorb at this polyelectrolyte. Indeed, when

adding 100 mM NaCl to the IAPP solution, most of the

adsorbed IAPP desorbs from the PSS layer. A residual

amount of only 0.2 mg m�2 remains (Fig. 4), comparable

to that determined at the PAH layer where no attractive elec-

trostatic interactions exist.

Remarkably, the adsorbed amount of 0.8 mg m�2 of IAPP,

as observed at the negatively charged PSS layer, is much less

than that found at the hydrophobic dPS film (1.6 mg m�2; see

above). It is important to note that dPS and PSS, as used in

this study, have a similar molecular structure. The PSS

contains additional sulfate groups only (and is not perdeuter-

ated). The surface roughness of PSS is slightly higher (Figs.

3 and 4). Therefore, one may conclude that IAPP can interact

with an interface via hydrophobic interactions much stronger

than via electrostatic attraction. This conclusion may shed

some light on the binding mechanism of IAPP at negatively

charged lipid membranes. If there were only attractive elec-

trostatic interactions between IAPP and the lipid headgroups,

IAPP would only touch the membrane surface and readily

unbind, especially at the physiological salt concentration of

150 mM. However, the attractive electrostatic interactions

might reduce the energy barrier for IAPP to penetrate into

the lipid chain region. This process involves a separation

of neighboring lipid molecules, which might be facilitated

by IAPP electrostatically bound to the lipid headgroups.

Finally, strong and permanent binding of IAPP at the

membrane seems to be achieved through hydrophobic inter-

actions with the lipid chains only.

Insulin adsorption at polymer-water interfaces

For comparison, the adsorption of insulin was also studied at

a hydrophobic dPS, a positively charged PAH, and a nega-

tively charged PSS surface, using neutron reflectometry.

Fig. 5, depicts selected neutron reflectivity curves. In the

case of the hydrophobic dPS surface, a first neutron reflectiv-

ity curve was measured using a 3:1 D2O/H2O mixture in the

absence of insulin (denoted as HDO in Fig. 5). This solvent

has a significantly lower scattering-length density than the

dPS film, so that the film thickness and roughness can be

determined precisely. Applying the one-layer model Si/dPS/

HDO, the experimental neutron reflectivity curve was fitted

(Fig. 5). The obtained scattering-length density profile indi-

cates a dPS film thickness of 219 A, and a dPS-solution inter-

facial roughness of 18 A (Fig. 6, Table 1). Then the sample

cell was filled with an insulin solution in D2O (pD 7.4). In

this case, an insulin adsorbate forms on the dPS surface.

The corresponding neutron reflectivity curve was therefore

fitted with a two-layer model Si/dPS/insulin adsorbate/insulin

solution (Fig. 5 and Table 1). The corresponding scattering-

length density profile is shown in Fig. 6. The dPS film

Biophysical Journal 96(3) 1115–1123

1120 Jeworrek et al.

thickness is apparently smaller in the presence of an insulin

adsorbate (213 A, Table 1). This can be explained by the rela-

tively great roughness of the dPS film surface. When insulin

adsorbs, it partially penetrates into this rough interface

(Fig. 6). As a result, the observed thickness of 213 A can no

longer be regarded as a true value, but merely as the distance

from the Si surface where the insulin adsorbate is located.

From the scattering-length density profile of a dPS surface

in contact with an insulin solution at pD 7.4 (Fig. 6), a thick-

FIGURE 5 Neutron reflectivity curves of silicon-polymer-solution inter-

faces without and with adsorbed insulin (pD 7.4, 20�C, 1 h of incubation).

Symbols indicate experimental data. Fits are shown as solid lines. Curves are

shifted vertically for clarity.

FIGURE 6 Scattering-length density (SLD) profiles of a silicon-dPS-

solution interface without and with adsorbed insulin (20�C), as derived

from neutron reflectivity curves. Thick solid curve was obtained with

a 3:1 D2O/H2O mixture (denoted as HDO) in the absence of insulin. Thin

solid lines with symbols reflect interfacial structures when the solution

contains insulin in D2O. In the latter case, an insulin adsorbate forms on

the dPS surface.

Biophysical Journal 96(3) 1115–1123

ness of d ¼ 55 A and a scattering length density radsorbate ¼5.67 � 10�6 A�2 can be deduced for the insulin adsorbate.

The scattering-length density of insulin in D2O was found

to be rprotein¼ 3.27� 10�6 A�2, using the primary sequence

of insulin (35), neutron-scattering lengths published by the

National Institute of Standards and Technology (29), and a

specific volume of v ¼ 0.717 cm3 g�1 (36). With rsolution ¼6.4� 10�6 A�2, the volume fraction of insulin in the adsorbate

on a dPS film can be calculated from Eq. 1 as fprotein ¼ 0.23.

Then Eq. 2 yields an adsorbed mass of 1.7 mg m�2 on a dPS

surface. However, the fit of the neutron reflectivity curve ob-

tained with insulin adsorbed on a dPS surface shows small

systematic deviations (Fig. 5). This finding suggests broad

lateral inhomogeneities of the insulin adsorbate. In a neutron

reflectivity experiment, the interfacial structure is laterally

averaged on the length scale of micrometers (21), whereas in

our experiments, the total area probed by the neutron beam

was ~20 cm2. If the interfacial roughness has a waviness on

a scale of more than micrometers, the measured neutron reflec-

tivity curve is a superposition of slightly different curves stem-

ming from slightly different interfacial structures. Thus the

data are difficult to describe by a simple layer model.

An additional neutron reflectivity curve was measured

after exchanging the sample solution with an insulin solution

in D2O at pD 2.3, containing 100 mM NaCl (data not

shown). By lowering the pD value of the solution, insulin

oligomers formed at pD 7.4 dissociate to form predominantly

dimers (10,37). As a result of this dissociation, insulin can

penetrate deeper into the rough dPS surface at pD 2.3 than

at pD 7.4, as clearly reflected in the measured scattering-

length density profile (Fig. 6). However, no change in the

total mass of adsorbed insulin can be detected by lowering

the pD value. Finally, the sample cell was heated to 60�C(where insulin is known to aggregate in solution), but this

heat treatment did not result in a significant change of inter-

facial structure (Table 1).

Electrostatic driving forces for insulin adsorption at an

interface were probed by the preparation of the polyelectro-

lyte multilayer structures Si-PEI-PSS-(PAH-PSS)4-PAH and

Si-PEI-PSS-(PAH-PSS)5. These structures end with a posi-

tively charged PAH and a negatively charged PSS. Because

the polyelectrolytes used were not deuterated, their structures

(thickness, scattering-length density, and roughness) were

determined from neutron reflectivity curves taken with

D2O-buffer solution, which generates a large contrast. The

neutron reflectivity curves were fitted on the basis of

a one-layer model Si/multilayer/solution (Table 1), and the

scattering-length density profiles obtained are shown in

Fig. 7. Then, by filling the sample cell with insulin solution,

insulin adsorbs on the polyelectrolyte multilayers. After 1 h

of incubation, neutron reflectivity curves were measured, as

shown in Fig. 5. Unlike IAPP, insulin adsorbates on a poly-

electrolyte multilayer are thick enough to analyze the neutron

reflectivity curves on the basis of a two-layer model, Si/

multilayer/insulin adsorbate/insulin solution (Table 1). The

IAPP and Insulin at Model Interfaces 1121

scattering-length density profiles obtained in this way are

also plotted in Fig. 7.

As seen in Fig. 7, a much thicker insulin adsorbate forms

on a PSS surface than on a PAH surface. Using a 0.1 mg

mL�1 (17 mM) insulin solution (pD 7.4, 20�C), a 19-A-thick

adsorbate with an insulin volume fraction of 0.51 is found on

PAH, whereas on PSS, the adsorbate is 30 A thick, with a

volume fraction of 0.60. These structural parameters lead to

adsorbed amounts of 1.3 mg m�2 on PAH, and 2.5 mg m�2

on PSS (Eq. 2). It may be surprising that significantly

more insulin is adsorbed on the negatively charged PSS

surface, insofar as insulin has a negative net charge at pD

7.4. However, this finding is consistent with an insulin

aggregation study performed earlier on lipid membranes

(18). In that study, adding negatively charged lipid mole-

cules to a lipid membrane led to an acceleration of the forma-

FIGURE 7 Scattering-length density (SLD) profiles of silicon-polyelectro-

lyte multilayer-solution interfaces. Thick solid curves indicate interfacial

structures in the absence of insulin. Thin solid curves with symbols reflect

interfacial structures when the solution contains insulin, and insulin adsor-

bates form on multilayers (20�C, pD 7.4). Silicon surface is located at z¼ 0 A.

tion of insulin amyloid fibrils. The negatively charged lipids

likely accumulate insulin molecules on the membrane

surface, so that nucleus formation is highly facilitated.

So far, no clear explanation can be given as to why insulin

prefers to adsorb at a negatively charged PSS surface at pD

7.4, compared with a positively charged PAH surface.

Generally, close to the isoelectric point of insulin at pH 5.3

(19), the net charge of insulin may play a secondary role in

the interaction with a charged surface. Rather, the distribu-

tion of positive and negative charges on a protein surface

may be of primary importance. In this way, the negative

charges of insulin stemming from four glutamic-acid resi-

dues may be less accessible and cannot easily come into

contact with a surface. Furthermore, insulin has an inherent

tendency to self-associate at pH 7 (38,39), which modulates

the number and type of accessible surface charges in

a complicated way.

However, on the addition of 100 mM NaCl to the insulin

solution, the degree of insulin adsorption on the polyelectro-

lyte multilayers changes in a way that reflects the net charge of

insulin molecules at pD 7.4. On a PAH surface, the added salt

screens the net electrostatic attraction between the protein and

the interface, resulting in a thinner adsorbate (Fig. 7) and a loss

of adsorbed insulin from 1.3 to 1.0 mg m�2. Likewise, at

a PSS surface, the insulin adsorbate grows in thickness

upon adding salt (Fig. 7), because of the screening of a net

electrostatic repulsion. At the same time, the adsorbed mass

of insulin increases from 2.5 to 2.9 mg m�2.

Finally, an interesting result was obtained after heating the

sample with insulin adsorbed on a PSS surface from 20�C to

60�C. As seen in the corresponding scattering-length density

profile shown in Fig. 7, insulin desorbs partially by this heat

treatment. About 1.6 mg m�2 of insulin remained adsorbed

at 60�C. This heat-induced desorption may reflect an

exothermic driving force for insulin adsorption on a PSS

surface. This driving force may be the electrostatic attraction

between local positive charges of insulin and the negative

charges of PSS. Unfortunately, no heating was possible

when PAH formed the outer layer. It was found repeatedly

that the multilayer Si-PEI-PSS-(PAH-PSS)4-PAH (with an

odd number of layers) disintegrates in contact with D2O

buffer solution at 60�C. This finding is consistent with the

odd-even effect reported in the literature for polyelectrolyte

multilayers. For example, when a PAH-PSS multilayer is

built up, the solvent fraction of the multilayer alternates for

each additional layer (40). In addition, capsules made of

poly-(diallyldimethylammonium chloride)-PSS multilayers

break at 60�C, when the number of layers is odd, but are

stable up to 90�C otherwise (41).

CONCLUSIONS

To summarize the main results of this study, the adsorbed

amounts of IAPP and insulin at different polymer surfaces

under various conditions are listed in Table 1. Regarding

Biophysical Journal 96(3) 1115–1123

1122 Jeworrek et al.

IAPP, which carries 3–4 positive charges at pD 7.4, the stron-

gest adsorption was evident at a hydrophobic interface. In

proceeding from the hydrophobic dPS surface to the hydro-

philic, negatively charged PSS surface, the adsorbed amount

was reduced by ~50%. Almost all IAPP desorbs from PSS

when adding salt to the IAPP solution. At the hydrophilic,

positively charged PAH surface, almost no IAPP can be

detected. On the basis of these findings, one may speculate

that IAPP binds to a lipid membrane essentially via hydro-

phobic interactions with the lipid chains. This implies a partial

insertion of the peptide into the membrane, as found in other

studies (6–8). Attractive electrostatic interactions between

negatively charged lipid headgroups and IAPP are unlikely

to warrant the permanent lipid membrane binding of IAPP,

in particular at slightly elevated ionic strength. However,

interactions of IAPP with lipid headgroups via charges might

lower the energy barrier for partitioning, i.e., for separating

lipid molecules and inserting between the lipid chains. On

the other hand, insulin most strongly adsorbs at a hydrophilic,

negatively charged PSS surface at pD 7.4, although it has

a small negative net charge at neutral pD values. This result

might indicate a favorable interaction of insulin with nega-

tively charged lipids. This conclusion could explain why the

presence of DOPS in a lipid membrane accelerates the forma-

tion of insulin amyloid fibrils (18). A preferred localization

and accumulation of insulin at this lipid will help form

a nucleus for fibril growth.

This study was supported by the Deutsche Forschungsgemeinschaft and the

Helmholtz-Zentrum Berlin.

REFERENCES

1. Westermark, P. 2005. Aspects on human amyloid forms and their fibrilpolypeptides. FEBS J. 272:5942–5949.

2. Jayasinghe, S. A., and R. Langen. 2007. Membrane interaction of isletamyloid polypeptide. Biochim. Biophys. Acta. 1768:2002–2009.

3. Knight, J. D., and A. D. Miranker. 2004. Phospholipid catalysis of dia-betic amyloid assembly. J. Mol. Biol. 341:1175–1187.

4. Sparr, E., M. F. M. Engel, D. V. Sakharov, M. Sprong, J. Jacobs, et al.2004. Islet amyloid polypeptide-induced membrane leakage involvesuptake of lipids by forming amyloid fibers. FEBS Lett. 577:117–120.

5. Brender, J. R., E. L. Lee, M. A. Cavitt, A. Gafni, D. G. Steel, et al. 2008.Amyloid fiber formation and membrane disruption are separateprocesses localized in two distinct regions of IAPP, the type-2-diabetes-related peptide. J. Am. Chem. Soc. 130:6424–6429.

6. Engel, M. F. M., H. A. Yigittop, R. C. Elgersma, D. T. S. Rijkers, R. M.J. Liskamp, et al. 2006. Islet amyloid polypeptide inserts into phospho-lipid monolayers as monomer. J. Mol. Biol. 356:783–789.

7. Balali-Mood, K., R. H. Ashley, T. Hauß, and J. P. Bradshaw. 2005.Neutron diffraction reveals sequence-specific membrane insertion ofpre-fibrillar islet amyloid polypeptide and inhibition by rifampicin.FEBS Lett. 579:1143–1148.

8. Lopes, D. H. J., A. Meister, A. Gohlke, A. Hauser, A. Blume, et al.2007. Mechanism of islet amyloid polypeptide fibrillation at lipid inter-faces studied by infrared reflection absorption spectroscopy. Biophys. J.93:3132–3141.

9. Larson, J. L., and A. D. Miranker. 2004. The mechanism of insulinaction on islet amyloid polypeptide fiber formation. J. Mol. Biol.335:221–231.

Biophysical Journal 96(3) 1115–1123

10. Brange, J., L. Andersen, E. D. Laursen, G. Meyn, and E. Rasmussen.1997. Toward understanding insulin fibrillation. J. Pharm. Sci.86:517–525.

11. Jimenez, J. L., E. J. Nettleton, M. Bouchard, C. V. Robinson, C. M.Dobson, et al. 2002. The protofilament structure of insulin amyloidfibrils. Proc. Natl. Acad. Sci. USA. 99:9196–9201.

12. Sluzky, V., J. A. Tamada, A. M. Klibanov, and R. Langer. 1991. Kineticsof insulin aggregation in aqueous solutions upon agitation in the presenceof hydrophobic surfaces. Proc. Natl. Acad. Sci. USA. 88:9377–9381.

13. Nielsen, L., R. Khurana, A. Coats, S. Frokjaer, J. Brange, et al. 2001.Effect of environmental factors on the kinetics of insulin fibril formation:elucidation of the molecular mechanism. Biochemistry. 40:6036–6046.

14. Smirnovas, V., and R. Winter. 2008. Revealing different aggregationpathways of amyloidogenic proteins by ultrasound velocimetry.Biophys. J. 94:3241–3246.

15. Dzwolak, W., S. Grudzielanek, V. Smirnovas, R. Ravindra, C. Nicolini,et al. 2005. Ethanol-perturbed amyloidogenic self-assembly of insulin:looking for origins of amyloid strains. Biochemistry. 44:8948–8958.

16. Dzwolak, W., V. Smirnovas, R. Jansen, and R. Winter. 2004. Insulinforms amyloid in a strain-dependent manner: an FT-IR spectroscopicstudy. Protein Sci. 13:1927–1932.

17. Hong, D. -P., and A. L. Fink. 2005. Independent heterologous fibrilla-tion of insulin and its B-chain peptide. Biochemistry. 44:16701–16709.

18. Grudzielanek, S., V. Smirnovas, and R. Winter. 2007. The effects ofvarious membrane physical-chemical properties on the aggregationkinetics of insulin. Chem. Phys. Lipids. 149:28–39.

19. Wintersteiner, O., and H. A. Abramson. 1933. The isoelectric point ofinsulin. J. Biol. Chem. 99:741–753.

20. Baszkin A. and Norde W., editors. (2000). Physical Chemistry of Bio-logical Interfaces. Marcel Dekker, New York.

21. Russell, T. P. 1990. X-ray and neutron reflectivity for the investigationof polymers. Mater. Sci. Rep. 5:171–271.

22. Hollmann, O., R. Steitz, and C. Czeslik. 2008. Structure and dynamicsof a-lactalbumin adsorbed at a charged brush interface. Phys. Chem.Chem. Phys. 10:1448–1456.

23. Jackler, G., C. Czeslik, R. Steitz, and C. A. Royer. 2005. Spatial distri-bution of protein molecules adsorbed at a polyelectrolyte multilayer.Phys. Rev. E Stat. Nonlin. Soft Matter Phys. 71, 041912.

24. Rocha, S., R. Krastev, A. F. Thunemann, M. C. Pereira, H. Mohwald,et al. 2005. Adsorption of amyloid b-peptide at polymer surfaces:a neutron reflectivity study. ChemPhysChem. 6:2527–2534.

25. Covington, A. K., M. Paabo, R. A. Robinson, and R. G. Bates. 1968.Use of the glass electrode in deuterium oxide and the relation betweenthe standardized pD (paD) scale and the operational pH in heavy water.Anal. Chem. 40:700–706.

26. Kern, W. 1990. The evolution of silicon wafer cleaning technology.J. Electrochem. Soc. 137:1887–1892.

27. Decher, G. 1997. Fuzzy nanoassemblies: toward layered polymericmulticomposites. Science. 277:1232–1237.

28. Mezei, F., R. Golub, F. Klose, and H. Toews. 1995. Focussed beamreflector for solid and liquid surfaces. Physica B. 213 and 214:898–900.

29. National Institute of Standards and Technology. Neutron scattering lengthand cross sections. http://www.ncnr.nist.gov/resources/n-lengths/list.html. Accessed April 2008.

30. Steitz, R., T. Gutberlet, T. Hauss, B. Klosgen, R. Krastev, et al. 2003.Nanobubbles and their precursor layer at the interface of water againsta hydrophobic substrate. Langmuir. 19:2409–2418.

31. Cooper, G. J. S., A. J. Day, A. C. Willis, A. N. Roberts, K. B. M. Reid,et al. 1989. Amylin and the amylin gene: structure, function and rela-tionship to islet amyloid and to diabetes mellitus. Biochim. Biophys.Acta. 1014:247–258.

32. Jackler, G., R. Steitz, and C. Czeslik. 2002. Effect of temperature on theadsorption of lysozyme at the silica/water interface studied by opticaland neutron reflectometry. Langmuir. 18:6565–6570.

IAPP and Insulin at Model Interfaces 1123

33. Koo, J., T. Gutberlet, and C. Czeslik. 2008. Control of protein interfa-cial affinity by nonionic cosolvents. J. Phys. Chem. B. 112:6292–6295.

34. Jayasinghe, S. A., and R. Langen. 2005. Lipid membranes modulate thestructure of islet amyloid polypeptide. Biochemistry. 44:12113–12119.

35. Smith, L. F. 1966. Species variation in the amino acid sequence ofinsulin. Am. J. Med. 40:662–666.

36. Smirnovas, V., R. Winter, T. Funck, and W. Dzwolak. 2006. Proteinamyloidogenesis in the context of volume fluctuations: a case studyon insulin. ChemPhysChem. 7:1046–1049.

37. Whittingham, J. L., D. J. Scott, K. Chance, A. Wilson, J. Finch, et al.2002. Insulin at pH 2: structural analysis of the conditions promotinginsulin fibre formation. J. Mol. Biol. 318:479–490.

38. Jeffrey, P. D., B. K. Milthorpe, and L. W. Nichol. 1976. Polymerization

pattern of insulin at pH 7.0. Biochemistry. 15:4660–4665.

39. Pocker, Y., and S. B. Biswas. 1981. Self-association of insulin and therole of hydrophobic bonding: a thermodynamic model of insulin dimer-

ization. Biochemistry. 20:4354–4361.

40. Carriere, D., R. Krastev, and M. Schonhoff. 2004. Oscillations in

solvent fraction of polyelectrolyte multilayers driven by the charge ofthe terminating layer. Langmuir. 20:11465–11472.

41. Kohler, K., D. G. Shchukin, H. Mohwald, and G. B. Sukhorukov. 2005.

Thermal behavior of polyelectrolyte multilayer microcapsules. 1. the

effect of odd and even layer number. J. Phys. Chem. B. 109:

18250–18259.

Biophysical Journal 96(3) 1115–1123


Recommended