Interaction of Intermodulation Products between DUT and Spectrum Analyzer White Paper Products: | R&S FSQ | R&S FSW This white paper describes the interaction between intermodulation products generated by a device under test (DUT) and intermodulation products generated internally in a spectrum analyzer. The overall intermodulation distortion may be too optimistic or pessimistic. Examples demonstrating cancelling IM products and necessary steps to avoid an influence of the spectrum analyzer on the measurement results are outlined. Application Note Michael Simon December 2012 - 1MA219_2e
Transcript
Interaction of IntermodulationProducts between DUT andSpectrum AnalyzerWhite PaperProducts:
| R&SFSQ
| R&SFSW
This white paper describes the interactionbetween intermodulation productsgenerated by a device under test (DUT)and intermodulation products generatedinternally in a spectrum analyzer. Theoverall intermodulation distortion may betoo optimistic or pessimistic. Examplesdemonstrating cancelling IM products andnecessary steps to avoid an influence ofthe spectrum analyzer on themeasurement results are outlined.
Appli
catio
nNo
te
Mich
aelS
imon
Dece
mber
2012
-1MA
219_
2e
Table of Contents
1MA219_2e Rohde & Schwarz Interaction of Intermodulation Products between DUT and Spectrum Analyzer 2
Table of Contents1 Intermodulation Distortion .................................................... 31.1 Dynamic Range.............................................................................................4
5 Ordering Information ........................................................... 15
Intermodulation Distortion
1MA219_2e Rohde & Schwarz Interaction of Intermodulation Products between DUT and Spectrum Analyzer 3
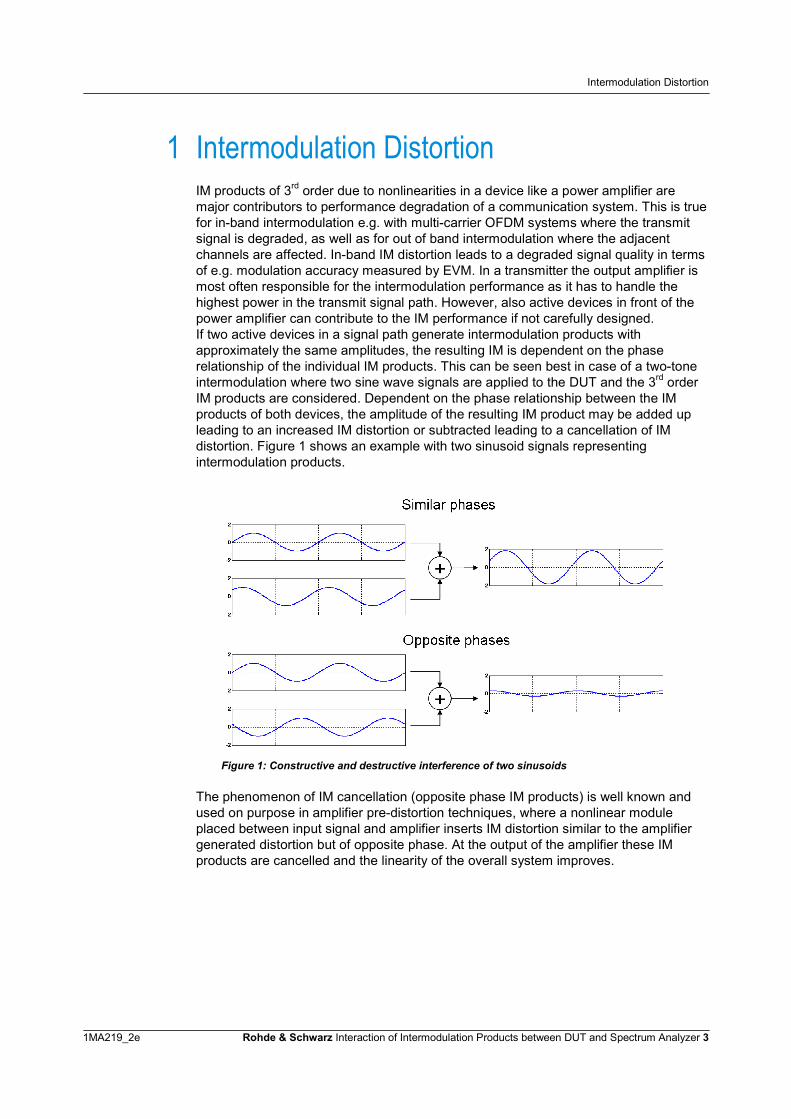
1 Intermodulation DistortionIM products of 3rd order due to nonlinearities in a device like a power amplifier aremajor contributors to performance degradation of a communication system. This is truefor in-band intermodulation e.g. with multi-carrier OFDM systems where the transmitsignal is degraded, as well as for out of band intermodulation where the adjacentchannels are affected. In-band IM distortion leads to a degraded signal quality in termsof e.g. modulation accuracy measured by EVM. In a transmitter the output amplifier ismost often responsible for the intermodulation performance as it has to handle thehighest power in the transmit signal path. However, also active devices in front of thepower amplifier can contribute to the IM performance if not carefully designed.If two active devices in a signal path generate intermodulation products withapproximately the same amplitudes, the resulting IM is dependent on the phaserelationship of the individual IM products. This can be seen best in case of a two-toneintermodulation where two sine wave signals are applied to the DUT and the 3rd orderIM products are considered. Dependent on the phase relationship between the IMproducts of both devices, the amplitude of the resulting IM product may be added upleading to an increased IM distortion or subtracted leading to a cancellation of IMdistortion. Figure 1 shows an example with two sinusoid signals representingintermodulation products.
Figure 1: Constructive and destructive interference of two sinusoids
The phenomenon of IM cancellation (opposite phase IM products) is well known andused on purpose in amplifier pre-distortion techniques, where a nonlinear moduleplaced between input signal and amplifier inserts IM distortion similar to the amplifiergenerated distortion but of opposite phase. At the output of the amplifier these IMproducts are cancelled and the linearity of the overall system improves.
Intermodulation Distortion
1MA219_2e Rohde & Schwarz Interaction of Intermodulation Products between DUT and Spectrum Analyzer 4
When measuring intermodulation products with a spectrum analyzer a similar situationas with cascaded active devices can occur. As a spectrum analyzer also includes non-linear devices like the input mixer or a pre-amplifier, it generates its ownintermodulation products, which might have a similar amplitude as the IM productsgenerated by the DUT. Depending on the phase relationship between the IM productsof the DUT and spectrum analyzer, the overall IM distortion can be higher (in-phase IMproducts) or lower (opposite phase IM products) than the DUT’s actual IM distortion.Both cases lead to unwanted distortions of measurements done with a spectrumanalyzer and must thus be avoided.
Spectrum analyzers provide mechanical step attenuators following the RF inputconnectors to adjust the level at the input of potentially non-linear devices like the pre-amplifier or the first mixer (see Figure 2). By adjusting the level at the first mixerappropriately IM distortion can be avoided. Some spectrum analyzers additionally useelectronic attenuators e.g. for switching speed. However, these attenuators aredesigned in a way that they do not contribute to the overall nonlinearities in thespectrum analyzers signal path. Basically all semiconductor components following thestep-attenuator can contribute to IM distortion, whereas the main contributor normallyis the input mixer, even if a pre-amplifier is used. In this case the input mixer is loadedby a level increased by the pre-amplifier gain.
Figure 2: Typical RF frontend of a spectrum analyzer. Components highlighted in red can generate IMproducts.
1.1 Dynamic Range
For a given power level of a signal to be measured several factors limit the dynamicrange of a spectrum analyzer. These factors are also dependent on the character ofthe signal:
● The inherent noise floor PN of the spectrum analyzer for lower power levels● The compression of the input mixer for high power levels● The phase noise for small signals close to a high level carrier
When multiple tones are applied to the spectrum analyzer, IM products may limit thedynamic range. Especially the 3rd order intermodulation has to be considered as itresults in the highest IM products. Spectrum analyzer data sheets provide aspecification for two-tone IM distortion either as an intermodulation free dynamic rangeat a specified level of two CW carriers with a given frequency offset or by the so calledThird Order Intercept point (T.O.I.) also measured with a two-carrier CW signal with agiven frequency offset.
Intermodulation Distortion
1MA219_2e Rohde & Schwarz Interaction of Intermodulation Products between DUT and Spectrum Analyzer 5
The T.O.I. is the theoretical power level which would generate 3rd order IM productshaving the same level as the applied CW signals. The T.O.I. can be calculated as
2/ PPTOI in (1)
where TOI is the Third Order Intercept point in dBm, Pin is the level of each tone of thetwo-tone input signal in dBm and PΔ is the amplitude of the IM products relative to Pin.Figure 3 shows a schematic representation of these values.
Figure 3: Schematic diagram of 3rd order IM components and relevant parameters.
Due to compression in active devices the T.O.I. level cannot be reached in a realmeasurement (e.g. at an output of an amplifier). However, it is a good figure of merit tocalculate the intermodulation free dynamic range PΔ at a given level of a two-tonesignal according to
inPTOIP 2 (2)
The amplitude PIM3 of the 3rd order IM products is accordingly
TOIPPTOIP
PPP
in
inin
inIM
23)(2
3
(3)
Another factor limiting dynamic range, especially for low input powers, is the spectrumanalyzer’s noise floor. In the data sheets this is specified as the Displayed AverageNoise Floor (DANL).
Putting all distortions together yields the so called dynamic range chart shown inFigure 4. For low input powers the noise floor is limiting the dynamic range whereas forhigher levels it is the 3rd order IM distortion. 2nd order IM distortions and phase noisealso influence the dynamic range. 2nd order IM is not considered further since thedistortion products fall at frequencies far from the signal (f1 + f2 and f2 - f1) and are thusnot relevant for in-band distortion and ACLR. Summing up all distortion sources in thelinear domain gives the actual dynamic range for a spectrum analyzer. The minimum ofthis curve is called the optimum mixer level. At this point the spectrum analyzerachieves the maximum dynamic range. By using the preamplifier and step attenuatorthe mixer level for a given input signal can be set to this optimal value.
Intermodulation Distortion
1MA219_2e Rohde & Schwarz Interaction of Intermodulation Products between DUT and Spectrum Analyzer 6
-70 -60 -50 -40 -30 -20 -10 0-180
-160
-140
-120
-100
-80
-60
-40
-20
Mixer Level [dBm]
Dyn
amic
Ran
ge[d
B]
Phase NoiseNoise Floor3rd order IMResult
optimum mixerlevel
Figure 4: Dynamic Range Chart. TOI = 15dBm, DANL = -155dBm/Hz, Phase Noise = -130dBc.
The 3rd order IM curve has a slope of +2, so for a 1dB rise in mixer level a 2dBincrease in 3rd order IM products results, leading to a 2dB decrease in dynamic range.On the other hand with every 1dB mixer level increase, the noise floor decreases by1dB.
For real measurements, and particularly for wideband signals, the increase in noisefloor due to a wide signal bandwidth needs to be taken into account. When talkingabout the analyzers first mixer filter settings are not of importance since the mixeralways sees the full bandwidth and so only the signal bandwidth is relevant. Thebandwidth dependent noise floor relative to the mixer level is given as
dBPBDANLP inN (4)
with B as the bandwidth of the signal in dB. As a result the dynamic range decreasesand the optimum mixer level shifts to the right. Figure 5 shows an example withB=100kHz (50dB).
A thorough treatment of these topics can be found in [1]. A spread sheetaccompanying the text book helps to draw the dynamic range chart based on ananalyzers’ data sheet parameters.
Intermodulation Distortion
1MA219_2e Rohde & Schwarz Interaction of Intermodulation Products between DUT and Spectrum Analyzer 7
-70 -60 -50 -40 -30 -20 -10 0-180
-160
-140
-120
-100
-80
-60
-40
-20
Mixer Level [dBm]
Dyn
amic
Ran
ge[d
B]
+50dB
B=100kHz
B=1Hz
Figure 5: Noise floor increase due to a wideband signal.
1.2 Two-Tone Example
We use a classical two-tone measurement to demonstrate the interaction of the IMproducts of a DUT and spectrum analyzer. Here CW signals of two generators arecombined and fed into the DUT and the resulting 3rd order IM products are measuredby a spectrum analyzer. This is a typical measurement for characterizing the amount ofIM distortion of a device. Two tones at frequencies f1 and f2 of equal amplitude anduncorrelated phase, separated Δf apart, will produce 3rd order IM products at f1 - Δf andf2 + Δf. PΔ is used to characterize the amount of IM distortion. Figure 6 shows a blockdiagram of the measurement setup.
Figure 6: Measurement Setup without (path 1) and with DUT (path 2).
Intermodulation Distortion
1MA219_2e Rohde & Schwarz Interaction of Intermodulation Products between DUT and Spectrum Analyzer 8
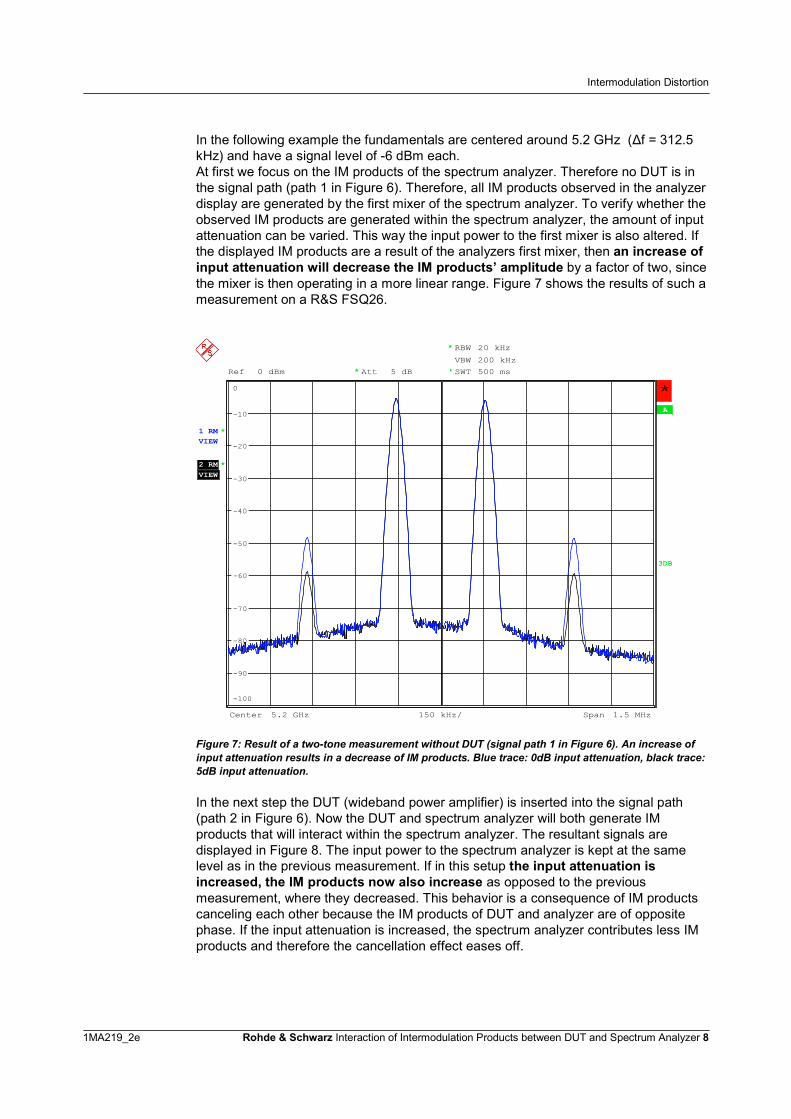
In the following example the fundamentals are centered around 5.2 GHz (Δf = 312.5kHz) and have a signal level of -6 dBm each.At first we focus on the IM products of the spectrum analyzer. Therefore no DUT is inthe signal path (path 1 in Figure 6). Therefore, all IM products observed in the analyzerdisplay are generated by the first mixer of the spectrum analyzer. To verify whether theobserved IM products are generated within the spectrum analyzer, the amount of inputattenuation can be varied. This way the input power to the first mixer is also altered. Ifthe displayed IM products are a result of the analyzers first mixer, then an increase ofinput attenuation will decrease the IM products’ amplitude by a factor of two, sincethe mixer is then operating in a more linear range. Figure 7 shows the results of such ameasurement on a R&S FSQ26.
A
* RBW 20 kHz
SWT 500 msRef 0 dBm
Center 5.2 GHz Span 1.5 MHz150 kHz/
VBW 200 kHz
VIEW
3DB
*Att 5 dB*
**1 RM
*2 RMVIEW
-100
-90
-80
-70
-60
-50
-40
-30
-20
-10
0
Figure 7: Result of a two-tone measurement without DUT (signal path 1 in Figure 6). An increase ofinput attenuation results in a decrease of IM products. Blue trace: 0dB input attenuation, black trace:5dB input attenuation.
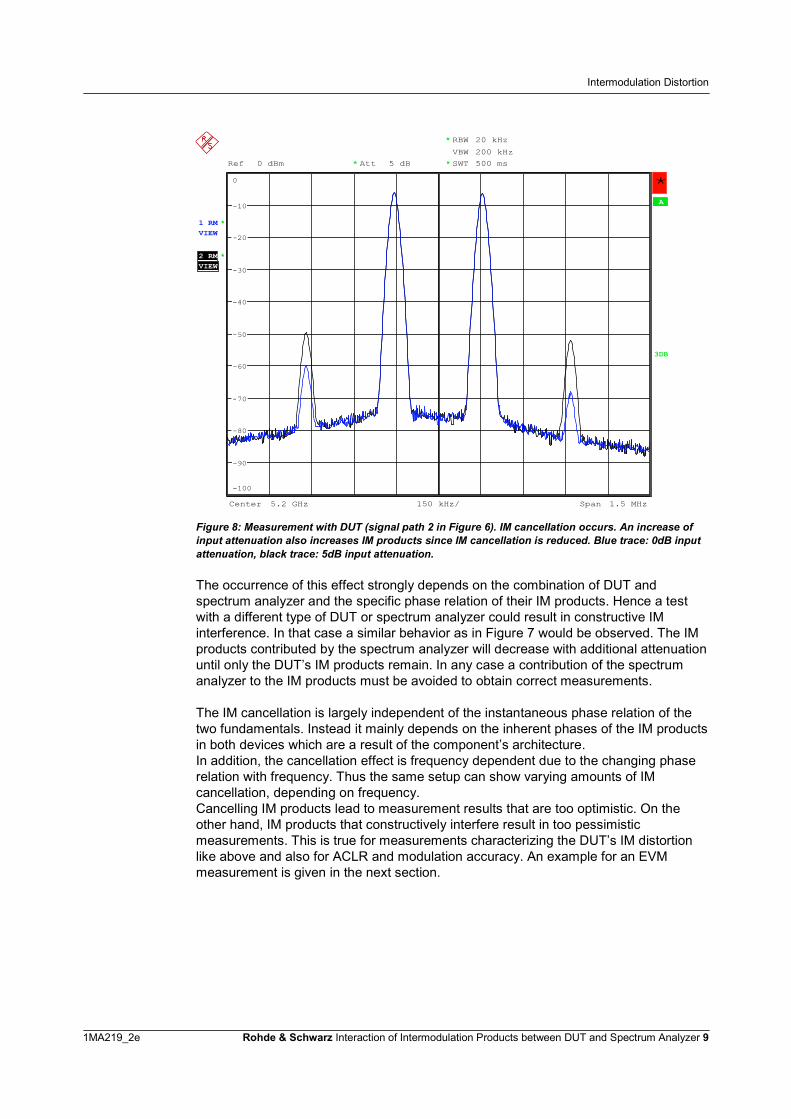
In the next step the DUT (wideband power amplifier) is inserted into the signal path(path 2 in Figure 6). Now the DUT and spectrum analyzer will both generate IMproducts that will interact within the spectrum analyzer. The resultant signals aredisplayed in Figure 8. The input power to the spectrum analyzer is kept at the samelevel as in the previous measurement. If in this setup the input attenuation isincreased, the IM products now also increase as opposed to the previousmeasurement, where they decreased. This behavior is a consequence of IM productscanceling each other because the IM products of DUT and analyzer are of oppositephase. If the input attenuation is increased, the spectrum analyzer contributes less IMproducts and therefore the cancellation effect eases off.
Intermodulation Distortion
1MA219_2e Rohde & Schwarz Interaction of Intermodulation Products between DUT and Spectrum Analyzer 9
A
* RBW 20 kHz
SWT 500 msVBW 200 kHz
Ref 0 dBm
Center 5.2 GHz Span 1.5 MHz150 kHz/
*1 RMVIEW
3DB
*Att 5 dB*
*
*2 RMVIEW
-100
-90
-80
-70
-60
-50
-40
-30
-20
-10
0
Figure 8: Measurement with DUT (signal path 2 in Figure 6). IM cancellation occurs. An increase ofinput attenuation also increases IM products since IM cancellation is reduced. Blue trace: 0dB inputattenuation, black trace: 5dB input attenuation.
The occurrence of this effect strongly depends on the combination of DUT andspectrum analyzer and the specific phase relation of their IM products. Hence a testwith a different type of DUT or spectrum analyzer could result in constructive IMinterference. In that case a similar behavior as in Figure 7 would be observed. The IMproducts contributed by the spectrum analyzer will decrease with additional attenuationuntil only the DUT’s IM products remain. In any case a contribution of the spectrumanalyzer to the IM products must be avoided to obtain correct measurements.
The IM cancellation is largely independent of the instantaneous phase relation of thetwo fundamentals. Instead it mainly depends on the inherent phases of the IM productsin both devices which are a result of the component’s architecture.In addition, the cancellation effect is frequency dependent due to the changing phaserelation with frequency. Thus the same setup can show varying amounts of IMcancellation, depending on frequency.Cancelling IM products lead to measurement results that are too optimistic. On theother hand, IM products that constructively interfere result in too pessimisticmeasurements. This is true for measurements characterizing the DUT’s IM distortionlike above and also for ACLR and modulation accuracy. An example for an EVMmeasurement is given in the next section.
Intermodulation Distortion
1MA219_2e Rohde & Schwarz Interaction of Intermodulation Products between DUT and Spectrum Analyzer 10
1.3 OFDM Example
To show the effect of IM distortion on modulation accuracy in terms of EVM, thisexample focuses on an OFDM signal. In an OFDM signal all subcarriers are separatedΔf apart. So IM products created by any pair of subcarriers will fall at subcarriers leftand right of the pair. Thus signal quality in an OFDM signal is strongly influenced by IMdistortion. For demonstration purposes a signal with a structure as shown in Figure 9 isutilized. Two carriers with QPSK modulation are followed by two unused carriers andthis structure is repeated across frequency several times. IM products of a pair ofsubcarriers will fall at the frequencies of the unused carriers left and right of the pair.By analyzing the constellation diagram of the unused carriers the signal distortion dueto IM products can be seen. Particularly the IM phase, which determines whetherconstructive or destructive IM interference occurs, can easily be visualized.The expected data points of the unused carriers lie in the origin of the constellationdiagram. Additive noise will spread the points around the origin. An IM distortion willshift these points out of the origin. In a real OFDM system unused carriers would notbe analyzed, but for demonstration this easily shows the effects of IM cancellation andan EVM value that is too optimistic.
Figure 9: OFDM carrier structure wit alternating pairs of active and inactive carriers. Red arrowsindicate the position of the resultant IM products.
Figure 10 shows the constellation diagram of an unused carrier for three measurementsetups. First a measurement without DUT (signal path 1 in Figure 6) and 0 dB inputattenuation is shown (magenta). Here the shifted symbols are a result of the FSQ26’sIM products. Next the DUT is put back into the setup (signal path 2) and 5 dB inputattenuation is used (blue) so that the spectrum analyzer doesn’t contribute to the IMdistortion. This way only IM products from the DUT influence the result. In the last stepthe input attenuation is reduced to 0 dB (red) and the Im products of the DUT andanalyzer interact with each other. Due to the opposite phases of the IM products, theIM products interfere destructively and cancellation occurs (compare with Figure 8).The symbols are shifted closer to the ideal symbol at the origin and this results in asignificantly reduced EVM. The modulation accuracy of the DUT would hence beoverestimated.
frequency
Intermodulation
Reference Symbolof unused carrier:(I,Q)‘ = (0,0)
(0,0)
I
Q
Estimating IM distortion
1MA219_2e Rohde & Schwarz Interaction of Intermodulation Products between DUT and Spectrum Analyzer 11
-0.02 -0.01 0 0.01 0.02-0.02
-0.015
-0.01
-0.005
0
0.005
0.01
0.015
0.02
Inphase
Qua
drat
ure
DUT +FSQ
1.56% EVM
0.72% EVM
DUT
FSQ
Figure 10: Constellation diagram of an unused carrier showing shifted symbols due to IMdistortion for different setups. The reference symbol lies in the center.
2 Estimating IM distortionThe chance of IM cancellation or amplification is given if DUT and spectrum analyzerboth have a similar T.O.I. and the IM products are of similar amplitudes. The DUT’strue amplitude PΔ will be distorted by the analyzers contribution. It is now the engineerstask to decide upon the amount of input attenuation to use in order to reduce the errordue to the analyzers IM contribution down to a desired level.
Even though the T.O.I. is listed in the data sheet, it is recommended to measure theactual value with a two-tone signal due to variations in T.O.I. between instruments. Inthe previous examples the measured T.O.I. of the FSQ26 is 15 dBm and of the DUT10 dBm. According to equation (2) the amplitudes of the IM products PΔ can becalculated based on the T.O.I.For an input amplitude of e.g. -10 dBm the FSQ26 generates IM products withPΔ,SA=50 dB (T.O.I.=15 dBm) and the DUT has PΔ,DUT=40 dB (T.O.I.=10 dBm). An IMproduct of the spectrum analyzer that is only 10 dB below the DUT’s IM products canalready lead to significant interference, both constructive and destructive, dependingon the phase relation.
Estimating IM distortion
1MA219_2e Rohde & Schwarz Interaction of Intermodulation Products between DUT and Spectrum Analyzer 12
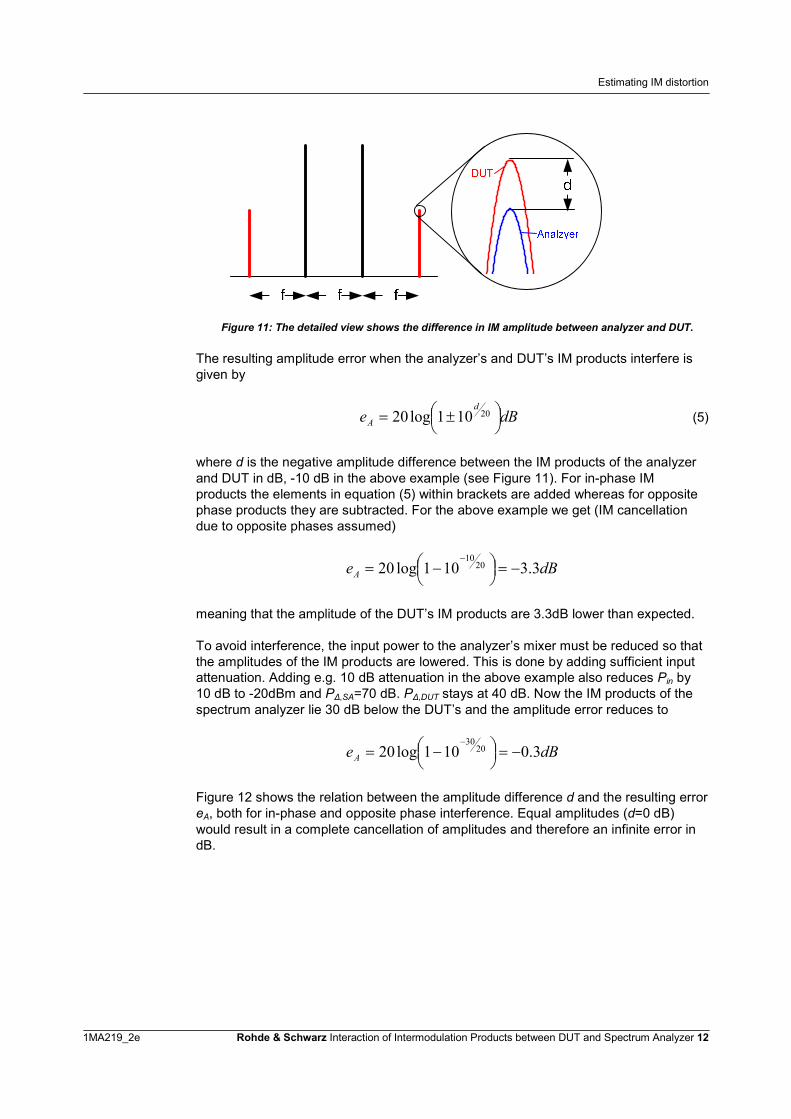
Figure 11: The detailed view shows the difference in IM amplitude between analyzer and DUT.
The resulting amplitude error when the analyzer’s and DUT’s IM products interfere isgiven by
dBed
A
20101log20 (5)
where d is the negative amplitude difference between the IM products of the analyzerand DUT in dB, -10 dB in the above example (see Figure 11). For in-phase IMproducts the elements in equation (5) within brackets are added whereas for oppositephase products they are subtracted. For the above example we get (IM cancellationdue to opposite phases assumed)
dBeA 3.3101log20 2010
meaning that the amplitude of the DUT’s IM products are 3.3dB lower than expected.
To avoid interference, the input power to the analyzer’s mixer must be reduced so thatthe amplitudes of the IM products are lowered. This is done by adding sufficient inputattenuation. Adding e.g. 10 dB attenuation in the above example also reduces Pin by10 dB to -20dBm and PΔ,SA=70 dB. PΔ,DUT stays at 40 dB. Now the IM products of thespectrum analyzer lie 30 dB below the DUT’s and the amplitude error reduces to
dBeA 3.0101log20 2030
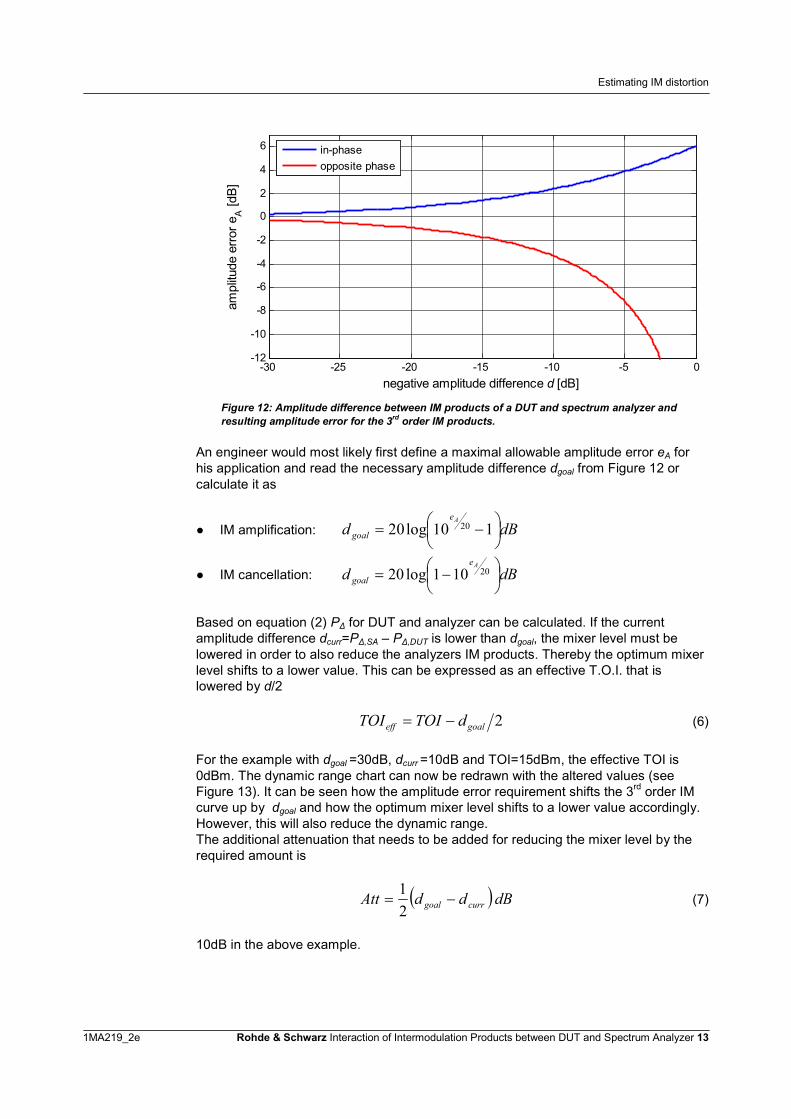
Figure 12 shows the relation between the amplitude difference d and the resulting erroreA, both for in-phase and opposite phase interference. Equal amplitudes (d=0 dB)would result in a complete cancellation of amplitudes and therefore an infinite error indB.
Estimating IM distortion
1MA219_2e Rohde & Schwarz Interaction of Intermodulation Products between DUT and Spectrum Analyzer 13
-30 -25 -20 -15 -10 -5 0-12
-10
-8
-6
-4
-2
0
2
4
6
negative amplitude difference d [dB]
ampl
itude
erro
reA
[dB]
in-phaseopposite phase
Figure 12: Amplitude difference between IM products of a DUT and spectrum analyzer andresulting amplitude error for the 3rd order IM products.
An engineer would most likely first define a maximal allowable amplitude error eA forhis application and read the necessary amplitude difference dgoal from Figure 12 orcalculate it as
● IM amplification: dBdAe
goal
110log20 20
● IM cancellation: dBdAe
goal
20101log20
Based on equation (2) PΔ for DUT and analyzer can be calculated. If the currentamplitude difference dcurr=PΔ,SA – PΔ,DUT is lower than dgoal, the mixer level must belowered in order to also reduce the analyzers IM products. Thereby the optimum mixerlevel shifts to a lower value. This can be expressed as an effective T.O.I. that islowered by d/2
2goaleff dTOITOI (6)
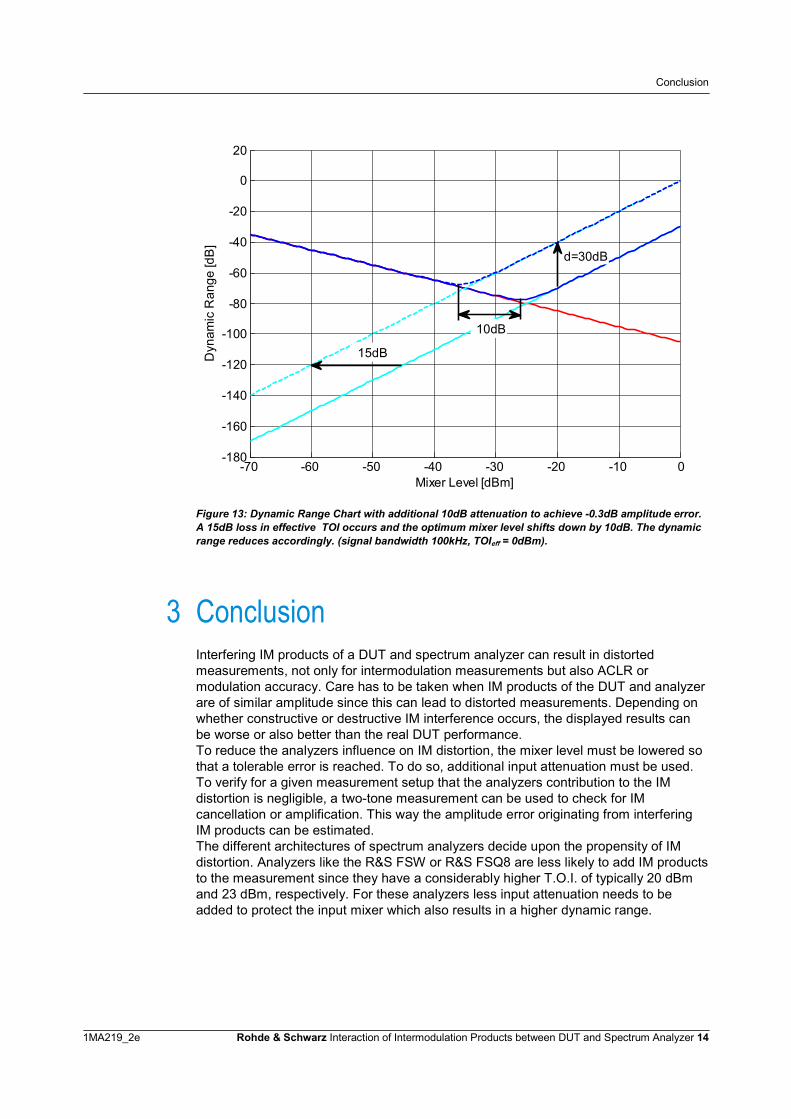
For the example with dgoal =30dB, dcurr =10dB and TOI=15dBm, the effective TOI is0dBm. The dynamic range chart can now be redrawn with the altered values (seeFigure 13). It can be seen how the amplitude error requirement shifts the 3rd order IMcurve up by dgoal and how the optimum mixer level shifts to a lower value accordingly.However, this will also reduce the dynamic range.The additional attenuation that needs to be added for reducing the mixer level by therequired amount is
dBddAtt currgoal 21
(7)
10dB in the above example.
Conclusion
1MA219_2e Rohde & Schwarz Interaction of Intermodulation Products between DUT and Spectrum Analyzer 14
-70 -60 -50 -40 -30 -20 -10 0-180
-160
-140
-120
-100
-80
-60
-40
-20
0
20
Mixer Level [dBm]
Dyn
amic
Ran
ge[d
B]
d=30dB
15dB
10dB
Figure 13: Dynamic Range Chart with additional 10dB attenuation to achieve -0.3dB amplitude error.A 15dB loss in effective TOI occurs and the optimum mixer level shifts down by 10dB. The dynamicrange reduces accordingly. (signal bandwidth 100kHz, TOIeff = 0dBm).
3 ConclusionInterfering IM products of a DUT and spectrum analyzer can result in distortedmeasurements, not only for intermodulation measurements but also ACLR ormodulation accuracy. Care has to be taken when IM products of the DUT and analyzerare of similar amplitude since this can lead to distorted measurements. Depending onwhether constructive or destructive IM interference occurs, the displayed results canbe worse or also better than the real DUT performance.To reduce the analyzers influence on IM distortion, the mixer level must be lowered sothat a tolerable error is reached. To do so, additional input attenuation must be used.To verify for a given measurement setup that the analyzers contribution to the IMdistortion is negligible, a two-tone measurement can be used to check for IMcancellation or amplification. This way the amplitude error originating from interferingIM products can be estimated.The different architectures of spectrum analyzers decide upon the propensity of IMdistortion. Analyzers like the R&S FSW or R&S FSQ8 are less likely to add IM productsto the measurement since they have a considerably higher T.O.I. of typically 20 dBmand 23 dBm, respectively. For these analyzers less input attenuation needs to beadded to protect the input mixer which also results in a higher dynamic range.
Literature
1MA219_2e Rohde & Schwarz Interaction of Intermodulation Products between DUT and Spectrum Analyzer 15
4 Literature[1] Fundamentals of Spectrum Analysis. C. Rauscher, Rohde & Schwarz, 2001[2] Measurement of Harmonics using Spectrum Analyzers. Application Note 1EF78,
2012[3] Intermodulation Distortion Measurements on Modern Spectrum Analyzers.
Application Note 1EF79, 2012
5 Ordering Information
Designation Type Order Number
R&S FSW8 Signal and Spectrum analyzer 2 Hz to 8 GHz 1312.8000.08
R&S FSW13 Signal and Spectrum analyzer 2 Hz to 13.6 GHz 1312.8000.13
R&S FSW26 Signal and Spectrum analyzer 2 Hz to 26.5 GHz 1312.8000.26
R&S FSW43 Signal and Spectrum analyzer 2 Hz to 43.5 GHz 1312.8000.43
R&S FSQ8 Signal analyzer 20 Hz to 8 GHz 1313.9100.08
R&S FSQ26 Signal analyzer 20 Hz to 26.5 GHz 1313.9100.26
R&S FSQ40 Signal analyzer 20 Hz to 40 GHz 1313.9100.40
About Rohde & SchwarzRohde & Schwarz is an independent groupof companies specializing in electronics. It isa leading supplier of solutions in the fields oftest and measurement, broadcasting,radiomonitoring and radiolocation, as well assecure communications. Established morethan 75 years ago, Rohde & Schwarz has aglobal presence and a dedicated servicenetwork in over 70 countries. Companyheadquarters are in Munich, Germany.Environmental commitment
● Energy-efficient products● Continuous improvement in
environmental sustainability● ISO 14001-certified environmental
This application note and the suppliedprograms may only be used subject to theconditions of use set forth in the downloadarea of the Rohde & Schwarz website.
R&S® is a registered trademark of Rohde & SchwarzGmbH & Co. KG; Trade names are trademarks of theowners.