33
224 INTERACTION OF JOB DISAMENITIES, JOB SATISFACTION, AND SICKNESS ABSENCES: EVIDENCE FROM A REPRESENTATIVE SAMPLE OF FINNISH WORKERS Petri Böckerman Pekka Ilmakunnas
| Date post: | 18-Feb-2017 |
| Category: |
Government & Nonprofit |
| Upload: | palkansaajien-tutkimuslaitos |
| View: | 278 times |
| Download: | 0 times |

224INTERACTION OF
JOB DISAMENITIES, JOB SATISFACTION,
AND SICKNESSABSENCES:
EVIDENCE FROMA REPRESENTATIVE
SAMPLE OFFINNISH WORKERS
Petri BöckermanPekka Ilmakunnas
PALKANSAAJIEN TUTKIMUSLAITOS •TYÖPAPEREITA LABOUR INSTITUTE FOR ECONOMIC RESEARCH • DISCUSSION PAPERS
* This study has been funded by Palkansaajasäätiö.
** Corresponding author. Labour Institute for Economic Research. Address: Pitkänsillanranta 3 A, 6. krs. FI-00530 Helsinki, FINLAND. Phone: +358-9-25357330. Fax: +358-9-25357332.
E-mail: [email protected] *** Helsinki School of Economics and HECER. Address: P.O. Box 1210. FI-00101 Helsinki,
FINLAND. Phone: +358-9-43138746, Fax: +358-9-43138738. E-mail: [email protected]
Helsinki 2006
224
Interaction of Job Disamenities, Job Satisfaction, and Sickness Absences: Evidence From a Representative Sample of Finnish Workers*
Petri Böckerman** Pekka Ilmakunnas***

ISBN 952−209−033−6 ISSN 1795−1801
1
TIIVISTELMÄ
Tutkimuksessa tarkastellaan epämukavien työolojen vaikutusta sairauspoissaoloihin.
Aineistona käytetään Tilastokeskuksen työolotutkimusta, joka on edustava otos suoma-
laisista palkansaajista. Ko. aineistossa on runsaasti työpaikan epämukavuuksia kuvaavia
muuttujia. Tulosten mukaan epämukavat työolot lisäävät selvästi sairauspoissaoloja.
Sairauspoissaolot ovat myös vähäisempiä korkean työttömyyden alueilla. Useamman
yhtälön mallit paljastavat sen, että epämukavuudet aiheuttavat työtyytymättömyyttä, jo-
ka puolestaan lisää sairauspoissaoloja.
ABSTRACT
This paper explores the potential role of adverse working conditions in the
determination of workers’ sickness absences. Our data contain detailed information on
the prevalence of job disamenities at the workplace from a representative sample of
Finnish workers. The results from reduced-form models reveal that workers facing
adverse working conditions tend to have a greater number of sickness absences. In
addition, reduced-form models clearly show that regional labour market conditions are
an important determinant of sickness absences. Hence, sickness absences are more
common in regions of low unemployment. Recursive models suggest that the
prevalence of harms at the workplace is associated with job dissatisfaction and
dissatisfaction with workers’ sickness absences.
JEL Classification: J28, I10
Key words: working conditions, job satisfaction, sickness absences
INTRODUCTION
The average proportion of the EU workforce that misses work owing to illness or injury
is 14.5% according to the European Survey on Working Conditions (Gimeno et al.,
2004). However, this average figure hides a large cross-country variation in
absenteeism. The sickness absence rates are lower in Southern European countries
compared with Central and Northern European countries;1 the rates vary from a low of

2
6.7% in Greece to a high of 24% in Finland.2 Sickness absences have occupied a central
position in the Swedish labour market debate for many years (e.g. Holmlund, 2004).
Swedish research has discovered that the level of unemployment is a matter of
importance for the prevalence of sickness absences, among other things. In particular,
the number of sickness absences tends to increase as there is a decrease in
unemployment. Holmlund (2006) points out that pro-cyclical absenteeism reinforces the
negative employment effects of adverse shocks to labour demand and it symmetrically
reinforces the positive employment effects of favourable shocks. A similar cyclical
pattern has been discovered in a number of other countries (e.g. Arai and Thoursie,
2005; Askildsen et al., 2005; Boone and Van Ours, 2006).
Given that Finland has the highest share of employees that miss work because of illness
or injury in the European Survey on Working Conditions, it is of interest to examine the
determinants of absenteeism there. The debate about the ways to reduce the number of
sickness absences has recently arrived in Finland. The number of sickness absences has
increased in Finland since the end of the great depression of the early 1990s,3 but the
reasons for this are largely unknown. According to other data, sickness absences as a
share of the standard annual working time is still much lower in Finland than in Norway
or in Sweden, but higher than in Denmark or in Iceland (Nyman et al., 2002) (Figure 1).
In particular, Holmlund (2004) points out that Norway and Sweden have experienced
quite substantial changes in the number of sickness absences over the past 15 years. In
contrast, the number of sickness absences relative to total working time has been more
stable in Finland compared with Sweden. Accordingly, structural factors (including
adverse working conditions) are likely to account for much of the total number of
sickness absences in Finland.
Figure 1 around here
Sickness absences constitute a substantial loss of actual working time. The latest report
on the time use of the private sector workers by the Confederation of Finnish Industries
(2006) reveals that Finnish workers spent, on average, eleven days on sickness absences
in the year 2005. This figure is around six per cent of the standard annual working time.
Sickness absences impose substantial costs on both firms and co-workers, because they
require often reorganisation at the workplace in order to facilitate the firm’s daily
3
operations. Indeed, the Confederation of Finnish Industries (2006) has estimated that the
total cost of sickness absences is almost 2 billion Euros annually in the private sector
alone. In particular, a reduction in the number of sickness absences would provide a
considerable increase in the effective labour supply, which will shrink owing to the
rapid ageing of the population. Hence, it would help to ease the problems associated
with the shortage of labour that are in sight.
There are a number of medical studies that have analysed the factors that have an
influence on the prevalence of sickness absences.4 They typically focus on a rather
limited number of risk factors at a time as determinants of sickness absences, and the
potential connection between job satisfaction and sickness absences has not been
analysed in detail. Further, they almost exclusively (at least among the Finnish studies)
use data from very specific sectors of the labour market, like the municipal sector. This
makes it rather hard to generalize the results obtained. Importantly, the factors that have
a great deal to do with sickness absences are not necessarily the same in the municipal
sector vs. the private sector. In particular, the contribution played by job disamenities
has sometimes been investigated in an environment that contains a lot of stress factors
(for instance, using data from hospitals). This can give them an extravagant role in the
overall determination of sickness absences from the perspective of the economy taken
as a whole. In this paper, we use data that constitute a representative sample of workers,
instead. In addition, employer characteristics (such as plant size) are not usually
included among explanatory variables for sickness absences and recursive models for
the determination of job satisfaction and sickness absences that are able to reveal
interactions between the key variables of interest have not been estimated. For these
reasons, there is room for additional empirical studies on this important issue.
Workers’ subjective perceptions regarding the prevalence of various job disamenities
represent a factor of great importance in the determination of sickness absences. There
is earlier international evidence that job dissatisfaction increases the number of sickness
absences (e.g. Clegg, 1983; Brown and Sessions, 1996). Accordingly, it is not
unreasonable to assume that an unpleasant working environment stimulates the level of
workers’ dissatisfaction. From the point of view of practical implications, it is important
to keep in mind that management always has some influence on the level of job
4
satisfaction and control over the working environment. This means that employers can,
at least in principle, have an influence on the number of sickness absences.
We use Finnish data to analyse workers’ sickness absences. Finland has a relatively
centralized wage bargaining system, which sets a floor to firm-level pay determination.
Although firms can pay their employees more than what the centralized agreement
stipulates, the system still leads to wage compression. This may prevent the creation of
wage differentials that would compensate for the existence of job disamenities.
Accordingly, our earlier empirical evidence points out that perceived working
conditions have a very minor role in the determination of individual wages (Böckerman
and Ilmakunnas, 2006). In contrast, adverse working conditions substantially increase
the level of job dissatisfaction and the perception of unfairness of pay. It is interesting to
study whether this dissatisfaction increases the number of sickness absences. Our paper
differs from the earlier ones in this field of research, because we have a data set, the
Quality of Work Life Survey, that makes it possible to model the relationships between
working conditions, satisfaction, and sickness absences.
In this paper, we discover, based on reduced-form models, that workers facing adverse
working conditions tend to have a greater number of sickness absences. In addition,
regional labour market conditions are an important determinant of sickness absences;
the absences are more common in regions of low unemployment. Recursive models
suggest that the prevalence of harms at the workplace is associated with job
dissatisfaction and dissatisfaction, in turn, is associated with sickness absences.
The paper proceeds as follows. In the next section we describe our modelling
approaches and then we provide an overview of the data and variables. The last two
sections report the results and conclude the paper.
MODELLING APPROACHES
From the theoretical perspective, Allen (1981) develops an economic model for the
determination of the equilibrium number of absences that underlines absences as the
outcome of the worker’s labour-leisure choice, subject to constraints imposed by the
employer. Before Allen (1981), absences were often seen as an indication of employees’
5
low morale or unqualified management. The basic idea of Allen’s theoretical reasoning
is that if the contracted working time is greater than the number of the desired hours of
work, employees have an incentive to miss work. This situation may arise for some
employees, because information in the labour market is not perfect and searching is
always costly. Absenteeism is, therefore, viewed as a way to adjust the personal labour
supply. In particular, a worker is absent whenever the benefits of not working are
greater than the costs. These costs include the potential wage penalties for being absent.
From the perspective of our paper, it is important to point out that the prevalence of
adverse working conditions (with the increased likelihood of work-related injuries and
diseases) directly decreases employees’ total utility from work, making absence more
likely, other things being equal. In particular, this is likely to happen when wage does
not compensate for the existence of job disamenities. Taken together, Allen’s (1981)
model gives a clear empirical prediction that the number of sickness absences declines
as there is an increase in the wage level, and their number increases while work is being
done in adverse working conditions, other things being equal.
In our first set of models, we explain the alternative indicators of sickness absences
directly by individual characteristics, firm characteristics, and working conditions. In
the second, extended model, we use working conditions, job dissatisfaction, and
absenteeism as binary indicators. We explain adverse working conditions by various
industry, occupation, and firm variables. This follows the view, familiar from the
compensating wage differentials literature, that working conditions may be endogenous
(e.g. Daniel and Sofer, 1998). Job dissatisfaction is then explained by these working
conditions and the employees’ personal characteristics. Finally, sickness absenteeism is
explained by job dissatisfaction and some other personal characteristics. This model
forms a system of probit models that have endogenous dummy explanatory variables.
Since the system is recursive, it can be estimated as a multivariate probit model. This
approach is similar to that used by Shields and Price (2002) in the context of workers’
intentions to quit. They used only one indicator of working conditions, racial
harassment.
6
Explaining workers’ sickness absences by means of job disamenities
We start the analysis with reduced-form models, where we explain the indicators of
workers’ sickness absences directly by means of adverse working conditions. As
explanatory variables we have dummy variables that describe various aspects of job
disamenities and various individual and workplace characteristics. Since the number of
sickness absences during the past six months is a discrete variable and has a skewed
distribution, we start by estimating a Poisson regression as our baseline specification.
To relax the assumption of equal mean and variance required in the use of the Poisson
model, we also estimate negative binomial models. To check the robustness of our
results from the baseline specification further, we estimate the zero-inflated (or zero-
altered) Poisson regression model for the number of absences and probit models for
reporting a positive number of sickness absences.5
In addition to the individual employees’ characteristics, we also include, among the
explanatory variables, various characteristics of the workplace, such as indicators of
high performance work practices (team work), plant size, industry, and the regional
unemployment rate. The variables are described in more detail in the data section.
Interaction of disamenities, dissatisfaction and sickness absences
The second model is formed in three steps. In the first step we explain K separate latent
disamenities zj* by variables X1. The latent disamenities zj* and their discrete
observation rule are
zji* = X1iβ1j + ε1ji, j=1,…,K
zji = 1(zji*>0)
where 1(.) is an indicator function and i=1,…,N indexes the individuals. In the second
stage, latent dissatisfaction d* is explained by the realized disamenities z and variables
X2:
di* = Σjγjzji + X2iβ2 + ε2i
di = 1(di*>0)

7
In the final stage, latent sickness absenteeism q* is explained by realized job
dissatisfaction d and variables X3:
qi* = δdi + X3iβ3 + ε3i
qi = 1(qi*>0)
It is assumed that in all stages there are unobserved individual characteristics and,
therefore, the error terms of the different stages are correlated. The unobserved
individual characteristics can, for example, be attitudinal factors. The K+2 equations
form a system of discrete dependent variable models with endogenous dummy
explanatory variables. However, the system is recursive, i.e. sickness absences do not
explain satisfaction and disamenities, and satisfaction does not explain disamenities.
Hence, it is possible to estimate the model as a multivariate probit model (see Greene,
2003). We use the Geweke-Hajivassiliou-Keane (GHK) simulated maximum likelihood
estimator implemented to Stata by Cappelari and Jenkins (2003).
No exclusion restrictions are needed for the identification of the model (Wilde, 2000),
but it may still be a good practice to include them.6 We therefore assume that the
variables X1, X2, and X3 are not the same. In X1 we include occupation and industry
dummies that do not appear in the other equations, and some characteristics of the
workplace, like plant size. In X2 we include personal characteristics, like the level and
field of education. Finally, X3 comprises variables that are related to the individual. In
addition, X3 includes regional unemployment that has been found to be a matter of
importance for sickness absences (Holmlund, 2004), but there is no particular reason to
assume that it would matter for job satisfaction or job disamenities.
DATA
The data set that we are using in this paper is the Quality of Work Life Survey (QWLS)
of Statistics Finland (SF). It is conducted at irregular intervals. We use the data from the
year 1997. QWLS provides a representative sample of Finnish wage and salary earners,
because the initial sample for QWLS is derived from a monthly Labour Force Survey
(LFS) of SF, where a random sample of the working age population is selected for a
telephone interview. The 1997 QWLS was based on LFS respondents in September and
8
October who were 15-64-old wage and salary earners with a normal weekly working
time of at least five hours. 3795 individuals were selected for the QWLS sample and
invited to participate in a personal face-to-face interview. Out of this sample, 2978
persons, or around 78%, participated (Lehto and Sutela, 1999). Owing to missing
information on some variables for some workers, the sample size used in this study is
around 2800 observations.
The QWLS survey contains a number of questions about the subjective views of
workers with respect to their working conditions, as well as about the perceived job
satisfaction. In addition, QWLS includes information on the respondents’ personal
characteristics and work experience. SF supplements QWLS with information from the
LFS on, for example, working time and exact labour market status. Supplementary
information on the industry and location of the employer as well as annual earnings and
the level and field of education of the respondents was gathered from various registers
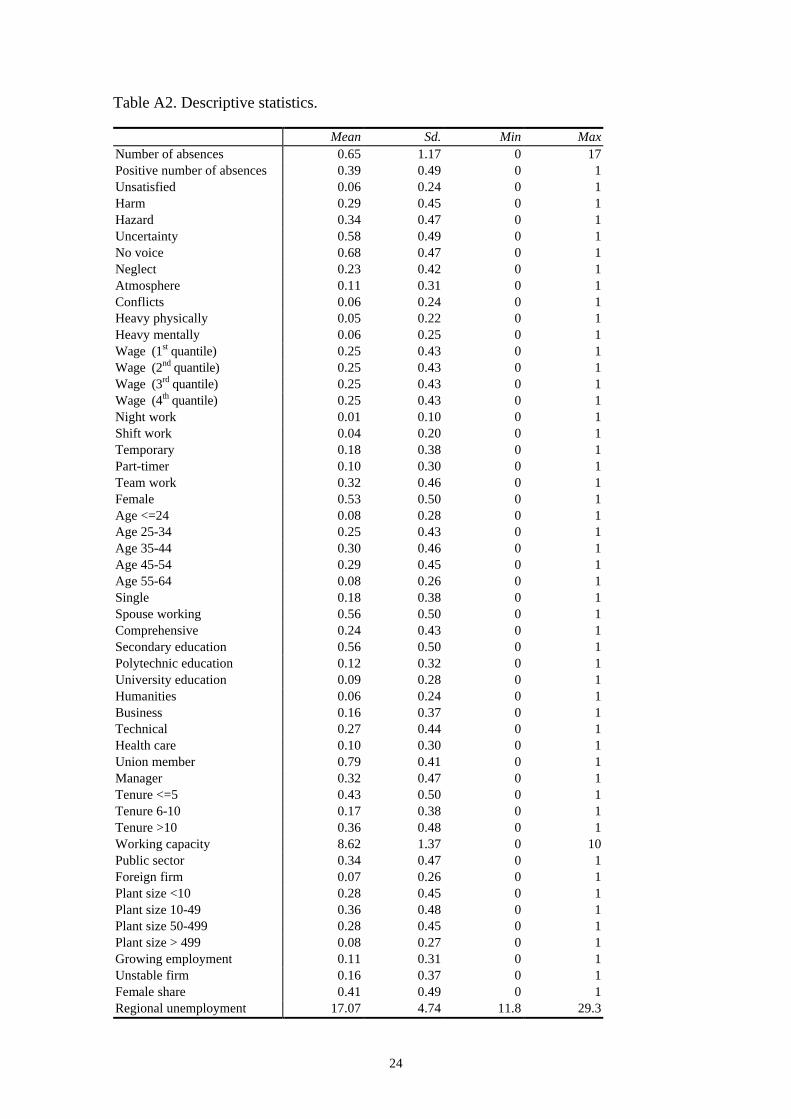
maintained by SF. The variables that we are using are described in Appendix (Table
A1), and Appendix (Table A2) reports descriptive statistics.
The phenomenon that we are interested in explaining is workers’ sickness absenteeism.
Sickness absences are documented in the QWLS data as absences because of illness
(number of times during the past six months). Sickness absences are self-reported, but
there is no particular reason to believe that employees give systematically biased
answers to this particular question, because their identity is not known to their
employers. A major advantage of information recorded in the QWLS data is that it also
contains short sickness absences that are not recorded by the Social Insurance
Institution (KELA), which pays out sickness benefits to the affected employees.7 The
reason for this is that short sickness absences do not entitle employees to payment of
sickness benefits, but they obtain normal pay from the employers. This is important,
because most of the sickness absences are presumably short. However, the QWLS data
do not contain information about the duration of individual sickness spells.8
The distribution for the number of sickness absences during the past six months is
shown in Figure 2. Around 40% of all workers in the QWLS report a positive number of
sickness absences for the period of the past six months. An overwhelming majority of
those who have been absent owing to illness have been absent only once. After that
9
there is a steep decline, as expected. At first glance, the Poisson distribution seems to
approximate the distribution of our dependent variable quite closely. In addition, we
form a dummy variable for those that have been absent at least once, which is used with
probit models.
Figure 2 around here
Job dissatisfaction in the QWLS data is measured by the five-point Likert scale: 1 (very
satisfied; 30.6 per cent of respondents), 2 (quite satisfied; 63.1 per cent), 3 (rather
dissatisfied; 5.3 per cent), and 4 (very dissatisfied; 1 per cent). We form a dissatisfaction
dummy (Unsatisfied) that indicates the two highest dissatisfaction categories 3 and 4
(6.3 per cent of respondents).
The subjective valuations of harms and hazards related to working conditions are
measured in the QWLS survey by the use of different categories. Our most important
variables for job disamenities describe the prevalence of harms and hazards at the
workplace. For perceived harms, there is a five-point Likert scale in which the highest
category corresponds to the perception by a worker that a feature of working conditions
is ‘very much’ an adverse factor. For perceived hazards, the highest category among the
three possibilities is the one in which the respondent considers a feature at the
workplace as ‘a distinct hazard’. Responses to the questions about adverse working
conditions can be aggregated by forming a dummy variable that equals one if there is at
least one clearly adverse factor (Harm) and a dummy that equals one if there is at least
one distinct hazard (Hazard). These variables capture different aspects of the
workplace.
We use the following dummy variables as other job disamenities. Uncertainty tells us
that there is at least one clear insecurity factor at the workplace, No voice is a dummy
for those that have no control over their work, Neglect is a dummy for the existence of
at least one aspect where the worker gets no support from superiors; Atmosphere tells us
that the worker experiences at least one negative aspect in the work atmosphere almost
daily; and Conflicts is a dummy for experiencing conflicts at the workplace.
Additionally, we have dummy variables for physically or mentally very demanding
work (Heavy physically and Heavy mentally, respectively).
10
Our main interest is in the effect of job disamenities, but we include a large set of
control variables, which can be regarded as ‘the usual suspects’ based on the literature
(e.g. Brown and Sessions, 1996; Holmlund, 2004). The logarithm of hourly earnings is
classified into quantiles to form wage group indicators (Wage with four groups). We
include dummy variables for night work (Night work), shift work (Shift work),
temporary contract (Temporary), part-time work (Part-timer), and for working a high
share of time in team work (Team work). We incorporate typical human capital
variables that are dummies for females (Female), age (Age with five groups), marital
status (Single), working spouse (Spouse working), the level of education (Secondary
education, Polytechnic education, and University education) and the field of education
(Humanities, Business, Technical, Health care), union membership (Union member)
and managerial tasks (Manager). In addition, we include a work history variable
(Tenure, with three groups by length). There is also some information available on the
health of the worker, self-assessment of work capacity (Working capacity, on a scale of
0 to 10). Information on the employer includes dummies for the public sector and
foreign private owners (Public sector, Foreign firm), employer size (Plant size with
four categories), and dummies for growing employment (Growing employment),
unstable financial situation (Unstable firm) and high share of female employees
(Female share). Finally, we incorporate the Regional unemployment rate for capturing
the regional variation, industry dummies (14 industries) and dummies for 10
occupations.9
RESULTS
Results from reduced-form models
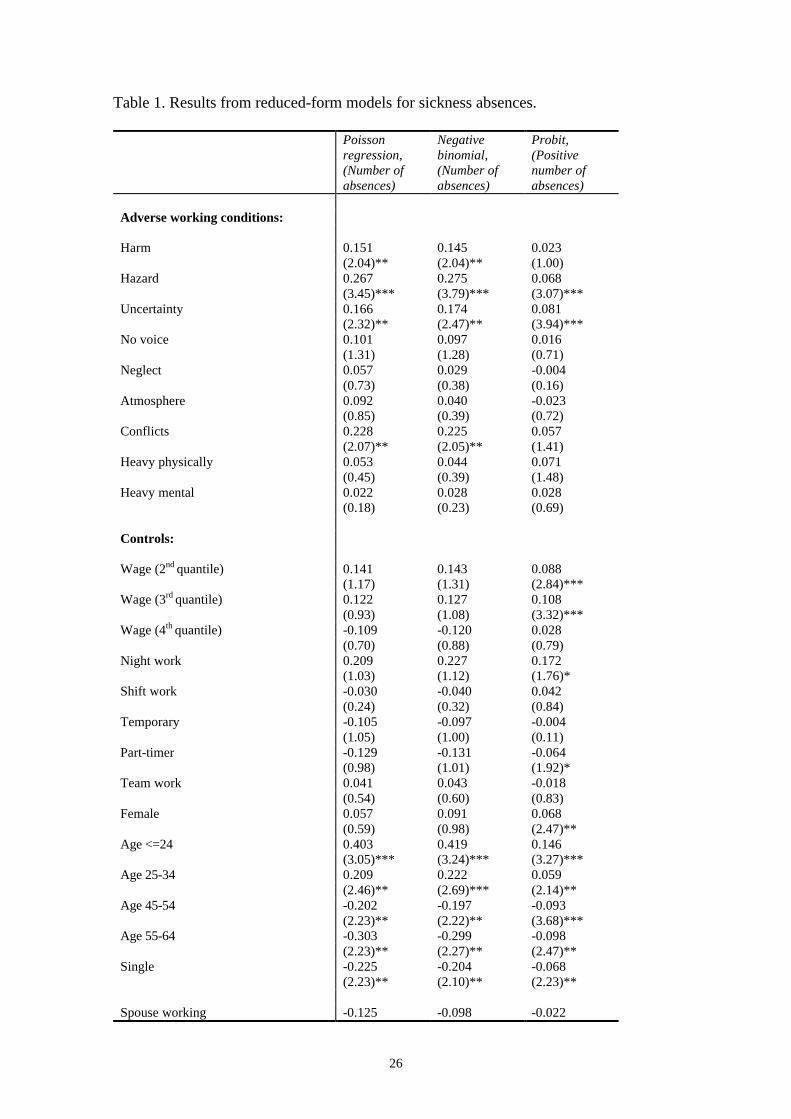
The results from our baseline specification that is based on Poisson regression reveal
that job disamenities are, beyond doubt, important determinants of sickness absences. In
particular, experiencing at least one notable harm or hazard or experiencing uncertainty
clearly increases the number of sickness absences (Table 2, Columns 1-2). In addition,
experiencing conflicts at the workplace positively contributes to the number of sickness
absences. In contrast, Broström et al. (2004) report that the effect of adverse working
conditions on sickness absences is, for the most part, mixed in Sweden, although there
is evidence that some indicators of adverse working conditions increase sickness

11
absences. The fact that experiencing uncertainty increases the prevalence of sickness
absences is in line with the earlier Finnish studies that, by using longitudinal data on
municipal employees, have documented that organisational downsizing positively
contributes to sickness absences (Kivimäki et al., 2000). It is interesting to note that
physically strenuous work (captured by our Heavy physically variable) does not increase
the number of sickness absences. This confirms that psychological factors play an
important role in the determination of sickness absences.
Table 1 around here
We summarize the most interesting results regarding the control variables (Table 1,
Columns 1-2). The frequency of sickness absences clearly decreases with age. Singles
are less often absent. There is some evidence that employees with polytechnic education
are less often absent owing to sickness compared with employees with only
comprehensive education. In contrast, employees whose education field is health care or
social work are more often absent. This emerges to be most likely because those
particular jobs contain particular stress factors. Bonato and Lusinyan (2004) observe
that permanent workers are more often on sickness absences, but this is not the case in
Finland according to our estimation results. On the other hand, Virtanen et al. (2001)
provide earlier evidence that contingent employees have lower levels of sickness
absences compared with permanent employees, by using data from 10 Finnish hospitals.
Their result seems to be specific to that very particular labour market, but it does not
prevail when using a representative sample of Finnish workers.10 Heywood and Jirjahn
(2004) argue that absences should be lower in team work, because they cause more
problems for co-workers. This pattern does not hold in our data. However, there is some
evidence that managers are less often absent, which arises most likely because it is more
difficult to replace their work contribution. Workers that have been over ten years in the
same firm (for a given age) are more often on sickness absences. It is not surprising that
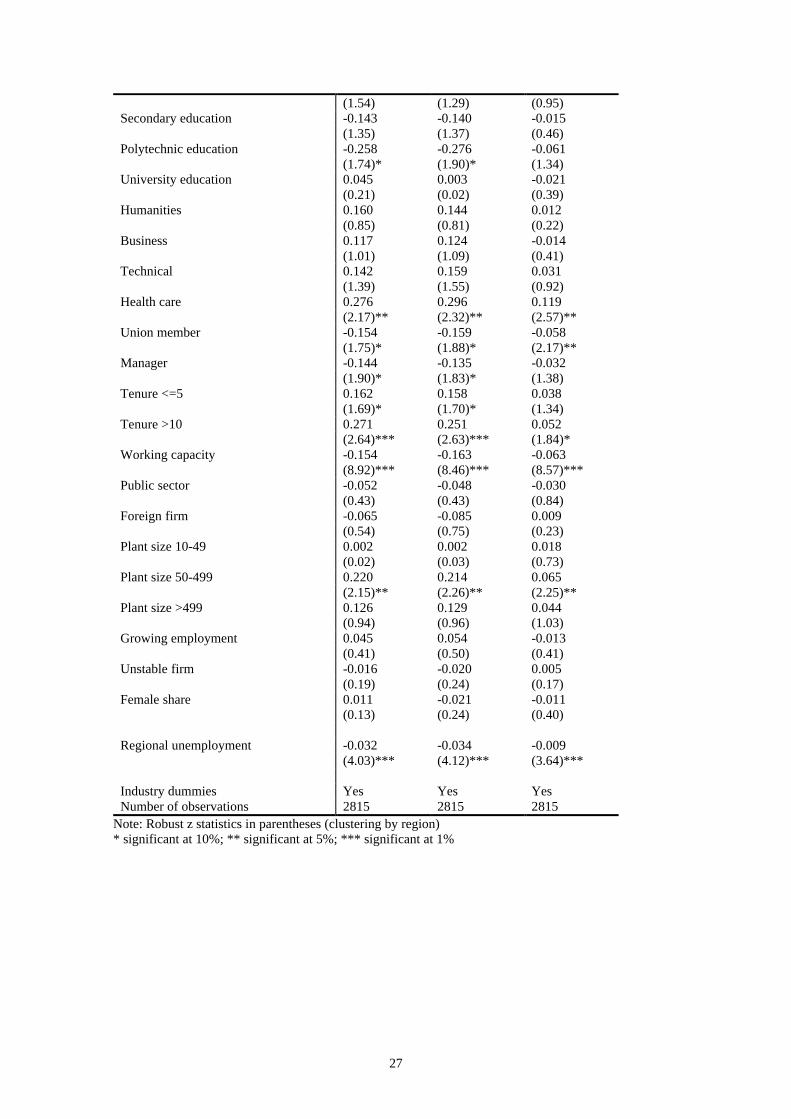
high self-assessed working capacity reduces absences.11 Broström et al. (2004) have
reported exactly the same result for Sweden.
Taken together, the employer characteristics included (beyond the unreported industry
dummies and a positive coefficient for the plant size category 50-499) are largely not
statistically significant. This is in sharp contrast to findings by Arai and Thoursie (2004)
12
for Sweden, because they report substantial employer effects. Bonato and Lusinyan
(2004) argue that sickness absences tend to be more common in the public sector in
Europe, which accounts for some of the differences in the number of sickness absences
across countries. Our Public sector variable is not significant, but the variable for
education in the field of health care obtains a significantly positive coefficient. Since
most health care workers are in the public sector, this supports the view that
absenteeism is high at least in some public sector activities. It is interesting to note that
sickness absences are not concentrated in the smallest plants, where there are perhaps
fewer financial opportunities to improve the working environment.
As expected, sickness absences are clearly less common in the regions with high
unemployment. The macroeconomic correlation between unemployment and sickness
absences has been found in other empirical studies from the Nordic countries (e.g.
Holmlund, 2004). In Finland, unemployment is at a substantially higher level in the
eastern and northern parts of the country. Therefore, sickness absences are more
common in Southern Finland. Virtanen et al. (2005) have earlier reported that high local
unemployment decreases the level of short-term sickness absences among public sector
workers in Finland. There are two explanations for this finding (e.g. Askildsen et al.,
2005). High unemployment may discipline workers and there may be compositional
effects over the business cycle. The latter refers to a situation in which marginal
workers (for instance, workers with poor health) that are more prone to be absent from
work are hired during economic upswings. Because labour market regulations that have
an influence on sickness absences are similar in all regions, the regional variation in
sickness absences most likely reflects the discipline effect of unemployment. The
unreported indicators for industries reveal that sickness absences are more frequent in
manufacturing than in other sectors. This pattern is in line with that reported by the
Confederation of Finnish Industries (2006, p. 8).
The results that stem from the negative binomial model (Table 1, Column 2) are very
similar to those from Poisson regression. In addition, we estimated the zero-inflated (or
zero-altered) Poisson regression model in order to account for the prevalence of zero
counts in the dependent variable (Cameron and Trivedi, 1998). The results regarding the
effects of harms and hazards remain the same. (The results not reported in the tables.)
13
The probit model for reporting a positive number of sickness absences reveals some
interesting additional patterns (Table 1, Column 3). To make it easier to read the results
from the probit models, they are reported as marginal effects. Experiencing at least one
notable hazard or experiencing uncertainty clearly increases the likelihood of reporting
a positive number of sickness absences. However, Harm is no longer significant. The
estimated marginal effects are quite large. To illustrate this, according to the point
estimates, those who have at least one clear hazard at the workplace have a 7 per cent
higher probability of reporting a positive number of sickness absences.
The control variables included show that employees who are located in the second or
the third highest wage category are more likely to have sickness absences than
employees located in the lowest wage category, other things being equal. This
observation is in conflict with the theory that predicts that the number of (sickness)
absences should decline as there is an increase in the wage level (e.g. Allen, 1981;
Brown and Sessions, 1996). In particular, the non-monotonic effect of wage on the
existence of sickness absences means that it is more difficult for firms to decrease
absences by increasing the employees’ wage level than by reducing job disamenities.
Females are more likely to report a positive number of sickness absences. The
magnitude of the estimated marginal effect is substantial, because females are around
7% more likely to report a positive number of sickness absences compared with males.
Indeed, Holmlund (2004) notes that it has become a stylized fact of the literature that
women have higher sickness absence rates than males.12 In addition, the age effect
appears to be large. Hence, employees that are under 24 years are 14% more likely to
report a positive number of sickness absences compared with employees aged 35-44. It
is quite possible that older employees have longer sickness absence spells in contrast to
the more frequent sickness absences among younger workers.13 It is less likely that
union members report a positive number of sickness absences. In addition, there is some
evidence that part-timers are less likely to have sickness absences. One reason for this is
that full-time workers may constitute the firm insiders that are not afraid of losing their
jobs because of spending time on sickness absences.
Among the other variables, the impact of marital status, health care education, tenure,
working capacity, plant size and regional unemployment have significant effects with
the same signs as in the Poisson model.14 Overall, the results regarding the control
14
variables vary somewhat across the models. However, the influence of adverse working
conditions and regional labour market conditions on the prevalence of sickness absences
is more consistent across the models than the impact of specific worker or firm
characteristics.15
Results from recursive models
The estimation of reduced-form models with job satisfaction as one of the explanatory
variables for sickness absences reveals that the level of job (dis)satisfaction (Unsatisfied)
does not directly contribute to the number of absences during the past six months. (The
results are not reported.)16 This provides one motivation to use recursive models. The
idea in the recursive structure is that firm characteristics and occupation determine the
disamenities, that disamenities together with personal characteristics and wage
determine job dissatisfaction, and that dissatisfaction together with personal
characteristics, health, and regional unemployment determine absenteeism. As
disamenities, we focus on the Harm, Hazard, and Uncertainty variables, because they
had the most significant effect on sickness absences based on reduced-form models
(Table 1, Columns 1-3). The explanatory variables for each disamenity (Harm, Hazard,
or Uncertainty) are Public sector, Foreign firm, Plant size, Unstable firm, industry
dummies and occupation dummies. The variables in the equation for job dissatisfaction
are the three disamenities, Wage categories, Temporary, Part-timer, Female, Age
categories, the indicators for the level and field of education, Manager and Tenure
categories. Finally, having a positive number of sickness absences is explained by
Unsatisfied, Temporary, Part-timer, Female, age categories, the indicators for the level
and field of education, Tenure categories, Working capacity and Regional
unemployment.
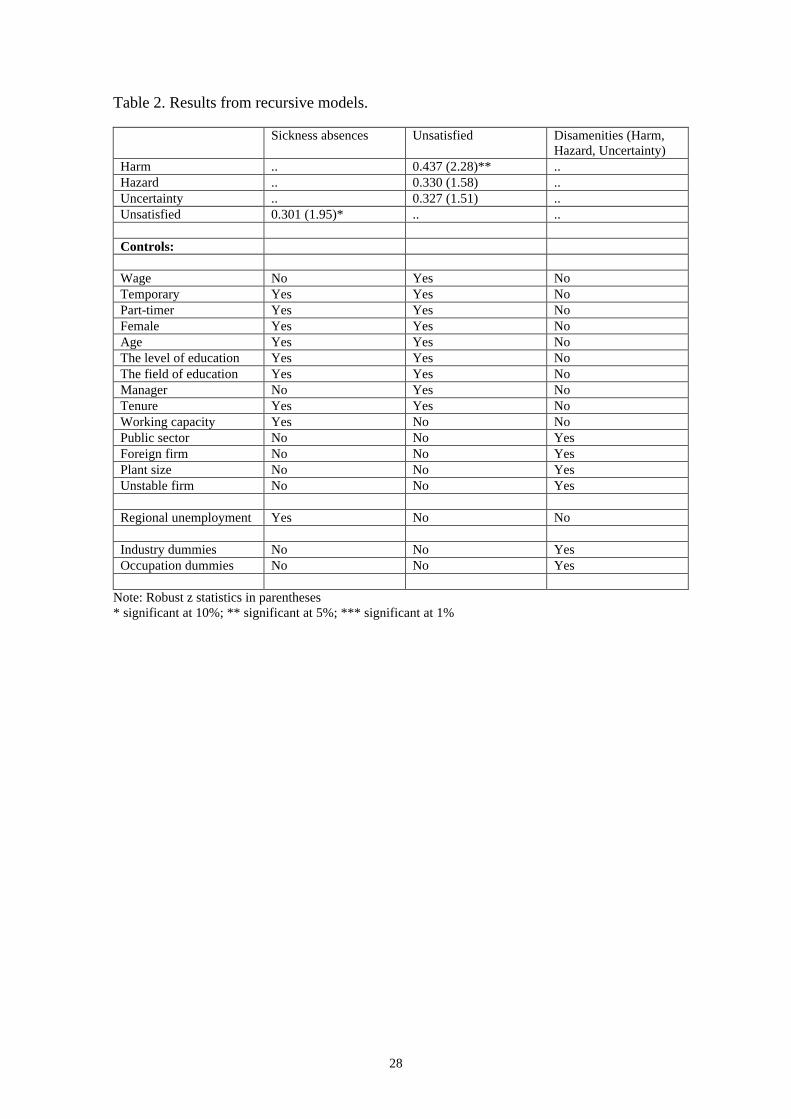
The results are summarised in Table 2. We estimate the recursive model by including
equations for all three job disamenity variables at the same time. Hence, the recursive
model contains five equations (i.e. K=3 in the equations above). The first column of the
table reports the coefficient of Unsatisfied from the equation for sickness absences and
the second column reports the coefficients of job disamenities from the equation for job
dissatisfaction. We report only the main coefficients of interest. (The coefficients of
other explanatory variables included are not reported in the table in order to save space.)
15
Note that the figures in the table are the estimated coefficients, not the marginal effects,
which would vary between different combinations of outcomes. For the binary
dependent variables, the recursive models reveal that the prevalence of harms at the
workplace is associated with workers’ level of job dissatisfaction (Table 2, Column 2)
and dissatisfaction, in turn, is associated with having sickness absences (Table 3,
Column 1).17 There are statistically significant correlations between the error terms of
the equations. The correlations arise from the prevalence of unobserved individual
characteristics such as attitudinal factors that are not included among the explanatory
variables. Hence, the investigation of interaction between job disamenities, job
satisfaction and sickness absences requires the use of recursive models that are able to
take into account these correlations.18
Table 2 around here
CONCLUSIONS
We have explored the potential role of adverse working conditions at the workplace in
the determination of workers’ sickness absences. Our paper differs from the earlier ones
in this field of research, because we have a data set, the Finnish Quality of Work Life
Survey, that makes it possible to model the relationships between working conditions,
satisfaction, and sickness absences. The QWLS data contain a wide range of risk
factors. In addition, it constitutes a representative sample of workers. Based on our
results, this is important, because some of the earlier findings (e.g. that permanent
workers are more often on sickness absences) do not prevail when one is using a
representative sample instead of focusing on some very specific sectors of the labour
market.
The results from reduced-form models in which sickness absences are explained
directly by means of job disamenities reveal that workers facing adverse working
conditions tend to have a higher number of sickness absences. In particular, the non-
monotonic effect of wage on sickness absences means that it is more difficult for firms
to decrease absences by increasing the workers’ wage level than by reducing the
prevalence of job disamenities. In addition, reduced-form models clearly show that
regional labour market conditions are an important determinant of sickness absences.
16
Hence, sickness absences are more common in regions of low unemployment. The
regional variation in sickness absences most likely reflects the discipline effect of
unemployment.
Accordingly, our results suggest that the decline in aggregate unemployment in the late
1990s may explain part of the increase in the prevalence of sickness absences in Finland
after the great depression of the early 1990s. In addition, the overall worsening of
working conditions could explain some proportion of the increase in sickness absences.
Siltala (2004), among others, has claimed that there has been an incessant deterioration
of working conditions in Finland. However, the empirical evidence on the overall
worsening of working conditions during the 1990s is, for the most part, mixed (e.g.
Lehto and Sutela, 2004). Hence, some aspects of working conditions have worsened,
while others have improved. For this reason, it is difficult to say what part the changes
in working conditions may have played in the increase of sickness absences over time.
Our most important finding that stems from the recursive models is that the prevalence
of harms at the workplace is related with the workers’ level of job dissatisfaction and
dissatisfaction with having sickness absences. Taken together, the results from a
representative sample of workers clearly demonstrate that the improvement of working
conditions must be an integral part of any policy scheme that is aimed at decreasing the
number of sickness absences in the coming era of labour shortage caused by the rapid
ageing of the population.
17
REFERENCES
Ala-Mursula L, Vahtera J, Kivimäki M, Kevin V, Pentti J. 2002. Employee control over
working times: Associations with subjective health and sickness absences. Journal of
Epidemiology and Community Health 56: 272-278.
Allen S.G. 1981. Compensation, safety, and absenteeism: Evidence from the paper
industry. Industrial and Labor Relations Review 34, 207-218.
Arai M, Thoursie P.K. 2004. Sickness absences: Worker and establishment effects.
Swedish Economic Policy Review 11, 9-28.
Arai M, Thoursie P.S. 2005. Incentives and selection in cyclical absenteeism. Labour
Economics 12, 269-280.
Arola H, Pitkänen M, Nygård C-H, Huhtala H, Manka M-L. 2003. The connection
between age, job control and sickness absences among Finnish food workers.
Occupational Medicine 53, 229-230.
Askildsen J.E., Bratberg E, Nilsen Ø.A. 2005. Unemployment, labour force
composition and sickness absence: A panel data study. Health Economics 14, 1099-
1050.
Barmby T, Ercolani M.G., Treble J.G. 2002. Sickness absence: An international
comparison. Economic Journal 112, F315-F331.
Bonato L, Lusinyan L. 2004. Work absence in Europe. IMF Working Paper No. 04/193.
Boone J, Van Ours J.C. 2006. Are recessions good for workplace safety? Journal of
Health Economics, Forthcoming.
Brown S, Sessions J.G. 1996. The economics of absence: Theory and evidence. Journal
of Economic Surveys 10, 23-53.
18
Broström G, Johansson P, Palme M. 2004. Economic incentives and gender differences
in work absence behaviour. Swedish Economic Policy Review 11, 33-63.
Böckerman P, Ilmakunnas P. 2006. Do job disamenities raise wages or ruin job
satisfaction? International Journal of Manpower 27, 290-302.
Cameron A.C., Trivedi P.K. 1998. Regression Analysis of Count Data. Cambridge
University Press: Cambridge.
Cappelari L, Jenkins S.P. 2003. Multivariate Probit regression using simulated
maximum likelihood. Stata Journal 3, 278-294.
Clegg C.W. 1983. Psychology of employee lateness, absence and turnover: A
methodological critique and an empirical study. Journal of Applied Psychology 68, 88-
101.
Daniel C, Sofer C. 1998. Bargaining, compensating wage differentials, and dualism of
the labor market: Theory and evidence for France. Journal of Labor Economics 16, 546-
575.
Gimeno D, Benavides F.G, Benach J, Amick III B.C. 2004. Distribution of sickness
absence in the European Union countries. Occupational and Environmental Medicine
61, 867-869.
Greene W.H. 2003. Econometric Analysis. 5th ed. Prentice Hall: Upper Saddle River,
NJ.
Heywood J.S., Jirjahn U. 2004. Teams, teamwork and absence. Scandinavian Journal of
Economics 106, 765-782.
Holmlund B. 2004. Sickness absence: An introduction. Swedish Economic Policy
Review 11, 3-8.
19
Holmlund B. 2006. The rise and fall of Swedish unemployment, In Structural
Unemployment in Western Europe, Werding M (ed.). The MIT Press: Cambridge MA.
Ichino A, Moretti E. 2006. Biological gender differences, absenteeism and the earnings
gap. IZA Discussion Paper No. 2207.
Kangas O. 2004. Institutional development of sickness cash-benefit programmes in 18
OECD countries. Social Policy and Administration 38, 190-203.
Kivimäki M, Vahtera J, Pentti J, Ferrie J.E. 2000. Factors underlying the effect of
organisational downsizing on health of employees: Longitudinal cohort study. British
Medical Journal 320, 971-975.
Lehto A-M, Sutela H. 1999. Efficient, More Efficient, Exhausted. Findings of Finnish
Quality of Work Life Surveys 1977-1997. Statistics Finland, SVT: Labour Market
1999:8.
Lehto A-M, Sutela H. 2004. Uhkia ja mahdollisuuksia. Työolotutkimusten tuloksia
1977-2003. (In Finnish). Edita Prima: Helsinki.
Monfardini C, Radice R. 2006. Testing exogeneity in the bivariate Probit model: A
Monte Carlo study. Department of Economics, University of Bologna, Unpublished.
Moulton B.R. 1990. An illustration of a pitfall in estimating the effects of aggregate
variables on micro units. Review of Economics and Statistics 72, 334-338.
Nyman K, Palmer E, Bergendorff S. 2002. Den svenska sjukan - sjukfrånvaron i åtta
länder. ESO Report Ds 2002:49, Stockholm: Ministry of Finance.
Shields M.A., Price S.W. 2002. Racial harassment, job satisfaction and intentions to
quit: Evidence from the British nursing profession. Economica 69, 295-326.
Siltala J 2004. Työelämän huonontumisen lyhyt historia. (In Finnish). WSOY: Helsinki.
20
The Confederation of Finnish Industries 2006. Työaikakatsaus. Työajat ja poissaolot
EK:n jäsenyrityksissä vuonna 2005. (In Finnish).
Vahtera J, Kivimäki M, Koskenvuo M, Pentti J. 1997. Hostility and registered sickness
absences: A prospective study of municipal employees. Psychological Medicine 27,
693-701.
Vahtera J, Kivimäki M, Pentti J, Theorell T. 2000. Effect of change in the psychosocial
work environment on sickness absence: A seven year follow up of initially healthy
employees. Journal of Epidemiology and Community Health 54, 484-493.
Vahtera J, Kivimäki M, Pentti J, Linna A, Virtanen M, Virtanen P, Ferrie, J.E. 2004.
Organisational downsizing, sickness absence, and mortality: 10-town prospective cohort
study. British Medical Journal 328, 555-560.
Vahtera J, Kivimäki M, Pentti J. 2001. The role of extended weekends in sickness
absenteeism. Occupational and Environmental Medicine 58, 818-822.
Virtanen M, Kivimäki M, Elovainio M, Vahtera J, Cooper C.A. 2001. Contingent
employment, health and sickness absence. Scandinavian Journal of Work, Environment
and Health 27, 365-372.
Virtanen M, Kivimäki M, Elovainio M, Virtanen P, Vahtera J. 2005. Local economy
and sickness absence: Prospective cohort study. Journal of Epidemiology and
Community Health 59, 973-978.
Väänänen A. 2005. Psychosocial determinants of sickness absence: A longitudinal
study of Finnish men and women. Finnish Institute of Occupational Health, Research
Report No. 67.
Väänänen A, Toppinen-Tanner S, Kalimo R, Mutanen P, Vahtera J, Peiró, J.M. 2003.
Job characteristics, physical and psychological symptoms, and social support as
antecedents of sickness absence among men and women in the private industrial sector.
Social Science and Medicine 57, 807-824.

21
Väänänen A, Kalimo R, Toppinen-Tanner S, Mutanen P, Peiró J.M., Kivimäki M,
Vahtera J. 2004. Role clarity, fairness, and organizational climate as predictors of
sickness absence. A prospective study in the private sector. Scandinavian Journal of
Public Health 32, 426-434.
Wilde J. 2000. Identification of multiple equation Probit models with endogenous
dummy regressors. Economics Letters 69, 309-312.
Ylitalo M. 2006. Palkansaajien sairauspoissalot (in Finnish). In Kaikilla mausteilla.
Artikkeleita työolotutkimuksesta, Lehto, A-M, Sutela H, Miettinen A. (eds.). Statistics
Finland, Research Report No. 244.
22
Appendix:
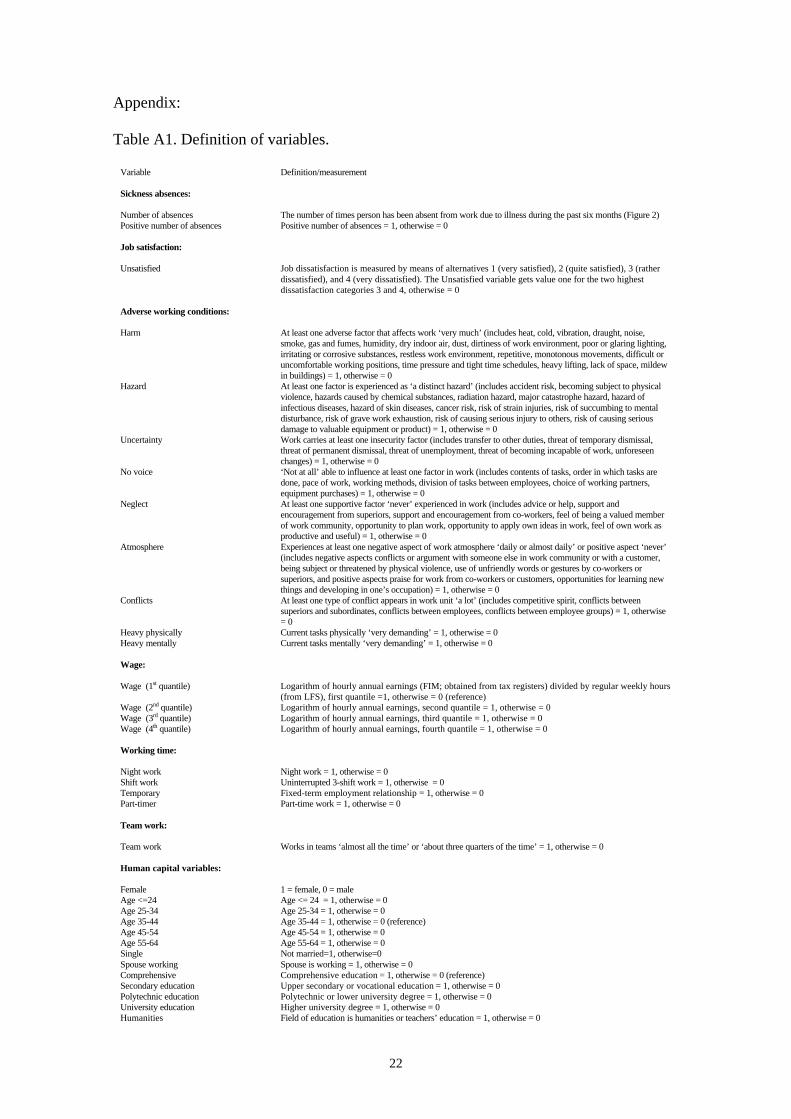
Table A1. Definition of variables.
Variable Definition/measurement Sickness absences: Number of absences The number of times person has been absent from work due to illness during the past six months (Figure 2) Positive number of absences Positive number of absences = 1, otherwise = 0 Job satisfaction: Unsatisfied Job dissatisfaction is measured by means of alternatives 1 (very satisfied), 2 (quite satisfied), 3 (rather
dissatisfied), and 4 (very dissatisfied). The Unsatisfied variable gets value one for the two highest dissatisfaction categories 3 and 4, otherwise = 0
Adverse working conditions: Harm At least one adverse factor that affects work ‘very much’ (includes heat, cold, vibration, draught, noise,
smoke, gas and fumes, humidity, dry indoor air, dust, dirtiness of work environment, poor or glaring lighting, irritating or corrosive substances, restless work environment, repetitive, monotonous movements, difficult or uncomfortable working positions, time pressure and tight time schedules, heavy lifting, lack of space, mildew in buildings) = 1, otherwise = 0
Hazard At least one factor is experienced as ‘a distinct hazard’ (includes accident risk, becoming subject to physical violence, hazards caused by chemical substances, radiation hazard, major catastrophe hazard, hazard of infectious diseases, hazard of skin diseases, cancer risk, risk of strain injuries, risk of succumbing to mental disturbance, risk of grave work exhaustion, risk of causing serious injury to others, risk of causing serious damage to valuable equipment or product) = 1, otherwise = 0
Uncertainty Work carries at least one insecurity factor (includes transfer to other duties, threat of temporary dismissal, threat of permanent dismissal, threat of unemployment, threat of becoming incapable of work, unforeseen changes) = 1, otherwise = 0
No voice ‘Not at all’ able to influence at least one factor in work (includes contents of tasks, order in which tasks are done, pace of work, working methods, division of tasks between employees, choice of working partners, equipment purchases) = 1, otherwise = 0
Neglect At least one supportive factor ‘never’ experienced in work (includes advice or help, support and encouragement from superiors, support and encouragement from co-workers, feel of being a valued member of work community, opportunity to plan work, opportunity to apply own ideas in work, feel of own work as productive and useful) = 1, otherwise = 0
Atmosphere Experiences at least one negative aspect of work atmosphere ‘daily or almost daily’ or positive aspect ‘never’ (includes negative aspects conflicts or argument with someone else in work community or with a customer, being subject or threatened by physical violence, use of unfriendly words or gestures by co-workers or superiors, and positive aspects praise for work from co-workers or customers, opportunities for learning new things and developing in one’s occupation) = 1, otherwise = 0
Conflicts At least one type of conflict appears in work unit ‘a lot’ (includes competitive spirit, conflicts between superiors and subordinates, conflicts between employees, conflicts between employee groups) = 1, otherwise = 0
Heavy physically Current tasks physically ‘very demanding’ = 1, otherwise = 0 Heavy mentally Current tasks mentally ‘very demanding’ = 1, otherwise = 0 Wage: Wage (1st quantile) Logarithm of hourly annual earnings (FIM; obtained from tax registers) divided by regular weekly hours
(from LFS), first quantile =1, otherwise = 0 (reference) Wage (2nd quantile) Logarithm of hourly annual earnings, second quantile = 1, otherwise = 0 Wage (3rd quantile) Logarithm of hourly annual earnings, third quantile = 1, otherwise = 0 Wage (4th quantile) Logarithm of hourly annual earnings, fourth quantile = 1, otherwise = 0 Working time: Night work Night work = 1, otherwise = 0 Shift work Uninterrupted 3-shift work = 1, otherwise = 0 Temporary Fixed-term employment relationship = 1, otherwise = 0 Part-timer Part-time work = 1, otherwise = 0 Team work: Team work Works in teams ‘almost all the time’ or ‘about three quarters of the time’ = 1, otherwise = 0 Human capital variables: Female 1 = female, 0 = male Age <=24 Age <= 24 = 1, otherwise = 0 Age 25-34 Age 25-34 = 1, otherwise = 0 Age 35-44 Age 35-44 = 1, otherwise = 0 (reference) Age 45-54 Age 45-54 = 1, otherwise = 0 Age 55-64 Age 55-64 = 1, otherwise = 0 Single Not married=1, otherwise=0 Spouse working Spouse is working = 1, otherwise = 0 Comprehensive Comprehensive education = 1, otherwise = 0 (reference) Secondary education Upper secondary or vocational education = 1, otherwise = 0 Polytechnic education Polytechnic or lower university degree = 1, otherwise = 0 University education Higher university degree = 1, otherwise = 0 Humanities Field of education is humanities or teachers’ education = 1, otherwise = 0
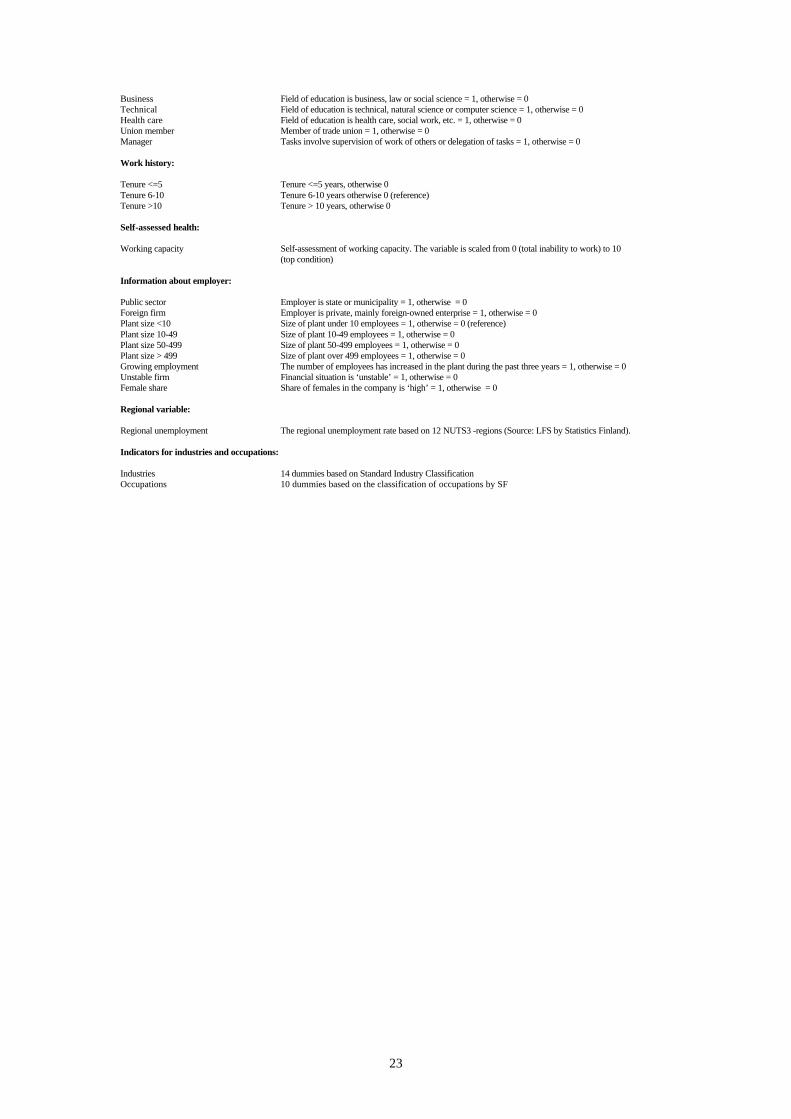
23
Business Field of education is business, law or social science = 1, otherwise = 0 Technical Field of education is technical, natural science or computer science = 1, otherwise = 0 Health care Field of education is health care, social work, etc. = 1, otherwise = 0 Union member Member of trade union = 1, otherwise = 0 Manager Tasks involve supervision of work of others or delegation of tasks = 1, otherwise = 0 Work history: Tenure <=5 Tenure <=5 years, otherwise 0 Tenure 6-10 Tenure 6-10 years otherwise 0 (reference) Tenure >10 Tenure > 10 years, otherwise 0 Self-assessed health: Working capacity Self-assessment of working capacity. The variable is scaled from 0 (total inability to work) to 10
(top condition) Information about employer: Public sector Employer is state or municipality = 1, otherwise = 0 Foreign firm Employer is private, mainly foreign-owned enterprise = 1, otherwise = 0 Plant size <10 Size of plant under 10 employees = 1, otherwise = 0 (reference) Plant size 10-49 Size of plant 10-49 employees = 1, otherwise = 0 Plant size 50-499 Size of plant 50-499 employees = 1, otherwise = 0 Plant size > 499 Size of plant over 499 employees = 1, otherwise = 0 Growing employment The number of employees has increased in the plant during the past three years = 1, otherwise = 0 Unstable firm Financial situation is ‘unstable’ = 1, otherwise = 0 Female share Share of females in the company is ‘high’ = 1, otherwise = 0 Regional variable: Regional unemployment The regional unemployment rate based on 12 NUTS3 -regions (Source: LFS by Statistics Finland). Indicators for industries and occupations: Industries 14 dummies based on Standard Industry Classification Occupations 10 dummies based on the classification of occupations by SF
24
Table A2. Descriptive statistics. Mean Sd. Min Max Number of absences 0.65 1.17 0 17 Positive number of absences 0.39 0.49 0 1 Unsatisfied 0.06 0.24 0 1 Harm 0.29 0.45 0 1 Hazard 0.34 0.47 0 1 Uncertainty 0.58 0.49 0 1 No voice 0.68 0.47 0 1 Neglect 0.23 0.42 0 1 Atmosphere 0.11 0.31 0 1 Conflicts 0.06 0.24 0 1 Heavy physically 0.05 0.22 0 1 Heavy mentally 0.06 0.25 0 1 Wage (1st quantile) 0.25 0.43 0 1 Wage (2nd quantile) 0.25 0.43 0 1 Wage (3rd quantile) 0.25 0.43 0 1 Wage (4th quantile) 0.25 0.43 0 1 Night work 0.01 0.10 0 1 Shift work 0.04 0.20 0 1 Temporary 0.18 0.38 0 1 Part-timer 0.10 0.30 0 1 Team work 0.32 0.46 0 1 Female 0.53 0.50 0 1 Age <=24 0.08 0.28 0 1 Age 25-34 0.25 0.43 0 1 Age 35-44 0.30 0.46 0 1 Age 45-54 0.29 0.45 0 1 Age 55-64 0.08 0.26 0 1 Single 0.18 0.38 0 1 Spouse working 0.56 0.50 0 1 Comprehensive 0.24 0.43 0 1 Secondary education 0.56 0.50 0 1 Polytechnic education 0.12 0.32 0 1 University education 0.09 0.28 0 1 Humanities 0.06 0.24 0 1 Business 0.16 0.37 0 1 Technical 0.27 0.44 0 1 Health care 0.10 0.30 0 1 Union member 0.79 0.41 0 1 Manager 0.32 0.47 0 1 Tenure <=5 0.43 0.50 0 1 Tenure 6-10 0.17 0.38 0 1 Tenure >10 0.36 0.48 0 1 Working capacity 8.62 1.37 0 10 Public sector 0.34 0.47 0 1 Foreign firm 0.07 0.26 0 1 Plant size <10 0.28 0.45 0 1 Plant size 10-49 0.36 0.48 0 1 Plant size 50-499 0.28 0.45 0 1 Plant size > 499 0.08 0.27 0 1 Growing employment 0.11 0.31 0 1 Unstable firm 0.16 0.37 0 1 Female share 0.41 0.49 0 1 Regional unemployment 17.07 4.74 11.8 29.3

25
Figure 1. Sickness absences reported as a share of the standard annual working time in the Nordic countries.
0
2
4
6
8
10
12
1419
81
1983
1985
1987
1989
1991
1993
1995
1997
1999
2001
2003
Sweden
Finland
Denmark
Norway
Iceland
Note: The figures refer to manual manufacturing workers in Finland and to employees of employers associations’ member companies in the other Nordic countries. Information is not available for Iceland from the year 2000. (Source: The Confederation of Finnish Industries, 2006).
Figure 2. Distribution of the number of sickness absences during the past six months.
0
10
20
30
40
50
60
70
0 1 2 3 4 5 6 orover
Number of absences
Sh
are,
%
26
Table 1. Results from reduced-form models for sickness absences.
Poisson regression, (Number of absences)
Negative binomial, (Number of absences)
Probit, (Positive number of absences)
Adverse working conditions: Harm 0.151 0.145 0.023 (2.04)** (2.04)** (1.00) Hazard 0.267 0.275 0.068 (3.45)*** (3.79)*** (3.07)*** Uncertainty 0.166 0.174 0.081 (2.32)** (2.47)** (3.94)*** No voice 0.101 0.097 0.016 (1.31) (1.28) (0.71) Neglect 0.057 0.029 -0.004 (0.73) (0.38) (0.16) Atmosphere 0.092 0.040 -0.023 (0.85) (0.39) (0.72) Conflicts 0.228 0.225 0.057 (2.07)** (2.05)** (1.41) Heavy physically 0.053 0.044 0.071 (0.45) (0.39) (1.48) Heavy mental 0.022 0.028 0.028 (0.18) (0.23) (0.69) Controls: Wage (2nd quantile) 0.141 0.143 0.088 (1.17) (1.31) (2.84)*** Wage (3rd quantile) 0.122 0.127 0.108 (0.93) (1.08) (3.32)*** Wage (4th quantile) -0.109 -0.120 0.028 (0.70) (0.88) (0.79) Night work 0.209 0.227 0.172 (1.03) (1.12) (1.76)* Shift work -0.030 -0.040 0.042 (0.24) (0.32) (0.84) Temporary -0.105 -0.097 -0.004 (1.05) (1.00) (0.11) Part-timer -0.129 -0.131 -0.064 (0.98) (1.01) (1.92)* Team work 0.041 0.043 -0.018 (0.54) (0.60) (0.83) Female 0.057 0.091 0.068 (0.59) (0.98) (2.47)** Age <=24 0.403 0.419 0.146 (3.05)*** (3.24)*** (3.27)*** Age 25-34 0.209 0.222 0.059 (2.46)** (2.69)*** (2.14)** Age 45-54 -0.202 -0.197 -0.093 (2.23)** (2.22)** (3.68)*** Age 55-64 -0.303 -0.299 -0.098 (2.23)** (2.27)** (2.47)** Single -0.225 -0.204 -0.068 (2.23)** (2.10)** (2.23)** Spouse working -0.125 -0.098 -0.022
27
(1.54) (1.29) (0.95) Secondary education -0.143 -0.140 -0.015 (1.35) (1.37) (0.46) Polytechnic education -0.258 -0.276 -0.061 (1.74)* (1.90)* (1.34) University education 0.045 0.003 -0.021 (0.21) (0.02) (0.39) Humanities 0.160 0.144 0.012 (0.85) (0.81) (0.22) Business 0.117 0.124 -0.014 (1.01) (1.09) (0.41) Technical 0.142 0.159 0.031 (1.39) (1.55) (0.92) Health care 0.276 0.296 0.119 (2.17)** (2.32)** (2.57)** Union member -0.154 -0.159 -0.058 (1.75)* (1.88)* (2.17)** Manager -0.144 -0.135 -0.032 (1.90)* (1.83)* (1.38) Tenure <=5 0.162 0.158 0.038 (1.69)* (1.70)* (1.34) Tenure >10 0.271 0.251 0.052 (2.64)*** (2.63)*** (1.84)* Working capacity -0.154 -0.163 -0.063 (8.92)*** (8.46)*** (8.57)*** Public sector -0.052 -0.048 -0.030 (0.43) (0.43) (0.84) Foreign firm -0.065 -0.085 0.009 (0.54) (0.75) (0.23) Plant size 10-49 0.002 0.002 0.018 (0.02) (0.03) (0.73) Plant size 50-499 0.220 0.214 0.065 (2.15)** (2.26)** (2.25)** Plant size >499 0.126 0.129 0.044 (0.94) (0.96) (1.03) Growing employment 0.045 0.054 -0.013 (0.41) (0.50) (0.41) Unstable firm -0.016 -0.020 0.005 (0.19) (0.24) (0.17) Female share 0.011 -0.021 -0.011 (0.13) (0.24) (0.40) Regional unemployment -0.032 -0.034 -0.009 (4.03)*** (4.12)*** (3.64)*** Industry dummies Yes Yes Yes Number of observations 2815 2815 2815
Note: Robust z statistics in parentheses (clustering by region) * significant at 10%; ** significant at 5%; *** significant at 1%
28
Table 2. Results from recursive models.
Sickness absences Unsatisfied Disamenities (Harm, Hazard, Uncertainty)
Harm .. 0.437 (2.28)** .. Hazard .. 0.330 (1.58) .. Uncertainty .. 0.327 (1.51) .. Unsatisfied 0.301 (1.95)* .. .. Controls: Wage No Yes No Temporary Yes Yes No Part-timer Yes Yes No Female Yes Yes No Age Yes Yes No The level of education Yes Yes No The field of education Yes Yes No Manager No Yes No Tenure Yes Yes No Working capacity Yes No No Public sector No No Yes Foreign firm No No Yes Plant size No No Yes Unstable firm No No Yes Regional unemployment Yes No No Industry dummies No No Yes Occupation dummies No No Yes
Note: Robust z statistics in parentheses * significant at 10%; ** significant at 5%; *** significant at 1%
29
1 Barmby et al. (2002) report a similar pattern by using labour force surveys. 2 These figures refer to the proportion of the workforce that has been absent at least one day in the past 12 months by an accident at work, by health problems caused by the work, or by other health problems (Gimeno et al., 2004). 3 The unemployment rate in Finland rose in a few years from 3 to 17 at the beginning of the 1990s. 4 Those that deal with Finland include e.g. Vahtera et al. (1997); Kivimäki et al. (2000); Vahtera et al. (2000); Vahtera et al. (2001); Virtanen et al. (2001); Ala-Mursula et al. (2002); Arola et al. (2003); Väänänen et al. (2003); Vahtera et al. (2004); Väänänen et al. (2004); Virtanen et al. (2005); Väänänen (2005). 5 See, for example, Cameron and Trivedi (1998) for a description of the Poisson and negative binomial models. 6 Using the restrictions also improves the validity of tests of exogeneity of the potentially endogenous explanatory dummy variables (essentially, tests of whether the correlations of the errors of the probit models are zero) when the distributional assumptions are misspecified (see Monfardini and Radice, 2006). 7 Broadly speaking, the system of sickness benefits in Finland is similar to that in Sweden or in the other Nordic countries. There is a compulsory sickness insurance scheme for all the inhabitants, which is based on residency. It contains earnings-related benefits and means-tested benefits. Kangas (2004) reports that the replacement rate (% of wage) of sickness insurance is around 80% in Finland, which is about the same level as in Sweden. It has been agreed in many collective labour agreements that for sickness absences up to three days employees may complete their own certificates. In fact, the QWLS data from the year 2003 reveal that around 50% of wage and salary earners belong to this particular category (Ylitalo 2006, p. 299). In contrast, medical certificates are always required for sickness absences that last for more than three days. Accordingly, adverse working conditions that do not ruin workers’ physical health in a way that should be verified by physicians may especially increase the number of short sickness absences. 8 The QWLS data from the year 2003 contain information on the duration of sickness absence spells during the past year. Based on those data it is possible to calculate the average number of days that employees have been absent from work because of sickness. This turns out to be 8.4 days. We use the QWLS data from the year 1997, because the data from the year 2003 do not contain an identifier for the geographical location of the employer and we want to include the regional unemployment rate among the explanatory variables owing to the fact that unemployment has been discovered to be an important factor in the determination of sickness absences in the earlier studies from the Nordic countries (e.g. Holmlund, 2004). Having said that, we have done experiments with the QWLS data from the year 2003. Using information on the number of days that workers have been absent from work during the past year, the results confirm that job disamenities tend to raise the number of sickness absences. In addition to the QWLS data, it is possible to analyse the determination of (sickness) absences in Finland for a representative sample of workers through the use of the European Community Household Panel (ECHP) that is available over the period 1996-2001. The fundamental problem with the ECHP data is that they contain information on absences from work because of illness or other reasons during the past four weeks (question PE038). The quantitative magnitude of ’other reasons’ is not recorded. Another problem is that the ECHP data do not contain detailed information on job disamenities. We have also made some experiments with the ECHP data. The results reveal that the level of job (dis)satisfaction does not directly contribute to the number of absences during the past four weeks. In that respect, the result is exactly the same as the one from the QWLS data for the year 1997 in the reduced form models. 9 In the calculation of standard errors we have taken into account the fact that observations are clustered by regions. Otherwise, standard errors on Regional unemployment would be biased downwards, which might lead to the wrong conclusions about the statistical significance of the estimated effects (Moulton, 1990).
30
10 In this respect, it is notable that in Finland nowadays temporary contracts are much more common in the public sector than in the private sector. Hence, according to the QWLS data the share of employees with temporary contracts is 18% in the Finnish economy (Appendix, Table A2), but for the public sector their share is 27%. 11 It is not clear that Working capacity should be included in the model, because it can be regarded as endogenous. For this reason, we have estimated the reduced-form models also without it. The basic results regarding the effects of job disamenities remain the same. A major difference is that, when Working capacity is excluded, experiencing harms turns out to be statistically significant (and positive) in the probit model. 12 Broström et al. (2004) show that the gender difference can be attributed in Sweden to more frequent, rather than longer, sickness absence spells for females. Ichino and Moretti (2006) have recently analysed the gender differences in the number of absences in detail. 13 Our calculations using the QWLS data from the year 2003 support this conclusion. 14 To illustrate the quantitative effect of regional unemployment in the determination of sickness absences, we included an indicator for regions with unemployment over 17% instead of using Regional unemployment as a continuous variable in the probit model. (17% is the unweighted mean level of Regional Unemployment reported in Appendix, Table A2). The results show that it is around 4% less likely that a positive number of sickness absences is reported in the regions with unemployment over 17%. 15 As a robustness check, we estimated the models that are reported in Table 1 by including occupational indicators (not reported). Taken together, the results remain the same. One small difference is that after including the occupational indicators, No Voice is statistically significant (and positive) in the negative binomial model. 16 For instance, the z-value of Unsatisfied is 0.45 when it is included as one of the explanatory variables for the Poisson regression model. 17 The fact that disamenities raise workers’ job dissatisfaction is in line with our earlier results reported in Böckerman and Ilmakunnas (2006). 18 As a robustness check, we estimated the recursive models by including equations for one (and two) of the job disamenity variables at the same time (not reported). In this case, we had to estimate three (four) probit models as a recursive system. The conclusions are robust with respect to these changes in the basic model.


