Interactions between seals and commercial fisheries in the North-East Atlantic Final Report to the Committee on Fisheries of the European Parliament January 2002 J Harwood and M Walton NERC Sea Mammal Research Unit, University of St Andrews St Andrews, Fife KY16 8LS, UK
Transcript
Interactions between seals and commercial fisheries in the North-East Atlantic
Final Report to the Committee on Fisheries
of the European Parliament
January 2002
J Harwood and M Walton
NERC Sea Mammal Research Unit,
University of St Andrews
St Andrews, Fife KY16 8LS, UK
CONTENTS Executive Summary 7
1. Introduction 1.1 General Approach 9
1.2 Seal populations in the North-East Atlantic and Baltic Seas 10
1.3 Target fish stocks 11
1.4 Relevant fisheries 11
2. Seal populations 2.1 Introduction 12
2.1.1 Methods for estimating population size 2.1.2 Methods for estimating mortality and fecundity rates
2.1.3 Methods for estimating diet and prey consumption 2.2 Grey Seal 14
2.2.1 Geographic distribution 2.2.2 Population size 2.2.3 Diet
2.2.4 Prey consumption 2.3 Harbour Seal 17
2.3.1 Geographic distribution 2.3.2 Population size 2.3.3 Diet
2.3.4 Prey consumption
2.4 Baltic Ringed Seal 19
2.4.1 Geographic distribution 2.4.2 Population size 2.4.3 Diet
2.4.4 Prey consumption 2.5 Other seal species 19
2.5.1 Harp Seal 2.5.2 Hooded Seal
3. Fish Information 3.1 Introduction 21
3.1.1 Methods for estimating demographic rates 3.1.2 Methods for estimating stock sizes and status 3.1.3 Methods for estimating diet 3.1.4 Methods for estimating and assigning mortality
3.2 Cod 23
3.2.1 Brief life history 3.2.2 Size 3.2.3 Maturity ogive 3.2.4 Weight at age 3.2.5 Age at first spawning 3.2.6 Age specific natural mortality 3.2.7 ICES Stocks 3.2.8 Stock abundance 3.2.9 Current assessment of stocks 3.2.10 Diet - estimates of consumption 3.2.11 Other predators
1
3.3 Whiting 26
3.3.1 Brief life history 3.3.2 Size 3.3.3 Maturity ogive 3.3.4 Weight at age 3.3.5 Age at first spawning 3.3.6 Age specific natural mortality 3.3.7 ICES Stocks 3.3.8 Stock abundance 3.3.9 Current assessment of stocks 3.3.10 Diet - estimates of consumption 3.3.11 Other predators
3.4 Monkfish / Anglerfish 29
3.4.1 Brief life history 3.4.2 Size 3.4.3 Maturity ogive 3.4.4 Weight at age 3.4.5 Age at first spawning 3.4.6 Age specific natural mortality 3.4.7 ICES Stocks 3.4.8 Stock abundance 3.4.9 Current assessment of stocks 3.4.10 Diet - estimates of consumption 3.4.11 Other predators
3.5 Salmon 31
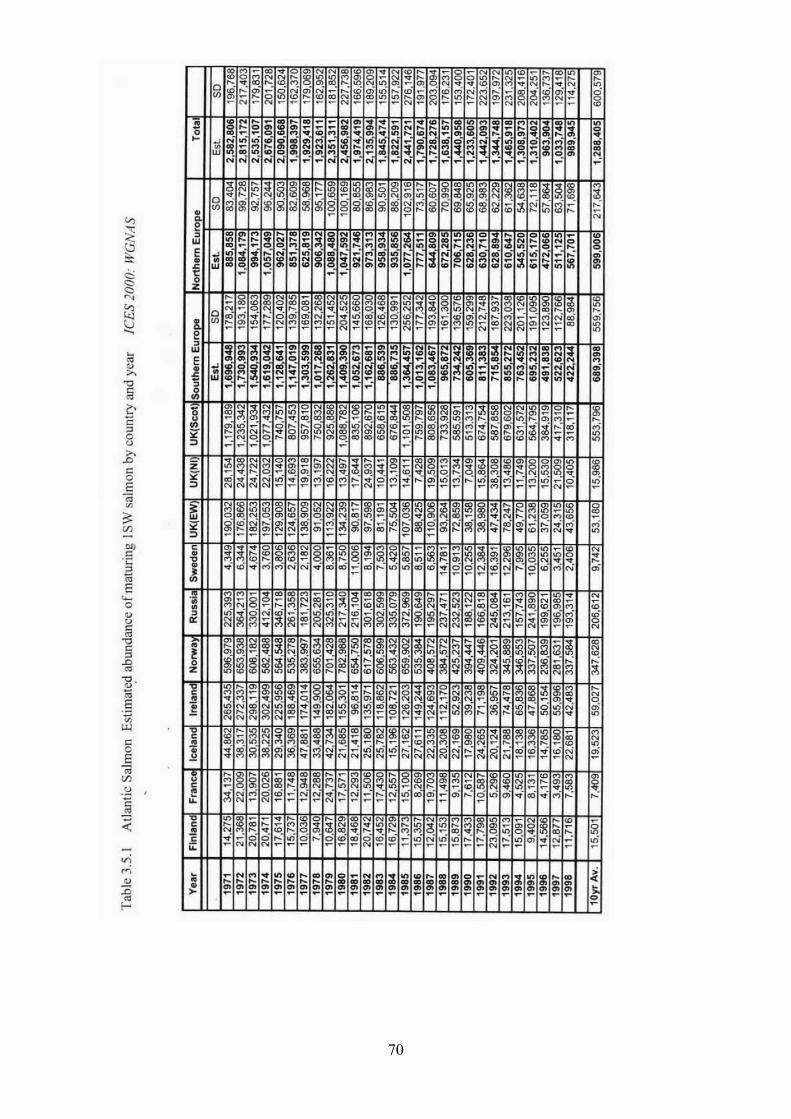
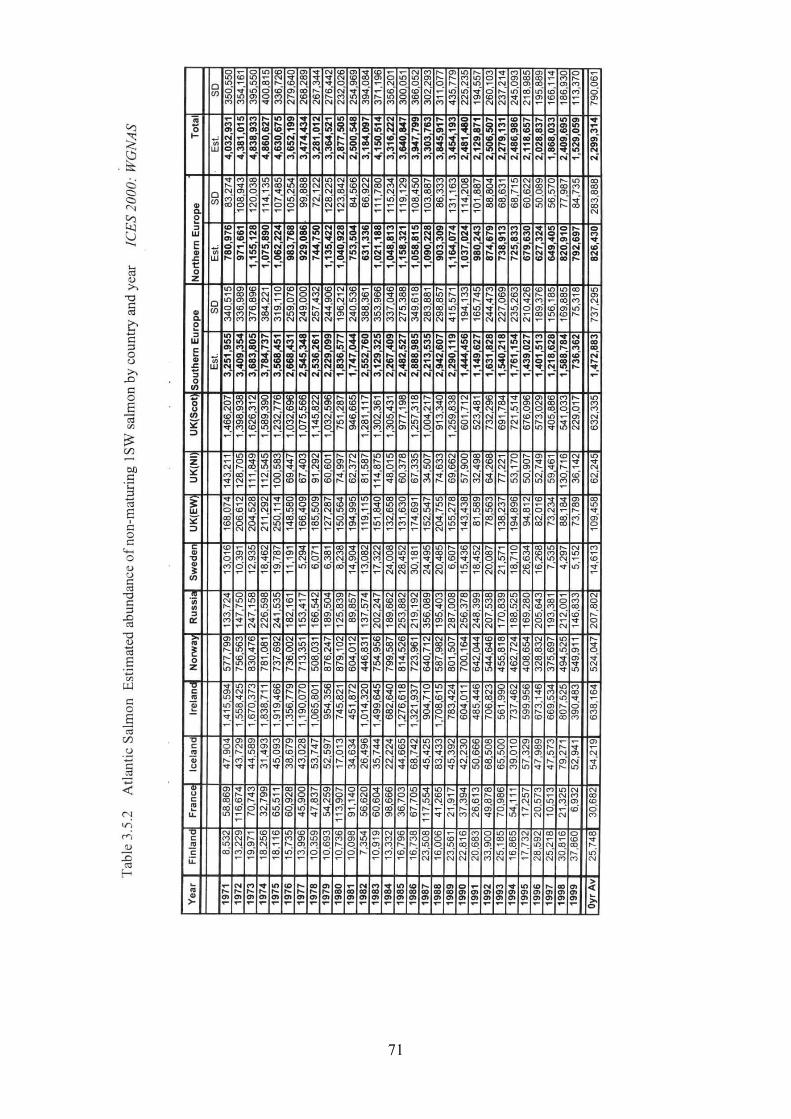
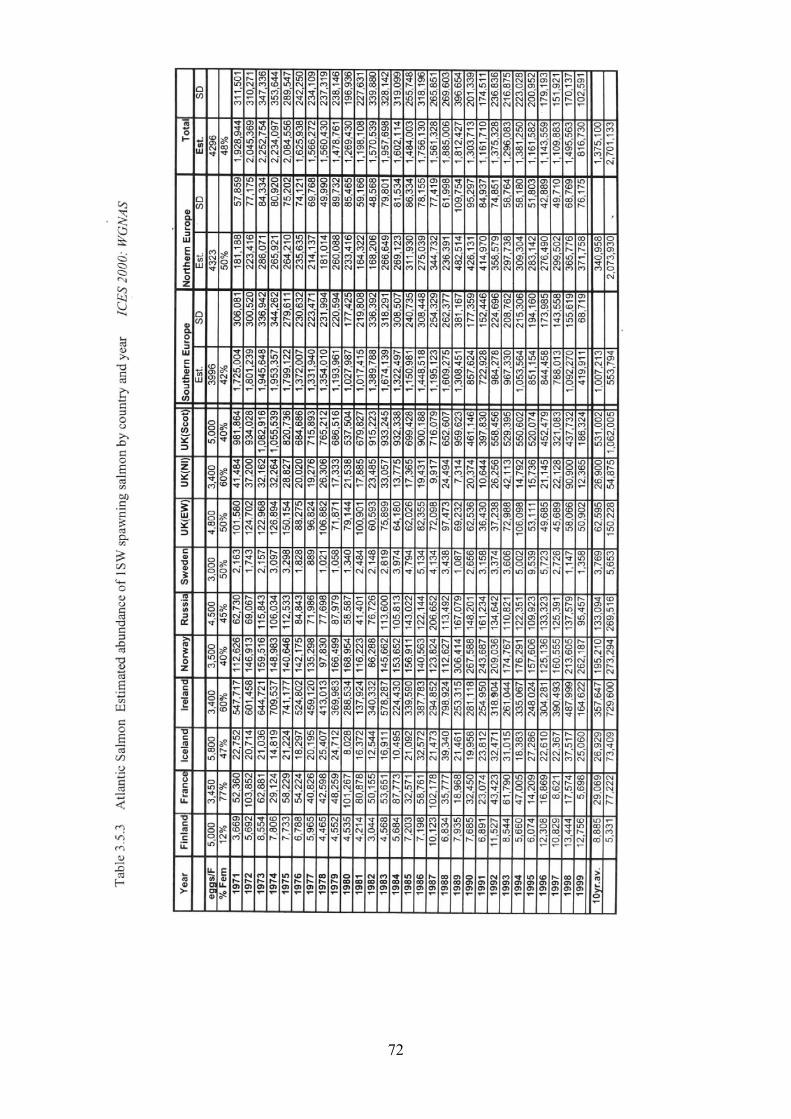
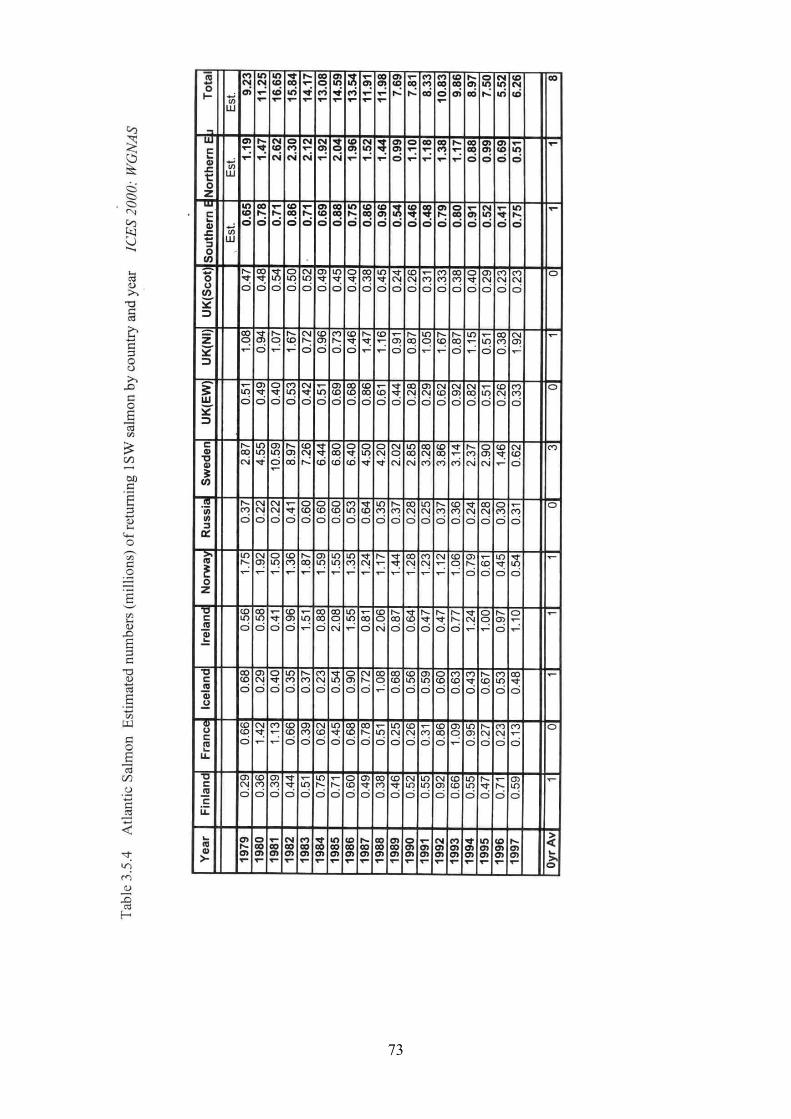
3.5.1 Brief life history 3.5.2 Size 3.5.3 Maturity ogive 3.5.4 Weight at age 3.5.5 Age at first spawning 3.5.6 Age specific natural mortality 3.5.7 ICES Stocks 3.5.8 Stock abundance 3.5.9 Current assessment of stocks
3.5.10 Diet - estimates of consumption 3.5.11 Other predators
3.6 Eel 33
3.6.1 Brief life history 3.6.2 Size 3.6.3 Maturity ogive 3.6.4 Weight at age 3.6.5 Age at first spawning 3.6.6 Age specific natural mortality 3.6.7 ICES Stocks 3.6.8 Stock abundance 3.6.9 Current assessment of stocks
3.6.10 Diet - estimates of consumption 3.6.11 Other predators
3.7 Haddock 35
3.7.1 Brief life history 3.7.2 Size 3.7.3 Maturity ogive 3.7.4 Weight at age 3.7.5 Age at first spawning 3.7.6 Age specific natural mortality
2
3.7.7 ICES Stocks 3.7.8 Stock abundance 3.7.9 Current assessment of stocks 3.7.10 Diet - estimates of consumption 3.7.11 Other predators
3.8 Plaice 37
3.8.1 Brief life history 3.8.2 Size 3.8.3 Maturity ogive 3.8.4 Weight at age 3.8.5 Age at first spawning 3.8.6 Age specific natural mortality
3.8.7 ICES Stocks 3.8.8 Stock abundance 3.8.9 Current assessment of stocks 3.8.10 Diet - estimates of consumption 3.8.11 Other predators
3.9 Herring 39
3.9.1 Brief life history 3.9.2 Size 3.9.3 Maturity ogive 3.9.4 Weight at age 3.9.5 Age at first spawning 3.9.6 Age specific natural mortality 3.9.7 ICES Stocks 3.9.8 Stock abundance 3.9.9 Current assessment of stocks 3.9.10 Diet - estimates of consumption 3.9.11 Other predators
3.10 Sprat 41
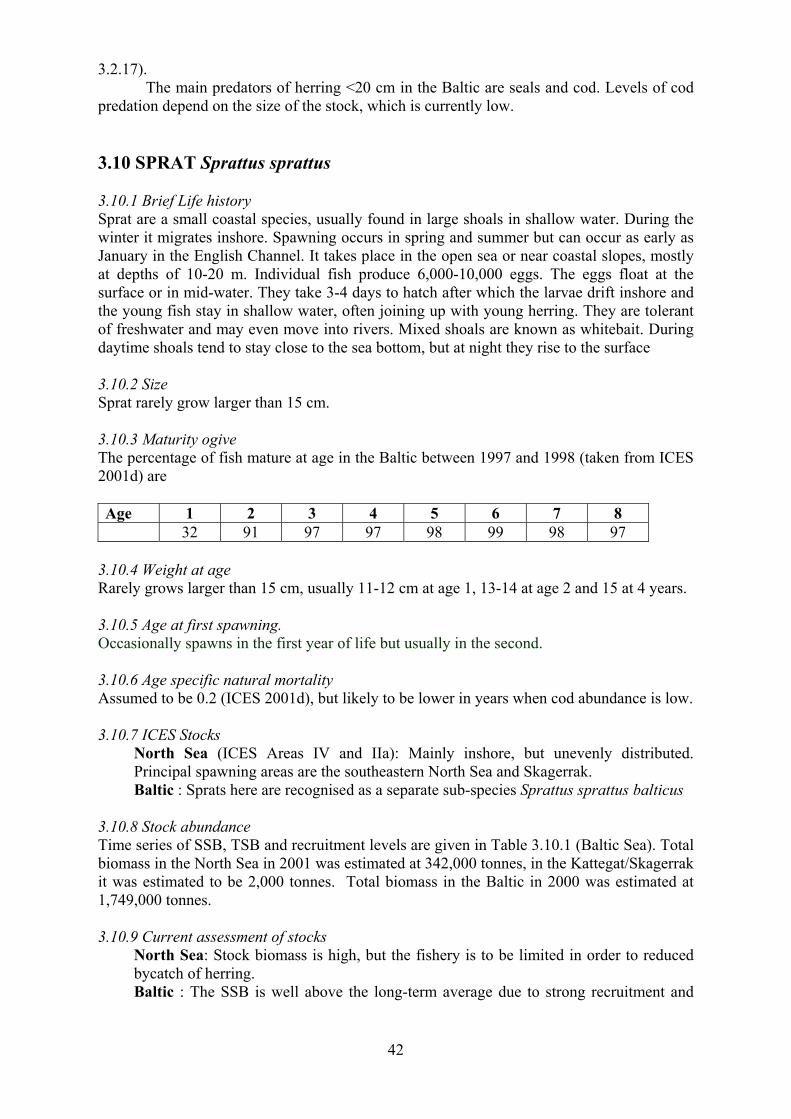
3.10.1 Brief life history 3.10.2 Size 3.10.3 Maturity ogive 3.10.4 Weight at age 3.10.5 Age at first spawning 3.10.6 Age specific natural mortality 3.10.7 ICES Stocks 3.10.8 Stock abundance 3.10.9 Current assessment of stocks 3.10.10 Diet - estimates of consumption 3.10.11 Other predators
3.11 Sandeel 43
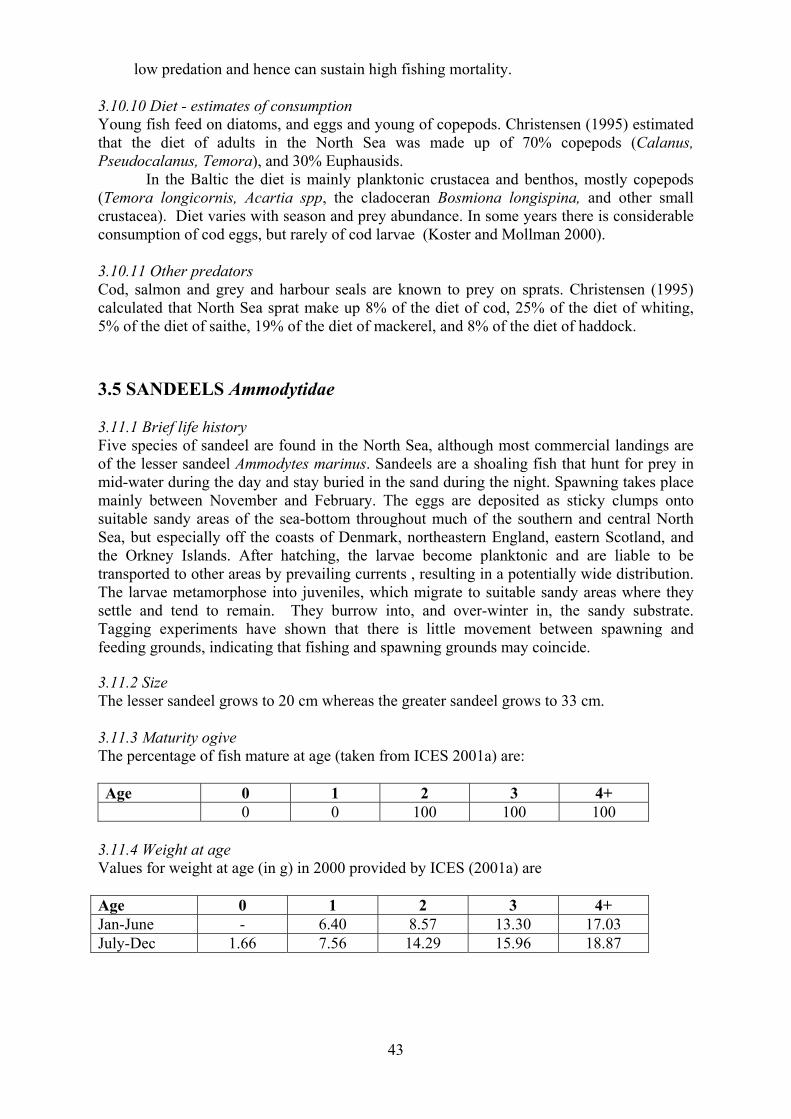
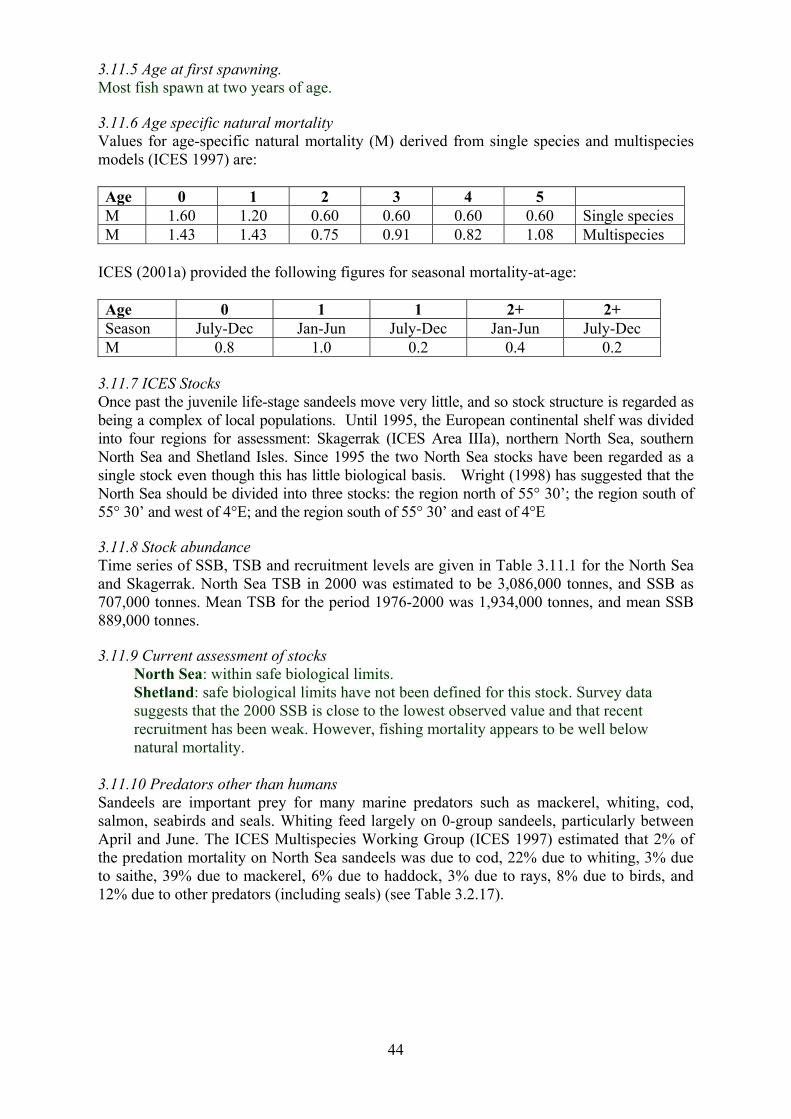
3.11.1 Brief life history 3.11.2 Size 3.11.3 Maturity ogive 3.11.4 Weight at age 3.11.5 Age at first spawning 3.11.6 Age specific natural mortality 3.11.7 ICES Stocks 3.11.8 Stock abundance 3.11.9 Current assessment of stocks 3.11.10 Diet - estimates of consumption 3.11.11 Other predators
Tables 45-84
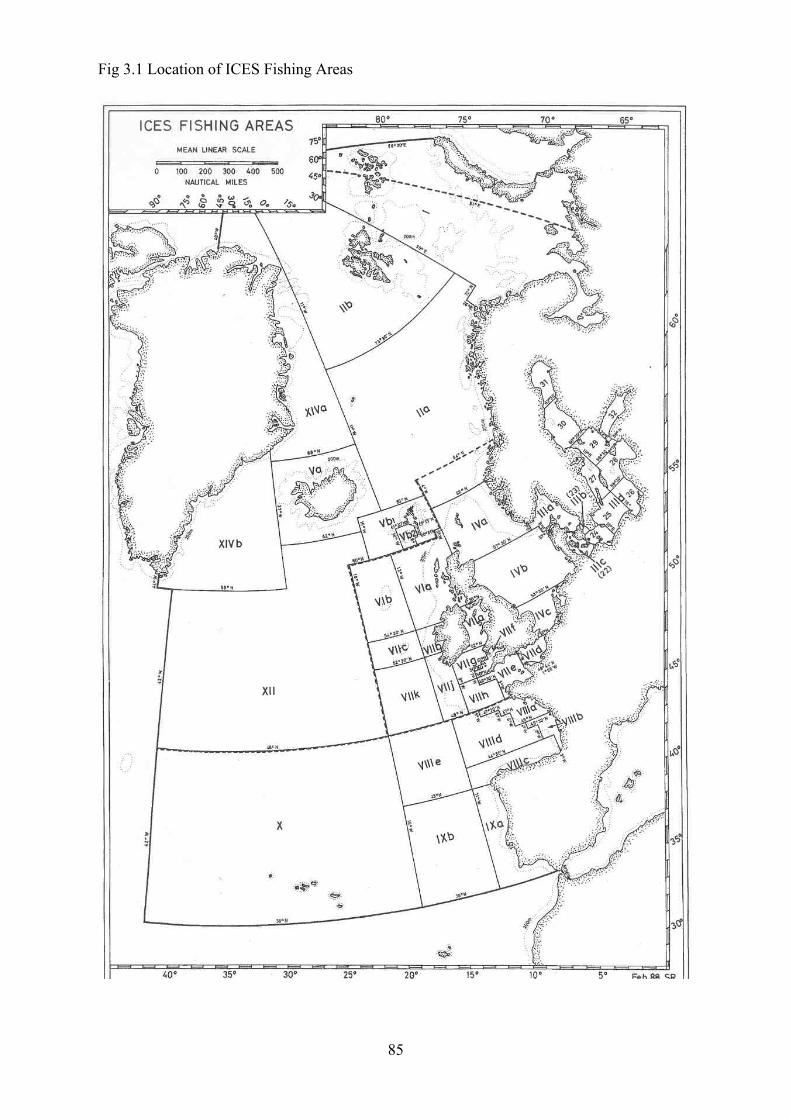
Fig 3.1 Location of ICES Fishing Areas 85
3
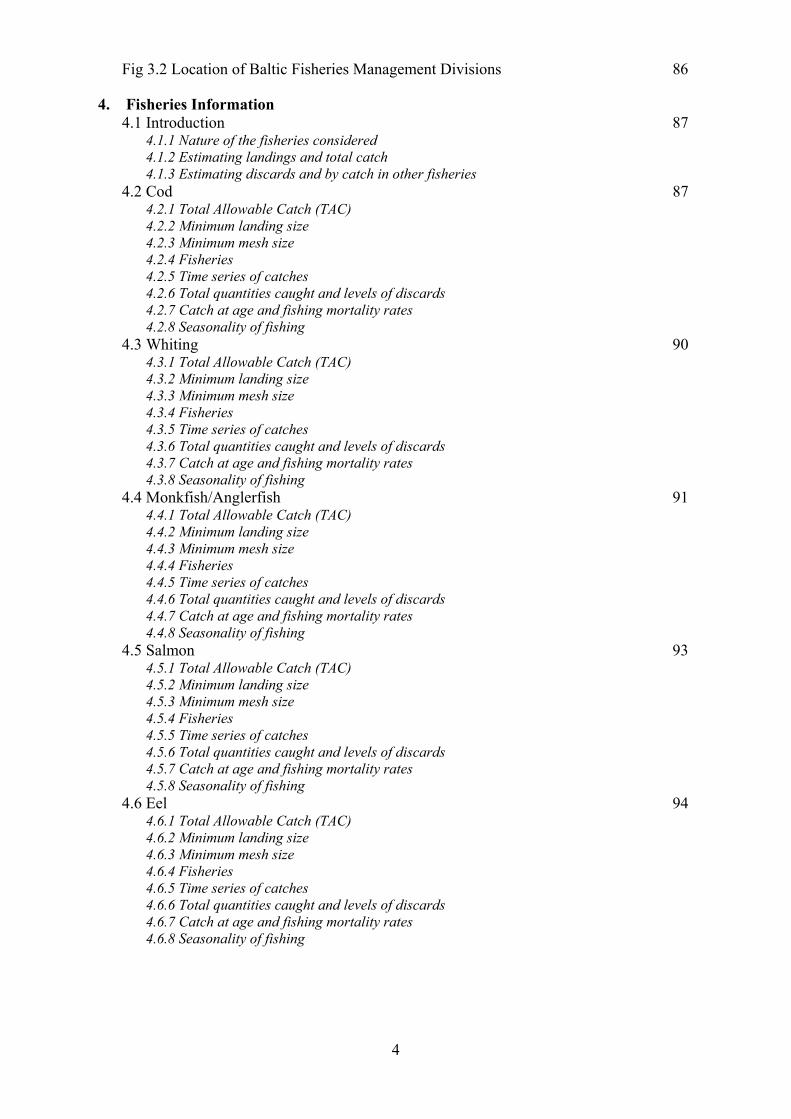
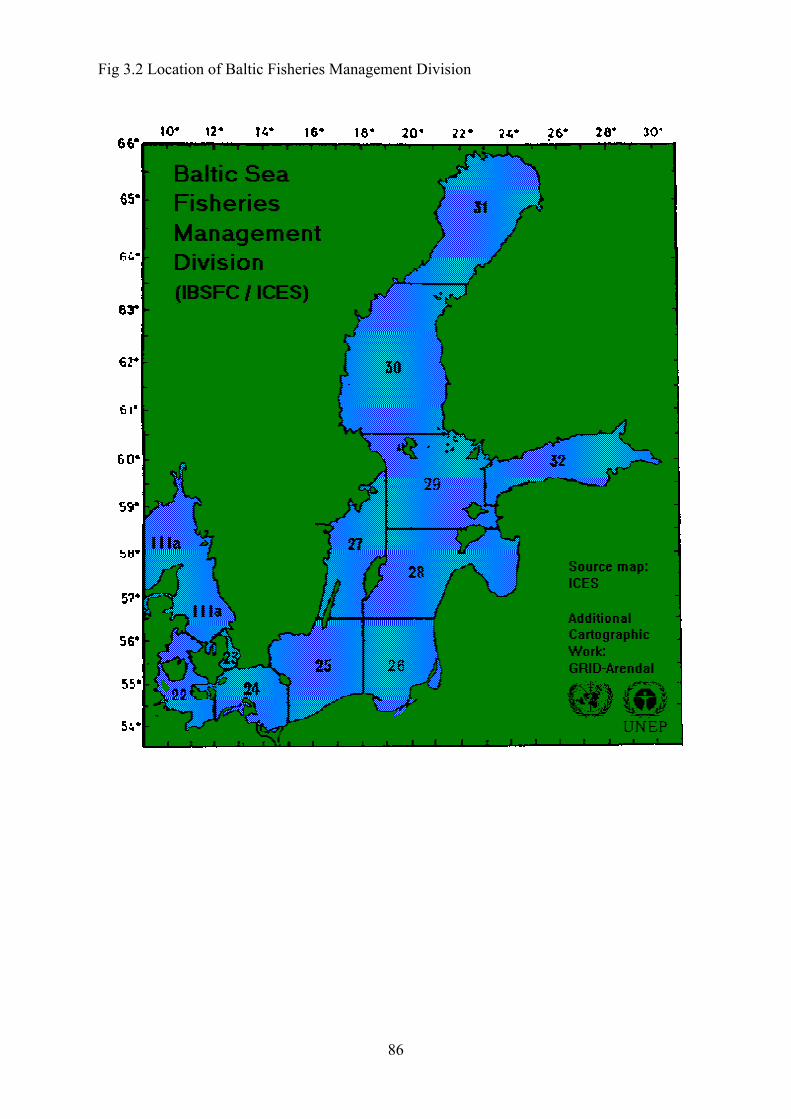
Fig 3.2 Location of Baltic Fisheries Management Divisions 86
4. Fisheries Information 4.1 Introduction 87
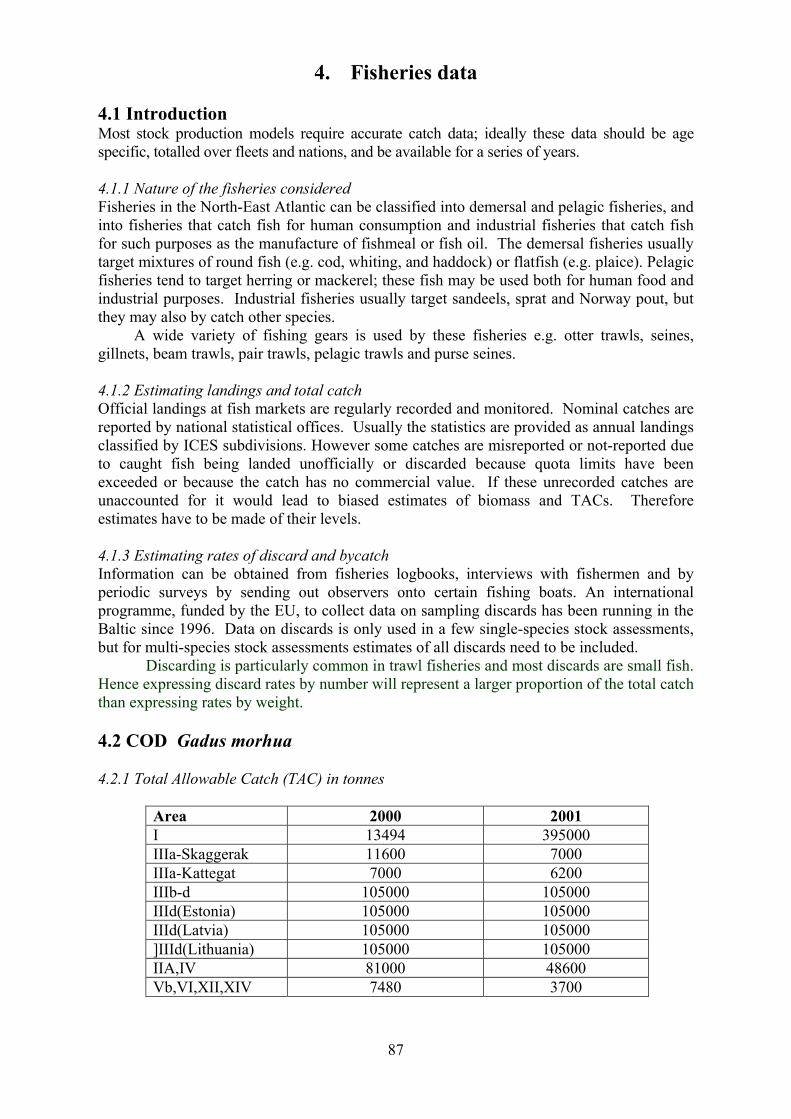
4.1.1 Nature of the fisheries considered 4.1.2 Estimating landings and total catch 4.1.3 Estimating discards and by catch in other fisheries 4.2 Cod 87
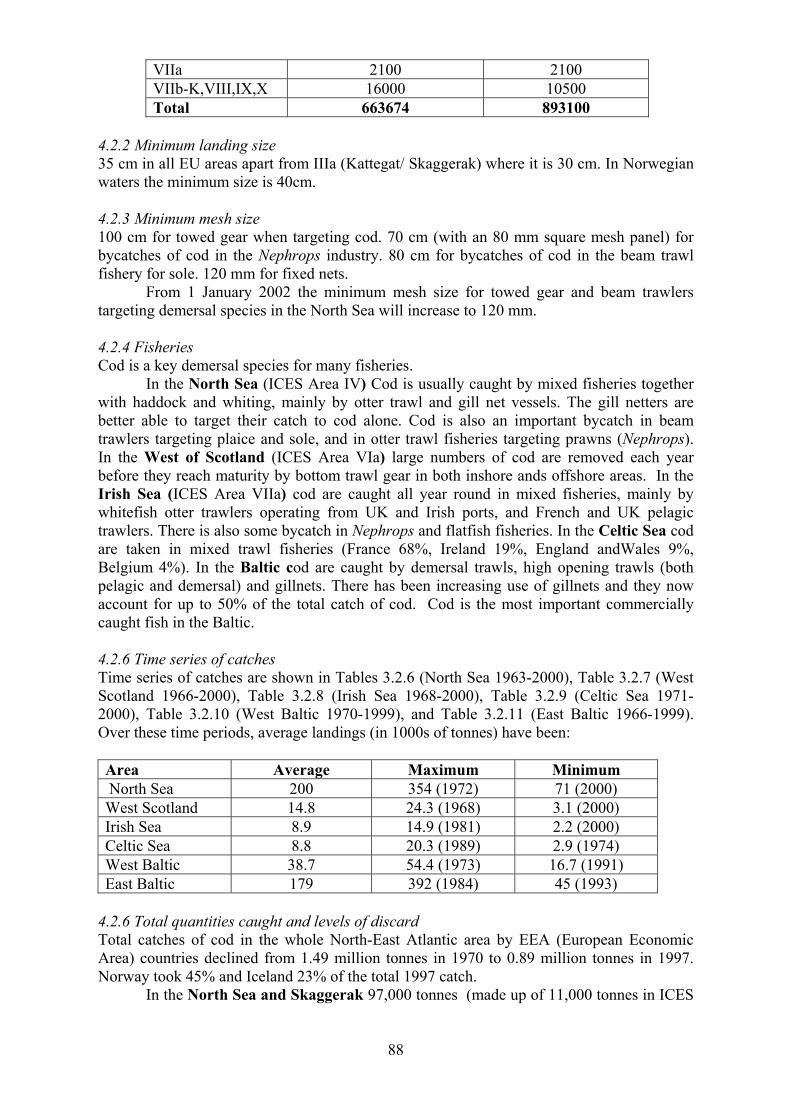
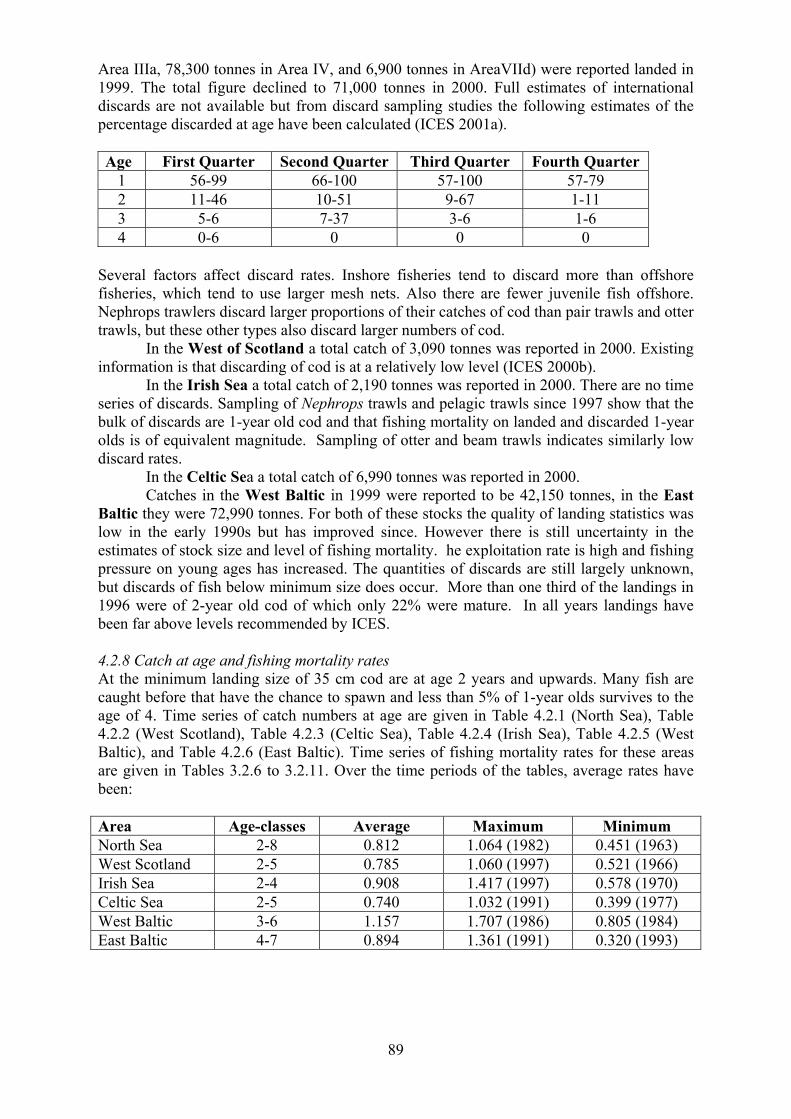
4.2.1 Total Allowable Catch (TAC) 4.2.2 Minimum landing size 4.2.3 Minimum mesh size 4.2.4 Fisheries 4.2.5 Time series of catches 4.2.6 Total quantities caught and levels of discards 4.2.7 Catch at age and fishing mortality rates 4.2.8 Seasonality of fishing
4.3 Whiting 90
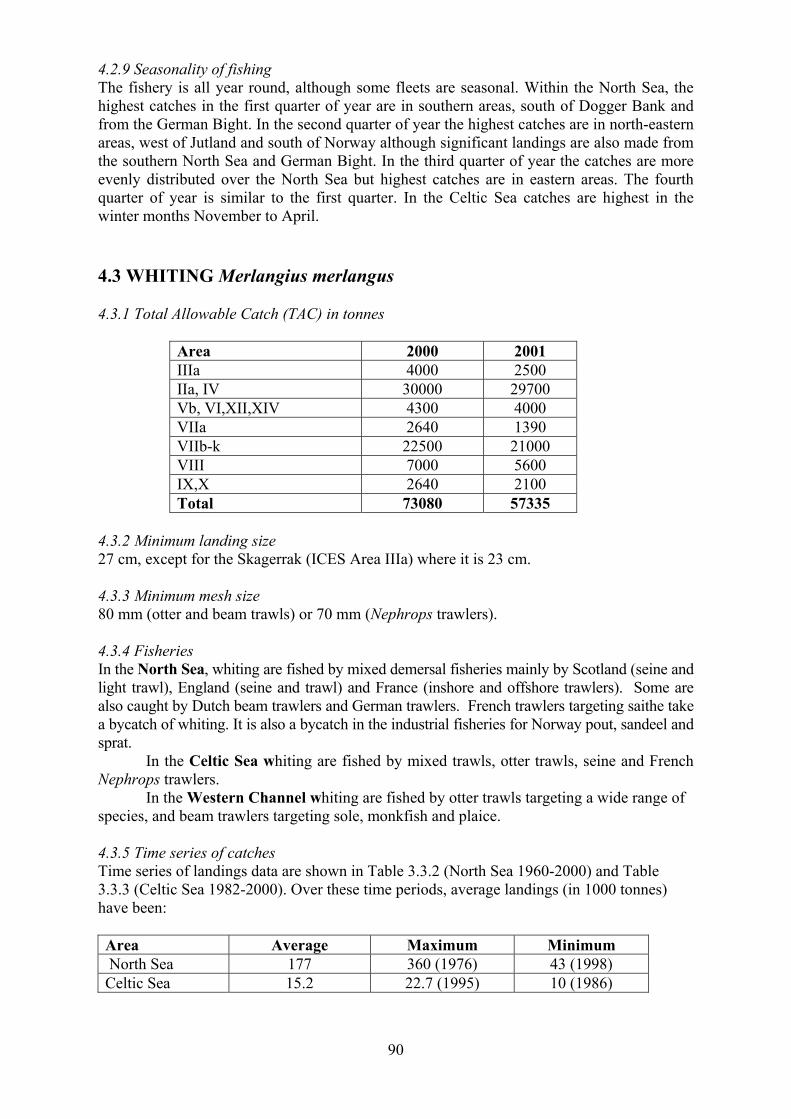
4.3.1 Total Allowable Catch (TAC) 4.3.2 Minimum landing size 4.3.3 Minimum mesh size 4.3.4 Fisheries 4.3.5 Time series of catches 4.3.6 Total quantities caught and levels of discards 4.3.7 Catch at age and fishing mortality rates 4.3.8 Seasonality of fishing
4.4 Monkfish/Anglerfish 91
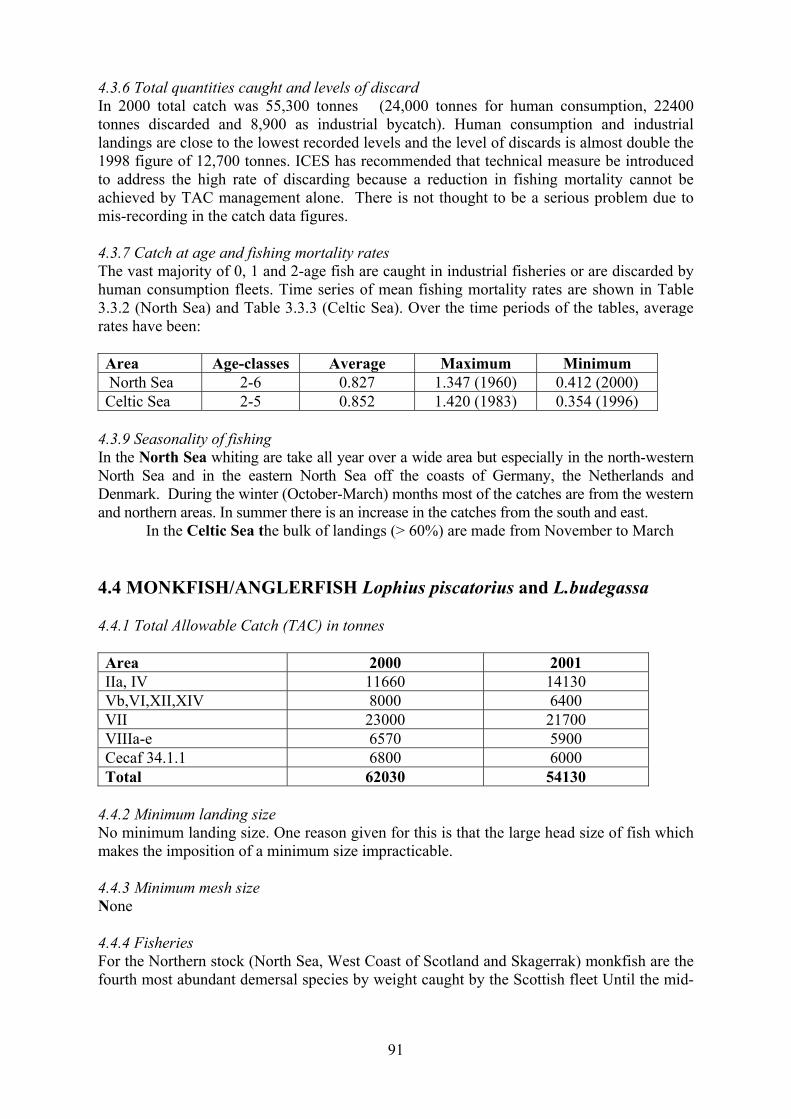
4.4.1 Total Allowable Catch (TAC) 4.4.2 Minimum landing size 4.4.3 Minimum mesh size 4.4.4 Fisheries 4.4.5 Time series of catches 4.4.6 Total quantities caught and levels of discards 4.4.7 Catch at age and fishing mortality rates 4.4.8 Seasonality of fishing
4.5 Salmon 93
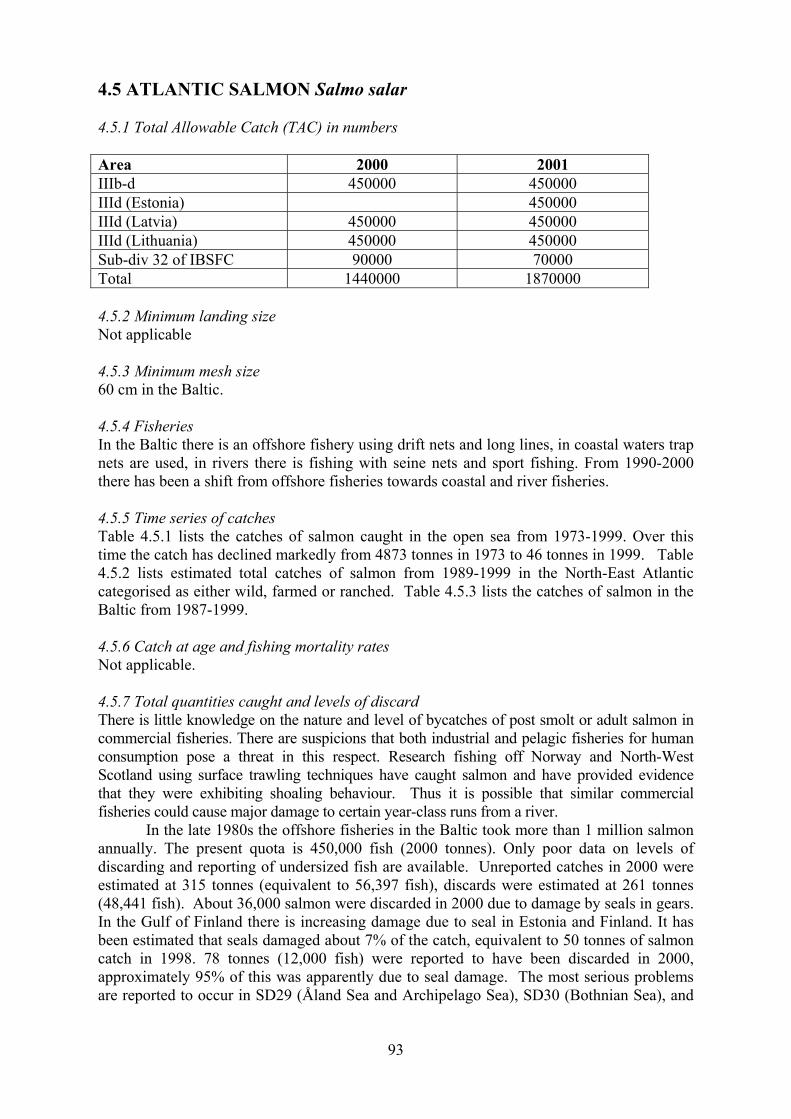
4.5.1 Total Allowable Catch (TAC) 4.5.2 Minimum landing size 4.5.3 Minimum mesh size 4.5.4 Fisheries 4.5.5 Time series of catches 4.5.6 Total quantities caught and levels of discards 4.5.7 Catch at age and fishing mortality rates 4.5.8 Seasonality of fishing
4.6 Eel 94
4.6.1 Total Allowable Catch (TAC) 4.6.2 Minimum landing size 4.6.3 Minimum mesh size 4.6.4 Fisheries 4.6.5 Time series of catches 4.6.6 Total quantities caught and levels of discards 4.6.7 Catch at age and fishing mortality rates 4.6.8 Seasonality of fishing
4
4.7 Haddock 95
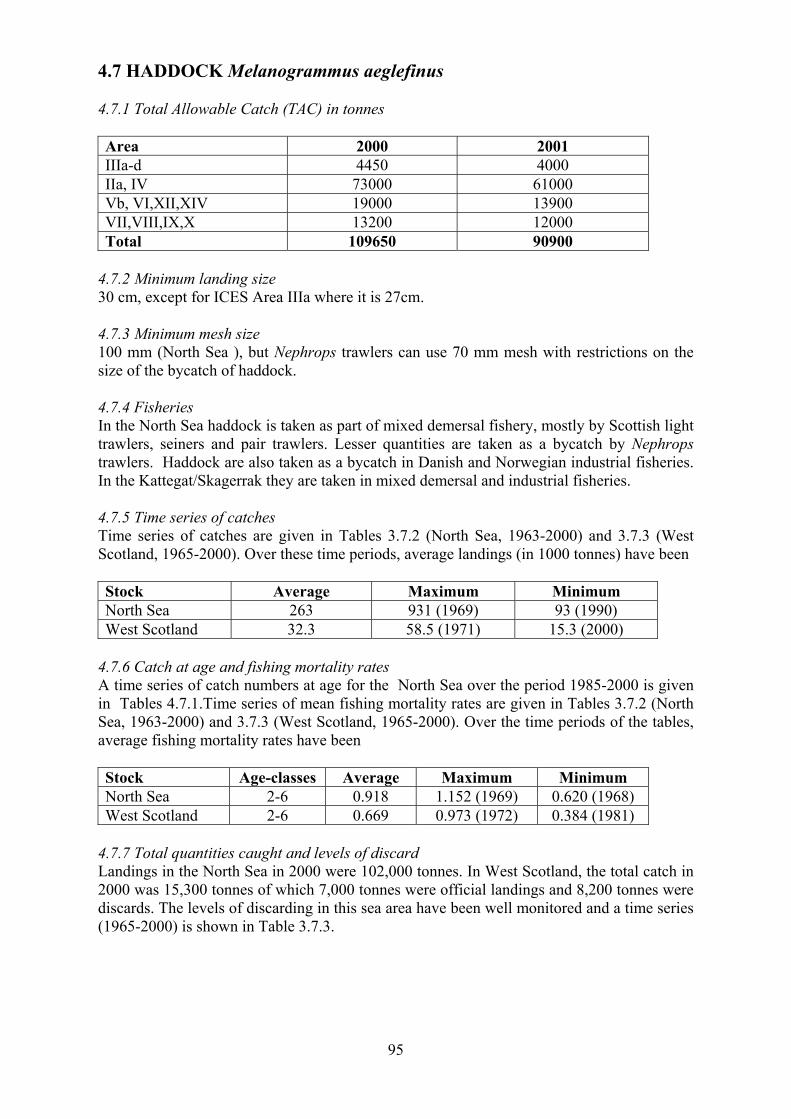
4.7.1 Total Allowable Catch (TAC) 4.7.2 Minimum landing size 4.7.3 Minimum mesh size 4.7.4 Fisheries 4.7.5 Time series of catches 4.7.6 Total quantities caught and levels of discards 4.7.7 Catch at age and fishing mortality rates 4.7.8 Seasonality of fishing
4.8 Plaice 96
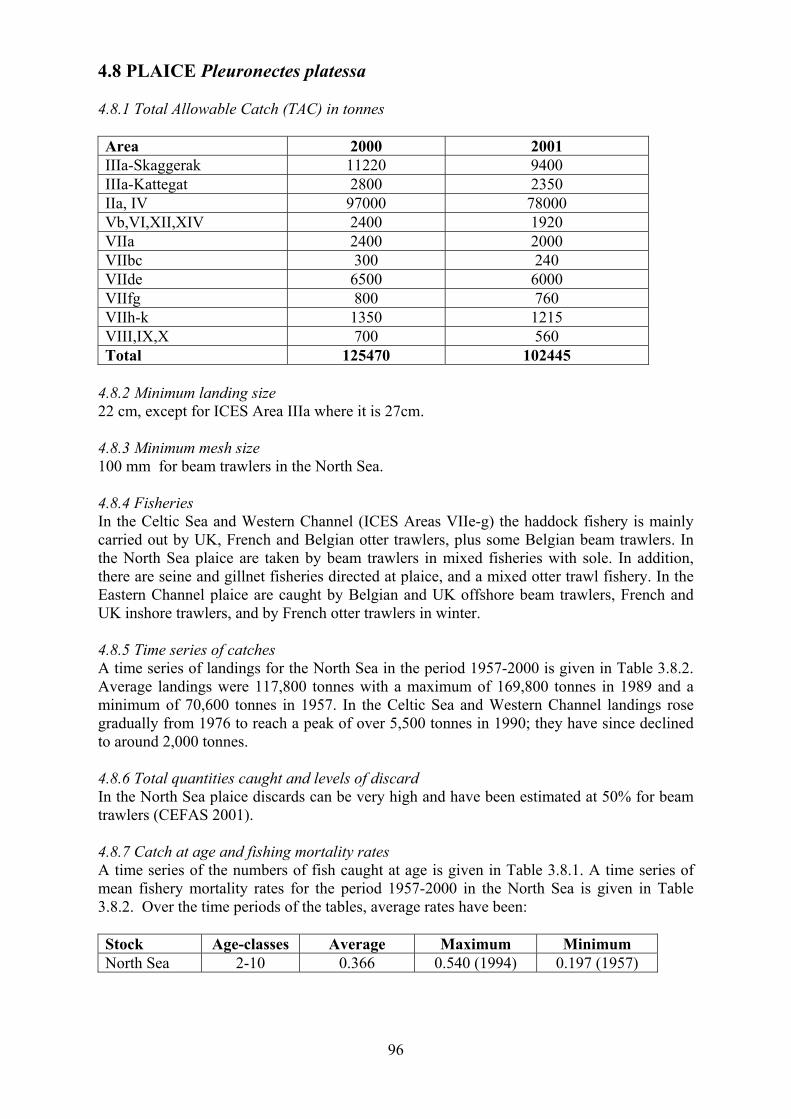
4.8.1 Total Allowable Catch (TAC) 4.8.2 Minimum landing size 4.8.3 Minimum mesh size 4.8.4 Fisheries 4.8.5 Time series of catches 4.8.6 Total quantities caught and levels of discards 4.8.7 Catch at age and fishing mortality rates 4.8.8 Seasonality of fishing
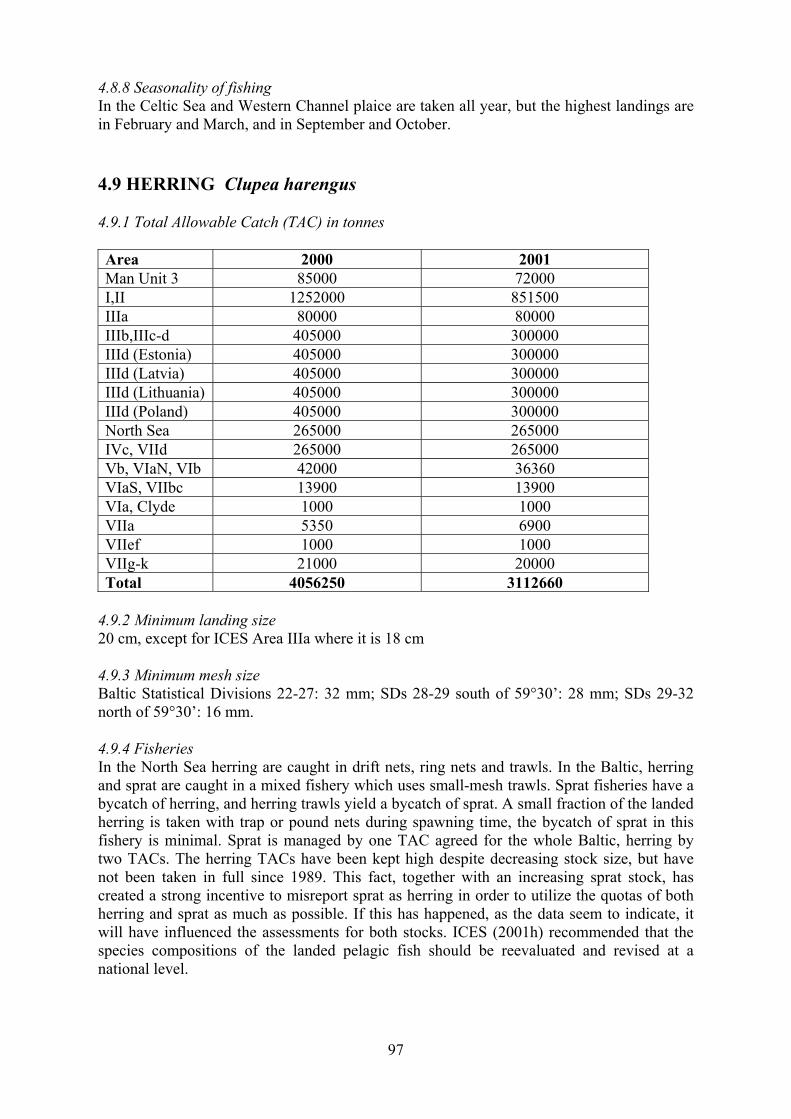
4.9 Herring 97
4.9.1 Total Allowable Catch (TAC) 4.9.2 Minimum landing size 4.9.3 Minimum mesh size 4.9.4 Fisheries 4.9.5 Time series of catches 4.9.6 Total quantities caught and levels of discards 4.9.7 Catch at age and fishing mortality rates 4.9.8 Seasonality of fishing
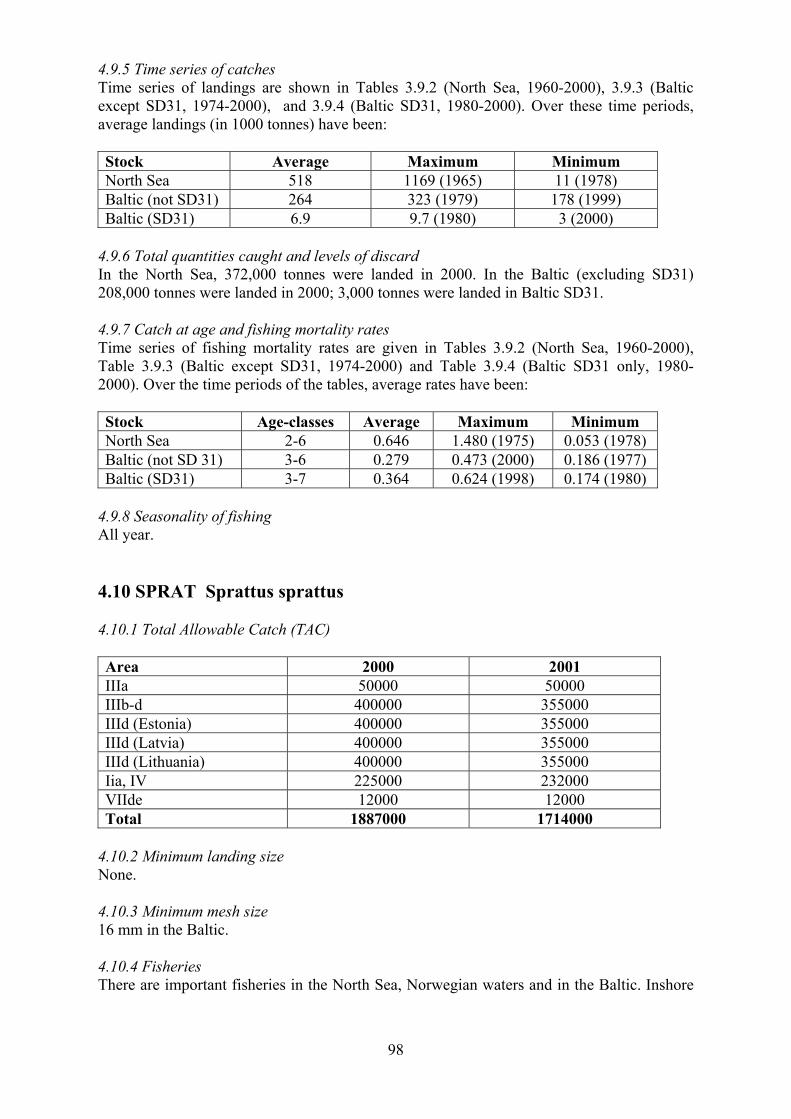
4.10 Sprat 98
4.10.1 Total Allowable Catch (TAC) 4.10.2 Minimum landing size 4.10.3 Minimum mesh size 4.10.4 Fisheries 4.10.5 Time series of catches 4.10.6 Total quantities caught and levels of discards 4.10.7 Catch at age and fishing mortality rates 4.10.8 Seasonality of fishing
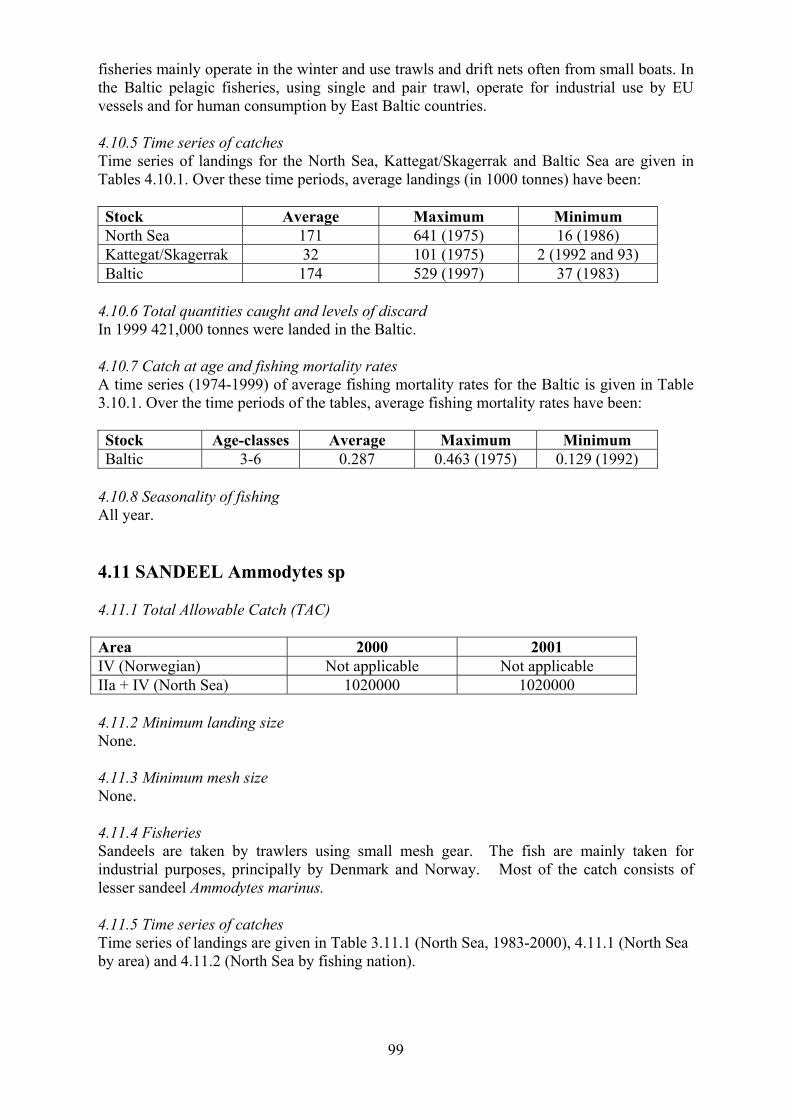
4.11 Sandeel 99
4.11.1 Total Allowable Catch (TAC) 4.11.2 Minimum landing size 4.11.3 Minimum mesh size 4.11.4 Fisheries 4.11.5 Time series of catches 4.11.6 Total quantities caught and levels of discards 4.11.7 Catch at age and fishing mortality rates 4.11.8 Seasonality of fishing
Tables 101-117
5. Analysing interactions between seals and fisheries 5.1 Introduction 118
5.2 Surplus yield calculations 120
5.3 Minimum realistic models 120
5.3.1 MULTSPEC and BORMICON 5.3.2 Herring, mackerel, cod and grey seals in the southern Gulf of St Lawrence 5.3.3 Grey seals and cod on the Scotian Shelf, Canada
5
5.3.4 Incorporation of marine mammal predation into Multispecies Virtual Population Analysis
5.3.5 Steller sea lion and Alaskan pollock 5.4 Food web models 123
5.5 Energy flux models 124
5.5.1 Steller sea lions and Alaskan Pollack 5.5.2 Harp seals and cod on the Newfoundland-Labrador shelf
5.6 Application of the UNEP guidelines to interactions in the North-East 125
Atlantic and Baltic Sea 5.6.1 Indirect effects of grey seals in the North Sea 5.6.2 Indirect effects of seals on Atlantic salmon
5.6.3 Indirect effect of grey seals on salmon fisheries 5.6.4 Direct effect of grey seals on monkfish fisheries
6. Interactions between marine mammals and fisheries in other parts of the world. 128 7. Bibliography 129
6
EXECUTIVE SUMMARY
1. This report identifies the most important interactions between seals and commercial
fisheries in the North-East Atlantic, summarises information on the abundance and
diet of the three most numerous seal species, on the status of fish stocks that are
believed to interact with these population either directly or indirectly, and reviews the
methods that have been developed to analyse seal-fishery interactions.
2. The most important interactions involve grey seals and cod in the North Sea, grey
seals, harbour seals and salmon in the North-East Atlantic, grey seals and salmon and
whitefish fisheries in the Baltic, and grey seals and monkfish in the Celtic and Irish
Seas and off South-West England. All but the first of these interactions primarily
involve problems in the immediate vicinity of fishing gear rather than competition
between seals and fisheries.
3. The grey seal is the most abundant species in the North-East Atlantic, although large
numbers of harp seals may occasionally invade the area from further north. Grey
seal numbers in the North-East Atlantic have been increasing steadily since at least
the 1960s. There is some evidence that pup production at grey seal colonies off the
west coast of Scotland is no longer increasing, but total population size will continue
to increase for several decades. In the Baltic, there are approximately equal numbers
of grey seals and ringed seals. There is some evidence that both populations are
increasing, but the rate of increase is less certain than some accounts suggest.
Bycatch levels are relatively high. Both populations are at or below 10% of their size
at the beginning of the 20th
century. Most harbour seal populations have recovered
from the effects of the 1988 phocine distemper epidemic, and many local populations
are still increasing relatively rapidly.
4. Cod stocks througout the North-East Atlantic are considered to be outside safe
biological limits. The current size and catches from North Sea, West Scotland and
Irish Sea stocks are at historical lows. The most important predators (responsible for
more than 10% of predation mortality) in the North Sea are believed to be gurnard
and seals.
5. Whiting stocks in the North Sea are outside safe biological limits but are recovering.
The Celtic Sea stock is above its long term average size. The most important
predators (responsible for more than 10% of predation mortality) in the North Sea are
believed to be whiting, gurnard and cod.
6. There is serious concern about the status of the northern stock of monkfish because
of the high proportion of immature fish in the catch. There is no quantitative
information on predation mortality.
7. Salmon stocks have suffered major declines but the northern stock in the North-East
Atlantic is believed to be within safe biological limits. However, further reductions
in exploitation rates are required for the southern stock. There are no good estimates
of predation mortality, or of the contribution of different predators, at sea and on fish
returning to spawn.
7
8. All eel stocks in the North-East Atlantic are at historic low levels. There are no
reliable data on predation mortality, but birds and seals are believed to be important
predators.
9. All haddock stocks are outside safe biological limits and catches are at, or close to,
historic lows. There is some evidence of improved recruitment in 2000. The most
important predators (responsible for more than 10% of predation mortality) in the
North Sea are believed to be saithe, whiting and cod
10. Plaice stocks are outside safe biological limits and recruitment is below the long term
average. Seals appear to be the only important predators on adult plaice.
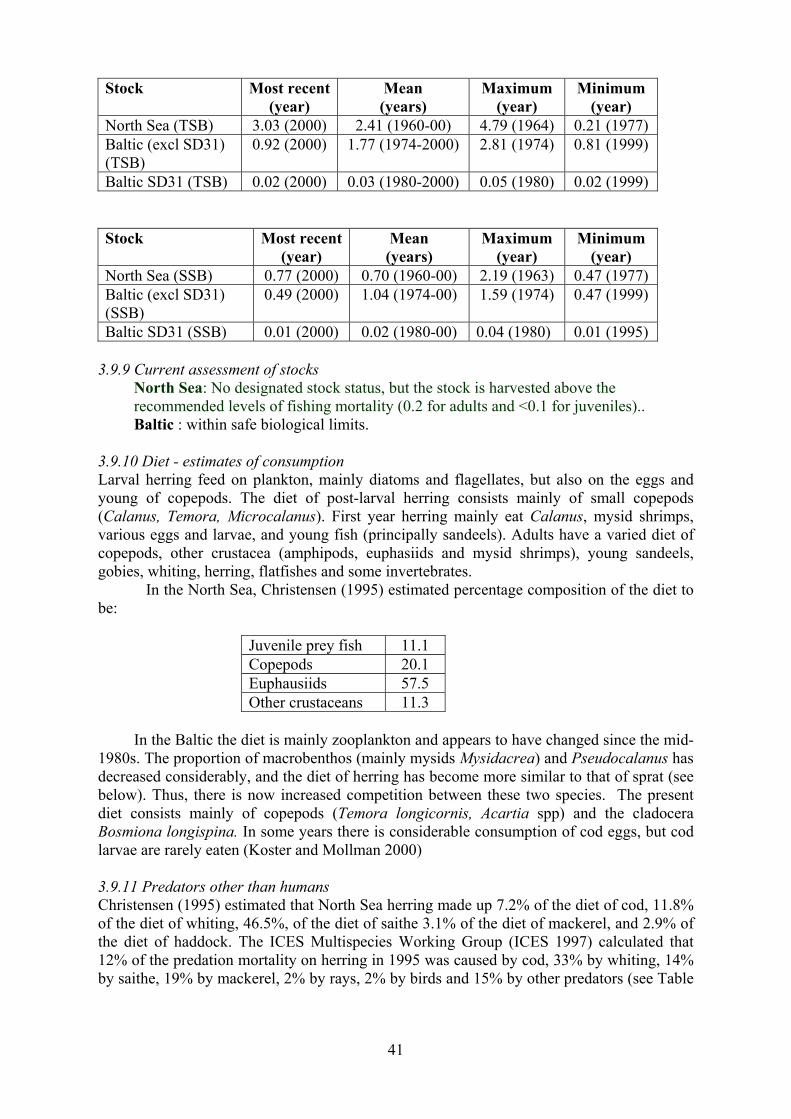
11. Herring stocks in the North Sea are being exploited at a rate that is above the level
recommended by ICES. In the Baltic, stocks are within safe biological limits but
catches are low because of the preponderance of small fish in the catch. The most
important predators (responsible for more than 10% of predation mortality) in the
North Sea are believed to be whiting, mackerel, saithe and cod. In the Baltic, cod are
the most important predator.
12. Sprat stocks in the North Sea are high but TACs have been set low to reduce the
bycatch of herring. In the Baltic the stock is above its long-term average. The most
important predators (responsible for more than 10% of predation mortality) in the
North Sea are believed to be whiting and mackerel. In the Baltic, cod are the most
important predator.
13. Sandeels in the North Sea are within safe biological limits. The most important
predators (responsible for more than 10% of predation mortality) in the North Sea are
believed to be mackerel, whiting and seals.
14. There is no agreed methodology for assessing the potential impact of a reduction in
seal numbers on commercial catches of fish. A number of promising avenues have
been explored but high levels of uncertainty are associated with the predictions
obtained.
15. There is insufficient information on all of the interactions described in point 2. to
fulfill the data requirements described in the UNEP Protocol for the Scientific
Evaluation of Proposals to Cull Marine Mammals. However, most of the data
required to evaluate the interactions between grey seals and cod in the North Sea are
likely to become available over the next two years.
16. There are few instances of proposals to cull marine mammals to protect fisheries
outside the North Atlantic, although there is growing concern about the potential
impact of increasing marine mammal populations in many places. In the US a
number of fisheries have been, or are likely to be, restricted because of concerns
about their impact on the recovery of endangered seal species.
8
1. Introduction
1.1 General approach Fish forms a large part of the diet of most seal species and, particularly at a time when many
commercial fish stocks are declining or are at very low levels, it is not surprising that many
fishers consider seals to be pests whose numbers should be drastically reduced. The
perception of this problem has been exacerbated in recent decades because, following the
cessation of centuries of exploitation, many European seal populations have been increasing
in size.
The interactions between seals and commercial fisheries can be conveniently divided
into two categories: direct interactions, which occur in the immediate vicinity of fishing
gear and may involve damage to fish that have already been caught and to the gear itself, and
indirect interactions, where the interaction is through a shared resource. The strength of
indirect interactions are likely to be related in some way to the size of the seal population
that is involved, but economically or ecologically important direct interactions can occur
even when seal populations are at low levels. For example, the critically endangered
Mediterranean monk seal (Monachus monachus) may cause considerable damage to fish
caught in fine-mesh trammel nets in parts of Greece where it is most numerous, despite the
fact that the total world population of the species is probably less than 500 individuals. Most
of this report is concerned with the problems of evaluating indirect interactions, in which the
estimated consumption of commercially important fish species is compared with the
commercial catch of that species. However, we have only been able to identify two
situations – the potential impact of predation by grey seals on North Sea cod, and by grey
seals and harbour seals on Atlantic salmon in rivers and estuaries – in the North-East
Atlantic and the Baltic Sea where indirect interactions are currently considered to be
economically important. The other high profile interactions are essentially direct ones. Grey
seals and harbour seals may also have an impact on the value of fisheries catches because
they are the final host of the parasitic nematode worm Pseudoterranove decipiens, which
used to have the common name “codworm” but is now more frequently referred to as
“sealworm”. A large number of commercially important fish species are used as
intermediate hosts by this parasite and the presence of worms in their flesh can substantially
reduce their resale value or require expensive processing. Sealworm is reported to be an
economically important problem on the Atlantic coast of Canada and in some parts of
Norway. Although there is some evidence that the prevalence of sealworm can be
particularly high in areas where seals are locally abundant, this is not always the case. The
expected relationship between worm burdens in fish and seal population size is complicated
and we will not address it in this report.
The structure of this report largely follows the recommendations of a report of the
Scientific Advisory Committee of the UNEP Marine Mammal Action Plan on the kinds of
data that are required to evaluate proposal to cull marine mammal (UNEP 1999). These are
summarised in Table 1.1. Although the UNEP Protocol was published in October 1999, it
should be realised that it is based on discussions held at workshops in 1992 and 1994 and
therefore does not reflect the results of research that have been published since 1994. In
particular, the UNEP Protocol suggests that so-called minimum realistic models might be
used to investigate the possible consequences of a cull of marine mammals under a range of
different assumptions. Work since 1994 has indicated that it may be difficult to determine
how many species need to be incorporated into such models before any confidence can be
attached to the phrase “minimum realistic”.
9
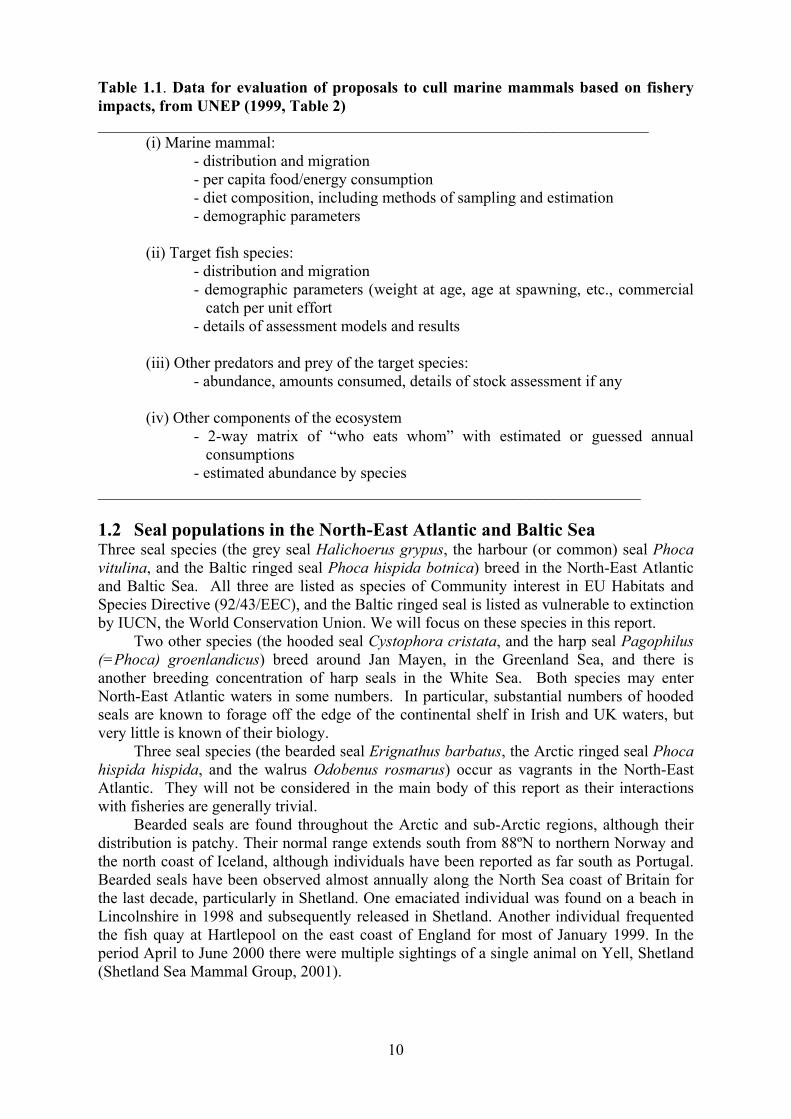
Table 1.1. Data for evaluation of proposals to cull marine mammals based on fishery impacts, from UNEP (1999, Table 2) _____________________________________________________________________
(i) Marine mammal:
- distribution and migration
- per capita food/energy consumption
- diet composition, including methods of sampling and estimation
- demographic parameters
(ii) Target fish species:
- distribution and migration
- demographic parameters (weight at age, age at spawning, etc., commercial
catch per unit effort
- details of assessment models and results
(iii) Other predators and prey of the target species:
- abundance, amounts consumed, details of stock assessment if any
(iv) Other components of the ecosystem
- 2-way matrix of “who eats whom” with estimated or guessed annual
1.2 Seal populations in the North-East Atlantic and Baltic Sea Three seal species (the grey seal Halichoerus grypus, the harbour (or common) seal Phoca vitulina, and the Baltic ringed seal Phoca hispida botnica) breed in the North-East Atlantic
and Baltic Sea. All three are listed as species of Community interest in EU Habitats and
Species Directive (92/43/EEC), and the Baltic ringed seal is listed as vulnerable to extinction
by IUCN, the World Conservation Union. We will focus on these species in this report.
Two other species (the hooded seal Cystophora cristata, and the harp seal Pagophilus (=Phoca) groenlandicus) breed around Jan Mayen, in the Greenland Sea, and there is
another breeding concentration of harp seals in the White Sea. Both species may enter
North-East Atlantic waters in some numbers. In particular, substantial numbers of hooded
seals are known to forage off the edge of the continental shelf in Irish and UK waters, but
very little is known of their biology.
Three seal species (the bearded seal Erignathus barbatus, the Arctic ringed seal Phoca hispida hispida, and the walrus Odobenus rosmarus) occur as vagrants in the North-East
Atlantic. They will not be considered in the main body of this report as their interactions
with fisheries are generally trivial.
Bearded seals are found throughout the Arctic and sub-Arctic regions, although their
distribution is patchy. Their normal range extends south from 88ºN to northern Norway and
the north coast of Iceland, although individuals have been reported as far south as Portugal.
Bearded seals have been observed almost annually along the North Sea coast of Britain for
the last decade, particularly in Shetland. One emaciated individual was found on a beach in
Lincolnshire in 1998 and subsequently released in Shetland. Another individual frequented
the fish quay at Hartlepool on the east coast of England for most of January 1999. In the
period April to June 2000 there were multiple sightings of a single animal on Yell, Shetland
(Shetland Sea Mammal Group, 2001).
10
The ringed seal is predominantly an Arctic, ice-breeding species with a circumpolar
distribution. Although it is generally non-migratory, ringed seals may make long distance
movements following the distribution of pack ice. Occasionally young animals may move
southward and there have been a number of records from the coasts of North Sea states.
There were 14 records from the North Sea between 1970 and 1980, and 21 between 1980
and 1990 (Van Bree, 1997). Ringed seals are easily mistaken for harbour seals, and they
may occur more frequently in the North Sea than the current records indicate since they were
known to have been taken regularly by seal hunters operating in Shetland during the 1960's.
The walrus (Odobenus rosmarus) is normally found in shallow water around Arctic
coasts. However, its distribution extended much further south in historical times and it has
occurred in Germany, the Netherlands and Belgium, as well as the UK.
The endangered Saimaa seal (Phoca hispida saimensis) and the vulnerable Ladoga seal
(Phoca hispida ladogensis) live in large bodies of freshwater adjacent to the Baltic Sea.
However, neither subspecies occurs in the Baltic, and they will not be considered here.
1.3 Target fish stocks There are four basic interactions between seals and commercial fisheries in the North-East
Atlantic and Baltic which appear to be particularly important:
x�The indirect effects of predation by grey seals on commercial catches, and the
recovery, of cod stocks in the North Sea.
x�The indirect effects of predation by grey seals and harbour seals in estuaries and in the
open sea on the recovery of Atlantic salmon stocks.
x�The direct effects of grey seals, and possibly harbour seals, on a range of different
fisheries for salmon.
x�The direct effects of grey seals on bottom-set gillnet fisheries for monkfish in the
Celtic and Irish Seas, and off South-West England.
There may also be a direct interaction between grey seals and drift net fisheries for herring in
the Baltic Sea.
Following the UNEP guidelines, we have considered not only the fish and seal stocks
directly involved in these interactions but also (in the cases of North Sea and Baltic cod, and
Baltic salmon) the stocks of the important predators and prey of these species. We have
therefore also considered the current status of stocks of whiting, monkfish, eels, haddock,
plaice, herring, sprat, and sandeels.
1.4 Relevant fisheries Fisheries implicated in the first interaction include trawl and gillnet fisheries operated
particularly by the UK, Denmark and Norway. Salmon fisheries that may be affected by
interactions with seals include fixed net fisheries on the east coast of Scotland, and trap and
gillnet fisheries in Ireland and the Baltic. We have not considered the impact of seal
predation on non-commercial rod and line fisheries or on salmon aquaculture, although we
recognise that such predation may have substantial economic effects.
11
2. Seal populations 2.1 Introduction 2.1.1 Methods for estimating population size Seals spend most of their time at sea, and mostly underwater. As a result, it is difficult (and
usually impossible) to census the whole of a seal population directly. Instead, some more
accessible but well-defined component of the population is counted. Grey seals aggregate to
breed, and their pups remain on the land or ice where they are born over a number of days or
weeks. It is this component of the grey seal population that has traditionally been censused.
Although harbour seals also aggregate to breed, their pups are often born on intertidal rocks or
sandbanks, so they spend some of their time in the water from birth. For this species, a different
component of the population, usually the number of seals hauled out during the annual moult in
July or August, must be censused. In recent years, survey work in the Baltic Sea has also
concentrated on this component of the grey seal population, because it has been difficult to
locate ice-breeding aggregations. Ringed seals breed in sub-nivean lairs on ice, which are
virtually impossible to detect from the air. However, adults spend a large proportion of their
time on the ice at the end of the pupping season, when they can be counted in low-level aerial
surveys.
In order to convert the estimate of the number of pups born in a particular year, or the
number of seals counted out on a particular day, to an estimate of total population size,
additional information on the life history and behaviour of the surveyed species is required. If
pup counts are being used, the number of adult females can be estimated if the proportion of
females that give birth each year is known. The number of subadult animals can be estimated in
a number of ways. At the very least, we need to know annual survival rates from birth to first
breeding. These rates will depend not only on the natural risks that young seals are exposed to,
but also on how many are killed by hunters or taken as bycatch in fishing gear each year.
For counts of seals hauled out on rocks, sandbanks or ice, information on the proportion
of time that animals spend out of the water is required. This can be obtained by attaching radio
transmitters to individuals an monitoring their behaviour. However, sample sizes are likely to
be small, and transmitters may become detached during the moulting process. Resightings of
individually-recognizable animals – either those that have been deliberately marked by
branding or which can be recognized by their unique markings – can also be used to provide
this information. A number of studies have indicated that there are significant differences
between the haul out behaviour of males and female harbour seals, and among age classes.
These differences must be accounted for in converting counts to estimates of population size.
Resightings of individuals that can be recognized by their markings can also be used to
estimate population size using mark-recapture analysis. This approach has been used to
estimate the size of the grey seal population in the Baltic (Hiby et al. 2001), and is being
developed for harbour seals (Hiby, pers. comm.).
2.1.2 Methods for estimating mortality and fecundity rates The mortality suffered by a seal population can be conveniently divided into that resulting from
natural causes and that resulting from human actions. Human-induced mortality includes seals
deliberately killed as part of hunts or culls (including an allowance for seals that are killed but
not recovered by hunters), and seals that die following entanglement in fishing gear. Clearly this
mortality may vary substantially from year to year and needs to be explicitly documented. It is
generally assumed that mortality from natural causes (such as disease, accident, starvation and
predation) fluctuates around some long-term average and can be described by a single
parameter. In populations that are not subject to large-scale human-induced mortality, natural
12
mortality rates can be estimated from an examination of the number of animals in successive
age categories. However, all of the seal species have a history of exploitation, culling or
periodic mass mortalities that is reflected in their age structure. These perturbations have made
it very difficult to estimate natural mortality from population age structure. In principal, mark-
recapture analysis of the resightings of individually-recognizable animals can also be used to
estimate mortality rates, but this approach has yet to be applied to seal populations in the North-
East Atlantic.
If pregnancy and mortality rates remain constant over time, then the number of pups
born each year in a seal population provides a reliable index of the total size of a seal
population. However, if these rates vary over time, then trends in pup production can be
misleading. In order to understand the dynamics of a seal population it is therefore necessary to
monitor pregnancy rates. Since pregnant animals may lose their foetus at any time during
pregnancy, pregnancy rates recorded during the later stages of gestation provide the most
reliable link between pup production and the size of the adult female population. At present
such information can only be obtained through post-mortem analysis, either of animals
deliberately killed for scientific purposes or of animals that are bycaught or killed in hunts or
culls.
2.1.3 Methods for estimating diet and prey consumption Studies of the diet of seals in the North-East Atlantic have been based on the identification
and measurement of prey remains (usually hard parts, such as fish otoliths) found in gut
contents or faeces collected at haul-out sites. In some cases diet composition is simply
estimated from the frequency with which different prey species are recorded. However, this
can be misleading because the importance of prey species whose average size is small will
be overestimated. It is preferable to estimate the weight and energy content of the original
prey items and use these estimates as the basis for calculating the contribution that each prey
species makes to the seal diet. Estimates of the total energy requirements of seals of
different ages, based on laboratory or field studies, are then combined with estimates of the
numbers of seals of the given ages in the population to calculate the total quantity of each
prey species consumed.
The nature and direction of the biases in estimates of diet composition from stomachs
or faeces are well known, and some allowance can be made for these in interpreting the data
(e.g., Bowen and Harrison 1994). In particular, these techniques have been criticized for
underestimating the importance of commercially important species in seal diets. However,
they may also underestimate the importance of non-commercial species. Both methods,
using stomach contents or faeces, rely on the presence of relatively undigested hard parts
from prey in the samples and cannot account for prey without identifiable hard parts, or
when hard parts are not ingested or are digested very rapidly. For example, it is often
claimed that seals may eat only the bellies of large fish and that these size classes are
therefore under-represented in the estimated diet. Diet quality is probably the largest source
of calculable uncertainty in the estimates of consumption by seals (Shelton et al. 1997).
Resampling methods (eg Hammond and Rothery 1996, Warren et al. 1997, Shelton et al.
1997) can, in principle, be used to provide confidence limits on estimates of diet compostion
and quantities of fish consumed, but it is usually difficult to account for all sources of
uncertainty. For example, to the best of our knowledge, no attempt has been made so far to
account for uncertainties in the estimates of daily energy requirements, even though there is
known to be large variation in published estimates of basic metabolic rate within individual
seal species.
Other techniques which could be used for assessing seal diets include:
x� Serological tests for the recent consumption of different prey species (Pierce et al.
1990). These can indicate whether or not seals have been consuming prey species
13
whose identifiable hard parts are not ingested or are easily digested. However, they
cannot be used to estimate the amounts of these species that have been consumed.
x� Analysis of stable-isotope ratios provide information on the proportion of the diet
which has come from different trophic levels (e.g., zooplankton, forage fishes, fish
predators). This can give some insights into changes in food types over time (e.g.,
Lawson and Hobson 2000).
x� Fatty acid “profiles”. The kinds and amounts of different fatty acids in seal blubber
or milk should reflect to the amounts of these fatty acids in the seals’ prey and the
quantities of the different prey species that have been consumed (Smith et al. 1997,
Iverson et al. 1997). These fatty acid “profiles” provide a summary of an animal’s
diet over a considerable period of time, rather than reflecting the composition of one
or two meals, as is the case with gut or faecal analysis. One potential problem with
this method is that the fatty acid composition of a prey species may vary depending
on the prey’s own diet. However, Kirsch et al. (1998) fed captive seals with cod that
had been fed either lean squid (Loligo sp.) or fatty mackerel (Scomber scomber) and
found that "both cod and [its] prey . . . consumed by a larger predator [e.g., seals] can
. . . still be distinguished from one another.” Walton et al. (2000) carried out a
preliminary analysis of the fatty acid composition of the blubber of British grey seal
and found apparent differences in diet between seals foraging in the Atlantic and
those foraging in the North Sea. However, it was not possible to identify which prey
species were involved.
At the moment, only the analysis of prey remains in faeces or stomachs can provide
quantitative estimates of diet composition and so it has been impossible to compare
results obtained from these different methods.
2.2 Grey seal 2.2.1 Geographical distribution Grey seals are confined to the North Atlantic, Baltic and Barents Seas. Grey seals haul out
on land or ice for breeding and between foraging trips at sea. When breeding on land, they
form large aggregations in which females give birth to a single pup, which is suckled for
around 3 weeks. Females mate before returning to sea.
There are three recognised populations of grey seals which breed in the northwest
Atlantic (primarily on Sable Island, Canada and in the Gulf of St Lawrence), in the Baltic
Sea, and in the North-East Atlantic (primarily on offshore islands around the British Isles but
also in Iceland, the Faeroe Islands, France, the Netherlands, central and northern Norway,
and around the Kola peninsula in Russia). Historically, most of the pups in the Baltic were
born on ice in the Bothnian Bay. However, in recent years, perhaps due to poor ice cover
throughout the Baltic, a high proportion of pups have been born on islands off the coast of
Estonia. The first successful breeding of grey seals in the Wadden Sea in the 20th
century
was recorded at Terschelling in the Netherlands in the 1980’s. Pup numbers there have
increased from just 2 in 1985 to more than 100 in 2000. Recent counts of older animals
number around 500. The first firm evidence that grey seals breed on the west coast of
Norway south of 62ºN was obtained in 2000, when 21 pups were tagged.
Timing of pupping differs throughout the range of the species. The North-East
Atlantic population pups in the autumn, from September to December; in the Wadden Sea
this period extends into January. In the Baltic, grey seals pup from January to March.
14
2.2.2 Population size The North-East Atlantic population has been increasing in size by around 6% annually since
the 1960’s. It is currently estimated to consist of approximately 124,000 individuals. At the
beginning of the 20th
century it was much smaller: the grey seal was was the first mammal to
be protected by British legislation, under an Act of Parliament passed in 1914. At that time,
it was believed that there were only a few hundred grey seals left in the country. By the late
1950s, so many complaints had been received from fishermen about the effect of increasing
grey seal numbers on their catches that the British Government established a Consultative
Committee on Grey Seals and Fisheries. In 1963 this Committee recommended that grey
seal numbers at the Farne Islands and in the Orkney islands, Scotland, should be reduced by
a series of pup harvests. In practice, pups were taken from the Farne Islands only in 1963,
1964 and 1965. Pup hunting in Orkney continued from 1962 to 1982, with more than 1,000
pups being taken in some years, and was extended to the Outer Hebrides between 1972 to
1979. Smaller numbers of pups were also taken in Shetland over this period. Despite these
actions, grey seal numbers continued to rise through the 1960s and early 1970s (Summers
1978). Nearly 2,000 adult grey seals were shot at the Farne Islands in 1972 (Bonner and
Hickling 1974) and 1975 (Hickling et al. 1976) in an attempt to control numbers there. In
1977 a management plan to reduce the size of the Scottish grey seal population was
instigated. The aim was to reduce mortality on fish stocks by killing 5,400 adult females and
24,000 pups over a five year period (Summers and Harwood 1979). In practice, only the
first year of this plan was carried out, and it was abandoned in 1978 because of widespread
public opposition (Harwood and Greenwood 1985). British fishermen have continued to call
for a reduction in grey seal numbers since 1978, but no new action has been taken. In
Norway, hunting of grey seals has recently (1998) been resumed, apparently in an effort to
reduce perceived conflicts with fisheries (see Chapter 6), although the quota has not been
taken in full. According to ICES (2001m, p6), the current quota of 400 seals on the coast
south of 62°N “exceeds the documented population size”, and only small numbers of grey
seals have been taken (9 in 1999, 70 in 2000 – ICES 2001m).
The grey seal population in the Baltic is estimated to be 12,000 animals (Hiby et al.
2001), based on a photo-identification study conducted over six years. Historically the grey
seal population of the Baltic was much larger than this: the population in 1900 is estimated
to have been more than 100,000 (Hårding and Härkönen 1999), but numbers were reduced
by over-hunting and the effects of pollutant-induced sterility. Hunting of grey seals has now
been resumed in Sweden and Finland, again with the apparent intention of reducing damage
to fisheries (see Chapter 6). The Swedish quota in 2001 was 150, of which 52 animals were
taken (H. Westerberg, pers. comm.)
Counts on the Swedish coastline carried out during the moult have increased by 6-7%
annually in recent years (Helander 2000), and the most recent comparison of coordinated
counts throughout the Baltic (M Jüssi, pers. comm.) gives a total of 10,000 animals – very
close to the estimate based on photo-identification. The observed increase in counts in Finish
waters during the 1990s (from 400 in 1991 to 2,200 in 1999) reported in ICES (2000c) is too
great to be the result of intrinsic growth and must, at least in part, have been the result of
redistribution. Reported levels of bycatch are rather high (>500 animals per year, mostly
caught in salmon gear – ICES 2000c). This represents an additional 4% mortality for a
population of 12,000 animals. Hiby et al. (2001) calculated two values of annual survival for
the Baltic population from their photo-identification data: a direct estimate of 0.9035, and an
indirect estimate of 0.936 based on the assumption that the population was increasing at
6.5% per year. The second figure appears unlikely, because it implies that survival in the
absence of bycatch would be around 0.98 (that is, only 2% of the grey seal population would
die each year from natural causes!). The direct calculation of 0.9035 seems much more
realistic and implies that the population is increasing by around 3% annually, rather than the
15
6-7% estimated from the moulting counts. The rate estimated from the counts may have been
biased by, for example, improved counting efficiency in recent years.
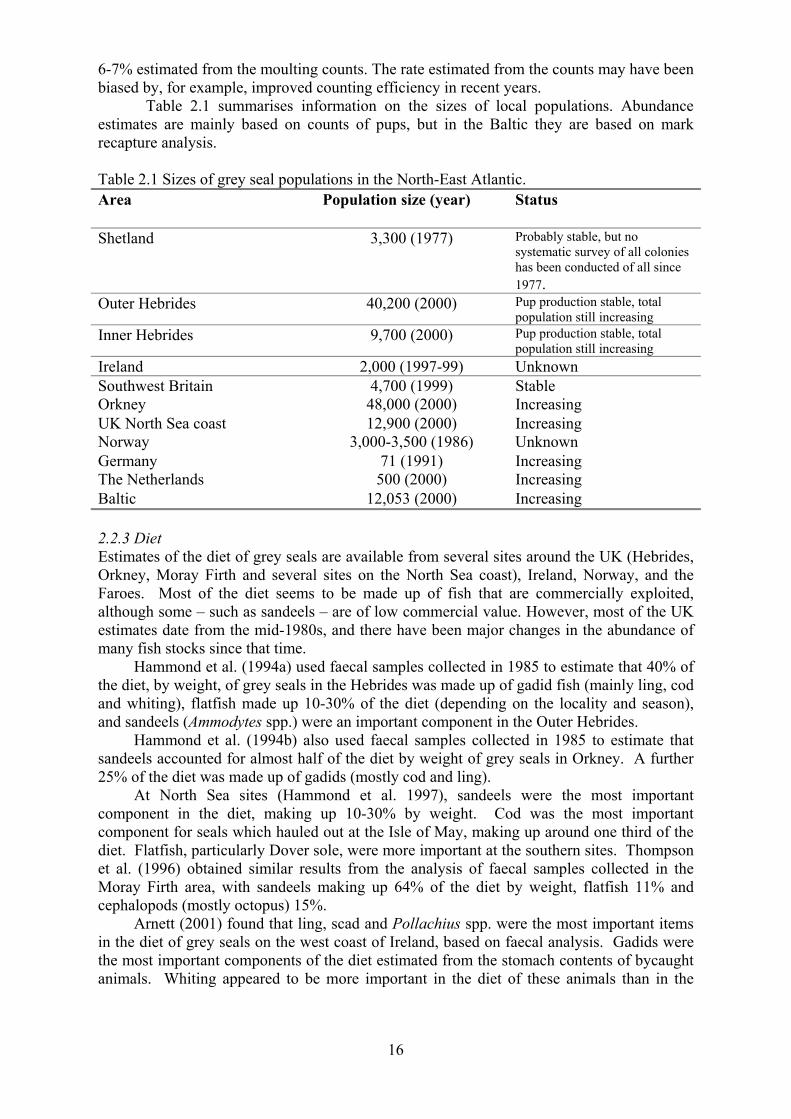
Table 2.1 summarises information on the sizes of local populations. Abundance
estimates are mainly based on counts of pups, but in the Baltic they are based on mark
recapture analysis.
Table 2.1 Sizes of grey seal populations in the North-East Atlantic.
Area Population size (year) Status
Shetland 3,300 (1977) Probably stable, but no
systematic survey of all colonies
has been conducted of all since
1977.
Outer Hebrides 40,200 (2000) Pup production stable, total
population still increasing
Inner Hebrides 9,700 (2000) Pup production stable, total
population still increasing
Ireland 2,000 (1997-99) Unknown
Southwest Britain 4,700 (1999) Stable
Orkney 48,000 (2000) Increasing
UK North Sea coast 12,900 (2000) Increasing
Norway 3,000-3,500 (1986) Unknown
Germany 71 (1991) Increasing
The Netherlands 500 (2000) Increasing
Baltic 12,053 (2000) Increasing
2.2.3 Diet Estimates of the diet of grey seals are available from several sites around the UK (Hebrides,
Orkney, Moray Firth and several sites on the North Sea coast), Ireland, Norway, and the
Faroes. Most of the diet seems to be made up of fish that are commercially exploited,
although some – such as sandeels – are of low commercial value. However, most of the UK
estimates date from the mid-1980s, and there have been major changes in the abundance of
many fish stocks since that time.
Hammond et al. (1994a) used faecal samples collected in 1985 to estimate that 40% of
the diet, by weight, of grey seals in the Hebrides was made up of gadid fish (mainly ling, cod
and whiting), flatfish made up 10-30% of the diet (depending on the locality and season),
and sandeels (Ammodytes spp.) were an important component in the Outer Hebrides.
Hammond et al. (1994b) also used faecal samples collected in 1985 to estimate that
sandeels accounted for almost half of the diet by weight of grey seals in Orkney. A further
25% of the diet was made up of gadids (mostly cod and ling).
At North Sea sites (Hammond et al. 1997), sandeels were the most important
component in the diet, making up 10-30% by weight. Cod was the most important
component for seals which hauled out at the Isle of May, making up around one third of the
diet. Flatfish, particularly Dover sole, were more important at the southern sites. Thompson
et al. (1996) obtained similar results from the analysis of faecal samples collected in the
Moray Firth area, with sandeels making up 64% of the diet by weight, flatfish 11% and
cephalopods (mostly octopus) 15%.
Arnett (2001) found that ling, scad and Pollachius spp. were the most important items
in the diet of grey seals on the west coast of Ireland, based on faecal analysis. Gadids were
the most important components of the diet estimated from the stomach contents of bycaught
animals. Whiting appeared to be more important in the diet of these animals than in the
16
faecal samples. No traces of monkfish remains were found in the Irish samples, and very few
salmon remains have been found in samples collected from Ireland and the UK. This is a
little surprising considering that seals are known to cause problems in the fisheries for these
species.
Mikkelsen and Haug (1999) found that gadoids, sandeels and catfish made up 80% of the
prey remains in a small sample of grey seal stomachs collected in Faroese waters.
There appear to be no recent data on the diet of grey seals in the Baltic (ICES 2000c).
2.2.4 Prey consumption Hammond and Fedak (1994) estimated the quantities of commercial fish species consumed
by grey seals in the North Sea in 1992, and also calculated 95% confidence limits on these
estimates. The most important species consumed were sandeels (27,100-47,600 tonnes), cod
(7,300-16,000 tonnes), ling (2,700-12,200 tonnes), and whiting (3,700-9,100 tonnes). Total
fish consumption was 76,300 tonnes, more than 90% of this was fish species that are
commercially exploited. In general, most of the fish consumed were smaller than those taken
by the commercial fisheries, although there was substantial overlap. As noted above, most of
the diet data on which these calculations are based was collected in 1985. A new round of
sample collection from the North Sea and North-East Atlantic coasts of the UK is planned
for 2002/2003.
2.3 Harbour (common) seal 2.3.1 Geographical distribution Harbour seals are one of the most widespread pinniped species and have a practically
circumpolar distribution. There are four sub-species, but only Phoca vitulina vitulina occurs
in the North-East Atlantic and Baltic Sea. Its distribution extends as far north as Spitzbergen
and there is a small population along the Barents Sea coast of Russia.
2.3.2 Population size Population estimates for harbour seals are primarily based on counts made from aerial
surveys conducted during the moult, when the largest proportion of animals is believed to
haul out. However, in some areas (for example, the Moray Firth in Scotland) land and boat
counts made at the end of the pupping season are considered to be more reliable.
The world population of this sub-species is estimated to be around 70,000
individuals, but this does not take account of animals in the water at the time the aerial
surveys were conducted. Table 2.2 shows the size of different local populations. No
estimates of the historical size of most populations are available, but ICES (2001m) suggests
that, at the beginning of the 20th
century there were 40,000 harbour seals in the Wadden Sea,
17,000 harbour seals in the Kattegat/Skagerrak, and less than 5,000 harbour seals in the
Baltic. There has been a long history of hunting for most populations, and this was
responsible for major declines in Shetland, the Wadden Sea, and the Baltic. Populations in
the southern North Sea and the Kattegat/Skagerrak were severely affected by an outbreak of
phocine distemper in 1988 which resulted in up to 60% mortality in some areas. However,
most local populations have recovered to their pre-epidemic levels and many are still
increasing. There appear to be genetically distinct populations within the Baltic. Both occur
in Swedish and Danish waters (ie in the western part of the Baltic) but, somewhat
confusingly, the most easterly of these populations (which occurs around the island of
Kalmarsund) has traditionally been referred to as the East Baltic population. The
Kalmarsund population was unaffected by the 1988 epizootic.
17
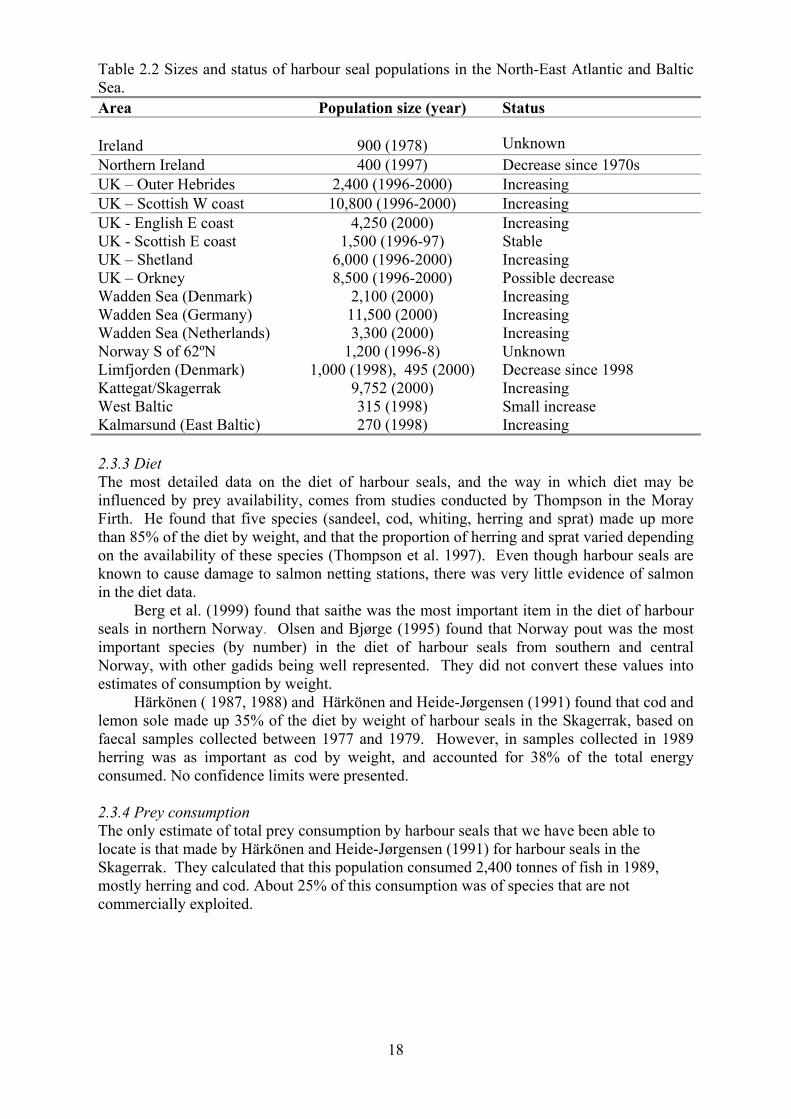
Table 2.2 Sizes and status of harbour seal populations in the North-East Atlantic and Baltic
Sea.
Area Population size (year) Status
Ireland
900 (1978) Unknown
Northern Ireland 400 (1997) Decrease since 1970s
UK – Outer Hebrides 2,400 (1996-2000) Increasing
UK – Scottish W coast 10,800 (1996-2000) Increasing
UK - English E coast 4,250 (2000) Increasing
UK - Scottish E coast 1,500 (1996-97) Stable
UK – Shetland 6,000 (1996-2000) Increasing
UK – Orkney 8,500 (1996-2000) Possible decrease
Wadden Sea (Denmark) 2,100 (2000) Increasing
Wadden Sea (Germany) 11,500 (2000) Increasing
Wadden Sea (Netherlands) 3,300 (2000) Increasing
Norway S of 62ºN 1,200 (1996-8) Unknown
Limfjorden (Denmark) 1,000 (1998), 495 (2000) Decrease since 1998
Kattegat/Skagerrak 9,752 (2000) Increasing
West Baltic 315 (1998) Small increase
Kalmarsund (East Baltic) 270 (1998) Increasing
2.3.3 Diet The most detailed data on the diet of harbour seals, and the way in which diet may be
influenced by prey availability, comes from studies conducted by Thompson in the Moray
Firth. He found that five species (sandeel, cod, whiting, herring and sprat) made up more
than 85% of the diet by weight, and that the proportion of herring and sprat varied depending
on the availability of these species (Thompson et al. 1997). Even though harbour seals are
known to cause damage to salmon netting stations, there was very little evidence of salmon
in the diet data.
Berg et al. (1999) found that saithe was the most important item in the diet of harbour
seals in northern Norway. Olsen and Bjørge (1995) found that Norway pout was the most
important species (by number) in the diet of harbour seals from southern and central
Norway, with other gadids being well represented. They did not convert these values into
estimates of consumption by weight.
Härkönen ( 1987, 1988) and Härkönen and Heide-Jørgensen (1991) found that cod and
lemon sole made up 35% of the diet by weight of harbour seals in the Skagerrak, based on
faecal samples collected between 1977 and 1979. However, in samples collected in 1989
herring was as important as cod by weight, and accounted for 38% of the total energy
consumed. No confidence limits were presented.
2.3.4 Prey consumption The only estimate of total prey consumption by harbour seals that we have been able to
locate is that made by Härkönen and Heide-Jørgensen (1991) for harbour seals in the
Skagerrak. They calculated that this population consumed 2,400 tonnes of fish in 1989,
mostly herring and cod. About 25% of this consumption was of species that are not
commercially exploited.
18
2.4 Baltic ringed seal 2.4.1 Geographical distribution The Baltic ringed seal is, as its name suggests, confined to the Baltic. It breeds in sub-nivean
lairs on sea ice in the Bothnian Bay, Gulf of Finland and Gulf of Riga.
2.4.2 Population size Ringed seals were heavily exploited at the beginning of the 20
th century, when the
population was estimated to be of the order of 200,000 animals (Hårding and Härkönen
1999). Up to 16,000 animals being taken per year and the population declined rapidly from
1910 to 1940. This decline continued into the 1980s because a high proportion of female
seals were rendered effectively sterile by occlusions in their uterine tracts, probably caused
by high levels of organochlorine pollutants. Numbers of seals in the Bothnian Bay have
been surveyed regularly since 1975. A decreasing trend was seen up to 1984, but counts
have increased at an annual rate of 5% since 1988. The most recent published estimate is
3,954 in 1996 (ICES 2000c). Numbers in the Gulf of Finland were relatively high in the
1970s, with up to 8,000 animals being estimated in 1973. However, there appears to have
been a mass mortality in this population in 1991, and counts since then have not exceeded
300 individuals. Up to 4,500 ringed seals were estimated to be in the Gulf of Riga in the
early 1970s, but the most recent count is of 1,407 animals in 1996. Taken together these
results suggest that the current population may be around 6,000 animals.
Bycatch rates in the Baltic are relatively high, and up to 150 animals may be taken each
year, primarily in fyke nets and fish traps.
2.4.3 Diet Most of the information on ringed seal diet comes from bycaught animals. Herring, smelt,
stickleback and crustaceans appear to have been the main prey of these animals, but this may
not be an accurate reflection of the diet of animals away from fishing gear.
2.4.4 Prey consumption We have not found any estimates of the quantities of prey consumed by ringed seals in the
Baltic.
2.5 Other seal species 2.5.1 Harp sea The harp seal is a highly migratory and gregarious species which breeds in large
aggregations on ice on the east coast of Canada, around Jan Mayen and in the White Sea.
Outside the breeding season they are mainly found north of 65ºN, but in some years large
scale southerly movements occur. In 1987 and 1988 over 70,000 seals were drowned in
fishing nets along the north coast of Norway, and animals were observed as far south as
France. These reports are summarised in Heide-Jørgensen et al. (1992). The invading seals
consumed large quantities of herring, cod, saithe, haddock and Norway pout. Ugland et al.
(1993) suggested that this predation may have contributed to the small size of the 1985 year-
class of cod and the 1985 and 1986 year-classes of saithe. Another, smaller scale, invasion
occurred in 1994 and 1995 (Van Bree, 1997). Both invasions are generally considered to
have been a consequence of the collapse of the Barents Sea stock of capelin, which is the
predominant species in the diet of harp seals in this area.
2.5.2 Hooded seal Hooded seals are found throughout the northern part of the central and western North
Atlantic. Three breeding aggregations are known: one to the north of Jan Mayen in the
19
Greenland Sea, another off Newfoundland and in the Gulf of St Lawrence, and the third in
the Davis Strait. From September onwards hooded seals may make long excursions (Folkow
and Blix, 1995, Folkow et al. 1996) to deep waters off the Faroe Islands, and these
excursions may extend further south along the edge of the continental shelf off the west
coast of Ireland and Scotland in April and May. Pups have been recorded as far south as
Portugal. In June, the seals head for moulting sites in the Greenland Sea, north of Jan Mayen
and east of Greenland and in the Denmark Strait. Hooded seals have been observed along the
edge of the UK continental shelf by SAST observers (Tasker, pers. comm.). Given their
preference for deep water on and beyond the edge of the continental shelf, it is not surprising
that adult hooded seals are rarely observed in the North Sea. However, reports from the
North Sea have increased steadily from four in the decade 1971-80, to 16 between 1991 and
1996 (Van Bree, 1997). Many of these reports are of pups that are brought in to seal rescue
centres in southern England and the Netherlands.
The diet of hooded seals in the North-East Atlantic is not known, but in the North-
West Atlantic they are known to consume cod, redfish, Greenland halibut and other flatfish
(Hammill and Stenson 2000).
20
3. Fish information
3.1 Introduction In order to regulate the fishing industry and control the rates of exploitation, fishery
managers require information on the state of fish stocks. In general the information required
on each stock is the numbers of fish or their total weight, the stock biomass, and some
indication of the “health” of the stock. Four main characteristics are usually estimated:
spawning stock biomass (the total weight of mature fish capable of spawning);
recruitment (the number of young fish which survive to enter the adult, or fished, stock in a
particular year); landings and total catches (the total tonnage landed by all fisheries
exploiting the stock, and the total quantity actually removed by these fisheries); and fishing mortality (the proportion of fish taken each year by the fisheries).
Each year, researchers in the relevant countries investigate the changes in these
characteristics and forecast the likely outcomes of different fishing regimes. The International
Council for the Exploration of the Seas (ICES) coordinates the collection of data from the
European fishing nations and these data is pooled for the process of stock assessment, which is
carried out by relevant Working Groups and overseen by the Advisory Committee on Fisheries
Management. It is the responsibility of the individual ICES member countries to actually
collect the data. Data is basically of two types: fishery-dependent (catches, discards, fishing
effort and sampling of commercial catches); and fishery-independent (research vessel surveys,
tagging data, stomach content analysis, estimation of mortality from disease or pollution etc).
Generally data on catch composition is collected by national statistical offices, while data on
fish age, size and maturity is provided by Governmental fisheries institutes.
Pooled data are analysed to obtain estimates of stock size, recruitment, and fishing
mortality, usually by Virtual (sometime called Sequential) Population Analysis (VPA), a
method first described by Gulland (1965). VPA can only be applied to a single stock and
takes no account of interactions between species. However, a multi-species version on VPA
(MSVPA) has been developed and is applied periodically to data on all exploited fish species
in the North Sea. There are problems with using the outputs of MSVPA to provide
management advice, but it is particularly useful for obtaining estimates of natural mortality
rates for key species.
3.1.1 Methods for estimating catch and population age structure VPA requires information on the number of fish in each age class that are removed by the
fishery each year. This information is obtained from market sampling, discard sampling and
surveys by research vessels.
Landings at fish markets are regularly sampled, and the lengths of a large sample of
the catch are measured. The age of a sub-sample of these fish, or of fish taken on research
cruises (see below), is estimated from examination of the growth rings in scales or otoliths
(ear bones). Otolith ageing is more difficult and time consuming than scale reading, so it is
less adaptable to fisheries wide sampling programs. These data are then used to develop and
age/length key which is used to convert the information on the length-structure of the catch
to age-structure information.
Some caught fish are never landed, but are discarded at sea. Discarding rates are
estimated by placing observers on selected fishing boats who record levels of discarding and
collect fish samples for routine analysis. This information is then used to scale up the
landings data to provide an estimate of total removals by the fishery, by species and age.
Information on recruitment is obtained from dedicated research cruises using nets
with mesh sizes that are smaller than the minimum size used by commercial vessels. These
catches provide information on the relative strengths of age-classes which have yet to be
21
recruited to the fishery, and can be used to estimate recruitment rates. These cruises also
provide additional information on abundance, which is used to calibrate the VPAs, and
information on the distribution of stocks.
3.1.2 Methods for estimating stock sizes and status There are two main approaches to stock assessments: VPA, using catch-at-age data; analysis
of catch-at-length data; and “uninvolved” estimates of biomass (e.g. from acoustic surveys).
VPA is the most widely used method and requires information on the numbers of fish
caught at each age on an individual cohort basis. The following two catch equations are then
solved:
Ny,a = exp (Zy,a).Ny+1,a+1
Cy,a = (Fy,a / Zy,a ).[exp(Zy,a)-1].Ny+1,a+1
Where Ny,a is the number of fish in age class a caught in year y; Zy,a is the total mortality
rate – made up of Ma, the natural mortality rate, and Fy,a, the fishing mortality rate; and Cy,a
is the total catch over the year. In principle, catch-at-length data could be analysed in the
same way. This would avoid the necessity to convert these data to catches-at-age, and the
biases and uncertainties that are associated with this transformation. However, the
development of length based abundance estimates is still in its infancy.
For species such as herring and blue whiting, which aggregate in large single species
shoals, abundance estimates over the distribution of the whole stock can be made from
acoustic surveys.
In addition to total stock biomass (TSB), it is also important to be able to estimate the
spawning stock biomass (SSB) - the abundance of reproductively-active fish. One way to
estimate this is to determine the total number of eggs produced in each season by sampling
surveys, and divide this figure by the average number of eggs per spawning female. This
estimate is then divided by the proportion of females in the adult population to give a total
number of spawning fish.
3.1.3 Methods for estimating diet Diet is usually estimated by examining the stomach contents of fish of different age classes,
collected from both commercial catches and from dedicated surveys. Attempts are made to
identify the contents to the lowest taxon level, and to determine the size of each prey item.
With some assumptions about the length of time it takes for prey to pass through the gut, it is
possible to estimate average meal size and therefore to determine the total quantity of each
prey species consumed by individual predators.
3.1.4 Methods for estimating and assigning mortality Estimating natural mortality rates is difficult for most wild populations. Traditionally, a
value of M=0.2 has been assumed in most VPAs. However, MSVPA has indicated that M
may be substantially higher than this for some age-classes. Attempts to partition M into
components due to predation and other factors, and the methods used for this, are described
later in the report.
22
3.2 Cod (Gadus morhua) 3.2.1 Brief life history The spawning period of cod varies with location being more prolonged in the Baltic than in
the North Sea. Around the UK and Ireland, spawning generally takes place between January
and April, whereas in the eastern and northern Baltic peak spawning occurs in June to July.
The average mature female carries about 500 eggs per g body weight, thus a 10 kg
fish would release about 5 million eggs The eggs (which are ~1.4mm in diameter) float to
the surface and are found over large areas. They hatch over a period of 2-3 weeks, at which
stage the larvae are ~0.4 cm in length. By the end of June they have grown to 2-8 cm. Young
cod live in the upper water layers until about August, when they move to the sea bed and
adopt a demersal way of life. At end of their first winter they are 13-26 cm in length, after
which they can grow rapidly and reach 80 cm by the time they are 4 years old. Young fish
are often found close inshore, but as they grow older they move offshore to join adult stocks.
3.2.2Maximum size Up to 150 cm (40 kg), but more usually 120 cm (11.3 kg).
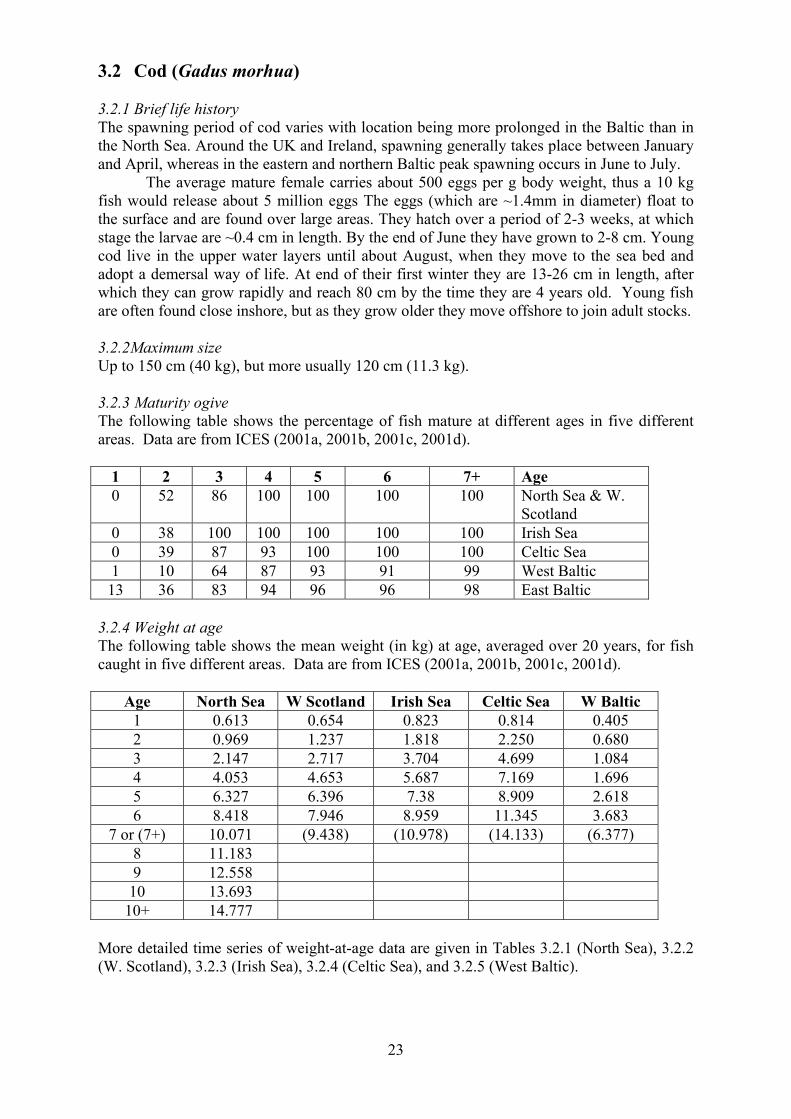
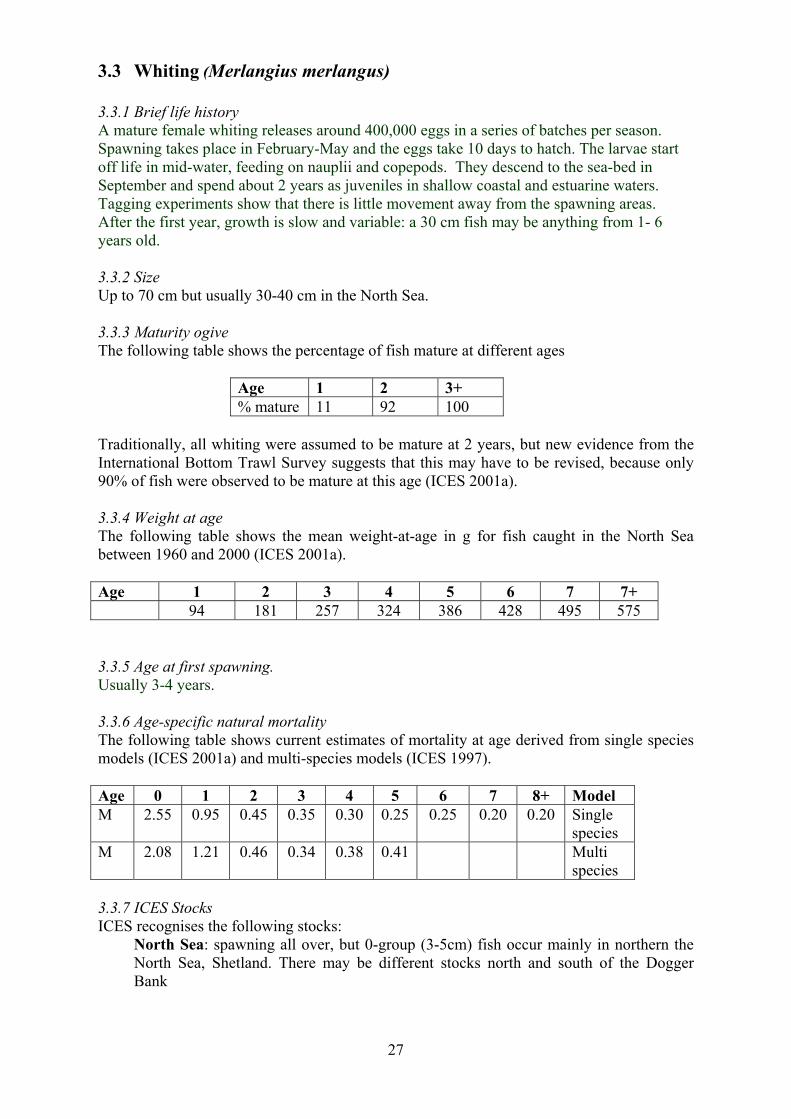
3.2.3 Maturity ogive The following table shows the percentage of fish mature at different ages in five different
areas. Data are from ICES (2001a, 2001b, 2001c, 2001d).
1 2 3 4 5 6 7+ Age 0 52 86 100 100 100 100 North Sea & W.
Scotland
0 38 100 100 100 100 100 Irish Sea
0 39 87 93 100 100 100 Celtic Sea
1 10 64 87 93 91 99 West Baltic
13 36 83 94 96 96 98 East Baltic
3.2.4 Weight at age The following table shows the mean weight (in kg) at age, averaged over 20 years, for fish
caught in five different areas. Data are from ICES (2001a, 2001b, 2001c, 2001d).
Age North Sea W Scotland Irish Sea Celtic Sea W Baltic
1 0.613 0.654 0.823 0.814 0.405
2 0.969 1.237 1.818 2.250 0.680
3 2.147 2.717 3.704 4.699 1.084
4 4.053 4.653 5.687 7.169 1.696
5 6.327 6.396 7.38 8.909 2.618
6 8.418 7.946 8.959 11.345 3.683
7 or (7+) 10.071 (9.438) (10.978) (14.133) (6.377)
8 11.183
9 12.558
10 13.693
10+ 14.777
More detailed time series of weight-at-age data are given in Tables 3.2.1 (North Sea), 3.2.2
(W. Scotland), 3.2.3 (Irish Sea), 3.2.4 (Celtic Sea), and 3.2.5 (West Baltic).
23
3.2.5 Age at first spawning. Small numbers of cod mature at age 2 years, but most do not spawn until they are 4-5 years
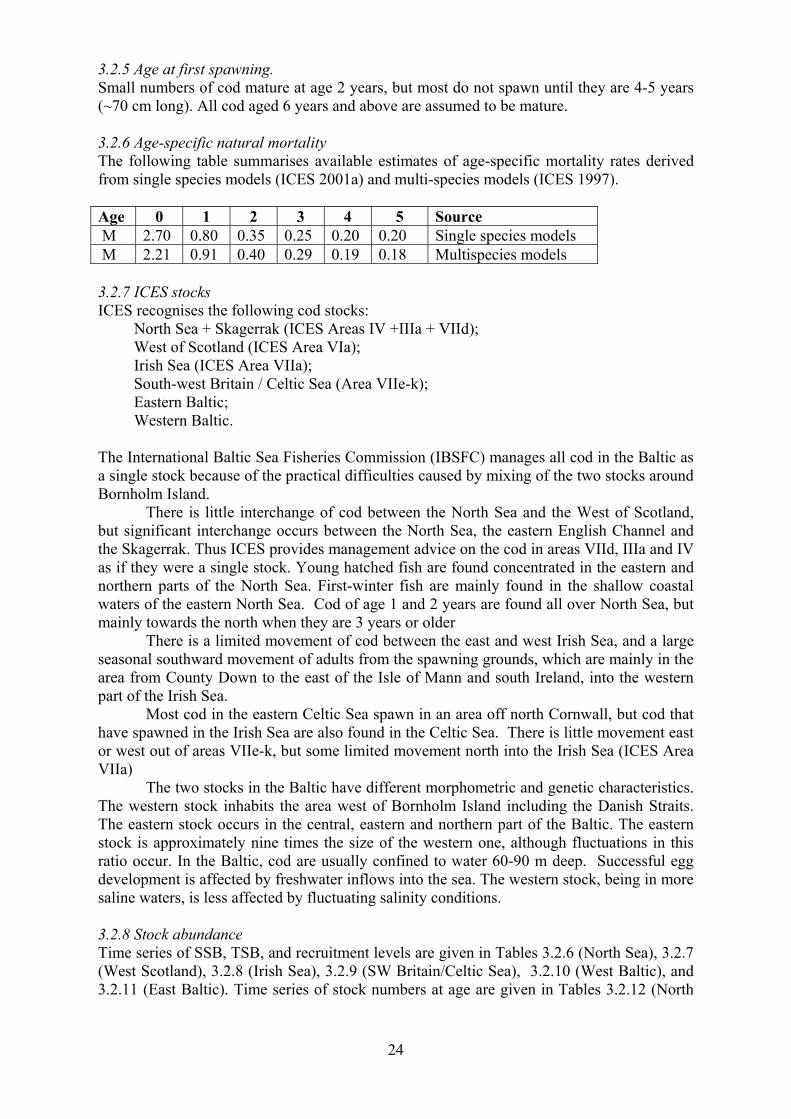
(~70 cm long). All cod aged 6 years and above are assumed to be mature. 3.2.6 Age-specific natural mortality The following table summarises available estimates of age-specific mortality rates derived
from single species models (ICES 2001a) and multi-species models (ICES 1997).
Age 0 1 2 3 4 5 Source M 2.70 0.80 0.35 0.25 0.20 0.20 Single species models
M 2.21 0.91 0.40 0.29 0.19 0.18 Multispecies models
3.2.7 ICES stocks ICES recognises the following cod stocks:
North Sea + Skagerrak (ICES Areas IV +IIIa + VIId);
West of Scotland (ICES Area VIa);
Irish Sea (ICES Area VIIa);
South-west Britain / Celtic Sea (Area VIIe-k);
Eastern Baltic;
Western Baltic.
The International Baltic Sea Fisheries Commission (IBSFC) manages all cod in the Baltic as
a single stock because of the practical difficulties caused by mixing of the two stocks around
Bornholm Island.
There is little interchange of cod between the North Sea and the West of Scotland,
but significant interchange occurs between the North Sea, the eastern English Channel and
the Skagerrak. Thus ICES provides management advice on the cod in areas VIId, IIIa and IV
as if they were a single stock. Young hatched fish are found concentrated in the eastern and
northern parts of the North Sea. First-winter fish are mainly found in the shallow coastal
waters of the eastern North Sea. Cod of age 1 and 2 years are found all over North Sea, but
mainly towards the north when they are 3 years or older
There is a limited movement of cod between the east and west Irish Sea, and a large
seasonal southward movement of adults from the spawning grounds, which are mainly in the
area from County Down to the east of the Isle of Mann and south Ireland, into the western
part of the Irish Sea.
Most cod in the eastern Celtic Sea spawn in an area off north Cornwall, but cod that
have spawned in the Irish Sea are also found in the Celtic Sea. There is little movement east
or west out of areas VIIe-k, but some limited movement north into the Irish Sea (ICES Area
VIIa)
The two stocks in the Baltic have different morphometric and genetic characteristics.
The western stock inhabits the area west of Bornholm Island including the Danish Straits.
The eastern stock occurs in the central, eastern and northern part of the Baltic. The eastern
stock is approximately nine times the size of the western one, although fluctuations in this
ratio occur. In the Baltic, cod are usually confined to water 60-90 m deep. Successful egg
development is affected by freshwater inflows into the sea. The western stock, being in more
saline waters, is less affected by fluctuating salinity conditions.
3.2.8 Stock abundance Time series of SSB, TSB, and recruitment levels are given in Tables 3.2.6 (North Sea), 3.2.7
(West Scotland), 3.2.8 (Irish Sea), 3.2.9 (SW Britain/Celtic Sea), 3.2.10 (West Baltic), and
3.2.11 (East Baltic). Time series of stock numbers at age are given in Tables 3.2.12 (North
24
Sea), 3.2.13 (West Scotland), 3.2.14 (Irish Sea), 3.2.15 (West Baltic), and 3.2.16 (East
Baltic).
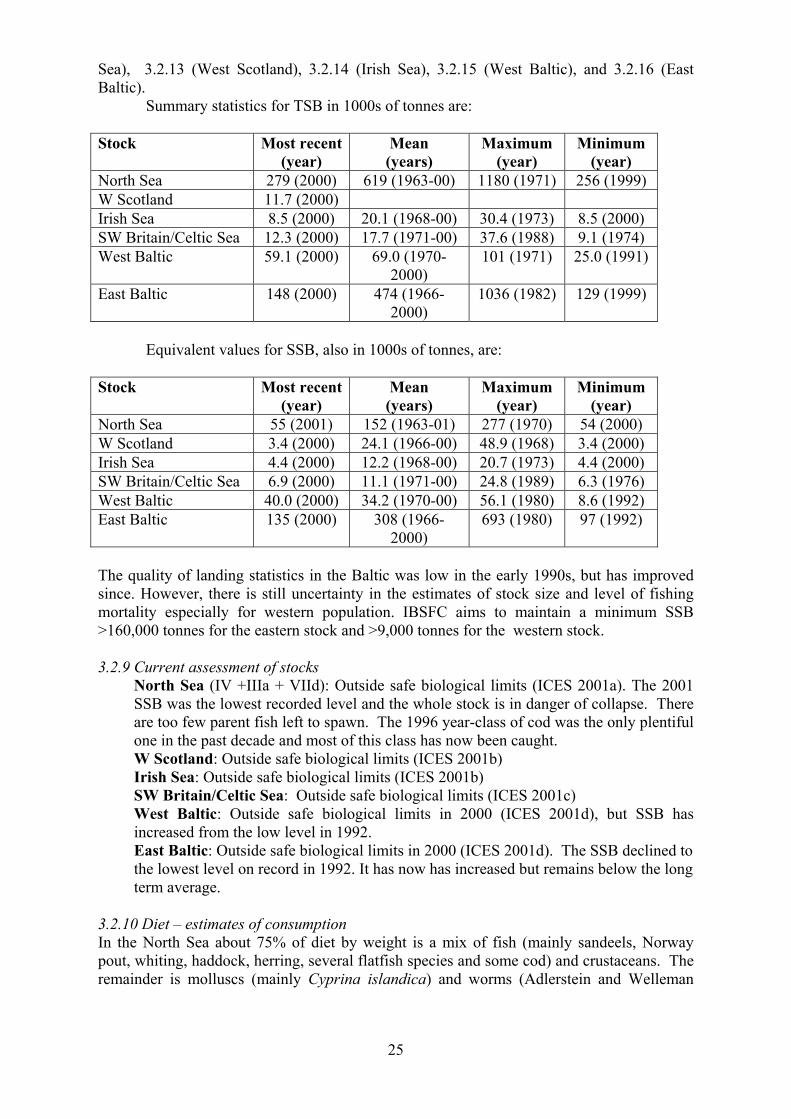
Summary statistics for TSB in 1000s of tonnes are:
Stock Most recent(year)
Mean (years)
Maximum (year)
Minimum (year)
North Sea 279 (2000) 619 (1963-00) 1180 (1971) 256 (1999)
3.3.9 Current assessment of stocks North Sea: Outside safe biological limits in 2000. The SSB declined in successive
years from 1993 to 1998, but has recovered somewhat since then.
Celtic Sea: Inside safe biological limits. SSB is above long term average. Fishing
mortality declined until 1997 and has since increased slightly. Recruitment has been
below average since 1994.
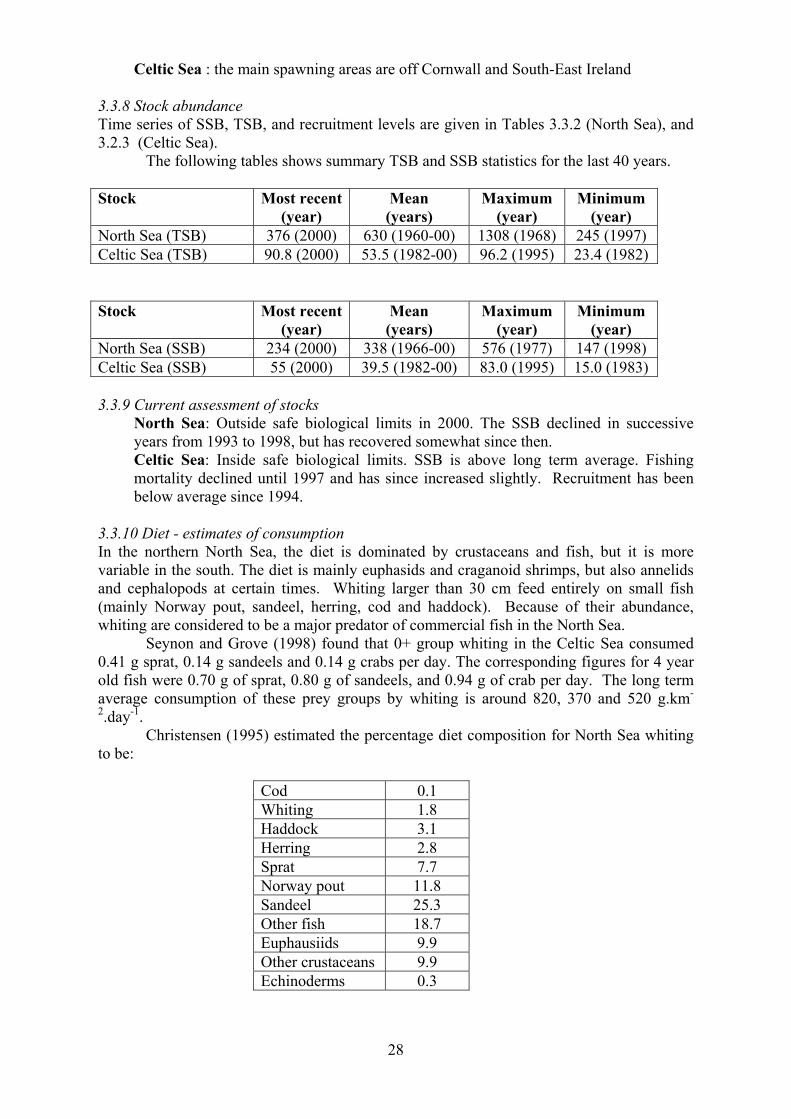
3.3.10 Diet - estimates of consumption In the northern North Sea, the diet is dominated by crustaceans and fish, but it is more
variable in the south. The diet is mainly euphasids and craganoid shrimps, but also annelids
and cephalopods at certain times. Whiting larger than 30 cm feed entirely on small fish
(mainly Norway pout, sandeel, herring, cod and haddock). Because of their abundance,
whiting are considered to be a major predator of commercial fish in the North Sea.
Seynon and Grove (1998) found that 0+ group whiting in the Celtic Sea consumed
0.41 g sprat, 0.14 g sandeels and 0.14 g crabs per day. The corresponding figures for 4 year
old fish were 0.70 g of sprat, 0.80 g of sandeels, and 0.94 g of crab per day. The long term
average consumption of these prey groups by whiting is around 820, 370 and 520 g.km-
2.day
-1.
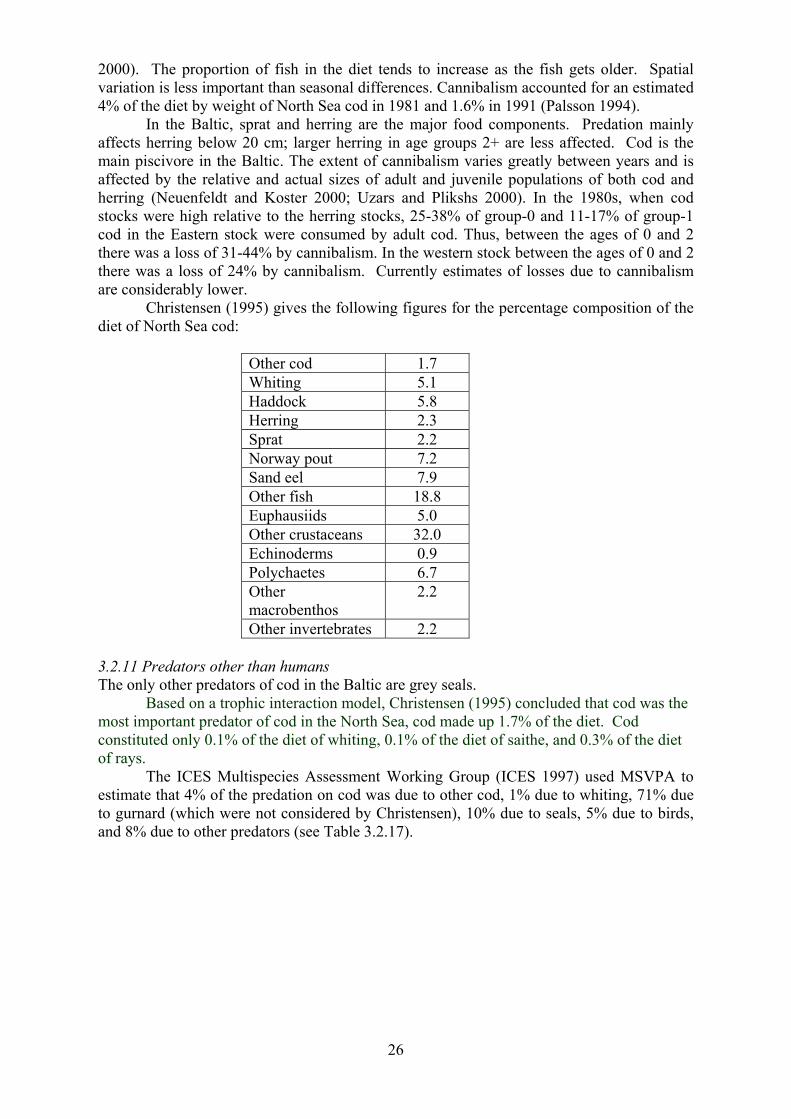
Christensen (1995) estimated the percentage diet composition for North Sea whiting
to be:
Cod 0.1
Whiting 1.8
Haddock 3.1
Herring 2.8
Sprat 7.7
Norway pout 11.8
Sandeel 25.3
Other fish 18.7
Euphausiids 9.9
Other crustaceans 9.9
Echinoderms 0.3
28
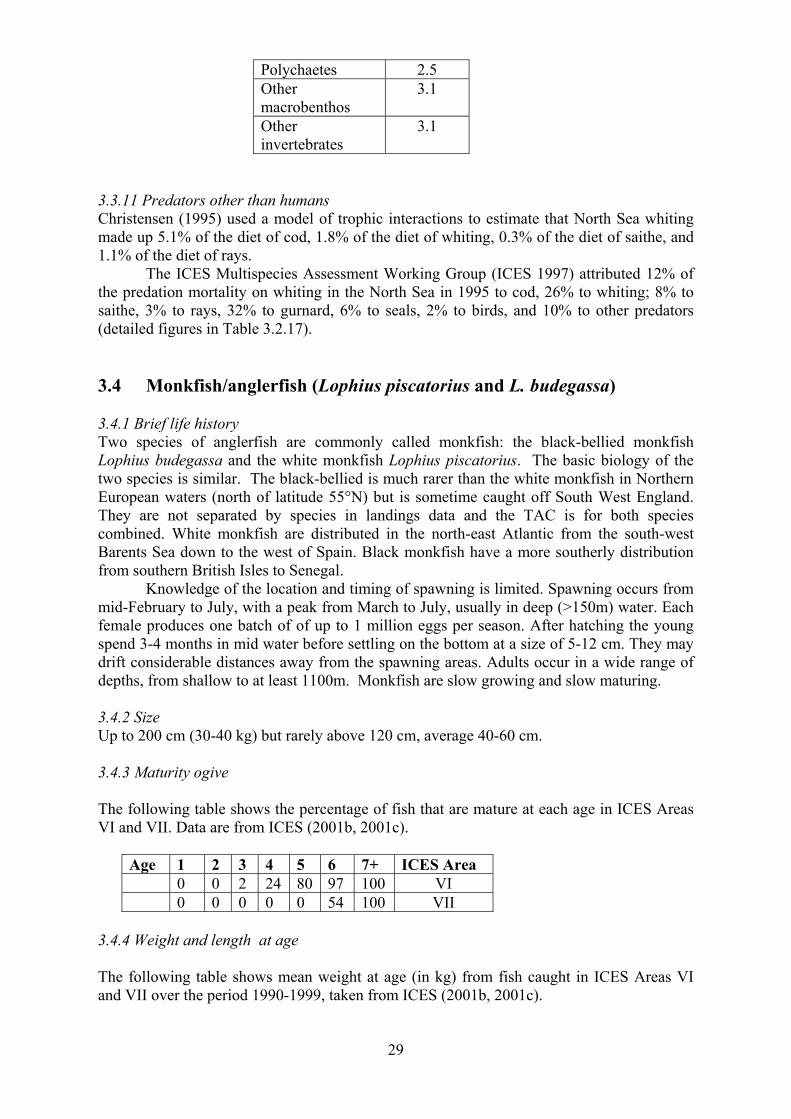
Polychaetes 2.5
Other
macrobenthos
3.1
Other
invertebrates
3.1
3.3.11 Predators other than humans Christensen (1995) used a model of trophic interactions to estimate that North Sea whiting
made up 5.1% of the diet of cod, 1.8% of the diet of whiting, 0.3% of the diet of saithe, and
1.1% of the diet of rays.
The ICES Multispecies Assessment Working Group (ICES 1997) attributed 12% of
the predation mortality on whiting in the North Sea in 1995 to cod, 26% to whiting; 8% to
saithe, 3% to rays, 32% to gurnard, 6% to seals, 2% to birds, and 10% to other predators
(detailed figures in Table 3.2.17).
3.4 Monkfish/anglerfish (Lophius piscatorius and L. budegassa) 3.4.1 Brief life history Two species of anglerfish are commonly called monkfish: the black-bellied monkfish
Lophius budegassa and the white monkfish Lophius piscatorius. The basic biology of the
two species is similar. The black-bellied is much rarer than the white monkfish in Northern
European waters (north of latitude 55°N) but is sometime caught off South West England.
They are not separated by species in landings data and the TAC is for both species
combined. White monkfish are distributed in the north-east Atlantic from the south-west
Barents Sea down to the west of Spain. Black monkfish have a more southerly distribution
from southern British Isles to Senegal.
Knowledge of the location and timing of spawning is limited. Spawning occurs from
mid-February to July, with a peak from March to July, usually in deep (>150m) water. Each
female produces one batch of of up to 1 million eggs per season. After hatching the young
spend 3-4 months in mid water before settling on the bottom at a size of 5-12 cm. They may
drift considerable distances away from the spawning areas. Adults occur in a wide range of
depths, from shallow to at least 1100m. Monkfish are slow growing and slow maturing.
3.4.2 Size Up to 200 cm (30-40 kg) but rarely above 120 cm, average 40-60 cm.
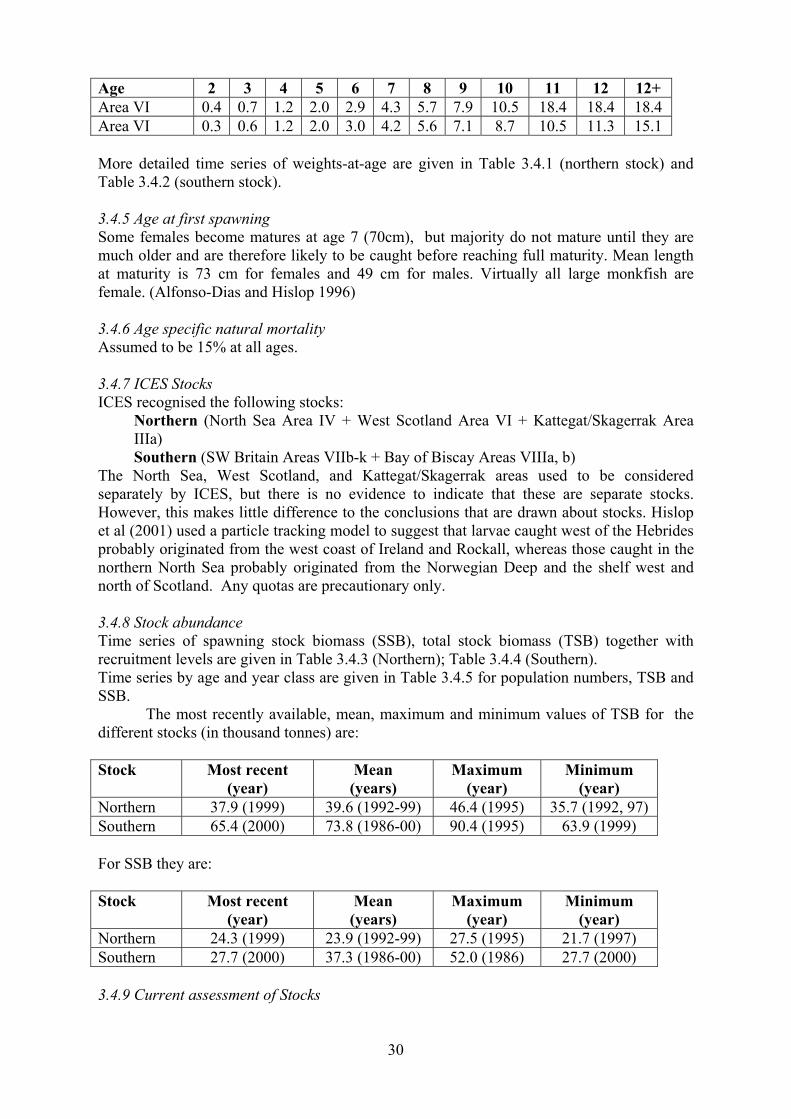
3.4.3 Maturity ogive The following table shows the percentage of fish that are mature at each age in ICES Areas
VI and VII. Data are from ICES (2001b, 2001c).
Age 1 2 3 4 5 6 7+ ICES Area 0 0 2 24 80 97 100 VI
0 0 0 0 0 54 100 VII
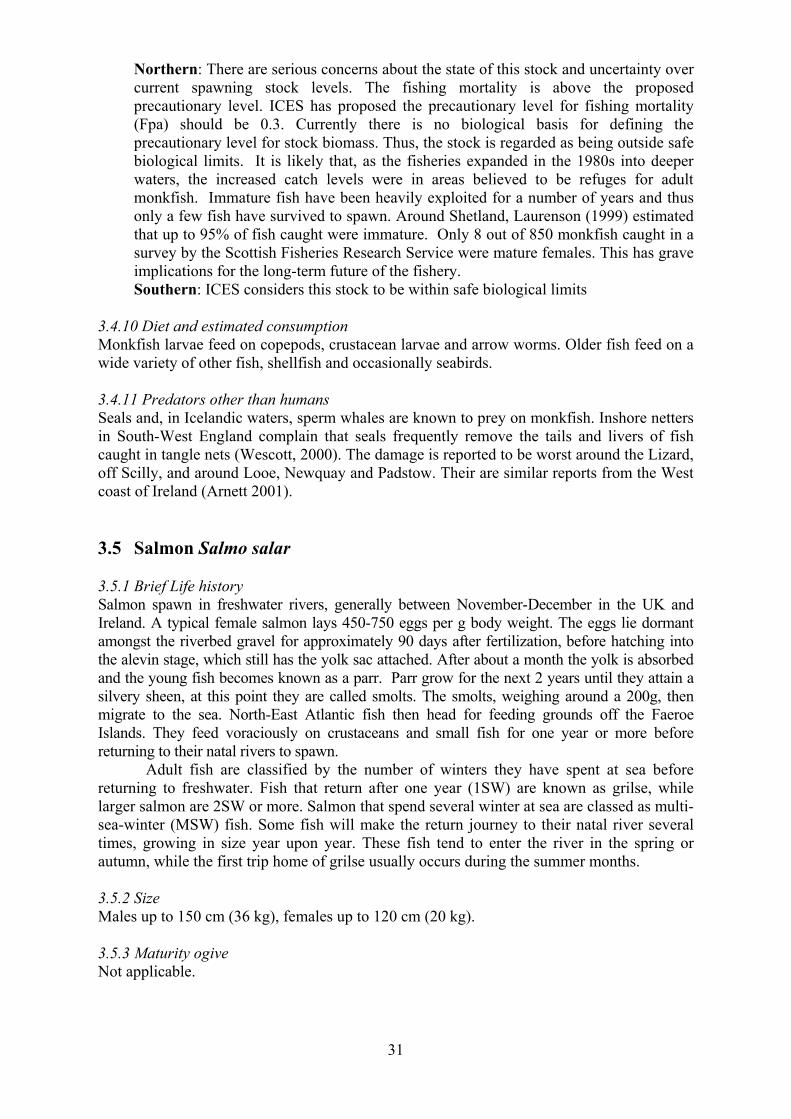
3.4.4 Weight and length at age
The following table shows mean weight at age (in kg) from fish caught in ICES Areas VI
and VII over the period 1990-1999, taken from ICES (2001b, 2001c).
29
Age 2 3 4 5 6 7 8 9 10 11 12 12+ Area VI 0.4 0.7 1.2 2.0 2.9 4.3 5.7 7.9 10.5 18.4 18.4 18.4
Area VI 0.3 0.6 1.2 2.0 3.0 4.2 5.6 7.1 8.7 10.5 11.3 15.1
More detailed time series of weights-at-age are given in Table 3.4.1 (northern stock) and
Table 3.4.2 (southern stock).
3.4.5 Age at first spawning Some females become matures at age 7 (70cm), but majority do not mature until they are
much older and are therefore likely to be caught before reaching full maturity. Mean length
at maturity is 73 cm for females and 49 cm for males. Virtually all large monkfish are
female. (Alfonso-Dias and Hislop 1996)
3.4.6 Age specific natural mortality Assumed to be 15% at all ages.
3.4.7 ICES Stocks ICES recognised the following stocks:
Northern (North Sea Area IV + West Scotland Area VI + Kattegat/Skagerrak Area
IIIa)
Southern (SW Britain Areas VIIb-k + Bay of Biscay Areas VIIIa, b)
The North Sea, West Scotland, and Kattegat/Skagerrak areas used to be considered
separately by ICES, but there is no evidence to indicate that these are separate stocks.
However, this makes little difference to the conclusions that are drawn about stocks. Hislop
et al (2001) used a particle tracking model to suggest that larvae caught west of the Hebrides
probably originated from the west coast of Ireland and Rockall, whereas those caught in the
northern North Sea probably originated from the Norwegian Deep and the shelf west and
north of Scotland. Any quotas are precautionary only.
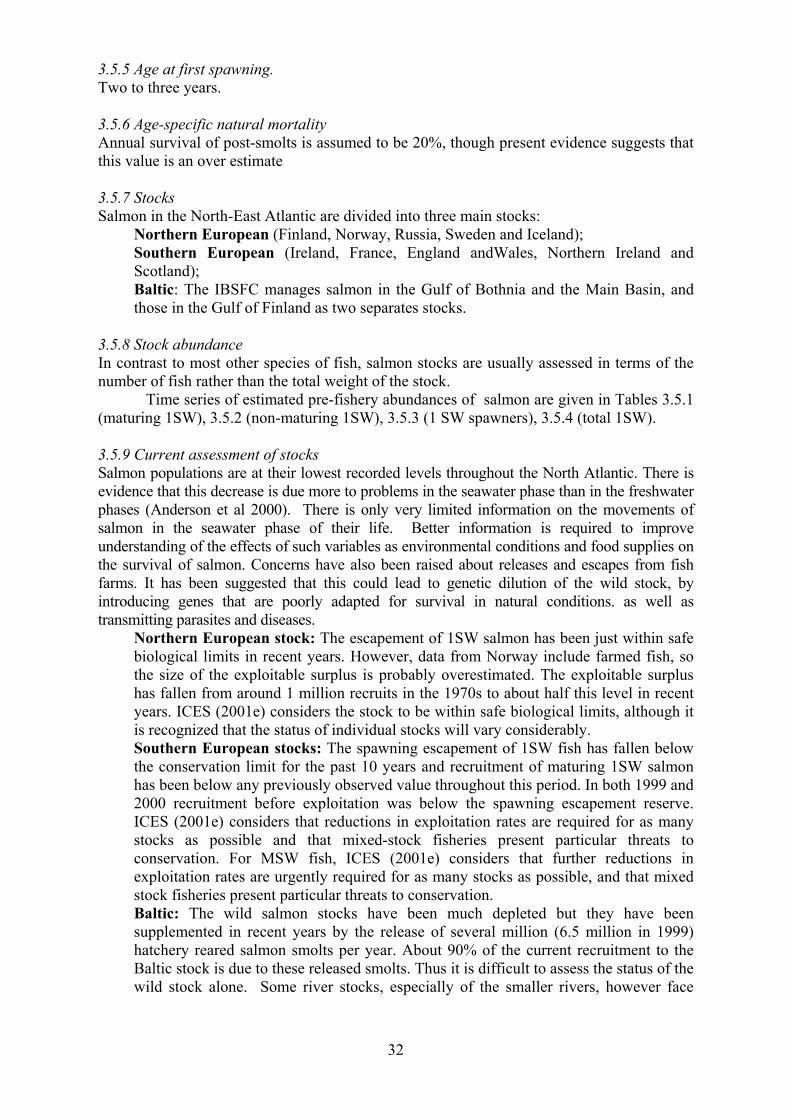
3.4.8 Stock abundance Time series of spawning stock biomass (SSB), total stock biomass (TSB) together with
recruitment levels are given in Table 3.4.3 (Northern); Table 3.4.4 (Southern).
Time series by age and year class are given in Table 3.4.5 for population numbers, TSB and
SSB.
The most recently available, mean, maximum and minimum values of TSB for the
3.7.9 Current assessment of stocks North Sea: outside safe biological limits.
West Scotland: outside safe biological limits. The SSB for 2000 was below the
precautionary level of 30000 t. Recruitment has been below average since 1995, but
was high in 2000.
3.7.10 Diet - estimates of consumption Haddock larvae feed on immature copepods. 0-group fish (3-14 cm long) feed on euphasiids,
appendicularians, decapod larvae, copepods and fish. When the juveniles become demersal
they still feed on pelagic organisms but also on slow-moving invertebrates. Larger fish feed
on sand eels, Norway pout, long-rough dab, gobies, sprat and herring. Haddock tend to feed
in shoals. The diet varies with season, fish size and location. The main diet of all haddock in
winter is worms, molluscs, urchins and brittle stars. Fish prey become more important in
spring and summer. Near to the Scottish coast and in the central North Sea, sand eels are the
preferred prey whereas Norway pout is preferred in more northern areas. During the herring
spawning season herring eggs are heavily predated by haddock.
36
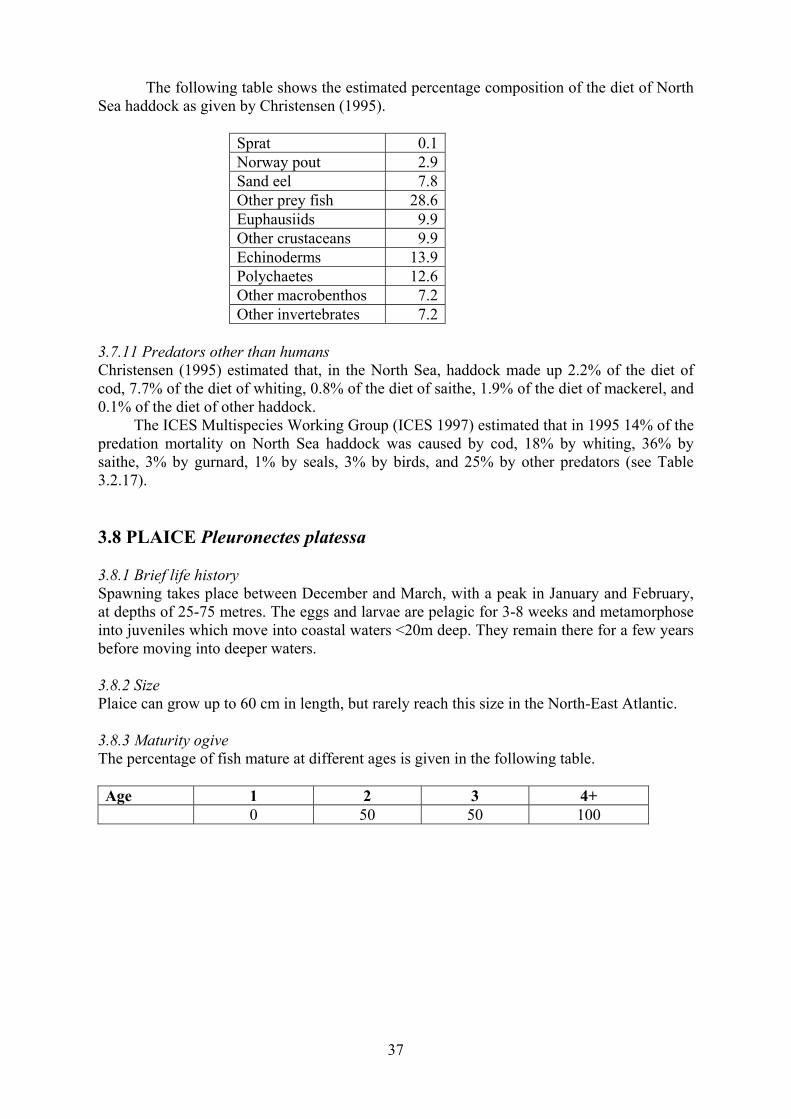
The following table shows the estimated percentage composition of the diet of North
Sea haddock as given by Christensen (1995).
Sprat 0.1
Norway pout 2.9
Sand eel 7.8
Other prey fish 28.6
Euphausiids 9.9
Other crustaceans 9.9
Echinoderms 13.9
Polychaetes 12.6
Other macrobenthos 7.2
Other invertebrates 7.2
3.7.11 Predators other than humans Christensen (1995) estimated that, in the North Sea, haddock made up 2.2% of the diet of
cod, 7.7% of the diet of whiting, 0.8% of the diet of saithe, 1.9% of the diet of mackerel, and
0.1% of the diet of other haddock.
The ICES Multispecies Working Group (ICES 1997) estimated that in 1995 14% of the
predation mortality on North Sea haddock was caused by cod, 18% by whiting, 36% by
saithe, 3% by gurnard, 1% by seals, 3% by birds, and 25% by other predators (see Table
3.2.17).
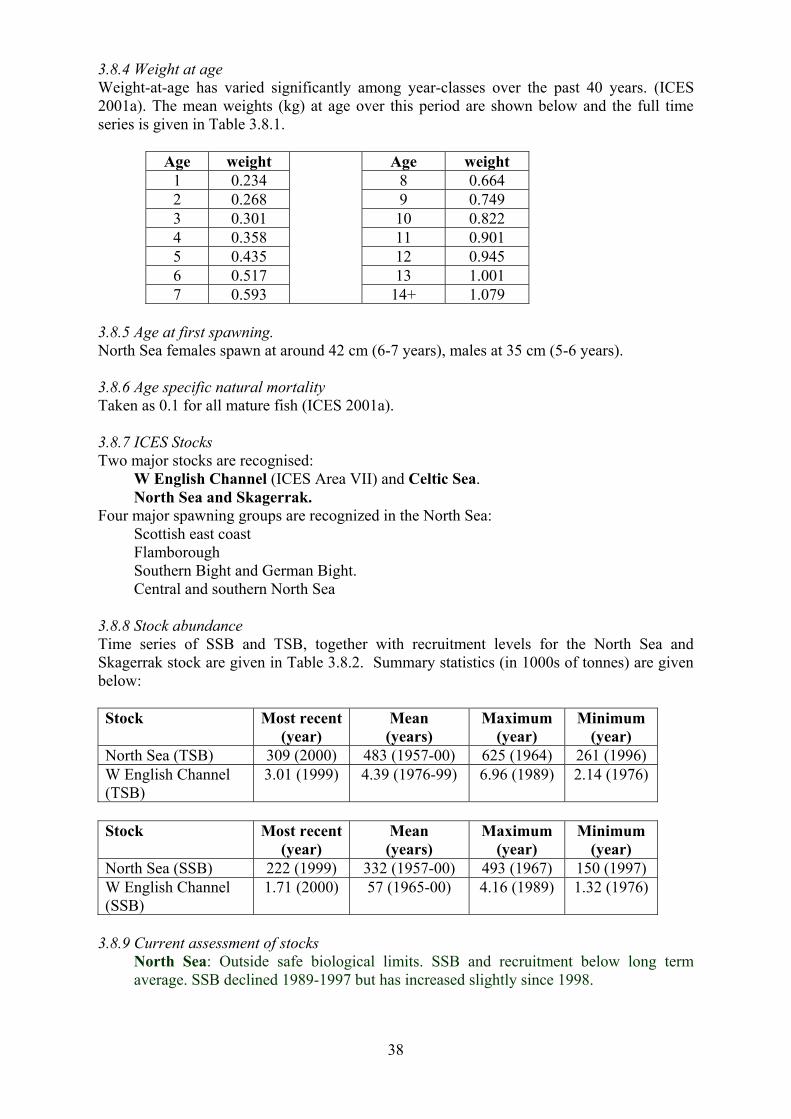
3.8 PLAICE Pleuronectes platessa 3.8.1 Brief life history Spawning takes place between December and March, with a peak in January and February,
at depths of 25-75 metres. The eggs and larvae are pelagic for 3-8 weeks and metamorphose
into juveniles which move into coastal waters <20m deep. They remain there for a few years
before moving into deeper waters.
3.8.2 Size Plaice can grow up to 60 cm in length, but rarely reach this size in the North-East Atlantic.
3.8.3 Maturity ogive The percentage of fish mature at different ages is given in the following table.
Age 1 2 3 4+ 0 50 50 100
37
3.8.4 Weight at age Weight-at-age has varied significantly among year-classes over the past 40 years. (ICES
2001a). The mean weights (kg) at age over this period are shown below and the full time
series is given in Table 3.8.1.
Age weight Age weight
1 0.234 8 0.664
2 0.268 9 0.749
3 0.301 10 0.822
4 0.358 11 0.901
5 0.435 12 0.945
6 0.517 13 1.001
7 0.593
14+ 1.079
3.8.5 Age at first spawning. North Sea females spawn at around 42 cm (6-7 years), males at 35 cm (5-6 years). 3.8.6 Age specific natural mortality Taken as 0.1 for all mature fish (ICES 2001a).
3.8.7 ICES Stocks Two major stocks are recognised:
W English Channel (ICES Area VII) and Celtic Sea.
North Sea and Skagerrak. Four major spawning groups are recognized in the North Sea:
Scottish east coast
Flamborough
Southern Bight and German Bight.
Central and southern North Sea
3.8.8 Stock abundance Time series of SSB and TSB, together with recruitment levels for the North Sea and
Skagerrak stock are given in Table 3.8.2. Summary statistics (in 1000s of tonnes) are given
3.9.9 Current assessment of stocks North Sea: No designated stock status, but the stock is harvested above the
recommended levels of fishing mortality (0.2 for adults and <0.1 for juveniles)..
Baltic : within safe biological limits.
3.9.10 Diet - estimates of consumption Larval herring feed on plankton, mainly diatoms and flagellates, but also on the eggs and
young of copepods. The diet of post-larval herring consists mainly of small copepods
(Calanus, Temora, Microcalanus). First year herring mainly eat Calanus, mysid shrimps,
various eggs and larvae, and young fish (principally sandeels). Adults have a varied diet of
copepods, other crustacea (amphipods, euphasiids and mysid shrimps), young sandeels,
gobies, whiting, herring, flatfishes and some invertebrates.
In the North Sea, Christensen (1995) estimated percentage composition of the diet to
be:
Juvenile prey fish 11.1
Copepods 20.1
Euphausiids 57.5
Other crustaceans 11.3
In the Baltic the diet is mainly zooplankton and appears to have changed since the mid-
1980s. The proportion of macrobenthos (mainly mysids Mysidacrea) and Pseudocalanus has
decreased considerably, and the diet of herring has become more similar to that of sprat (see
below). Thus, there is now increased competition between these two species. The present
diet consists mainly of copepods (Temora longicornis, Acartia spp) and the cladocera
Bosmiona longispina. In some years there is considerable consumption of cod eggs, but cod
larvae are rarely eaten (Koster and Mollman 2000) 3.9.11 Predators other than humans Christensen (1995) estimated that North Sea herring made up 7.2% of the diet of cod, 11.8%
of the diet of whiting, 46.5%, of the diet of saithe 3.1% of the diet of mackerel, and 2.9% of
the diet of haddock. The ICES Multispecies Working Group (ICES 1997) calculated that
12% of the predation mortality on herring in 1995 was caused by cod, 33% by whiting, 14%
by saithe, 19% by mackerel, 2% by rays, 2% by birds and 15% by other predators (see Table
41
3.2.17).
The main predators of herring <20 cm in the Baltic are seals and cod. Levels of cod
predation depend on the size of the stock, which is currently low.
3.10 SPRAT Sprattus sprattus 3.10.1 Brief Life history Sprat are a small coastal species, usually found in large shoals in shallow water. During the
winter it migrates inshore. Spawning occurs in spring and summer but can occur as early as
January in the English Channel. It takes place in the open sea or near coastal slopes, mostly
at depths of 10-20 m. Individual fish produce 6,000-10,000 eggs. The eggs float at the
surface or in mid-water. They take 3-4 days to hatch after which the larvae drift inshore and
the young fish stay in shallow water, often joining up with young herring. They are tolerant
of freshwater and may even move into rivers. Mixed shoals are known as whitebait. During
daytime shoals tend to stay close to the sea bottom, but at night they rise to the surface
3.10.2 Size Sprat rarely grow larger than 15 cm.
3.10.3 Maturity ogive The percentage of fish mature at age in the Baltic between 1997 and 1998 (taken from ICES
2001d) are
Age 1 2 3 4 5 6 7 8 32 91 97 97 98 99 98 97
3.10.4 Weight at age Rarely grows larger than 15 cm, usually 11-12 cm at age 1, 13-14 at age 2 and 15 at 4 years.
3.10.5 Age at first spawning. Occasionally spawns in the first year of life but usually in the second.
3.10.6 Age specific natural mortality Assumed to be 0.2 (ICES 2001d), but likely to be lower in years when cod abundance is low.
3.10.7 ICES Stocks North Sea (ICES Areas IV and IIa): Mainly inshore, but unevenly distributed.
Principal spawning areas are the southeastern North Sea and Skagerrak.
Baltic : Sprats here are recognised as a separate sub-species Sprattus sprattus balticus
3.10.8 Stock abundance Time series of SSB, TSB and recruitment levels are given in Table 3.10.1 (Baltic Sea). Total
biomass in the North Sea in 2001 was estimated at 342,000 tonnes, in the Kattegat/Skagerrak
it was estimated to be 2,000 tonnes. Total biomass in the Baltic in 2000 was estimated at
1,749,000 tonnes.
3.10.9 Current assessment of stocks North Sea: Stock biomass is high, but the fishery is to be limited in order to reduced
bycatch of herring.
Baltic : The SSB is well above the long-term average due to strong recruitment and
42
low predation and hence can sustain high fishing mortality. 3.10.10 Diet - estimates of consumption Young fish feed on diatoms, and eggs and young of copepods. Christensen (1995) estimated
that the diet of adults in the North Sea was made up of 70% copepods (Calanus, Pseudocalanus, Temora), and 30% Euphausids.
In the Baltic the diet is mainly planktonic crustacea and benthos, mostly copepods
(Temora longicornis, Acartia spp, the cladoceran Bosmiona longispina, and other small
crustacea). Diet varies with season and prey abundance. In some years there is considerable
consumption of cod eggs, but rarely of cod larvae (Koster and Mollman 2000).
3.10.11 Other predators Cod, salmon and grey and harbour seals are known to prey on sprats. Christensen (1995)
calculated that North Sea sprat make up 8% of the diet of cod, 25% of the diet of whiting,
5% of the diet of saithe, 19% of the diet of mackerel, and 8% of the diet of haddock.
3.5 SANDEELS Ammodytidae 3.11.1 Brief life history Five species of sandeel are found in the North Sea, although most commercial landings are
of the lesser sandeel Ammodytes marinus. Sandeels are a shoaling fish that hunt for prey in
mid-water during the day and stay buried in the sand during the night. Spawning takes place
mainly between November and February. The eggs are deposited as sticky clumps onto
suitable sandy areas of the sea-bottom throughout much of the southern and central North
Sea, but especially off the coasts of Denmark, northeastern England, eastern Scotland, and
the Orkney Islands. After hatching, the larvae become planktonic and are liable to be
transported to other areas by prevailing currents , resulting in a potentially wide distribution.
The larvae metamorphose into juveniles, which migrate to suitable sandy areas where they
settle and tend to remain. They burrow into, and over-winter in, the sandy substrate.
Tagging experiments have shown that there is little movement between spawning and
feeding grounds, indicating that fishing and spawning grounds may coincide.
3.11.2 Size The lesser sandeel grows to 20 cm whereas the greater sandeel grows to 33 cm.
3.11.3 Maturity ogive The percentage of fish mature at age (taken from ICES 2001a) are:
Age 0 1 2 3 4+ 0 0 100 100 100
3.11.4 Weight at age Values for weight at age (in g) in 2000 provided by ICES (2001a) are
Age 0 1 2 3 4+ Jan-June - 6.40 8.57 13.30 17.03
July-Dec 1.66 7.56 14.29 15.96 18.87
43
3.11.5 Age at first spawning. Most fish spawn at two years of age.
3.11.6 Age specific natural mortality Values for age-specific natural mortality (M) derived from single species and multispecies
models (ICES 1997) are:
Age 0 1 2 3 4 5 M 1.60 1.20 0.60 0.60 0.60 0.60 Single species
M 1.43 1.43 0.75 0.91 0.82 1.08 Multispecies
ICES (2001a) provided the following figures for seasonal mortality-at-age:
Age 0 1 1 2+ 2+ Season July-Dec Jan-Jun July-Dec Jan-Jun July-Dec
M 0.8 1.0 0.2 0.4 0.2
3.11.7 ICES Stocks Once past the juvenile life-stage sandeels move very little, and so stock structure is regarded as
being a complex of local populations. Until 1995, the European continental shelf was divided
into four regions for assessment: Skagerrak (ICES Area IIIa), northern North Sea, southern
North Sea and Shetland Isles. Since 1995 the two North Sea stocks have been regarded as a
single stock even though this has little biological basis. Wright (1998) has suggested that the
North Sea should be divided into three stocks: the region north of 55° 30’; the region south of
55° 30’ and west of 4°E; and the region south of 55° 30’ and east of 4°E
3.11.8 Stock abundance Time series of SSB, TSB and recruitment levels are given in Table 3.11.1 for the North Sea
and Skagerrak. North Sea TSB in 2000 was estimated to be 3,086,000 tonnes, and SSB as
707,000 tonnes. Mean TSB for the period 1976-2000 was 1,934,000 tonnes, and mean SSB
889,000 tonnes.
3.11.9 Current assessment of stocks North Sea: within safe biological limits.
Shetland: safe biological limits have not been defined for this stock. Survey data
suggests that the 2000 SSB is close to the lowest observed value and that recent
recruitment has been weak. However, fishing mortality appears to be well below
natural mortality.
3.11.10 Predators other than humans Sandeels are important prey for many marine predators such as mackerel, whiting, cod,
salmon, seabirds and seals. Whiting feed largely on 0-group sandeels, particularly between
April and June. The ICES Multispecies Working Group (ICES 1997) estimated that 2% of
the predation mortality on North Sea sandeels was due to cod, 22% due to whiting, 3% due
to saithe, 39% due to mackerel, 6% due to haddock, 3% due to rays, 8% due to birds, and
12% due to other predators (including seals) (see Table 3.2.17).
44
45
46
47
48
49
50
51
52
53
54
55
56
57
58
59
60
61
62
63
64
65
66
67
68
69
70
71
72
73
74
75
76
77
78
79
80
81
82
83
84
Fig 3.1 Location of ICES Fishing Areas
85
Fig 3.2 Location of Baltic Fisheries Management Division
86
4. Fisheries data 4.1 Introduction Most stock production models require accurate catch data; ideally these data should be age
specific, totalled over fleets and nations, and be available for a series of years.
4.1.1 Nature of the fisheries considered Fisheries in the North-East Atlantic can be classified into demersal and pelagic fisheries, and
into fisheries that catch fish for human consumption and industrial fisheries that catch fish
for such purposes as the manufacture of fishmeal or fish oil. The demersal fisheries usually
target mixtures of round fish (e.g. cod, whiting, and haddock) or flatfish (e.g. plaice). Pelagic
fisheries tend to target herring or mackerel; these fish may be used both for human food and
industrial purposes. Industrial fisheries usually target sandeels, sprat and Norway pout, but
they may also by catch other species.
A wide variety of fishing gears is used by these fisheries e.g. otter trawls, seines,
gillnets, beam trawls, pair trawls, pelagic trawls and purse seines.
4.1.2 Estimating landings and total catch Official landings at fish markets are regularly recorded and monitored. Nominal catches are
reported by national statistical offices. Usually the statistics are provided as annual landings
classified by ICES subdivisions. However some catches are misreported or not-reported due
to caught fish being landed unofficially or discarded because quota limits have been
exceeded or because the catch has no commercial value. If these unrecorded catches are
unaccounted for it would lead to biased estimates of biomass and TACs. Therefore
estimates have to be made of their levels.
4.1.3 Estimating rates of discard and bycatch Information can be obtained from fisheries logbooks, interviews with fishermen and by
periodic surveys by sending out observers onto certain fishing boats. An international
programme, funded by the EU, to collect data on sampling discards has been running in the
Baltic since 1996. Data on discards is only used in a few single-species stock assessments,
but for multi-species stock assessments estimates of all discards need to be included.
Discarding is particularly common in trawl fisheries and most discards are small fish.
Hence expressing discard rates by number will represent a larger proportion of the total catch
than expressing rates by weight. 4.2 COD Gadus morhua
4.2.1 Total Allowable Catch (TAC) in tonnes
Area 2000 2001 I 13494 395000
IIIa-Skaggerak 11600 7000
IIIa-Kattegat 7000 6200
IIIb-d 105000 105000
IIId(Estonia) 105000 105000
IIId(Latvia) 105000 105000
]IIId(Lithuania) 105000 105000
IIA,IV 81000 48600
Vb,VI,XII,XIV 7480 3700
87
VIIa 2100 2100
VIIb-K,VIII,IX,X 16000 10500
Total 663674 893100
4.2.2 Minimum landing size 35 cm in all EU areas apart from IIIa (Kattegat/ Skaggerak) where it is 30 cm. In Norwegian
waters the minimum size is 40cm.
4.2.3 Minimum mesh size 100 cm for towed gear when targeting cod. 70 cm (with an 80 mm square mesh panel) for
bycatches of cod in the Nephrops industry. 80 cm for bycatches of cod in the beam trawl
fishery for sole. 120 mm for fixed nets.
From 1 January 2002 the minimum mesh size for towed gear and beam trawlers
targeting demersal species in the North Sea will increase to 120 mm. 4.2.4 Fisheries Cod is a key demersal species for many fisheries.
In the North Sea (ICES Area IV) Cod is usually caught by mixed fisheries together
with haddock and whiting, mainly by otter trawl and gill net vessels. The gill netters are
better able to target their catch to cod alone. Cod is also an important bycatch in beam
trawlers targeting plaice and sole, and in otter trawl fisheries targeting prawns (Nephrops).
In the West of Scotland (ICES Area VIa) large numbers of cod are removed each year
before they reach maturity by bottom trawl gear in both inshore ands offshore areas. In the
Irish Sea (ICES Area VIIa) cod are caught all year round in mixed fisheries, mainly by
whitefish otter trawlers operating from UK and Irish ports, and French and UK pelagic
trawlers. There is also some bycatch in Nephrops and flatfish fisheries. In the Celtic Sea cod
are taken in mixed trawl fisheries (France 68%, Ireland 19%, England andWales 9%,
Belgium 4%). In the Baltic cod are caught by demersal trawls, high opening trawls (both
pelagic and demersal) and gillnets. There has been increasing use of gillnets and they now
account for up to 50% of the total catch of cod. Cod is the most important commercially
caught fish in the Baltic.
4.2.6 Time series of catches Time series of catches are shown in Tables 3.2.6 (North Sea 1963-2000), Table 3.2.7 (West
2000), Table 3.2.10 (West Baltic 1970-1999), and Table 3.2.11 (East Baltic 1966-1999).
Over these time periods, average landings (in 1000s of tonnes) have been:
Area Average Maximum Minimum North Sea 200 354 (1972) 71 (2000) West Scotland 14.8 24.3 (1968) 3.1 (2000) Irish Sea 8.9 14.9 (1981) 2.2 (2000) Celtic Sea 8.8 20.3 (1989) 2.9 (1974) West Baltic 38.7 54.4 (1973) 16.7 (1991) East Baltic 179 392 (1984) 45 (1993)
4.2.6 Total quantities caught and levels of discard Total catches of cod in the whole North-East Atlantic area by EEA (European Economic
Area) countries declined from 1.49 million tonnes in 1970 to 0.89 million tonnes in 1997.
Norway took 45% and Iceland 23% of the total 1997 catch.
In the North Sea and Skaggerak 97,000 tonnes (made up of 11,000 tonnes in ICES
88
Area IIIa, 78,300 tonnes in Area IV, and 6,900 tonnes in AreaVIId) were reported landed in
1999. The total figure declined to 71,000 tonnes in 2000. Full estimates of international
discards are not available but from discard sampling studies the following estimates of the
percentage discarded at age have been calculated (ICES 2001a).
Age First Quarter Second Quarter Third Quarter Fourth Quarter 1 56-99 66-100 57-100 57-79
2 11-46 10-51 9-67 1-11
3 5-6 7-37 3-6 1-6
4 0-6 0 0 0
Several factors affect discard rates. Inshore fisheries tend to discard more than offshore
fisheries, which tend to use larger mesh nets. Also there are fewer juvenile fish offshore.
Nephrops trawlers discard larger proportions of their catches of cod than pair trawls and otter
trawls, but these other types also discard larger numbers of cod.
In the West of Scotland a total catch of 3,090 tonnes was reported in 2000. Existing
information is that discarding of cod is at a relatively low level (ICES 2000b).
In the Irish Sea a total catch of 2,190 tonnes was reported in 2000. There are no time
series of discards. Sampling of Nephrops trawls and pelagic trawls since 1997 show that the
bulk of discards are 1-year old cod and that fishing mortality on landed and discarded 1-year
olds is of equivalent magnitude. Sampling of otter and beam trawls indicates similarly low
discard rates.
In the Celtic Sea a total catch of 6,990 tonnes was reported in 2000.
Catches in the West Baltic in 1999 were reported to be 42,150 tonnes, in the East Baltic they were 72,990 tonnes. For both of these stocks the quality of landing statistics was
low in the early 1990s but has improved since. However there is still uncertainty in the
estimates of stock size and level of fishing mortality. he exploitation rate is high and fishing
pressure on young ages has increased. The quantities of discards are still largely unknown,
but discards of fish below minimum size does occur. More than one third of the landings in
1996 were of 2-year old cod of which only 22% were mature. In all years landings have
been far above levels recommended by ICES.
4.2.8 Catch at age and fishing mortality rates At the minimum landing size of 35 cm cod are at age 2 years and upwards. Many fish are
caught before that have the chance to spawn and less than 5% of 1-year olds survives to the
age of 4. Time series of catch numbers at age are given in Table 4.2.1 (North Sea), Table
4.2.2 (West Scotland), Table 4.2.3 (Celtic Sea), Table 4.2.4 (Irish Sea), Table 4.2.5 (West
Baltic), and Table 4.2.6 (East Baltic). Time series of fishing mortality rates for these areas
are given in Tables 3.2.6 to 3.2.11. Over the time periods of the tables, average rates have
been:
Area Age-classes Average Maximum Minimum North Sea 2-8 0.812 1.064 (1982) 0.451 (1963) West Scotland 2-5 0.785 1.060 (1997) 0.521 (1966) Irish Sea 2-4 0.908 1.417 (1997) 0.578 (1970) Celtic Sea 2-5 0.740 1.032 (1991) 0.399 (1977) West Baltic 3-6 1.157 1.707 (1986) 0.805 (1984) East Baltic 4-7 0.894 1.361 (1991) 0.320 (1993)
89
4.2.9 Seasonality of fishing The fishery is all year round, although some fleets are seasonal. Within the North Sea, the
highest catches in the first quarter of year are in southern areas, south of Dogger Bank and
from the German Bight. In the second quarter of year the highest catches are in north-eastern
areas, west of Jutland and south of Norway although significant landings are also made from
the southern North Sea and German Bight. In the third quarter of year the catches are more
evenly distributed over the North Sea but highest catches are in eastern areas. The fourth
quarter of year is similar to the first quarter. In the Celtic Sea catches are highest in the
winter months November to April.
4.3 WHITING Merlangius merlangus 4.3.1 Total Allowable Catch (TAC) in tonnes
Area 2000 2001 IIIa 4000 2500
IIa, IV 30000 29700
Vb, VI,XII,XIV 4300 4000
VIIa 2640 1390
VIIb-k 22500 21000
VIII 7000 5600
IX,X 2640 2100
Total 73080 57335 4.3.2 Minimum landing size 27 cm, except for the Skagerrak (ICES Area IIIa) where it is 23 cm.
4.3.3 Minimum mesh size 80 mm (otter and beam trawls) or 70 mm (Nephrops trawlers).
4.3.4 Fisheries In the North Sea, whiting are fished by mixed demersal fisheries mainly by Scotland (seine and
light trawl), England (seine and trawl) and France (inshore and offshore trawlers). Some are
also caught by Dutch beam trawlers and German trawlers. French trawlers targeting saithe take
a bycatch of whiting. It is also a bycatch in the industrial fisheries for Norway pout, sandeel and
sprat.
In the Celtic Sea whiting are fished by mixed trawls, otter trawls, seine and French
Nephrops trawlers.
In the Western Channel whiting are fished by otter trawls targeting a wide range of
species, and beam trawlers targeting sole, monkfish and plaice.
4.3.5 Time series of catches Time series of landings data are shown in Table 3.3.2 (North Sea 1960-2000) and Table
3.3.3 (Celtic Sea 1982-2000). Over these time periods, average landings (in 1000 tonnes)
have been:
Area Average Maximum Minimum North Sea 177 360 (1976) 43 (1998) Celtic Sea 15.2 22.7 (1995) 10 (1986)
90
4.3.6 Total quantities caught and levels of discard In 2000 total catch was 55,300 tonnes (24,000 tonnes for human consumption, 22400
tonnes discarded and 8,900 as industrial bycatch). Human consumption and industrial
landings are close to the lowest recorded levels and the level of discards is almost double the
1998 figure of 12,700 tonnes. ICES has recommended that technical measure be introduced
to address the high rate of discarding because a reduction in fishing mortality cannot be
achieved by TAC management alone. There is not thought to be a serious problem due to
mis-recording in the catch data figures.
4.3.7 Catch at age and fishing mortality rates The vast majority of 0, 1 and 2-age fish are caught in industrial fisheries or are discarded by
human consumption fleets. Time series of mean fishing mortality rates are shown in Table
3.3.2 (North Sea) and Table 3.3.3 (Celtic Sea). Over the time periods of the tables, average
rates have been:
Area Age-classes Average Maximum Minimum North Sea 2-6 0.827 1.347 (1960) 0.412 (2000) Celtic Sea 2-5 0.852 1.420 (1983) 0.354 (1996)
4.3.9 Seasonality of fishing In the North Sea whiting are take all year over a wide area but especially in the north-western
North Sea and in the eastern North Sea off the coasts of Germany, the Netherlands and
Denmark. During the winter (October-March) months most of the catches are from the western
and northern areas. In summer there is an increase in the catches from the south and east.
In the Celtic Sea the bulk of landings (> 60%) are made from November to March
4.4 MONKFISH/ANGLERFISH Lophius piscatorius and L.budegassa 4.4.1 Total Allowable Catch (TAC) in tonnes
Area 2000 2001 IIa, IV 11660 14130
Vb,VI,XII,XIV 8000 6400
VII 23000 21700
VIIIa-e 6570 5900
Cecaf 34.1.1 6800 6000
Total 62030 54130
4.4.2 Minimum landing size No minimum landing size. One reason given for this is that the large head size of fish which
makes the imposition of a minimum size impracticable.
4.4.3 Minimum mesh size None
4.4.4 Fisheries For the Northern stock (North Sea, West Coast of Scotland and Skagerrak) monkfish are the
fourth most abundant demersal species by weight caught by the Scottish fleet Until the mid-
91
1980s monkfish was mainly taken as a bycatch in bottom trawl.
For the southern stock (Celtic Sea), monkfish is an important component of mixed
fisheries also taking hake, megrim, sole, cod, plaice and Nephrops. The fish is of great
economic importance to fishermen. A trawl fishery by Spanish and French vessels developed
in the Celtic Sea in the 1970s and 1980s, and these countries take about 75% of the total
landings. Most of the remainder is taken by UK, Ireland and Belgium. French, Spanish and
Irish vessels mainly use otter trawls, whereas 60% of the UK catch is by beam trawlers and
gill netters. Monkfish are also taken by beam trawlers in deeper waters, usually as a bycatch
in several types of fishery.
Off South-West England, local fishermen use both inshore gill nets and bottom set
gill nets to catch monkfish. When set loosely bottom-set nets are called tangle nets and
monkfish caught in these nets have been reported as suffering from seal damage, especially
when nets remain unhauled for several days.
4.4.5 Time series of catches These are shown in Table 3.4.2 (Northern stock 1973-1999) and Table 3.4.3 (Southern stock
1986-2000). Over these time periods, average landings (in 1000 tonnes) have been:
Area Average Maximum Minimum Northern 15.8 34.4 (1996) 5.8 (1981) Southern 18.5 23.7 (1986) 12.8 (1992)
4.4.6 Total quantities caught and level of discard In the North Sea and west of Scotland more than 98% of the catch is L. piscatorius compared
to 2% L. budegassa.
In the Northern stock (North Sea, West of Scotland and Skagerrak), approximately
9,000 tonnes was caught annually from 1974-1983. Catches then rose gradually up to 34,000
tonnes in 1996. Since then there has been a steep decline to around 19,000 tonnes in 2000.
Routine data on discards are not collected. However, it is known there is some discarding in
targeted fisheries for monkfish and in other fisheries such as those for scallops. Recent
observer trips on Scottish vessels indicate that discarding of monkfish only occurs at very
low levels.
In the Southern Stock (Celtic Sea) landings for 2000 were 12,600 tonnes, a decrease
from the 22,000 tonnes landed in 1996. This decline is for white monkfish, as catches of
black monkfish have increased slightly. There is no systematic sampling of discards, but
checks made on French, Irish and Spanish fleets indicated that there was only a low level of
discarding and that any discards are limited to very small fish.
4.4.7 Catch at age and fishing mortality rates Time series of catch at age are shown in Table 4.4.1 and time series of average fishing
mortality rates are shown in Table 3.4.2 (Northern stock 1992-1999) and Table 3.4.3
(Southern stock 1986-2000) Over the time periods of the tables, average rates have been:
Area Age-classes Average Maximum Minimum Northern 6-8 0.575 0.897 (1996) 0.413 (1999)
Southern 3-8 0.319 0.392 (1989) 0.213 (1993)
4.4.8 Seasonality of fishing Year round, but off South-West England, tangle nets set in the vicinity of wrecks and reefs
are more important in providing a winter fishery.
92
4.5 ATLANTIC SALMON Salmo salar 4.5.1 Total Allowable Catch (TAC) in numbers Area 2000 2001 IIIb-d 450000 450000
IIId (Estonia) 450000
IIId (Latvia) 450000 450000
IIId (Lithuania) 450000 450000
Sub-div 32 of IBSFC 90000 70000
Total 1440000 1870000
4.5.2 Minimum landing size Not applicable
4.5.3 Minimum mesh size 60 cm in the Baltic.
4.5.4 Fisheries In the Baltic there is an offshore fishery using drift nets and long lines, in coastal waters trap
nets are used, in rivers there is fishing with seine nets and sport fishing. From 1990-2000
there has been a shift from offshore fisheries towards coastal and river fisheries.
4.5.5 Time series of catches Table 4.5.1 lists the catches of salmon caught in the open sea from 1973-1999. Over this
time the catch has declined markedly from 4873 tonnes in 1973 to 46 tonnes in 1999. Table
4.5.2 lists estimated total catches of salmon from 1989-1999 in the North-East Atlantic
categorised as either wild, farmed or ranched. Table 4.5.3 lists the catches of salmon in the
Baltic from 1987-1999.
4.5.6 Catch at age and fishing mortality rates Not applicable.
4.5.7 Total quantities caught and levels of discard There is little knowledge on the nature and level of bycatches of post smolt or adult salmon in
commercial fisheries. There are suspicions that both industrial and pelagic fisheries for human
consumption pose a threat in this respect. Research fishing off Norway and North-West
Scotland using surface trawling techniques have caught salmon and have provided evidence
that they were exhibiting shoaling behaviour. Thus it is possible that similar commercial
fisheries could cause major damage to certain year-class runs from a river.
In the late 1980s the offshore fisheries in the Baltic took more than 1 million salmon
annually. The present quota is 450,000 fish (2000 tonnes). Only poor data on levels of
discarding and reporting of undersized fish are available. Unreported catches in 2000 were
estimated at 315 tonnes (equivalent to 56,397 fish), discards were estimated at 261 tonnes
(48,441 fish). About 36,000 salmon were discarded in 2000 due to damage by seals in gears.
In the Gulf of Finland there is increasing damage due to seal in Estonia and Finland. It has
been estimated that seals damaged about 7% of the catch, equivalent to 50 tonnes of salmon
catch in 1998. 78 tonnes (12,000 fish) were reported to have been discarded in 2000,
approximately 95% of this was apparently due to seal damage. The most serious problems
are reported to occur in SD29 (Åland Sea and Archipelago Sea), SD30 (Bothnian Sea), and
93
SD32 (Gulf of Finland) where seals destroy trap nets.
4.5.8 Seasonality of fishing In the Baltic there is a closed season from June to August. The fishery in Denmark is divided
into winter fishery (using long lines) and a spring and autumn fishery (using drift nets).
4.6 EEL Anguilla anguilla 4.6.1 Total Allowable Catch (TAC) in tonnes There is no TAC because data on stock and recruitment relationships are not available for
the different life stages of the eel, in addition TACs would be difficult both to monitor and to
enforce.
4.6.2 Minimum landing size There is no minimum landing size. Where elver recruitment is low, the commercial glass eel
fishing is banned (Sweden, Denmark, Germany, Ireland, Netherlands, Belgium).
4.6.3 Minimum mesh size There are restrictions on mesh size.
4.6.4 Fisheries Eels are taken in trawls, on long lines and in traps of various types. The largest fisheries are
for glass eels in the Bay of Biscay and South-West England. Eels are caught in Spain and
Portugal by traps and hand nets, in France by small trawlers, and in the UK with hand nets.
Yellow/ silver eels are caught in mainland Europe, Ireland and the Baltic using pound nets
and similar passive devices, including traps. German fishermen are reported to be
particularly concerned about the declining yields of the eel fishery.
4.6.5 Time series of catches Reported catches of all age-classes of eels listed by area and fishery nation are given in
Table 4.6.1.
4.6.6 Catch at age and fishing mortality rates Not applicable.
4.6.7 Total quantities caught and levels of discard In 1999, 827 tonnes of eels were caught.
4.6.8 Seasonality of fishing Closed seasons are used in some countries to ensure unhindered migration of fish to the sea.
These are timed according to local characteristics of the eels and the local fisheries.
94
4.7 HADDOCK Melanogrammus aeglefinus 4.7.1 Total Allowable Catch (TAC) in tonnes
Area 2000 2001 IIIa-d 4450 4000
IIa, IV 73000 61000
Vb, VI,XII,XIV 19000 13900
VII,VIII,IX,X 13200 12000
Total 109650 90900 4.7.2 Minimum landing size 30 cm, except for ICES Area IIIa where it is 27cm. 4.7.3 Minimum mesh size 100 mm (North Sea ), but Nephrops trawlers can use 70 mm mesh with restrictions on the
size of the bycatch of haddock.
4.7.4 Fisheries In the North Sea haddock is taken as part of mixed demersal fishery, mostly by Scottish light
trawlers, seiners and pair trawlers. Lesser quantities are taken as a bycatch by Nephrops
trawlers. Haddock are also taken as a bycatch in Danish and Norwegian industrial fisheries.
In the Kattegat/Skagerrak they are taken in mixed demersal and industrial fisheries.
4.7.5 Time series of catches Time series of catches are given in Tables 3.7.2 (North Sea, 1963-2000) and 3.7.3 (West
Scotland, 1965-2000). Over these time periods, average landings (in 1000 tonnes) have been
Stock Average Maximum Minimum North Sea 263 931 (1969) 93 (1990)
West Scotland 32.3 58.5 (1971) 15.3 (2000)
4.7.6 Catch at age and fishing mortality rates A time series of catch numbers at age for the North Sea over the period 1985-2000 is given
in Tables 4.7.1.Time series of mean fishing mortality rates are given in Tables 3.7.2 (North
Sea, 1963-2000) and 3.7.3 (West Scotland, 1965-2000). Over the time periods of the tables,
average fishing mortality rates have been
Stock Age-classes Average Maximum Minimum North Sea 2-6 0.918 1.152 (1969) 0.620 (1968) West Scotland 2-6 0.669 0.973 (1972) 0.384 (1981)
4.7.7 Total quantities caught and levels of discard Landings in the North Sea in 2000 were 102,000 tonnes. In West Scotland, the total catch in
2000 was 15,300 tonnes of which 7,000 tonnes were official landings and 8,200 tonnes were
discards. The levels of discarding in this sea area have been well monitored and a time series
(1965-2000) is shown in Table 3.7.3.
95
4.8 PLAICE Pleuronectes platessa
4.8.1 Total Allowable Catch (TAC) in tonnes
Area 2000 2001 IIIa-Skaggerak 11220 9400
IIIa-Kattegat 2800 2350
IIa, IV 97000 78000
Vb,VI,XII,XIV 2400 1920
VIIa 2400 2000
VIIbc 300 240
VIIde 6500 6000
VIIfg 800 760
VIIh-k 1350 1215
VIII,IX,X 700 560
Total 125470 102445
4.8.2 Minimum landing size 22 cm, except for ICES Area IIIa where it is 27cm.
4.8.3 Minimum mesh size 100 mm for beam trawlers in the North Sea.
4.8.4 Fisheries In the Celtic Sea and Western Channel (ICES Areas VIIe-g) the haddock fishery is mainly
carried out by UK, French and Belgian otter trawlers, plus some Belgian beam trawlers. In
the North Sea plaice are taken by beam trawlers in mixed fisheries with sole. In addition,
there are seine and gillnet fisheries directed at plaice, and a mixed otter trawl fishery. In the
Eastern Channel plaice are caught by Belgian and UK offshore beam trawlers, French and
UK inshore trawlers, and by French otter trawlers in winter.
4.8.5 Time series of catches A time series of landings for the North Sea in the period 1957-2000 is given in Table 3.8.2.
Average landings were 117,800 tonnes with a maximum of 169,800 tonnes in 1989 and a
minimum of 70,600 tonnes in 1957. In the Celtic Sea and Western Channel landings rose
gradually from 1976 to reach a peak of over 5,500 tonnes in 1990; they have since declined
to around 2,000 tonnes.
4.8.6 Total quantities caught and levels of discard In the North Sea plaice discards can be very high and have been estimated at 50% for beam
trawlers (CEFAS 2001).
4.8.7 Catch at age and fishing mortality rates A time series of the numbers of fish caught at age is given in Table 3.8.1. A time series of
mean fishery mortality rates for the period 1957-2000 in the North Sea is given in Table
3.8.2. Over the time periods of the tables, average rates have been:
Stock Age-classes Average Maximum Minimum North Sea 2-10 0.366 0.540 (1994) 0.197 (1957)
96
4.8.8 Seasonality of fishing In the Celtic Sea and Western Channel plaice are taken all year, but the highest landings are
in February and March, and in September and October. 4.9 HERRING Clupea harengus
4.9.1 Total Allowable Catch (TAC) in tonnes
Area 2000 2001 Man Unit 3 85000 72000
I,II 1252000 851500
IIIa 80000 80000
IIIb,IIIc-d 405000 300000
IIId (Estonia) 405000 300000
IIId (Latvia) 405000 300000
IIId (Lithuania) 405000 300000
IIId (Poland) 405000 300000
North Sea 265000 265000
IVc, VIId 265000 265000
Vb, VIaN, VIb 42000 36360
VIaS, VIIbc 13900 13900
VIa, Clyde 1000 1000
VIIa 5350 6900
VIIef 1000 1000
VIIg-k 21000 20000
Total 4056250 3112660
4.9.2 Minimum landing size 20 cm, except for ICES Area IIIa where it is 18 cm
4.9.3 Minimum mesh size Baltic Statistical Divisions 22-27: 32 mm; SDs 28-29 south of 59°30’: 28 mm; SDs 29-32
north of 59°30’: 16 mm.
4.9.4 Fisheries In the North Sea herring are caught in drift nets, ring nets and trawls. In the Baltic, herring
and sprat are caught in a mixed fishery which uses small-mesh trawls. Sprat fisheries have a
bycatch of herring, and herring trawls yield a bycatch of sprat. A small fraction of the landed
herring is taken with trap or pound nets during spawning time, the bycatch of sprat in this
fishery is minimal. Sprat is managed by one TAC agreed for the whole Baltic, herring by
two TACs. The herring TACs have been kept high despite decreasing stock size, but have
not been taken in full since 1989. This fact, together with an increasing sprat stock, has
created a strong incentive to misreport sprat as herring in order to utilize the quotas of both
herring and sprat as much as possible. If this has happened, as the data seem to indicate, it
will have influenced the assessments for both stocks. ICES (2001h) recommended that the
species compositions of the landed pelagic fish should be reevaluated and revised at a
national level.
97
4.9.5 Time series of catches Time series of landings are shown in Tables 3.9.2 (North Sea, 1960-2000), 3.9.3 (Baltic
except SD31, 1974-2000), and 3.9.4 (Baltic SD31, 1980-2000). Over these time periods,
average landings (in 1000 tonnes) have been:
Stock Average Maximum Minimum North Sea 518 1169 (1965) 11 (1978)
Baltic (not SD31) 264 323 (1979) 178 (1999)
Baltic (SD31) 6.9 9.7 (1980) 3 (2000)
4.9.6 Total quantities caught and levels of discard In the North Sea, 372,000 tonnes were landed in 2000. In the Baltic (excluding SD31)
208,000 tonnes were landed in 2000; 3,000 tonnes were landed in Baltic SD31.
4.9.7 Catch at age and fishing mortality rates Time series of fishing mortality rates are given in Tables 3.9.2 (North Sea, 1960-2000),
4.10 SPRAT Sprattus sprattus 4.10.1 Total Allowable Catch (TAC)
Area 2000 2001 IIIa 50000 50000
IIIb-d 400000 355000
IIId (Estonia) 400000 355000
IIId (Latvia) 400000 355000
IIId (Lithuania) 400000 355000
Iia, IV 225000 232000
VIIde 12000 12000
Total 1887000 1714000 4.10.2 Minimum landing size None.
4.10.3 Minimum mesh size 16 mm in the Baltic.
4.10.4 Fisheries There are important fisheries in the North Sea, Norwegian waters and in the Baltic. Inshore
98
fisheries mainly operate in the winter and use trawls and drift nets often from small boats. In
the Baltic pelagic fisheries, using single and pair trawl, operate for industrial use by EU
vessels and for human consumption by East Baltic countries.
4.10.5 Time series of catches Time series of landings for the North Sea, Kattegat/Skagerrak and Baltic Sea are given in
Tables 4.10.1. Over these time periods, average landings (in 1000 tonnes) have been:
Stock Average Maximum Minimum North Sea 171 641 (1975) 16 (1986)
Kattegat/Skagerrak 32 101 (1975) 2 (1992 and 93)
Baltic 174 529 (1997) 37 (1983)
4.10.6 Total quantities caught and levels of discard In 1999 421,000 tonnes were landed in the Baltic.
4.10.7 Catch at age and fishing mortality rates A time series (1974-1999) of average fishing mortality rates for the Baltic is given in Table
3.10.1. Over the time periods of the tables, average fishing mortality rates have been:
Stock Age-classes Average Maximum Minimum Baltic 3-6 0.287 0.463 (1975) 0.129 (1992)
4.10.8 Seasonality of fishing All year.
4.11 SANDEEL Ammodytes sp 4.11.1 Total Allowable Catch (TAC)
Area 2000 2001 IV (Norwegian) Not applicable Not applicable
IIa + IV (North Sea) 1020000 1020000
4.11.2 Minimum landing size None.
4.11.3 Minimum mesh size None.
4.11.4 Fisheries Sandeels are taken by trawlers using small mesh gear. The fish are mainly taken for
industrial purposes, principally by Denmark and Norway. Most of the catch consists of
lesser sandeel Ammodytes marinus.
4.11.5 Time series of catches Time series of landings are given in Table 3.11.1 (North Sea, 1983-2000), 4.11.1 (North Sea
by area) and 4.11.2 (North Sea by fishing nation).
99
4.11.6 Total quantities caught and levels of discard In 2000 699,000 tonnes were landed from the North Sea. Over the period 1983-2000 the
mean annual landings were 798,000 tonnes the maximum was 1,138,000 tonnes in 1997, and
the minimum was 537,000 tonnes in 1983.
4.11.7 Catch at age and fishing mortality rates At current levels of fishing mortality, it is believed that the size of sandeel stocks is mainly
determined by natural processes. A time series of average fishing mortality rates for fish
aged 1-2 years in the North Sea is given in Table 3.11.1. During this period the average
fishing mortality was 0.60, the maximum was 0.96 in 1985, and the minimum was 0.35 in
1984.
4.11.8 Seasonality of fishing Peak catches are in spring and summer (April to June), only very low catches are taken in the
period October to February.
100
101
102
103
104
105
106
107
108
109
110
111
112
113
114
115
116
117
5. Analysing interactions between seals and fisheries 5.1 Introduction There is no doubt that marine mammals can be important influences in their ecosystems
(Bowen 1997). The fact that, in some ecosystems, other taxonomic groups may be more
important as predators of commercial fish species than marine mammals (e.g., Overholtz et
al. 1991, Trites et al. 1997) does not necessarily imply that the effects of marine mammals
are unimportant. The protocol in UNEP (1999) suggests that a formal "2-way matrix of who
eats whom" be established before "deciding which species should provisionally be taken into
account in an evaluation of the likely effects of a cull." Some of the information identified by
UNEP (1999) as necessary for scientific evaluation of cull proposals requires extensive
knowledge of multispecies interactions within which seals and commercial fish species
operate. Multispecies approaches, despite many problems, are being actively promoted for
fisheries science in general (e.g., ICES 1999), although total allowable catches (TACs) for
exploited fishes are still largely based on single-species models.
Whipple et al. (2000) provide a useful discussion of the different methodologies that
have been used to analyse predation mortality in aquatic ecosystems. They distinguished
between static-flow models that provide a “snapshot” of the system at one moment in time,
dynamic models that attempt to track variations in population size over time, and spatially
explicit models that attempt to take account of variation in space as well as time. The
simplest form of static-flow models simply involve calculations of the quantities of fish
species consumed by seals, which are compared with the quantities taken by commercial
fisheries. In simple “surplus yield” calculations it is then assumed that a reduction of the
seal population by, say X%, will result in an equivalent reduction in the amount of fish
consumed by seals and that, at least part, of this “surplus yield” will be available to
commercial fisheries. More sophisticated static-flow models use mass-balance principles to
estimate flows of organic matter or energy among components of an ecosystem using data on
diets, estimated assimilation efficiencies, metabolic demands, etc. Formal implementations
of this approach include the use of Ecopath software (Christensen and Pauly 1993, available
at http://www.ecopath.org) and inverse-modelling (Savenkoff et al. 2001). This approach is
particularly useful for identifying deficiencies in knowledge of the system. Some authors
have attempted to use Ecopath to investigate the impacts of changes in one component of an
ecosystem by manipulating the biomass of that component and re-balancing the system.
However, Ecopath assumes that the interactions among the components of the system being
modelled are linear, so that it cannot on its own be used to draw conclusions about effects of
changes in exploitation rates or predation. Dynamic models, such as Ecosim (see below), are
required for this. The Ecopath-with-Ecosim package also has an option (Ecospace) to
incorporate spatially explicit variation in predator and prey dynamics.
ICES is planning a workshop on ecosystem models that will be run at the end of
2002, at the earliest (ICES 2001k) to compare the performance of a range of ecosystem
models. Although this will, undoubtedly be an extremely useful exercise, its main purpose is
to compare the performance of these models in predicting the effects of different fisheries
activities on the entire marine ecosystem, rather than the role of predators in these systems.
Many model implementations have been hybrids of static-flow models for higher
predators and dynamic models for prey populations. However, if such models are to be even
moderately realistic it is important that they take account of the way in which the number of
individuals of each prey species consumed by a predator varies with prey abundance (the
predator’s functional response), and the way the predator population responds to changes in
overall prey availability (the numerical response of the predator population). In particular,
very little attention has been paid to the way the functional response to one prey species may
118
be affected by changes in the abundance of other prey (this is known as the predator’s
multispecies functional response).
The functional response can be very important in determining the way predator-
induced mortality varies with prey abundance. Most predators do not have a linear
functional response. Rather, the number of individuals of a particular prey species that are
consumed may be relatively constant over a wide range of prey population sizes. As a result,
over this range of prey abundances, the rate at which prey are consumed by the predator
tends to increase as prey abundance falls. As a result, under certain circumstances, predator-
induced mortality can rise to such a high level that the prey is “trapped” at a low level of
abundance in what has been called a “predator pit”. Such inverse density-dependent effects
have been documented in some terrestrial predator-prey interactions and they have been
proposed as an explanation for the failure of some fish stocks (eg northern cod in Canada,
Norwegian spring spawning herring) to recover from the effects of over-exploitation.
Data on the functional responses of seals are equivocal. Stenson and Perry (2001)
found no significant change in the proportion of Atlantic cod in the diet of harp seals off the
east coast of Newfoundland over a period when the size of the cod stock declined by a factor
of 100 times. This suggests that the functional response of harp seals to cod is highly non-
linear. The Ecosim computer package has the facility to mimic the effects of predator
functional responses by providing a “refuge” where some prey are unavailable to predators.
Ironically, when this package was used to model interactions between cod and harp seals in
the same area (see section 5.5.2) the best fit to the time series of fish abundance data was
obtained when cod had no refuge from seal predation (Bundy 2001), implying a linear
functional response.
Other authors have documented large changes in diet composition from region to
region that appear to be related to the availability of prey, and there have been marked shifts
in the diet of harp seals in the Barents Sea following changes in the abundance of capelin,
their preferred prey (Bogstad et al. 2000). However, to date, there has been no systematic
attempt to fit functional responses to these data.
Most dynamic models of multispecies populations have been extensions of
"classical" prey-predator/competition models using differential or finite-difference
equations. These have been used both to support and oppose the selective removal of one or
another living component to influence the abundance or yield of another. For example,
Flaaten (1988) used models of this kind to conclude that "sea mammals should be depleted
to increase the surplus production of fish resources for man." Yodzis (1994) showed that this
conclusion was a consequence of the structure of Flaaten’s model, which was based on a few
interacting species and linear interaction terms. Models with non-linear interaction terms
provided very different conclusions. Yodzis concluded that "it remains frustratingly difficult
to say just what functional form [of interaction] is the appropriate one for a given real
population."
A recent exchange between Boyd (2001) and Yodzis (2001b) has highlighted the
results of recent research on global-scale environmental shifts and consequent changes in
prey-predator and fishery régimes: El Niño is a familiar example. Such events introduce
additional uncertainty into the application of complex ecosystem models to particular
situations.
Despite all these valuable multispecies approaches, a “common sense” view is that
some effects of reducing seal predation should be predictable without resorting to
multispecies analysis. Given the time lags that may be involved in the re-equilibration of
whole systems, a sharp reduction of seal predation on fish of commercial size should lead to
an increase in the size of the relevant fish stocks, at least in the short-term. Similarly, a
reduction of predation on pre-recruit fish might give enough short-term relief to permit the
stock to escape a “predator trap” caused by inverse density-dependent mortality. These
119
possibilities are implicitly recognized by Yodzis (2001, p. 80), who notes “on a short time
scale we might predominantly observe the effect from the shorter pathway (an increase in
fisheries yield), with the contribution of the longer pathway making itself felt only on a
longer timescale, possibly leading to a reversal of the response (a decrease in fishery yield).”
5.2 Surplus yield calculations As noted above, surplus yield calculations may provide a reasonable estimate of the
consequences of a change in predator abundance. However, such calculations are unlikely to
provide a realistic estimate of the longer-term consequences of such a change. In addition, it
is important to take account of the uncertainties involved at each stage of the calculation.
When this is done, the potential benefits to fish stocks may be less clear cut than a simple
calculation might imply. For example, MacLaren et al. (2001) calculated the potential
effects on the northern cod stock of removing 750,000 harp seals from the North-West
Atlantic stock over a five year period. The mean estimate was that this would reduce the
quantities of cod consumed by around 4,000 tonnes per year. This is roughly equivalent to
the effect of closing the current commercial fishery. However, the 95% confidence limits on
this estimate were very wide (± 1,500 tonnes ) and the consequences for the Canadian seal
industry would be dramatic, with a high probability that this fishery would have to be closed
following the reduction in seal numbers. In an earlier example, Hammond and Fedak (1994) calculated that grey seals consumed
10,500 tonnes of cod in the North Sea in 1992. Again, the 95% confidence limits were wide
(7,300-16,000 tonnes). The mean estimate of consumption was 10.7% of the commercial
catch by all fisheries in that year. Since 1992 the TAC for cod has been substantially
reduced (to 49,300 tonnes in 2002 compared with landings of 98,000 tonnes in 1992), and
the grey seal population has increased by 60%. This might, and has, been interpreted as
implying that grey seal predation is approaching the commercial catch. However, the grey
seal diet estimates, particularly those for the Orkney islands where most of the population is
concentrated, are based on samples collected in 1985 (Hammond and Fedak 1994). The size
of North Sea cod stocks has declined very sharply since then (see section 3.2) and cod may
now constitute a smaller proportion of the grey seal diet than in 1985.
5.3 Minimum realistic models On way to improve the realism of simple surplus yield calculations is to incorporate predator
mortality directly into models of the dynamics of target fish stocks. Such models have been
referred to “minimum” realistic models (MRMs, for short). Such models may be fully
dynamic (where continuous changes in the abundance of both predator and prey are
modelled), or combine dynamic models of the fish stocks with static-flow models of predator
consumption. There are now a number of examples of spatially-explicit models of this kind.
The incorporation of additional sources of predation may have counter-intuitive
consequences for the predicted response of the target fish stock to a change in predator
abundance. Perhaps the most oft-quoted example is an analysis conducted by Punt and
Butterworth (1995) who developed an age-structured model of the interactions between
Cape fur seals and the South African hake fishery. When they included only a single,
cannibalistic hake species in their model, a decrease in fur seal numbers resulted in increased
hake catches. However, when they took account of the fact that there are actually two hake
species in South African waters, and that the species preferred by fur seals is a major
predator on the younger stages of the species that is predominantly taken by the commercial
fishery, they reached the opposite conclusion: a reduction in fur seal numbers had a
negligible or negative effect on the commercial catch of hake. This is a classic example of
what has been termed “mesopredator release” (see Crooks and Soulé 1999), where the
reduction in predation on a species that is both prey and predator results in the “release” of
120
this species and a substantial increase in predation on other prey species. Thus control of cat
populations on islands may result in an increase, rather than the expected decrease, in seabird
predation because of a consequent increase in the numbers of rats (Courchamp et al. 1999)
The results of Punt and Butterworth’s analysis led UNEP (1999) to recommend the
use of MRMs for evaluating the potential effects of culls of marine mammals on fisheries
yields. In addition, UNEP suggested that MRMs should attempt to incorporate at least 80%
of the natural predation on the target fish stock, although the basis for this value is not
explained. There have been a number of attempts to apply MRMs to marine mammal-
fisheries interactions since the 1992 and 1994 meetings that led to the UNEP guidelines and
we review some of them below.
Hammond and O’Brien (2001) provide an amusing account of how Bayesian
methods can be used to take account of uncertainty in the predictions of an MRM of the
effects of grey seal and seabird predation on a hypothetical haddock stock.
5.3.1 MULTSPEC and BORMICON MULTSPEC is a spatially-explicit, mixed static-flow and dynamic modelling package
developed by Bogstad et al. (1997, with a more accessible account in Tjelmeland and
Bogstad 1998) to investigate interactions between three fishes (capelin, herring, cod), harp
seal, and minke whale (Balaenoptera acutorostrata) in the Barents and Norwegian Seas.
Marine mammal numbers are assumed to remain constant over time, unless they are
harvested. Bogstad et al. (1997) tentatively concluded that herring stocks would be reduced
by increased whale numbers, whereas increased harp seal numbers would most heavily
affect the capelin and cod stocks. These conclusions were generated by removing portions of
the model fish and mammal populations and comparing the results with those from a
"reference run." They claimed that the results were robust within broad specifications of the
interactions. However, the lack of any functional response by either predator to changes in
the relative abundance of alternative prey, the lack of any modelling of predator dynamics,
and the fact that the dynamics of the system are largely driven by variations in spring-
spawning herring which are controlled by events outside the Barents Sea suggests that
alternative formulations of the model might produce rather different conclusions.
BORMICON (Bjoernsson 1997), like MULTSPEC, a spatially-explicit, mixed static-
flow and dynamic modelling package. It’s structure is more general than MULTSPEC and
teh BORMICON framework is now being used as a replacement for MULTSPEC in the
development of new models of the Barents Sea system. It was developed to investigate the
effects of interactions among Icelandic cod, capelin, shrimp and baleen whales and fisheries
yields. Preliminary application of this model (Stefánsson et al. 1997) suggested that “the
impact of the three baleen whale species on the development of the cod stock is uncertain,
but may be considerable”.
5.3.2 Herring, mackerel, cod and grey seals in the southern Gulf of St Lawrence Swain and Sinclair (2000) used an MRM to investigate how the abundance of herring and
mackerel in the southern Gulf affects the recruitment of cod through predation of cod eggs
and larvae. Swain and Sinclair suggest that seals may "have an indirect positive effect [on
cod stocks] through predation on pelagic fishes." Indeed, their title suggests that they believe
the argument might apply more widely to "the cod recruitment dilemma in the Northwest
Atlantic." It is true that mackerel and herring are known elsewhere to consume eggs and
larvae of cod and have been suggested to influence cod recruitment (references in Swain and
Sinclair 2000). The one reference for herring in the Gulf of St. Lawrence (Messieh et al.
1979) is uninformative on proportions of cod among fish eggs (in 11% of stomachs) and
larvae (a "trace") eaten. However, herring and mackerel undoubtedly do have opportunities
to consume cod eggs and larvae during their heavy feeding period in summer.
121
The role of seals in this "triangular food web" is less certain. An estimated 3000
tonnes of herring were consumed by grey seals in the southern Gulf in 2000 (with very wide
limits per Table 3 in Hammill et al. 2000). This estimated consumption is very much smaller
than the estimated age 4+ biomasses of ~49 Kt for the spring spawning component and 415
Kt for the autumn spawning component of herring, and the combined fishery take of ~76 Kt
(DFO 2001c). Hammill et al. (2000) do not estimate mackerel consumption in this region,
but they did estimate that mackerel supplied only ~4% of the herring contribution to diet
energy of grey seals (their Table 3). Taking individual herring and mackerel as energetically
equivalent, this translates to ~120 tonnes of mackerel. This seems inconsequential from a
spawning stock biomass (taken as an index) of ~2Mt in 2000 by Swain and Sinclair (2000,
their Fig. 1), or even from the smaller current estimate of 366,022t in DFO (2001d). Thus,
whereas Swain and Sinclair's (2000) hypothesis of a negative effect of pelagic fish biomass
on cod recruitment appears generally convincing, there appears to be little evidence that seal
predation on herring or mackerel is sufficient to reduce this effect.
5.3.3 Grey seals and cod on the Scotian Shelf, Canada There have been two recent attempts to develop MRMs of the interactions between grey
seals and Atlantic cod on the Scotian Shelf, off the east coast of Nova Scotia.
Mohn and Bowen (1996) modelled the functional response of the seals in two ways: a
linear response and a “constant ration” model (which assumed that the proportion of cod in
the seals’ diet was independent of cod abundance). They found that the model results were
highly dependent on the form of the functional response, but concluded that “seals were not
a major factor in the recent [1993] collapse of this stock”.
Fu et al. (2001) assumed that mortality on cod was proportional to grey seal abundance
(which had been increasing exponentially over the 25 years of their modelling exercise) and
used the same two functional responses as Mohn and Bowen (1996), but also allowed
mortality from other causes to vary between years. They conclude that high natural
mortality of immature and adult cod, much of which appears to be due to grey seal predation,
and low recruitment since the mid-1990s have prevented the recovery of this stock.
5.3.4 Incorporation of marine mammal predation into Multispecies Virtual Population Analysis.
A number of studies have incorporated seal predation into the MSVPA framework.
Livingston and Jurado-Molina (2000) developed an MSVPA model of the Bering Sea
ecosystem involving six prey species and six predators, including northern fur seals. They
found that the resulting estimates of total mortality for the prey species were higher than
those obtained from single-species VPAs, but drew no conclusions about the importance of
fur seal predation in prey dynamics.
The ICES Multispecies Working Group (ICES 1997) implemented an MSVPA model
for the entire North Sea, involving a large number of fish prey species and their predators.
Estimates of species- and size-specific fish consumption by grey seals, seabirds and
cetaceans (mainly harbour porpoise and minke whales) were included in this analysis. The
estimates of prey consumption by fish predators were based on large-scale stomach sampling
programmes conducted in 1981, 1985-87 and 1991. They also obtained higher estimates of
natural mortality, particularly for younger age-classes, than those obtained from
conventional single-species VPAs. Hildén (1988) had shown that shifts in predators
preference for prey over time could undermine the reliability of MSVPA calculations.
However, the Working Group found very little evidence of this in the data from the North
Sea studies. It concluded that the predictions of MSFOR (a multi-species model that uses
values from MSVPA and assumptions about stock-recruitment relationships for individual
fish species to predict future changes in stock sizes) were quite similar to those obtained
122
from single species models, but that single species models may underestimate the time that
depleted stocks may take to recover. They also noted that predator and prey stocks may
follow very different trajectories as a system recovers from over-fishing. As noted in
chapter 3, grey seals do not appear to be a particularly important source of mortality for most
of the fish stocks considered by the Group. The Group also concluded that inadequacies in
the available catch data were probably more important than inadequacies in the diet data, and
therefore did not recommend another large-scale stomach sampling exercise in the North
Sea.
ICES will host a workshop on MSVPA in the North Sea on 8-12 April 2002, but this
will have to rely on seal consumption data that is now more than 15 years old, so it is
unlikely to draw any new conclusions about the importance of grey seal predation in the
North Sea ecosystem.
5.3.5 Steller sea lion and Alaskan pollock Hollowed et al. (2000) developed a MRM of predation on pollock in the Gulf of Alaska
incorporating three predators, one of which was the Steller sea lion, and pollock cannibalism.
As with other MRMs, they obtained estimates of natural mortality on pollock that were
higher than those from single species models.
5.4 Food web models Pimm and Rice (1987) considered the usefulness of food web models for management of
marine resources, and concluded that they were more useful for broad comparisons among
ecosystems rather than for providing specific advice. They also noted that such models often
had serious problems where may predators consumed the same prey species. However, there
have been substantial improvements in the sophistication of marine food web models since
their work.
Yodzis (1998, 2000, 2001a) has cautioned against the usefulness of MRMs. His
extended food-web model of the Benguela Current ecosystem, of which the interaction of the
fur seal with hakes studied by Punt and Butterworth (1995) is a part, included a wide range
of components from bacteria to cetaceans. Yodzis used the model to investigate indirect
interactions (for example the effects that fur seals might have on hakes via their predation on
other fish species) from changing seal numbers, and to see if valid conclusions can be
reached from using only a subset of species in the entire web. The uncertainty of total fish
yields following a cull of fur seals in the context of the entire food web was summarized by
Yodzis (2001a, Figure 2). He concluded that "the qualitative result, that a cull is more likely
to be detrimental than beneficial to the total fishery, is robust with respect to underlying
assumptions” about the inclusion of other prey effects and shape of the interaction functions.
It is certainly true that the expected benefit to all fisheries is substantially less than the
“surplus-yield” and that, for all fisheries combined, there is only a 25-39% probability that
there will be any improvement to yield (Yodzis 1998, Table 1). However, this is not true for
individual species. For hakes, the probability of an improvement in yield to the fishery is
actually quite high (60-80%). The implication is that some fisheries will be winners and
others will lose if a cull was implemented.
Yodzis (1998) also used his model system to investigate the robustness of
conclusions drawn from MRPs. He found that he could capture most of the important
features of the system if he excluded all links that represented less than 10% both by and of
any species. In this way, he could ignore 91 of the 203 links in his system and still make
similar predictions to those obtained with the full system. However, most of the data that are
available to fisheries scientists only provide information on the proportions of different prey
species in the diets of individual species in the system. He concluded that this was a less
satisfactory way of identifying weak (that is, less important) links in the system, but he
123
concluded that most of the important properties of the system could be preserved if all links
that contributed less than 5% of a predators diet were ignored. This reduced the number of
links in the system from 203 to 106. Unfortunately, this is still a much more complex
system than any of the MRPs that have been used so far. These results also imply that MRPs
which follow the guidelines in UNEP (1999) and account for 80% of the predation on the
prey species of interest may not capture all of the important indirect interactions in the
system.
5.5 Energy flux models Given the enormous difficulties in obtaining enough information for the complex, age-
structured population models of the kind developed by Yodzis, an alternative modelling
approach for complete food webs is to use information on biomasses and the flow of organic
matter among components. The Ecosim software (Walters et al. 1997, Pauly et al. 2000)
provides a methodology for investigating the consequences of changes in fishing and
predation ecosystems using this kind of information, although its limitations and
assumptions must be clearly recognized. There have been a number of attempts to use
Ecopath-with-Ecosim to investigate the consequences of changes in marine mammal
numbers on commercial fish stock, some of which we describe here.
5.5.1 Steller sea lions and Alaskan pollock. Trites et al. (1999 in Yodzis 2001a) used Ecosim to investigate the role of fisheries for
Alaskan pollock and commercial whaling for fin whales on the decline of the Steller sea lion
population in the Bering Sea. However, they were “unable to account for the differences
between what was observed in that system in the 1980s and the best available reconstruction
of the state of the system in the 1950s.”
5.5.2 Harp seals and cod on the Newfoundland-Labrador shelf Bundy et al. (2000), compiled available information and indirect estimates of biomass,
consumption, production, and diet of major species and species groups on the
Newfoundland-Labrador shelf during the period 1985-1987. These estimates produced
considerable imbalances in the flows of organic matter within the overall system, at "a time
of relatively constant biomass for the major commercial species." The biomasses and flows
of organic matter among components were balanced using Ecopath. They found that the two
most important predators of small cod were harp seals and large cod, although they
concluded that the former was less important than the latter.
The system has changed radically since that time, most obviously through the great
diminution of cod and other groundfish stocks and an approximate 70% increase in the harp
seal population. The possible impact of these changes between 1985 and 2005 were explored
by Bundy (2001) using Ecosim. She considered a number of different scenarios in which she
simulated changes in fishing mortality on small (<35 cm) and large (>35 cm) cod, American
plaice, and small (<40 cm) and large (>40 cm) Greenland halibut, each year from 1985 to the
1994 moratoria. She also simulated a potential rate of increase in the harp seal biomass by
5% per year. Vulnerabilities to predation were modelled by three situations: (1) all prey
available to predators (top-down control); (2) predation completely constrained (bottom-up
control); (3) only a proportion of prey available to predators (implying the existence of prey
refugia). Given the unstructured pelagic and benthic habitats of eastern Newfoundland, the
top-down situation was considered to be the most likely. This model, combined with a 5%
annual increase in harp seal numbers, gave the best qualitative match to the observed
changes in biomass of system components between 1985 and 2005. Bundy (2001) concluded
that the results were consistent with the hypothesis that the collapse of the northern cod
stocks was due to excess fishing, and “also support the hypothesis that the recovery of cod is
124
currently being retarded by the increased biomass of harps seals due to predation by harp
seals on cod.” However, in the model simulations small and large cod in the model, unlike
those in nature, had recovered to almost half their pre-collapse levels by the year 2000. In
reality, no such recovery has occurred. It should be recognized that these simulations take
no account of uncertainties in the estimates of energy flows between components of the
system and that Ecosim is likely to be more effective at simulating the effects of small
deviations from initial equilibrium conditions, rather than the very large changes that have
occurred on the Newfoundland-Labrador shelf.
5.6 Application of the UNEP guidelines to interactions in the North-East
Atlantic and Baltic Sea.
We have identified four basic interactions between seals and commercial fisheries in the
North-East Atlantic and Baltic which appear to be particularly important to fishers:
x�The indirect effects of predation by grey seals on commercial catches, and the
recovery, of cod stocks in the North Sea.
x�The indirect effects of predation by grey seals and harbour seals in estuaries and in the
open sea on the recovery of Atlantic salmon stocks.
x�The direct effects of grey seals, and possibly harbour seals, on a range of different
fisheries for salmon.
x�The direct effects of grey seals on bottom-set gillnet fisheries for monkfish in the
Celtic and Irish Seas, and off South-West England.
In this chapter we will attempt to evaluate these interactions using the protocol for the
scientific evaluation of proposals to cull marine mammals developed by the Scientific
Advisory Committee of the Marine Mammals Action Plan of UNEP (UNEP 1999). In
particular, we will see if the data that are available match those listed in Table 2 of the
UNEP protocol. This identifies five areas where data are required: 1. basic information on
the marine mammal populations, the target fish species, the fisheries involved, and the
geographical area of concern; 2. cull objectives; 3. ecological information; 4. fisheries data
on catches, bycatches, management systems and economics; and 5. the culling programme.
As we have shown in Chapters 2 and 3, there is extensive basic information on the marine
mammal and fish species involved in all of the interactions listed above, and we will not
review this further here. Culls are being undertaken in relation to the perceived indirect
effect of grey seals on fish stocks off the Norwegian coast, and in the Baltic to reduce
damage to salmon and other whitefish fisheries. However, none of the detailed
documentation relating to these culls is currently available in an English translation and we
have not, therefore, been able to evaluate these plans against the criteria listed in Table 2 of
the UNEP protocol.
5.6.1 Indirect effects of grey sealson cod in the North Sea Fishermen in the UK and Norway have complained about the potential effects of increasing
grey seal numbers on cod stocks in the North Sea for many years. The abortive attempt to
reduce the size of the UK grey seal population in 1977 and 1978 was justified on the basis of
these arguments, and fishermen’s organisations in the UK are still lobbying for a renewal of
these culls. Norway has recently increased the annual quotas for grey and harbour seals in
its coastal waters by 30%. They now exceed the calculated replacement yield for these
populations, and therefore these quotas must be regarded as an attempt to reduce the size of
the population. We have not been able to locate any documentation justifying this increase,
but the Norwegian fisheries minister has appeared on Scottish television claiming, at least in
translation, that there is “no doubt that seals threaten the country’s fish stocks”.
125
For UK grey seals there are good data on grey seal population size, per capita food and
energy consumption, and total food consumption. The available data on diet composition
dates back to the mid-1980s when the composition of North Sea fish stocks was very
different from what it is now. There is extensive information on the target fish species, and
on other predators of this species but the development of a 2-way matrix of ‘who eats whom’
in this system is hampered by the quality of the seal diet information and the quality of the
information on total catches (including bycatch and discards) of all of the fish species that
interact with cod.
Estimates of the size of the Norwegian grey seal population and of the diet of these
seals is much less extensive than for the UK.
We therefore conclude that all of the data required to evaluate any proposal to cull grey
seals in the North Sea is not currently available. The situation, at least for UK seals, will be
substantially improved when the results of new studies of grey seal diet become available
(probably in 2004), and when the ICES MSVPA workshop has had an opportunity to
evaluate the quality of the current information on total fisheries removals. For the
Norwegian situation, better information on grey seal numbers and diet is required. However,
Norwegian seals are a small component of the total North Sea stock, and it seems that the
problems experienced in Norway are primarily local ones which are not easily analysed
using any of the frameworks described in the earlier sections of this Chapter.
5.6.2 Indirect effects of seals on Atlantic salmon Salmon fishermen have also complained for decades about the potential impact of seal
predation, particularly in estuaries, on the recovery of salmon stocks. Indeed, the culls of UK
grey seals that were instigated in the 1960s were primarily driven by complaints from
salmon fishermen. There is no doubt that grey seals prey, often very visibly, on salmon in
estuaries and the lower reaches of rivers, but there is almost no data on the levels of
mortality caused by this predation. A more comprehensive evaluation of the causes and
consequences of mortality on salmon at all stages of its life cycle, and of the likely benefits
in terms of time to recovery from different management approaches, is required before all of
the criteria listed in the UNEP protocol can be met for this interaction.
5.6.3 Direct effect of grey seals on salmon fisheries The most detailed studies of the effects of grey seals around salmon fishing gear have been
carried out along the Swedish coast, particularly looking at interactions around salmon traps.
Lunneryd and Westerberg (1997) estimated levels of seal damage in this fishery and
calculated that up to 50% of the catch was damaged. The economic costs of this damage and
indirect costs through changes in fishing practice and damage to gear have been estimated at
around 5 million Euros per year (Westerberg et al. 2000). Reports of damage have been
increasing by approximately 15% per year; much faster than the rate of increase of the grey
seal population. Attempts to reduce the problem by shooting seals in the immediate vicinity
of fish traps resulted in no significant reduction in seal damage, but scaring devices were
more effective (Westerberg 2001). Gear modifications to reduce the vulnerability of salmon
to attacks by seals in and around traps have, however, been very effective (Lunneryd et al.,
in press; Westerberg 2001). However, these modifications cannot be applied to drift net
fisheries for salmon and herring which also suffer from seal damage.
As noted in Chapter 2, both Sweden and Finland have begun issuing licences for seal
hunting. In Sweden, regional quotas are related to the reported levels of damage to fisheries
rather than the size of the local seal population. They must therefore be regarded as culls.
However, there appears to have been no evaluation of the likely effects of these culls on
fisheries damage. If the results of Westerberg’s experiments apply generally, any benefits
are unlikely to be detectable.
126
The UNEP protocol was not designed for the analysis of direct interactions between
seals and local fisheries, and it is impossible to use the data requirements listed in the
protocol to evaluate the available evidence on this interaction. However, we note that there
are no published data on the current diet of grey seals in the Baltic, although some work on
fatty acid signatures has been conducted (M. Biuw, pers. comm.).
5.6.4 Direct effects of grey seals on monkfish fisheries Arnett (2001) and Westcott (2000) report high levels of damage in gillnet fisheries for
monkfish off the west coast of Ireland and South-West England, respectively, which are
believed to be caused by grey seals. There is no evidence that monkfish form a major part of
the diet of gey seals in either area, but hard parts of this species will be difficult to detect in
stomachs or faeces. This is another direct interaction which is difficult to analyse under the
UNEP protocol. However, we note that the available information on the diet and size of the
grey seal populations in these two areas is of much poorer quality than that available for
other parts of the grey seal’s range in the North-East Atlantic.
127
6. Interactions between marine mammals and fisheries in other parts of the world.
UNEP (1999) lists nearly 30 instances of then current or historical culls of marine mammals
due to interactions with fisheries. Nearly half of these are in the North-East Atlantic. There
have been few additions to this list since it was compiled in the mid-1990s. The Canadian
government has sometimes claimed that the commercial harvest of harp seals is, at least in
part, designed to reduce predation on fish stocks, particularly cod. However, the aim of that
management is to take the replacement yield of seals (that is, maintain the population at its
current level), and so it is unlikely to reduce predation. Claims that the current quota
exceeds the replacement yield because it does not take adequate account of animals killed
but not landed do not seem to be justified (see MacLaren et al. 2002).
Although there is growing concern elsewhere in the world about the potential effects
of marine mammal predation on fisheries yields (see references in Yodzis 2001a), no culls
have yet been implemented to address these concerns.
However, in at least two cases, modifications in fisheries practice to protect
endangered species or populations from the indirect effects of fisheries. In particular, the US
National Marine Fisheries Service has recently published a series of Biological Opinions
which conclude that the fisheries for Alaskan pollock, Atka mackerel and Pacific cod in the
Berring Sea and Gulf of Alaska are adversely modifying habitat for the endangered western
stock of Steller sea lions. As a result the North Pacific Fisheries Management Council has
been required to develop “reasonable and prudent” alternative management approaches for
these fisheries aimed at reducing this adverse modification. Similar advice is being
considered about lobster fisheries around Hawaiian because of their potential role in the
decline of the critically endangered Hawaiian monk seal.
128
7. Bibliography
Adlerstein, S.A. and Welleman, H.C. 2000. Diel variation of stomach contents of North Sea
cod during a 24hr fishing survey: an analysis using generalized linear models. Can. J. Fish. Aquat. Sci. 57: 2363-2367.
Alfonso-Dias, I.P. and Hislop, J.R.G. 1996. The reproduction of anglerfish Lophius piscatorius Linnaeus from the north-west coast of Scotland. J Fish Biol 49: 18-39.
Anderson, J.M., Whoriskey, FG. and Goode, A. 2000. Atlantic salmon on the brink. ICES Newsletter 17: 15-21.
Anderson, J.T. and Gregory, R.S. 2000. Factors regulating survival of northern cod during
the first three years of life. ICES J. Mar. Sci. 57: 349-359.
Anon. 1998. Feeding ecology of the North Sea fish with emphasis on the database of
stomach sampling projects for use in multispecies assessment. Final Report
CONTRACT AIR3-CT94-2410.
Arnett, R. 2001 Studies on the diet of the grey seal (Halichoerus grypus) and interactions
with local fisheries on the west coast of Ireland. Unpublished PhD Thesis. Department
of Environmental Resource Management, University College Dublin, pp. 207.
Berg, I., Haug, T. and Nilssen, K. 1999. Harbour seal (Phoca vitulina) in Vesterhalen, North
Norway: Diet composition as determined from stomach and faeces samples. Working
Paper 99/4 for the ICES Working Group on Marine Mammal Population Dynamics.
Bjoernsson, H. 1997. Calculating capelin consumption by Icelandic cod using a spatially
Crooks, K.R. and Soule, M.E. 1999. Mesopredator release and avifaunal extinctions in a
fragmented system. Nature 400: 563-566
Duarte, R., Azevedo, M. and Pereda, P. 1997. Study of the growth of southern black and
white monkfish stocks. ICES J. Mar. Sci. 54: 866-874
Ellis, T. and Nash, R.D.M. 1997. Predation by sprat and herring on pelagic fish eggs in a
plaice spawning area of the Irish Sea. J. Fish. Biol. 50: 1195-1202.
Flaaten, O. 1988. The Economics of Multispecies Harvesting. Springer-Verlag. Berlin,
Germany.
Flaaten, O. and Stollery, K. 1996. The economic costs of biological predation. Envir. Res. Econ. 8: 75- 95.
Folkow, L.P., Blix, A.S. 1995. Distribution and diving behaviour of hooded seals. In:
Whales, Seals, Fish and Man. (Blix, A.S., Walløe, L., Ultang, Ø. Eds.), Elsevier
Science, Amsterdam.
Folkow, L.P., Martensson, P-E., and Blix, A.S., 1996. Annual distribution of hooded seals
(Cystophora crystata) in the Greenland and Norwegian Seas. Polar Biol. 16:179-189.
Fu, C., Fanning, P. and Mohn, R. 2001. Population dynamics of Atlantic cod (Gadus morhua) in NAFO area 4VsW. Can. J. Fish. Aquat. Sci. 58: 1613-1623.
Gulland, J.A. 1965. Estimation of mortality rates. Annex to Arctic Fisheries working group
report. ICES CM No 3:1
Gulland, J.A. 1987. Seals and fisheries: A case for predator control? Trends. Ecol. Evoln. 2:
102-104.
Hammill, M.O., Carter, P. and Stenson, G. 2000. Estimated consumption of Atlantic cod
(Gadus morhua) by grey seals (Halichoerus grypus) and harp seals (Phoca groenlandica) in 4T. (Unpublished MS prepared for 2000 stock estimates in Div. 4T)
Hammill, M.O. and Stenson, G.B. 2000. Estimated prey consumption by harp seals (Phoca groenlandica), hooded seals (Cystophora cristata), grey seals (Halichoerus grypus) and
harbour seals (Phoca vitulina) in Atlantic Canada. J. Northw. Atl. Fish. Sci. 26: 1-23.
Hammond, P. and Fedak, M.A. (eds.) 1994. Grey seals in the North Sea and their interactions with fisheries. Final Report to the UK Ministry of Agriculture, Fisheries
and Food on Contract MF0503. Sea Mammal Research Unit, Cambridge.
Hammond, P.S., Hall, A.J. and Prime, J.H. 1994a. The diet of grey seals around Orkney and
other island and mainland sites in northeastern Scotland. J. appl. Ecol. 31: 340-350.
Hammond, P.S., Hall, A.J. and Prime, J.H. 1994b. The diet of grey seals in the Inner and
Outer Hebrides. J. appl. Ecol. 31: 737-746.
Hammond, P.S., Hall, A.J. and Arrizabalaga, B. 1997. Fish consumption by grey seals in the
North Sea. Working Paper to the ICES Working Group on Multispecies Assessment.
Hammond, P.S. and Rothery, P. 1996. Application of computer sampling in the estimation of
seal diet. J. Appl. Stat. 23: 525-533.
Hammond, T., and O'Brien, C., 2001. An application of the Bayesian approach to stock
assessment model uncertainty. ICES J. Mar. Sci. 58:648-656.
Hårding, K., and Härkönen, T., 1999. Development of the Baltic grey seal (Halichoerus grypus) and ringed seal (Pusa hispida) populations during the 20th century. Ambio 28:
619-627
Härkönen, T. 1987. Seasonal and regional variations in the feeding habits of the harbour
seal, Phoca vitulina, in the Skagerrak and the Kattegat. J. Zool., Lond. 213: 535-543.
Härkönen T, 1988. Food-habitat relationship of harbour seals and black cormorants in
Skagerrak and Kattegat. J. Zool., Lond 214: 673-681.
Härkönen, T. and Heide-Jørgensen, M-P. 1991. The harbour seal Phoca vitulina as a
Harwood, J., and Greenwood, J.D.D. 1985. Competition between British grey seals and
fisheries. In Marine Mammals and Fisheries (Beddington, J.R., Beverton, R.J.H., and
Lavigne, D.M. eds.). George Allen & Unwin, London. Pp 153-169.
Haug, T., Kroyer, A., Nilssen, K., Ugland, K., and Aspholm, P., 1991. Harp seal (Phoca groenlandica) invasions in Norwegian coastal waters: age composition and feeding
habits. ICES J. Mar. Sci. 48:363-371.
Haug, T., and Nilssen, K., 1995. Ecological implications of harp seal Phoca groenlandica
invasions in northern Norway. In: Whales, seals, fish and man (Blix A, Walløe L, and
Ulltang Ø, eds). Elsevier Science. Pp 545-556.
Heide-Jørgensen, M-P., Härkönen, T., Dietz, R. and Thompson, P.M. 1992. Retrospective of
the 1988 European seal epizootic. Diseases Aquat. Org. 13: 37-62.
Helander, B. 2000. Grasal. Bottniska viken 1999. Arsrapport fran den marina
overvakningen. Unpublished report, Riksmuseet, Stockholm.
Hiby, L., Lundberg, T., Karlsson, O., Watkins, J., and Helander, B., 2001. An estimate of the
size of the Baltic grey seal population based on photo-id data. Unpublished report,
Conservation Research Ltd, Cambridge. Pp 46.
Hickling, G., Hawkey, P., and Harwood, L.. 1976. The grey seals of the Farne Islands: The
of cod on the fatty acid signature of whole Atlantic cod (Gadus morhua). Can. J. Fish. Aquat. Sci. 55: 1378-1386.
Kornilovs, G., Sidrevics, L. and Dippner, J.W. 2001. Fish and zooplankton interaction in the
Central North Sea. ICES J. Mar. Sci. 58: 579-588.
Koster, F.W. and Mollman, C. 2000. Trophodynamic control by clupeid predators on
recruitment success in Baltic cod. ICES J. Mar. Sci. 57: 310-323
Lawson, J.W. and Hobson, K.A. 2000. Diet of harp seals in nearshore northeast
Newfoundland: inferences from stable-carbon ( 13C) and nitrogen ( 15
N) isotope
Livingston, P., and Jurado-Molina, P., 2000. A multispecies virtual population analysis of
the eastern Bering Sea. ICES J. Mar. Sci. 57: 294-299.
Lunneryd, S.G. and Westerberg, H. 1997. By-catch of, and gear damages by, grey seals
(Halichoerus grypus) in Swedish waters. ICES CM 1997/Q:11.
Lunneryd, S.G., Westerberg, H. and Wahlberg, M. (in press) Detection of leader net by
whitefish Coregonus lavaretus during varying environmental conditions. Fish. Res. MacLaren, A., Brault, S., Harwood, J. and Vardy, D. 2002. Report of the Eminent Panel on
Seal Management. Department of Fisheries and Oceans, Ottawa, Canada.
Messieh, S., Powles, H. and Côté, G. 1979. Food and feeding of the Atlantic herring (Clupea harengus L.) in the Gulf of St. Lawrence and adjacent waters. Can. Atl. Fish. Stock Assess. Res. Doc. 79/15.
Mikkelsen, B. and Haug, T. 1999. Summer diet of grey seal in Faroese waters. Working
Paper 99/3 for ICES Working Group on Marine Mammal Population Dynamics
Mohn, R. and Bowen, W. 1996. Grey seal predation on the eastern Scotian Shelf: modelling
the impact on Atlantic cod. Can. J. Fish. Aquat. Sci. 53: 2722-2738.
Neuenfeldt, S. and Koster, F.W. 2000. Trophodynamic control on recruitment success in
Baltic cod: the influence of cannabalism. ICES J. Mar. Sci. 57: 300-309
Nilssen, K., Grøtnes, P., and Haug, T., 1992. The effect of invading harp seal (Phoca groenlandica) on local coastal fish stocks of North Norway. Fish. Res. 13: 25-37.
Olsen, M. and Bjørge, A. 1995. Seasonal and regional variations in the diet of harbour seal
in Norwegian waters. In: Whales, Seals, Fish and Man. (Blix, A.S., Walløe, L. and
Overholtz, W.J., Murawski, S.A. and Foster, K.I. 1991. Impact of predatory fish, marine
mammals, and seabirds on the pelagic fish ecosystem of the northeastern USA. ICES Mar. Sci. Symp. 193: 198-208.
132
Pauly, D., Christensen, V. and Walters, C. 2000. Ecopath, Ecosim, and Ecospace as tools for
evaluating ecosystem impact of fisheries. ICES J. Mar. Sci. 57.
Pierce, G.J., Diack, J.S.W. and Boyle, P.R. 1990. Application of serological methods to
identification of fish prey in diets of seals and dolphins. J. Exp. Mar. Biol. Ecol. 137:
123-140.
Pimm, S., and Rice, J.C., 1987. The dynamics of multispecies, multi-life-stage models of
aquatic food webs. Theor. Pop. Biol. 32: 303-325.
Punt, A.E. and Butterworth, D.S. 1995. The effects of future consumption by the Cape fur
seal on catches and catch rates of the Cape hakes. 4. Modelling the biological interaction
between Cape fur seals Arctocephalus pusillus pusillus and the Cape hake Merluccius capensis and Merluccius paradoxus. S. Afr. J. Mar. Sci. 16: 255-285.
Savenkoff, K., Vézina, A.F. and Bundy, A. 2001. Inverse analysis of the structure and
dynamics of the whole ecosystem in the Newfoundland-Labrador Shelf. Can. Tech. Rep. Fish. Aquat. Sci. 2354, 56 p.
Seynan, K. and Grove, D.J. 1998. Food consumption of whiting in the eastern Irish Sea.
Fish. Res. 38: 233-245.
Shelton, P.A., Warren, W.G., Stenson, G.B. and Lawson, J.W. 1997. Quantifying some
major sources of uncertainty associated with estimates of harp seal prey consumptions.
Part II: Uncertainty in consumption estimates associated with population size, residency,
energy requirements, and diet. J. Northw. Atl. Fish. Sci. 22: 303-315.
Shetland Sea Mammal Group 2001. http://www.wildlife.shetland.co.uk
Smith, S.J., Iverson, S.J. and Bowen, W.D. 1997. Fatty acid signatures and classification
trees: new tools for investigating the foraging ecology of seals. Can. J. Fish. Aquat. Sci. 54: 1377-1386.
Stefánsson G, Sigurjónsson J, Víkingsson G, 1997. On dynamic interactions between some
fish resources and cetaceans off Iceland based on a simulation model. J. Northw. Atl. Fish. Sci. 22: 357-370.
Stenson, G.B. and Perry, E. 2001. Consumption of Atlantic cod (Gadus morhua), Capelin
(Mallotus villosus) and arctic cod (Boreogadus saida) by harp seals (Pagophilus groenlandicus) in NAFO Divisions 2J3KL. Working paper 2001/21, Newfoundland
Groundfish Assessment, 12-23 March 2001.
Summers, C.F. 1978. Trends in the size of British grey seal populations. J. appl. Ecol.15:
395-400.
Summers, C., and Harwood, J. 1979. The Grey seal 'problem' in the Outer Hebrides. Proc. Royal Soc. Edinburgh 77B: 495-503.
Swain, D.P. and Sinclair, A.F. 2000. Pelagic fishes and the cod recruitment dilemma in the
northwest Atlantic. Can. J. Fish. Aquat. Sci. 57: 1321-1235.
Thompson, P.M., McConnell, B.J., Tollit, D.J., Mackay, A., Hunter, C. and Racey, P.A.
1996. Comparative distribution, movements and diet of harbour and grey seals from
the Moray Firth, NE Scotland. J. appl. Ecol. 33: 1572-1584.
Tjelmeland, S. and Bogstad, B. 1998. MULTSPEC – a review of a multispecies modelling
project for the Barents Sea. Fish. Res. 37: 127-142.
Trites, A.W., Christiansen, V. and Pauly, D. 1997. Competition between fisheries and
marine mammals for prey and primary production in the Pacific Ocean. J. Northw. Atl. Fish. Sci. 22: 173-187.
Ugland, K., Jødestøl, K., Aspholm, P. E., Krøyer, A., and Jakobsen, T., 1993. Fish
consumption by invading harp seals off the Norwegian coast in 1987 and 1988. ICES J. Mar. Sci. 50: 27-38.
Uzars, D. and Plikshs, M. 2000. Cod cannabalism in the Central Baltic: interannual
variability and influence of recruit abundance and distribution. ICES J. Mar. Sci. 57: