54
Jeffrey Heer @jeffrey_heer U. Washington / Trifacta INTERACTIVE Data Analysis

Jeffrey Heer @jeffrey_heer U. Washington / Trifacta
I N T E R A C T I V E Data Analysis


How might our tools help us to become better analysts?

What makes a visualization “good”?

A Quick Experiment…
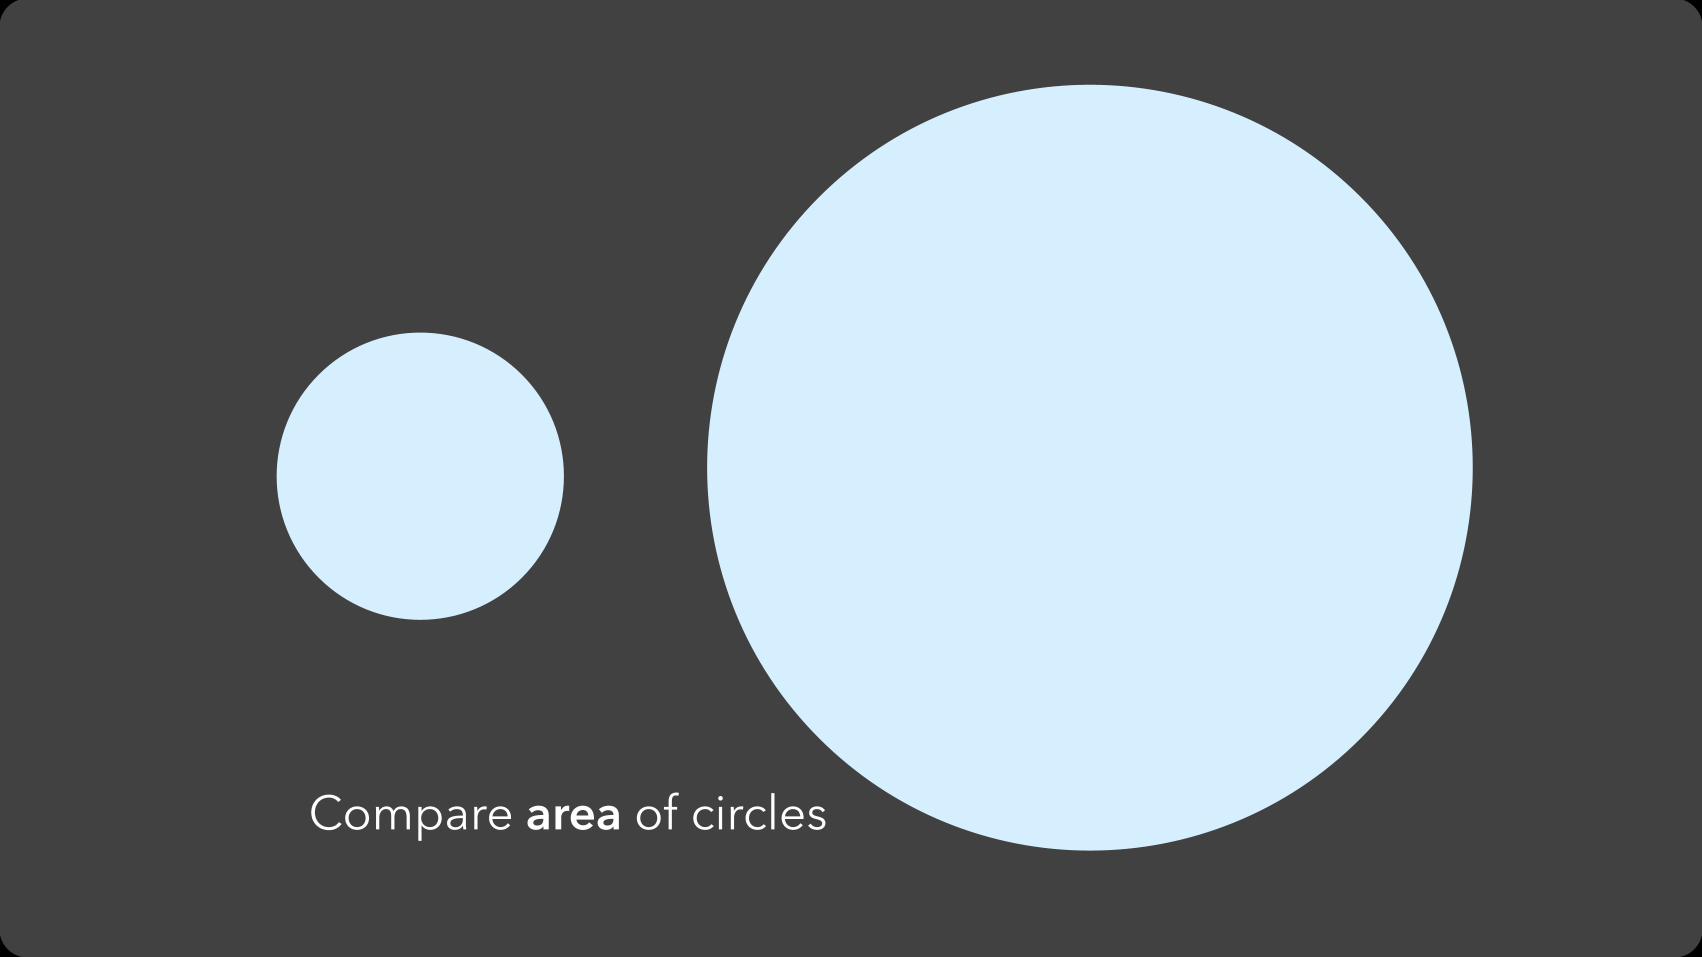
Compare area of circles

Compare length of bars

Compare area of circles
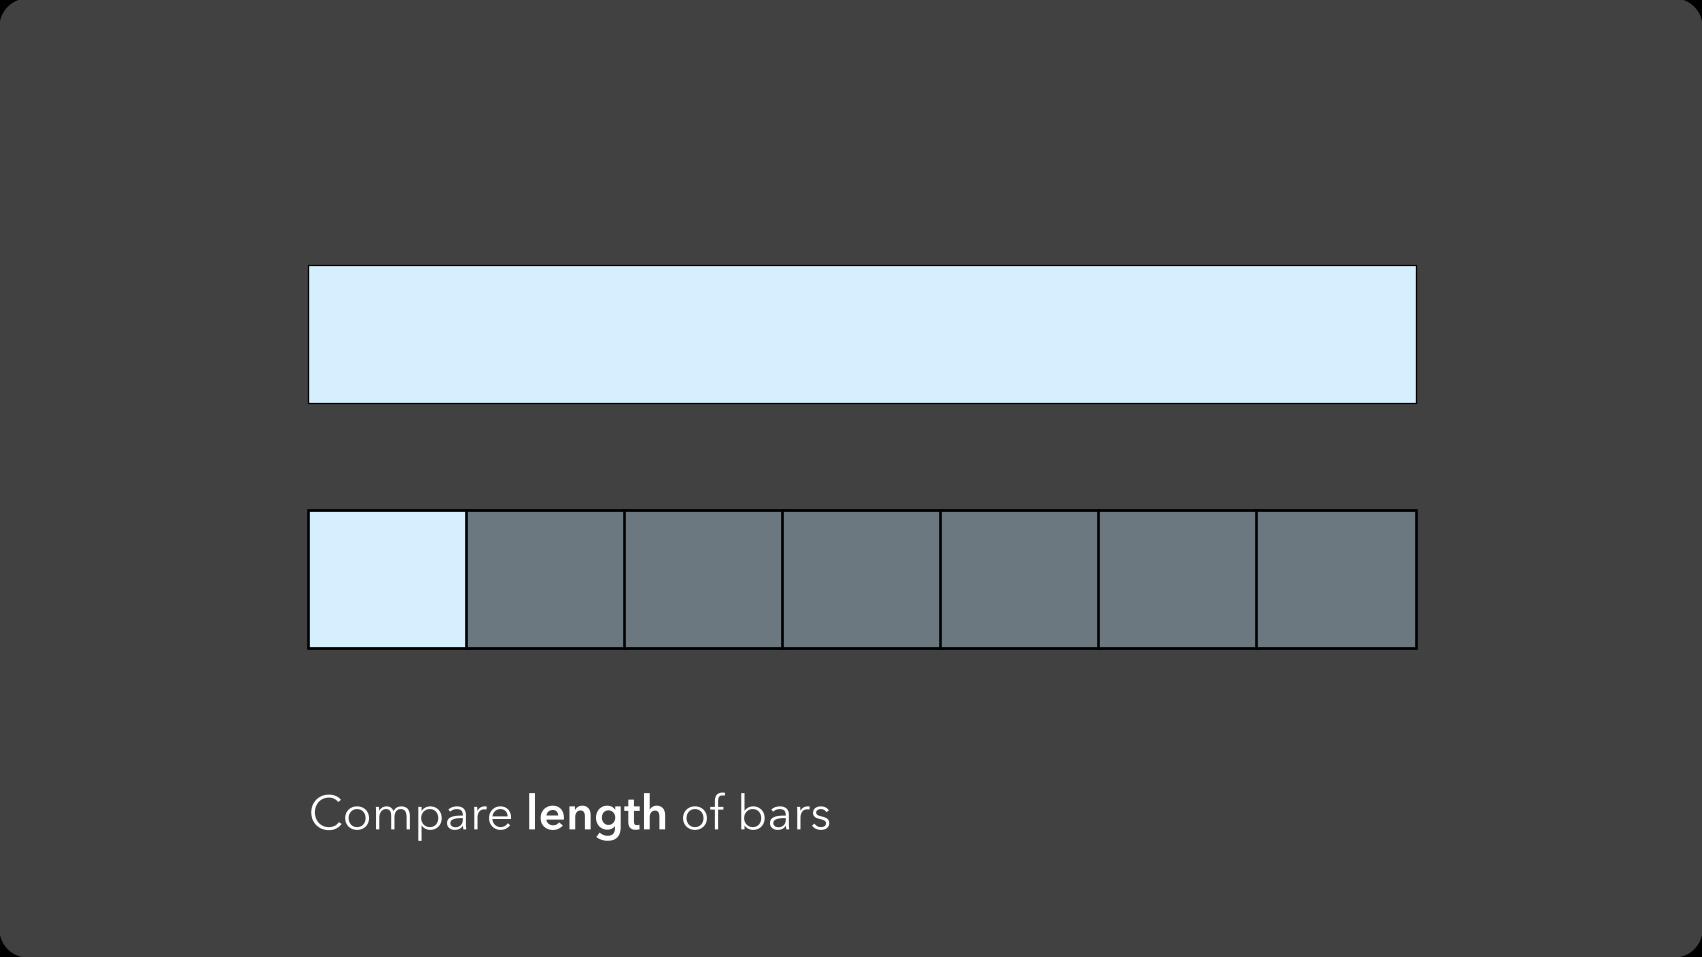
Compare length of bars

Log(Estimation Error)
Position 1 Position 2 Position 3 Length 1 Length 2 Angle Area (Circular) Area (Rect 1) Area (Rect 2)
Accuracy of Visual Decoding

Most accurate Position (common) scale Position (non-aligned) scale
Length
Slope
Angle Area
Volume
Least accurate Color hue-saturation-density
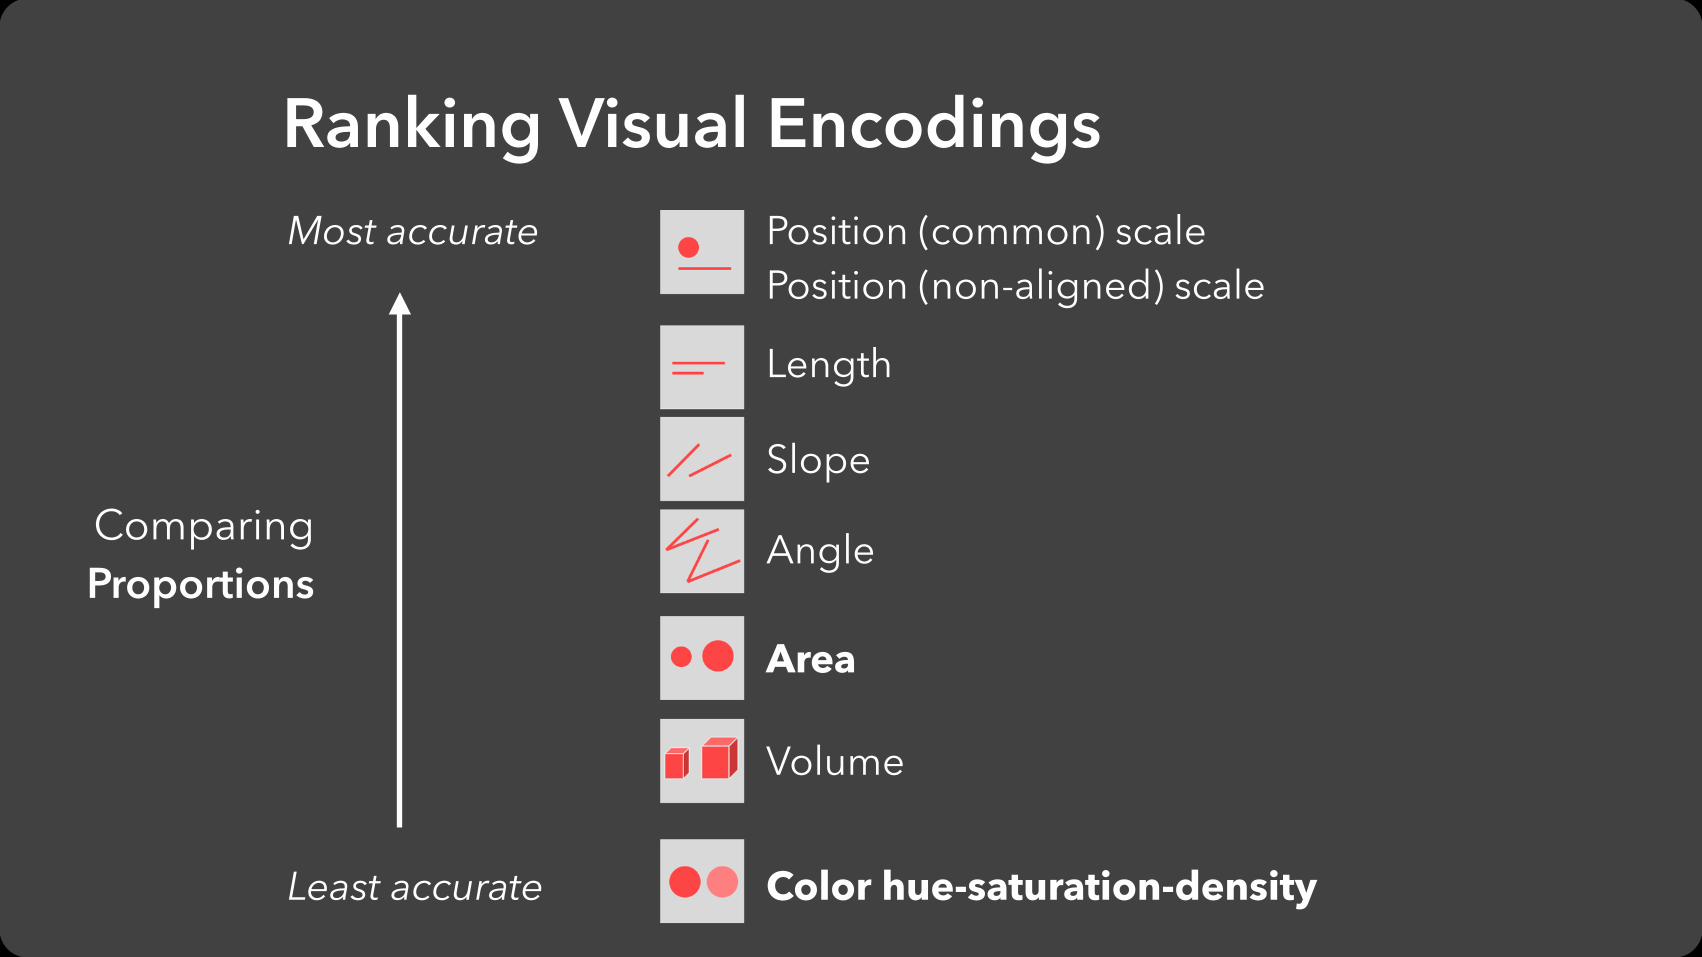
Ranking Visual Encodings
Comparing Proportions


Most accurate Position (common) scale Position (non-aligned) scale
Length
Slope
Angle Area
Volume
Least accurate Color hue-saturation-density
Ranking Visual Encodings
Comparing Proportions
Most accurate Position (common) scale Position (non-aligned) scale
Length
Slope
Angle Area
Volume
Least accurate Color hue-saturation-density
Ranking Visual Encodings
Comparing Proportions


Artery Visualization [Borkin et al. 2011]
Rainbow Palette Diverging Palette
2D
3D

Artery Visualization [Borkin et al. 2011]
Rainbow Palette Diverging Palette
2D
3D
92%62%
71%39%
How might we support more effective data exploration?

Violent Infants! Marauding
Centenarians!???

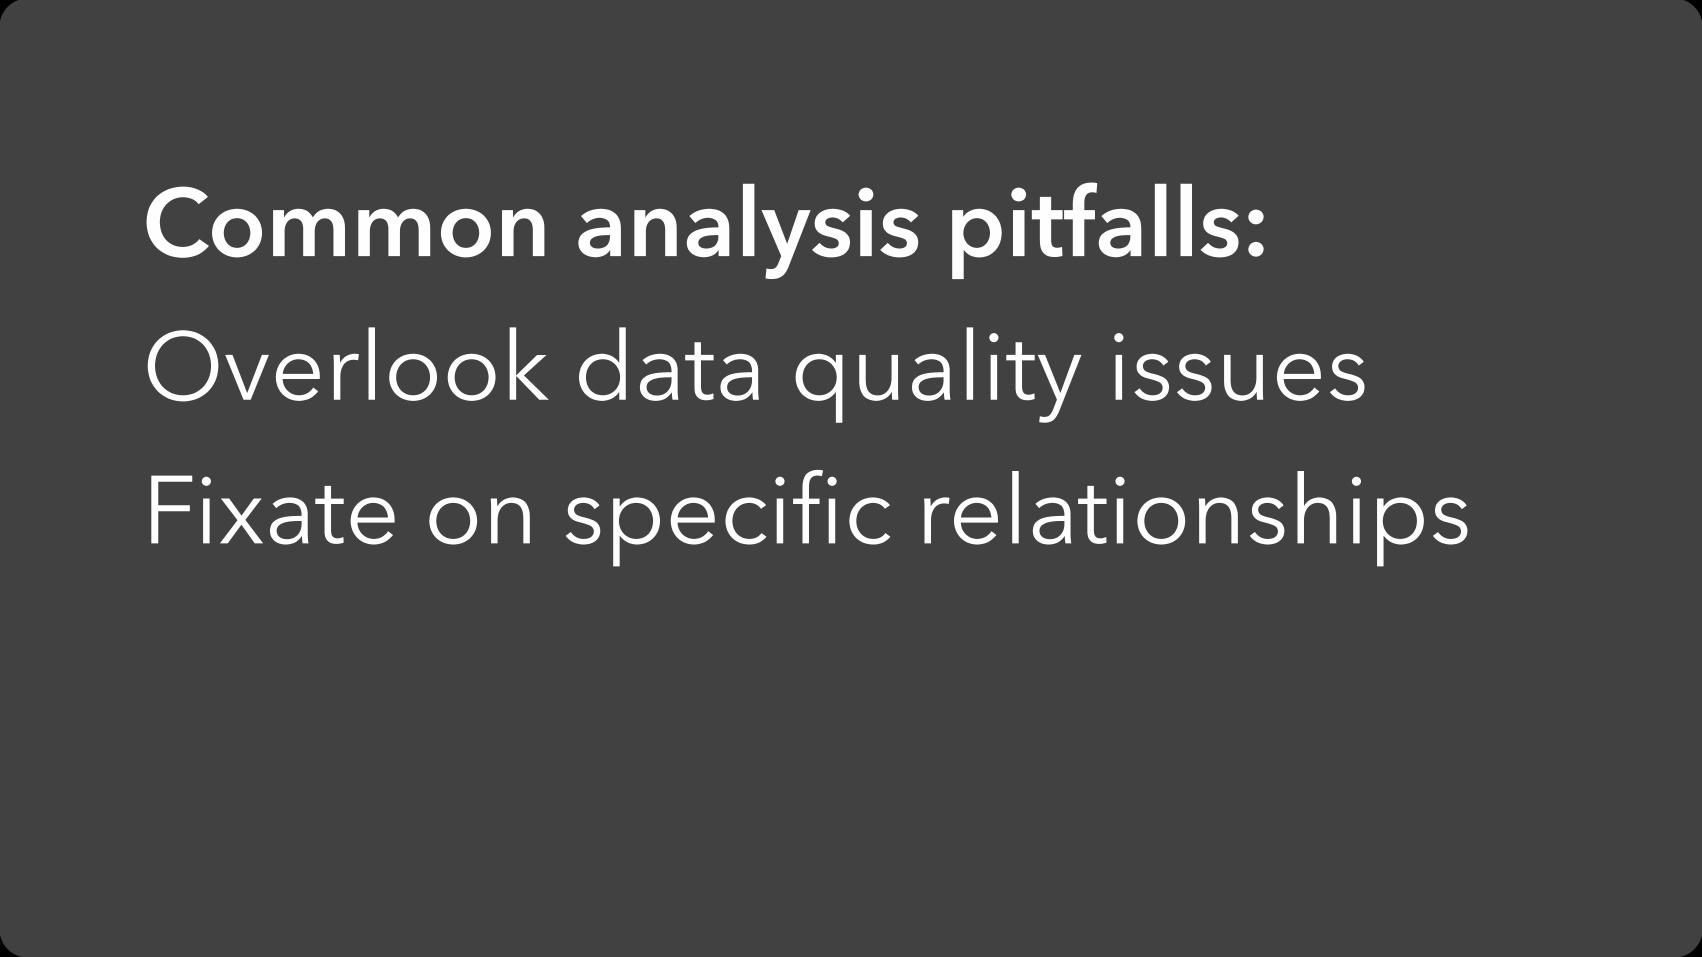
Common analysis pitfalls: Overlook data quality issues Fixate on specific relationships

Common analysis pitfalls: Overlook data quality issues Fixate on specific relationships Plus many other cognitive biases [Heuer 1999, Kahneman 2011, …]

Voyager: Combine Manual Specification with Visualization Recommenders

Voyager: Combine Manual Specification with Visualization Recommenders
Compared to existing tools, leads to over 4x more variable sets seen, and over 2x more variable sets interacted with.
“The related view suggestion accelerates exploration a lot.”
“I like that it shows me what fields to include in order to see a specific graph. Otherwise, I have to do a lot of trial and error and can't express what I wanted to see.”
“These related views are so good but it’s also spoiling that I start thinking less. I’m not sure if that’s really a good thing.”

Visualization

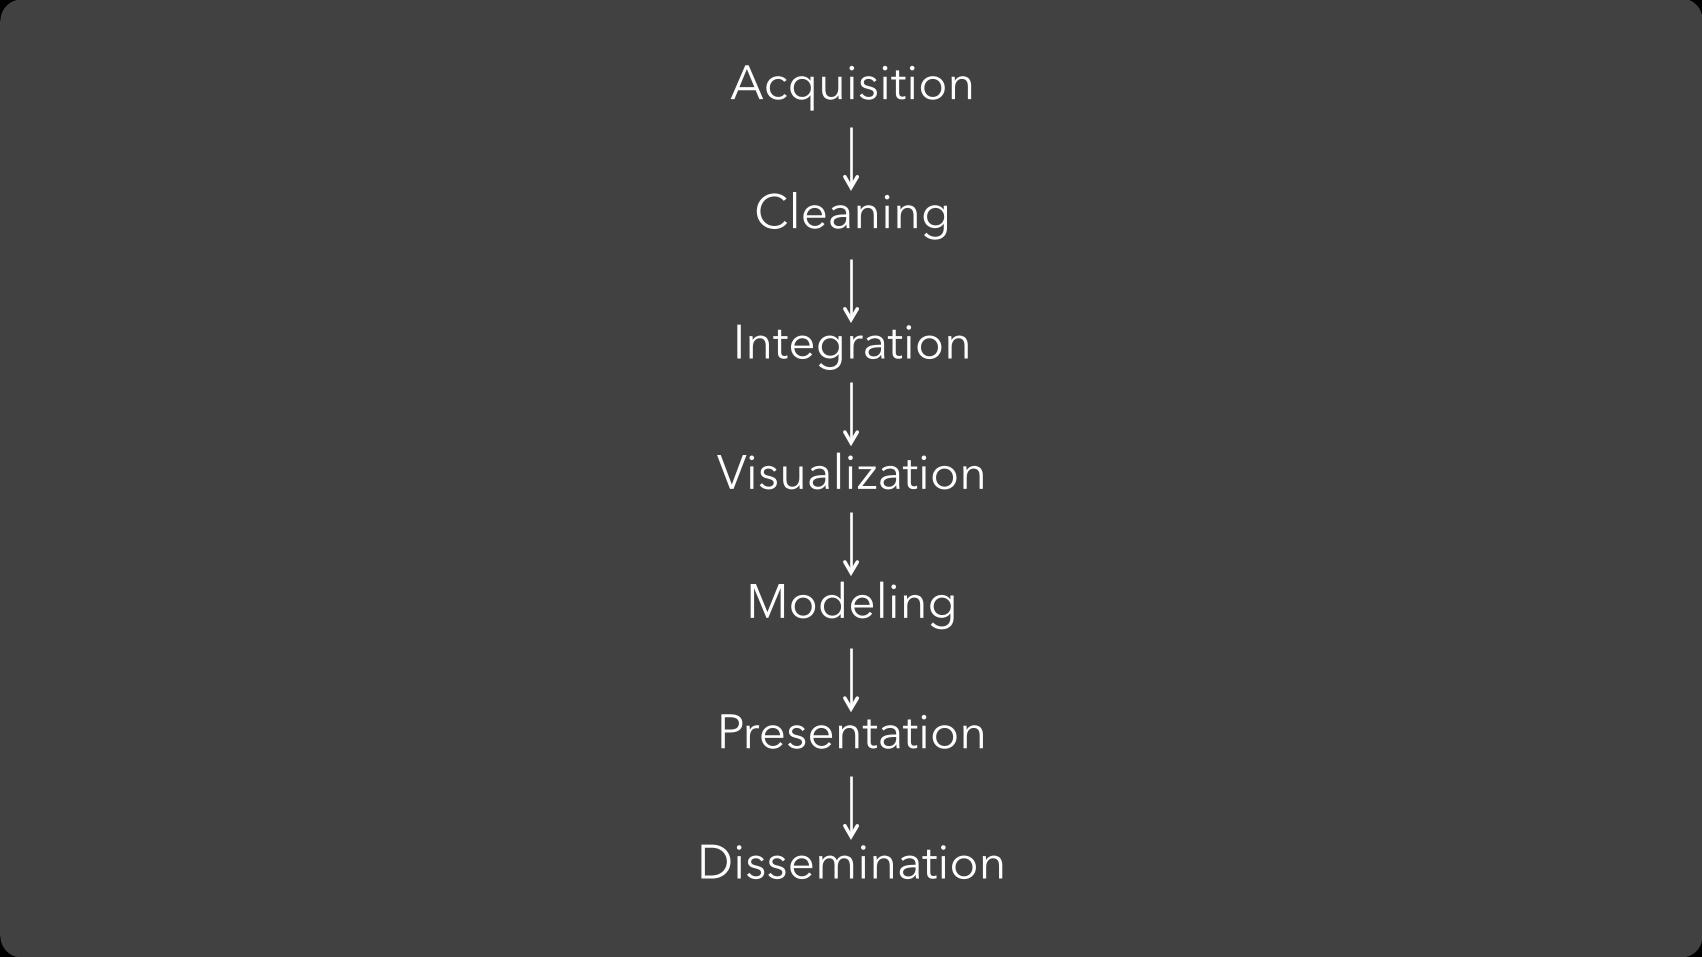
Acquisition
Cleaning
Integration
Modeling
Visualization
Presentation
Dissemination
Acquisition
Cleaning
Integration
Modeling
Visualization
Presentation
Dissemination

Acquisition
Cleaning
Integration
Modeling
Visualization
Presentation
Dissemination

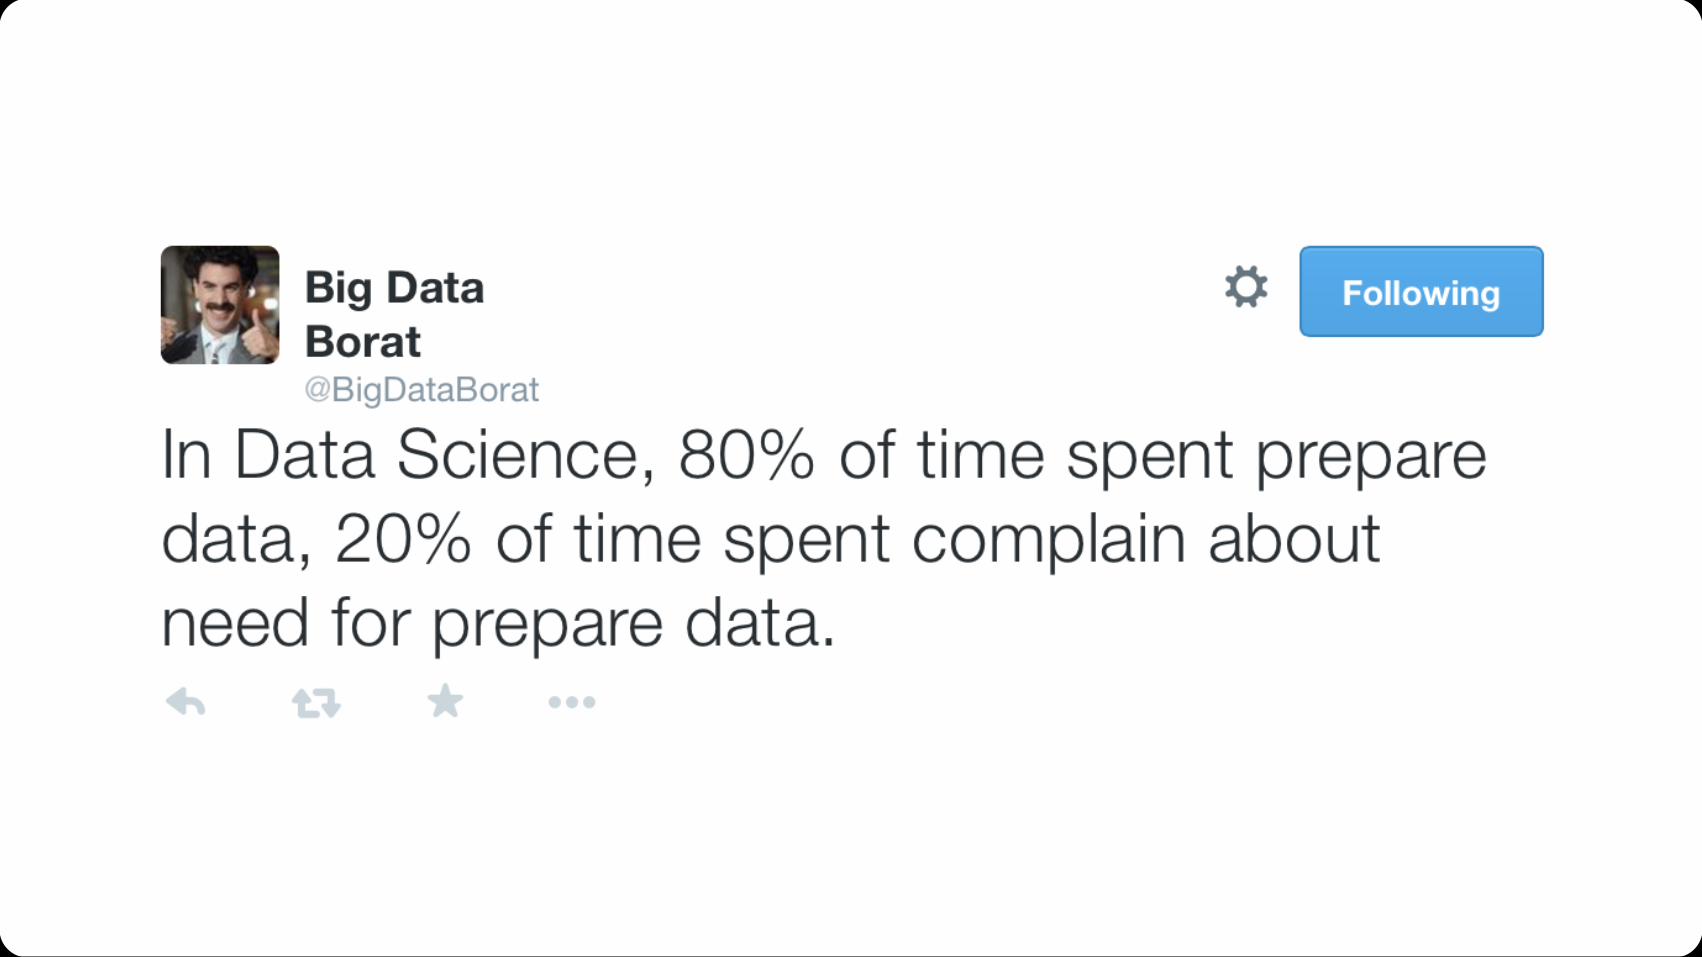
I spend more than half of my time integrating, cleansing and transforming data without doing any actual analysis. Most of the time I’m lucky if I get to do any “analysis” at all.
Anonymous Data Scientist from our 2012 interview study


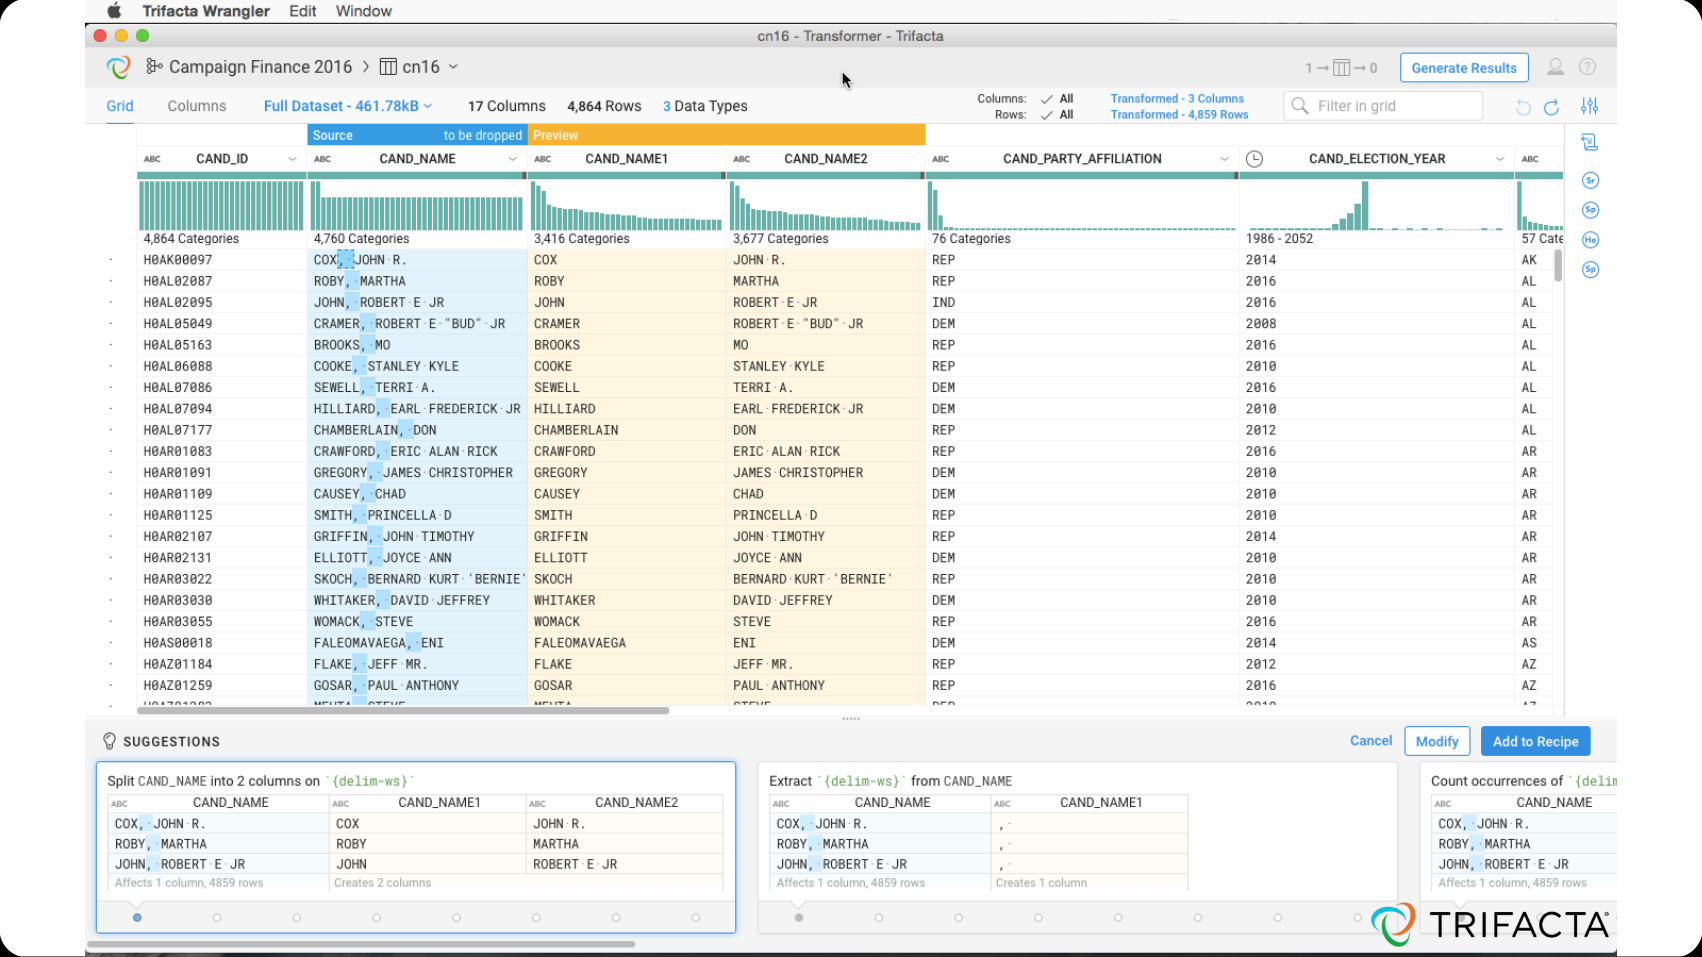
How might we transform data without writing code?


DataWrangler
Wrangler: Interactive Visual Specification of Data Transformation Scripts Sean Kandel et al. CHI’11


Visualization and Interaction
Data Transformation Code
User authors a draft
transformation script
User tests the script on a small
amount of data
User inspects output data to
assess effects
1. 2.
3.
Traditional Specification

Visualization and Interaction
Data Transformation Code
User highlights
features of a data
visualization
Data previews allow user to
choose, adjust
and confirm
Algorithms
predict intended
transformations.
1. 3.
2.
Predictive Interaction

Parting Thoughts

Acquisition
Cleaning
Integration
Modeling
Visualization
Presentation
Dissemination

A careful balance of automation and control. Pitfalls of automation: Loss of agency, intuition & domain expertise. Consequences of poor models let loose in the world. Pitfalls of user control: Cognitive biases, blinder vision, mistakes. Enhance interfaces with models of capabilities, actions & goals to present relevant options. Models adapt over time: interfaces that learn. Requires means to inspect, monitor & audit models!
Implications for Interaction Design


Jeffrey Heer @jeffrey_heer http://idl.cs.washington.edu
I N T E R A C T I V E Data Analysis


![Exploratory Data Analysis - Stanford Universityvis.stanford.edu/jheer/workshop/trendmicro/slides/... · [The Elements of Graphing Data. Cleveland 94] [The Elements of Graphing Data.](https://static.documents.pub/doc/80x56/5f493e34f124337b14415df7/exploratory-data-analysis-stanford-the-elements-of-graphing-data-cleveland-94.jpg)


