Visualization and Data Analysis 2002, R. Erbacher, P. Chen, M. Gr ¨ ohn, J. Roberts, C. Wittenbrink, Editors, Proceedings of SPIE Volume 4665, pages 177–188, c 2002 SPIE. Interactive, Distributed, Hardware-Accelerated LOD-Sprite Terrain Rendering with Stable Frame Rates J. Edward Swan II , Jesus Arango , Bala Krishna Nakshatrala The Naval Research Laboratory, Washington DC ABSTRACT A stable frame rate is important for interactive rendering systems. Image-based modeling and rendering (IBMR) tech- niques, which model parts of the scene with image sprites, are a promising technique for interactive systems because they allow the sprite to be manipulated instead of the underlying scene geometry. However, with IBMR techniques a frequent problem is an unstable frame rate, because generating an image sprite (with 3D rendering) is time-consuming relative to manipulating the sprite (with 2D image resampling). This paper describes one solution to this problem, by distributing an IBMR technique into a collection of cooperating threads and executable programs across two computers. The particular IBMR technique distributed here is the LOD-Sprite algorithm. This technique uses a multiple level- of-detail (LOD) scene representation. It first renders a keyframe from a high-LOD representation, and then caches the frame as an image sprite. It renders subsequent spriteframes by texture-mapping the cached image sprite into a lower- LOD representation. We describe a distributed architecture and implementation of LOD-Sprite, in the context of terrain rendering, which takes advantage of graphics hardware. We present timing results which indicate we have achieved a stable frame rate. In addition to LOD-Sprite, our distribution method holds promise for other IBMR techniques. Keywords: Distributed Rendering, Stable Frame Rate, Terrain Rendering, Image-Based Modeling and Rendering, Multi- Resolution, Level of Detail 1. INTRODUCTION This paper is concerned with real-time terrain rendering for use in a three-dimensional battlefield visualization system. In our system, like other terrain visualization systems which could possibly contain the “whole Earth”, the terrain database can potentially be extremely large in size. Two relatively recent thrusts in computer graphics hold great promise for interactively visualizing very large databases: image-based modeling and rendering (IBMR) techniques, and level of detail (LOD) techniques. At Visualization ’99 we described the LOD-Sprite algorithm, which combines both IBMR and LOD techniques and applies them to terrain rendering. LOD-Sprite first renders a keyframe from a high-LOD terrain representation, and then caches the frame as an image sprite. It renders subsequent spriteframes by texture-mapping the cached image sprite onto a lower-LOD terrain representation. As our goal was real-time rendering, we implemented LOD-Sprite in OpenGL to take advantage of available graphics hardware. Our Visualization ’99 paper contributed a new algorithm which significantly accelerated rendering a pre-computed path through a terrain database. However, at that time LOD-Sprite was not really useful for interactive rendering, because the rendering time for the keyframes was higher than for the spriteframes. This results in unacceptable performance when interactively flying through a terrain dataset: LOD-Sprite operates smoothly while rendering spriteframes, but this smooth operation is frequently and somewhat randomly interspersed with noticeable pauses when it renders a keyframe. We refer to this problem has having an unstable frame rate. In the current paper we describe how we have solved this problem by decomposing the LOD-Sprite system into a series of cooperating executable programs and threads which are distributed across two different computers containing OpenGL hardware accelerators. As mentioned above, we have developed LOD-Sprite for rendering terrain data as part of the rendering engine of a real-time, three-dimensional battlefield visualization system. Like most terrain rendering systems, we model the terrain Virtual Reality Laboratory. Michigan State University, East Lansing, MI. Fraunhofer Center for Research in Computer Graph- ics, Providence, RI. Work performed at US Naval Research Laboratory, Code 5580, 4555 Overlook Ave SW, Washington, DC, 20375- 5320, USA. Contact Email: [email protected]— 177 —
Transcript
Visualization and Data Analysis 2002, R. Erbacher, P. Chen, M. Gr ohn, J. Roberts, C. Wittenbrink, Editors,Proceedings of SPIE Volume 4665, pages 177–188, c� 2002 SPIE.
Interactive, Distributed, Hardware-AcceleratedLOD-Sprite Terrain Rendering with Stable Frame Rates
J. Edward Swan II�, Jesus Arango�, Bala Krishna Nakshatrala�
The Naval Research Laboratory, Washington DC
ABSTRACT
A stable frame rate is important for interactive rendering systems. Image-based modeling and rendering (IBMR) tech-niques, which model parts of the scene with image sprites, are a promising technique for interactive systems because theyallow the sprite to be manipulated instead of the underlying scene geometry. However, with IBMR techniques a frequentproblem is an unstable frame rate, because generating an image sprite (with 3D rendering) is time-consuming relative tomanipulating the sprite (with 2D image resampling). This paper describes one solution to this problem, by distributing anIBMR technique into a collection of cooperating threads and executable programs across two computers.
The particular IBMR technique distributed here is the LOD-Sprite algorithm. This technique uses a multiple level-of-detail (LOD) scene representation. It first renders a keyframe from a high-LOD representation, and then caches theframe as an image sprite. It renders subsequent spriteframes by texture-mapping the cached image sprite into a lower-LOD representation. We describe a distributed architecture and implementation of LOD-Sprite, in the context of terrainrendering, which takes advantage of graphics hardware. We present timing results which indicate we have achieved astable frame rate. In addition to LOD-Sprite, our distribution method holds promise for other IBMR techniques.
Keywords: Distributed Rendering, Stable Frame Rate, Terrain Rendering, Image-Based Modeling and Rendering, Multi-Resolution, Level of Detail
1. INTRODUCTION
This paper is concerned with real-time terrain rendering for use in a three-dimensional battlefield visualization system. �
In our system, like other terrain visualization systems which could possibly contain the “whole Earth”, � the terraindatabase can potentially be extremely large in size. Two relatively recent thrusts in computer graphics hold great promisefor interactively visualizing very large databases: image-based modeling and rendering (IBMR) techniques, and level ofdetail (LOD) techniques. At Visualization ’99 we described the LOD-Sprite algorithm, � which combines both IBMRand LOD techniques and applies them to terrain rendering. LOD-Sprite first renders a keyframe from a high-LOD terrainrepresentation, and then caches the frame as an image sprite. It renders subsequent spriteframes by texture-mappingthe cached image sprite onto a lower-LOD terrain representation. As our goal was real-time rendering, we implementedLOD-Sprite in OpenGL to take advantage of available graphics hardware.
Our Visualization ’99 paper contributed a new algorithm which significantly accelerated rendering a pre-computedpath through a terrain database. However, at that time LOD-Sprite was not really useful for interactive rendering, becausethe rendering time for the keyframes was higher than for the spriteframes. This results in unacceptable performance wheninteractively flying through a terrain dataset: LOD-Sprite operates smoothly while rendering spriteframes, but this smoothoperation is frequently and somewhat randomly interspersed with noticeable pauses when it renders a keyframe. We referto this problem has having an unstable frame rate. In the current paper we describe how we have solved this problem bydecomposing the LOD-Sprite system into a series of cooperating executable programs and threads which are distributedacross two different computers containing OpenGL hardware accelerators.
As mentioned above, we have developed LOD-Sprite for rendering terrain data as part of the rendering engine of areal-time, three-dimensional battlefield visualization system.� Like most terrain rendering systems, we model the terrain
�Virtual Reality Laboratory. �Michigan State University, East Lansing, MI. �Fraunhofer Center for Research in Computer Graph-ics, Providence, RI. Work performed at US Naval Research Laboratory, Code 5580, 4555 Overlook Ave SW, Washington, DC, 20375-5320, USA. Contact Email: [email protected]
— 177 —
Visualization and Data Analysis 2002, R. Erbacher, P. Chen, M. Gr ohn, J. Roberts, C. Wittenbrink, Editors,Proceedings of SPIE Volume 4665, pages 177–188, c� 2002 SPIE.
keyframe
spriteframe
terraingeometry(representedat multipleLODs)
Figure 1: The basic operation of the LOD-Sprite algorithm.
as a triangle mesh. For the sake of concreteness, in the rest of this paper we refer only to rendering “triangles” and “terraindata”. However, LOD-Sprite does not take any particular advantage of the properties of triangles or terrain datasets, andthe technique could easily be applied to general polygons and general polygonal datasets.
The next section gives a condensed description of the LOD-Sprite algorithm, which is described more completely inour original publication.� Along with this introduction, it also defines a number of key terms, which are presented in thisfont. Section 3 describes the Distributed LOD-Sprite implementation, the primary contribution of this paper. We discussresults in Section 4, and Section 5 places Distributed LOD-Sprite in the context of related work. We end with conclusionsand ideas for further developments in Section 6.
2. THE LOD-SPRITE ALGORITHM
The LOD-Sprite algorithm utilizes both a multiple-LOD dataset representation and image-based modeling and renderingtechniques to accelerate rendering. Figure 1 illustrates the algorithm’s basic functioning. LOD-Sprite stores the terraingeometry at multiple LODs, in a data structure which permits rapid and smooth LOD changes. ��� �� From a particularviewpoint, LOD-Sprite renders a keyframe, with the scene geometry represented at a high LOD, and texture mappedwith the terrain texture�. LOD-Sprite caches the keyframe as a sprite in texture memory, which allows it to texture mappolygons from subsequent frames with the resulting sprite texture. We refer to the viewpoint from where a keyframe hasbeen rendered as a keyframe viewpoint. For subsequent viewpoints which are relatively close to the keyframe viewpoint,LOD-Sprite renders a spriteframe, with the scene geometry represented at a low LOD, but texture mapped with the spritetexture. We refer to the viewpoint from where a spriteframe is rendered as a spriteframe viewpoint.
When rendering a spriteframe, for every triangle LOD-Sprite must choose between two different texture maps: thesprite texture and the terrain texture. This is illustrated in Figure 2 — Figure 2a shows two objects from a keyframeviewpoint, and Figure 2b shows the same two objects from a later spriteframe viewpoint. Regions � are visible fromboth the keyframe and the spriteframe viewpoints, and hence triangles in these regions are texture mapped with the spritetexture. However, regions � are not in the view frustum at the keyframe viewpoint, and region � is occluded at thekeyframe viewpoint. Therefore, triangles in regions � � � must be texture mapped with the original texture.
Figure 3 describes how this texture mapping is implemented. LOD-Sprite allocates a block of texture memory whichis twice the size of the terrain texture, and loads the terrain texture into the lower portion of this memory. As keyframesbecome available, the resulting sprite textures are loaded into the upper memory portion. For each triangle, LOD-Spriteperforms a visibility test to determine if the triangle was visible from the keyframe viewpoint. In Figure 3, triangle � �was visible from the keyframe viewpoint, and LOD-Sprite assigns it texture coordinates which map into the sprite texture.However, triangle �� was not visible, and so LOD-Sprite maps it into the terrain texture.
�Note that the terrain texture itself may be represented at multiple LODs, e.g. with mip- or clip-mapping.��
— 178 —
Visualization and Data Analysis 2002, R. Erbacher, P. Chen, M. Gr ohn, J. Roberts, C. Wittenbrink, Editors,Proceedings of SPIE Volume 4665, pages 177–188, c� 2002 SPIE.
(a) keyframe viewpoint (b) spriteframe viewpoint
A
AA A
A A
A A
B B
B B
B
C
C
B
texture memory
terrain texture
sprite texture
00
1
1
t
u
t1
t2
Figure 2. As the viewpoint moves, triangles which were invisiblewhen the keyframe was generated become visible.
Figure 3. LOD-Sprite texture maps each triangle to either thesprite texture or the terrain texture.
When a sprite is texture mapped to a triangle in a spriteframe, the sprite texture undergoes a 2D image resampling,which of course produces various image degradations. ���� The primary advantage of LOD-Sprite over previous sprite-caching techniques is that when the sprite is resampled, if the 2D resampling is in the context of an underlying 3Dgeometry (even if composed of only a few polygons), a much larger viewpoint change is possible for a given level ofimage degradation. For example, consider the dramatic viewpoint changes afforded by a single sprite image in Horry etal.�� This is discussed more fully in our original publication�.
3. THE DISTRIBUTED LOD-SPRITE ALGORITHM
As discussed in the introduction, addressing the problem of an unstable frame rate is our motivation for distributing LOD-Sprite. In our original implementation,� for each spriteframe we calculated an error metric which measured the amount ofdistortion that results from texture-mapping an image sprite at one viewpoint (spriteframe), when the sprite was actuallyrendered from a different viewpoint (keyframe). Once this error metric exceeded a user-defined threshold, we renderedthe next frame as a keyframe.
Our first idea was to split LOD-Sprite into two cooperating processes: a server which renders keyframes, and a clientwhich renders spriteframes. Both processes would run concurrently, and since a new keyframe is always being renderedand is used as soon as it is available, there would no longer be any need to calculate the error metric. In addition, theserver would use the previous history of viewpoints and keyframe rendering times to predict where the viewpoint will(probably) be when the next keyframe has been rendered.
We implemented this idea, using multiple rendering threads and Silicon Graphics (SGI) hardware. However, this didnot work, because although at the operating system level we could give the client process a higher execution priority thanthe server process, both processes had to share the SGI graphics hardware, and we could not discover a way to control theexecution priority at the hardware level. Furthermore, we discovered that forcing the graphics hardware to continuouslyswitch between the client and server graphics contexts seriously degraded performance (see the Results section (4) forfurther discussion). We next tried implementing this technique on a two-pipe SGI, with one pipe rendering for the clientand another rendering for the server, but we did not get good results.
We next decided on a cleaner approach: we would separate the client and server into two separate executable programs,and run them on two separate SGI computers. We would use a standard network connection to pass keyframes from theserver to the client. This is the implementation described in the rest of this paper.
3.1. Distributed System Architecture
The LOD-Sprite distributed system architecture is described in Figure 4. The legend at the right describes the sym-bology. Executable programs are shown as light-shaded rounded rectangles. Each program is composed of separate
— 179 —
Visualization and Data Analysis 2002, R. Erbacher, P. Chen, M. Gr ohn, J. Roberts, C. Wittenbrink, Editors,Proceedings of SPIE Volume 4665, pages 177–188, c� 2002 SPIE.
Legend:
EXECUTABLE
PROGRAM
MODULE
data structure
MODULE
(in separatethread)��
��SPRITEFRAME
RENDERER
KEYFRAME
RECEIVER
keyframe
keyframe
VIEWPOINT
PREDICTOR
KEYFRAME
RENDERER
KEYFRAME
TRANSMITTER
keyframe
viewpoint
keyframe
keyframe ack
LOD Client LOD Server
SERVER
CONTROL
keyframe
viewpoint
control message
control message ack
����CLIENT
CONTROL
CLIENT
KEYFRAME
QUEUE
SERVER
KEYFRAME
QUEUESHARED
DATA
STRUCTURE
Figure 4: Distributed system architecture.
modules, which are shown as labeled rectangles. Modules in heavily-shaded rectangles run in separate, asynchronousthreads. Rhomboids represent mutually exclusive shared data structures, while labeled links indicate data structureswhich modules pass to each other.
As indicated in Figure 4, the LOD-Sprite system is divided into two main executable programs, the LOD Client andLOD Server. The client renders spriteframes; it implements the LOD-Sprite algorithm described in Section 2 above.The server renders keyframes, and supplies them to the client. LOD Sprite has been split into separate client and serverexecutables so that each can run on a separate machine. However, both executables can also run on the same machine,and we have done this as part of development and testing.
The LOD-Sprite system makes use of three important data structures: viewpoint, keyframe, and keyframe queue. Aviewpoint is a tuple:
������ ������
where �, �, �, and � are all 3 dimensional vectors, ����� �� is an orthonormal set of coordinate axes which give theviewpoint’s orientation, and � is the eye position. A keyframe is also a tuple
�sprite-texture� z-buffer� view-matrix� ����
where sprite-texture is the rendered keyframe image, z-buffer is the rendered keyframe z-buffer, view-matrix is thekeyframe view matrix, and �� is a timestamp which is described in Section 3.3 below. A keyframe queue is also usedby both programs to store keyframes. These queues are accessed using a producer-consumer synchronization algorithm,where one thread produces and inserts keyframes into the queue, and another thread deletes and consumes keyframesfrom the queue. In our current implementation, both keyframe queues hold two keyframes.
The server and client maintain three connections, implemented with Unix sockets, to pass data structures to eachother. As shown in Figure 4, these connections are the control message connection, the viewpoint connection, and thekeyframe connection. Within the server and client, semaphores are used to enforce mutual exclusion on data structuresshared between threads.
3.2. LOD Client
The client contains the user interface and controls all user interaction. The majority of the time, the user specifies a newviewpoint, although higher-level control functions, such as stopping or starting the system, loading an alternative dataset,requesting performance statistics, etc., are also necessary. If the user selects a control function, the CLIENT-CONTROL
module performs the relevant operations, and sends a message down the control connection to the server.
— 180 —
Visualization and Data Analysis 2002, R. Erbacher, P. Chen, M. Gr ohn, J. Roberts, C. Wittenbrink, Editors,Proceedings of SPIE Volume 4665, pages 177–188, c� 2002 SPIE.
SPRITEFRAME-RENDERER:1 get viewpoint from user2 send viewpoint down viewpoint-connection3 while CLIENT-KEYFRAME-QUEUE contains any keyframes4 keyframe� next keyframe in CLIENT-KEYFRAME-QUEUE
5 triangles� set of low-resolution terrain triangles6 for each triangle7 if triangle was visible when keyframe was rendered then8 render triangle, map with keyframe.sprite-texture9 else10 render triangle, map with terrain-texture
Figure 5: Pseudocode for SPRITEFRAME-RENDERER module.
KEYFRAME-RENDERER:1 loop2 keyframe.�� � current time3 wait until VIEWPOINT-PREDICTOR has a viewpoint4 viewpoint� VIEWPOINT-PREDICTOR.VIEWPOINT()5 triangles� set of high-resolution terrain triangles6 for each triangle7 keyframe� render triangle, map with terrain-texture8 wait until SERVER-KEYFRAME-QUEUE is not full9 insert keyframe into SERVER-KEYFRAME-QUEUE
Figure 6: Pseudocode for KEYFRAME-RENDERER module.
The operation of the main rendering thread, called when the user specifies a new viewpoint, is described in Figure 5.SPRITEFRAME-RENDERER begins at line 1 with a viewpoint from the user. At line 2 the module sends the viewpointdown the viewpoint connection, which is a non-blocking operation. Next, in lines 3–4, the module checks to see if theCLIENT-KEYFRAME-QUEUE has any new keyframes available, and if it does, it retrieves the most recent keyframe (afterthe loop in line 3, the CLIENT-KEYFRAME-QUEUE is empty). Next, in line 5 the SPRITEFRAME-RENDERER chooses alow-resolution set of terrain triangles, and in line 6 considers each triangle. In line 7 the module uses the keyframe’s viewmatrix to calculate whether the triangle was visible when the keyframe was rendered, by comparing the current depth ofeach triangle vertex to the depth of the corresponding point in the keyframe’s z-buffer (our original publication � describesthis test in more detail). Lines 8 and 10 texture map the triangle with either the sprite texture or the terrain texture, asdescribed in Figure 3 above.
The KEYFRAME-RECEIVER module continuously looks for keyframes arriving from the server through the keyframeconnection. As soon as it receives one, it puts the keyframe onto the CLIENT-KEYFRAME-QUEUE, which stores thekeyframe until the SPRITEFRAME-RENDERER is ready for it.
3.3. LOD Server
The server contains no user interface, and is completely controlled by messages arriving from the client. The SERVER-CONTROL module handles any control functions arriving through the control connection.
The operation the server’s main rendering thread is described in Figure 6. The KEYFRAME-RENDERER loops con-tinuously at line 1. At the beginning of the loop, in line 2, the module records the current time in the keyframe datastructure. In line 3 it blocks until the VIEWPOINT-PREDICTOR has a viewpoint, which it receives in line 4. This view-point gives the location where the user is predicted to be when the current keyframe has been rendered and received by
— 181 —
Visualization and Data Analysis 2002, R. Erbacher, P. Chen, M. Gr ohn, J. Roberts, C. Wittenbrink, Editors,Proceedings of SPIE Volume 4665, pages 177–188, c� 2002 SPIE.
KEYFRAME-TRANSMITTER:1 loop2 wait until SERVER-KEYFRAME-QUEUE is not empty3 keyframe� next keyframe in SERVER-KEYFRAME-QUEUE
4 send keyframe down keyframe-connection5 wait until keyframe-connection sends acknowledgement6 �� � current time7 �� �� � keyframe���
Figure 7: Pseudocode for KEYFRAME-TRANSMITTER module.
the client. Next, in line 5 the KEYFRAME-RENDERER chooses a high-resolution set of terrain triangles, which it ren-ders and texture maps with the terrain texture in line 7. In line 8 the module blocks until there is space available in theSERVER-KEYFRAME-QUEUE, and in line 9 it inserts the newly-rendered keyframe into the queue.
The SERVER-KEYFRAME-QUEUE holds the keyframes until they are needed by the KEYFRAME-TRANSMITTER,which is described in Figure 7. The KEYFRAME-TRANSMITTER loops continuously at line 1. In lines 2–3 it blocks untilthe SERVER-KEYFRAME-QUEUE contains at least one keyframe, and then it reads the keyframe into local storage. Inline 4 it sends the keyframe down the keyframe connection to the client, and then blocks at line 5 until it receives anacknowledgement. In lines 6–7 it calculates
� � �� � ���
where �� is the time when the KEYFRAME-RENDERER first began rendering the current keyframe and � � is the time whenthe server knows the client has received the keyframe.
The VIEWPOINT-PREDICTOR uses � and the latest viewpoint received from the client to predict where the user willbe located when the next keyframe is rendered. We tried several different prediction techniques, and eventually settledon a simple technique which gives good results. For the orientation ����� ��, we copy the latest orientation receivedand perform no interpolation. For the eye position �, we predict the current position by linear interpolation with anexponential decay window. However, especially with larger terrain databases, we believe we will get better resultsfrom a more sophisticated prediction technique. We are considering implementing a Kalman filter or perhaps CovarianceIntersection.��
4. RESULTS
We implemented the Distributed LOD-Sprite algorithm described in Section 3 above, and (1) ran the client on an SGIOnyx with 4 R10000 processors and Infinite Reality graphics, and (2) ran the server on an SGI deskside Onyx with 2R10000 processors and Infinite Reality graphics. These computers communicated through standard 10-base-T Ethernet.For input we used a ������� height field and a corresponding ������� texture map. Although the client’s user interfacesupports interactive terrain navigation, to analyze timing behavior we created a repeatable 600-frame viewpoint path. Thepath starts away from the terrain, zooms in, flies over a plain, and then over a mountain range and onto the plain beyond.This path visits most of the interesting topological features of our dataset; it is the same path reported in our previouspublication.�
4.1. Temporal Performance
Figures 8–12 give the algorithm’s timing behavior for the viewpoint path described above.
Figure 8 gives the primary client results, plotting rendering time per frame, overlaid with frame type (either keyframeor spriteframe). The overall rendering time per client frame is 61.9 milliseconds. Keyframes arrive at a relatively steadyrate; on average 34.3 spriteframes are interpolated from each keyframe. The average time for a frame where the clientreceives a keyframe is 96.2 milliseconds, while the average rendering time for other spriteframes is 60.9 milliseconds; thismeans it takes the client on average 35.4 milliseconds longer to process a keyframe. Note how in Figure 8 the renderingtime peaks when a spriteframe is received. This extra time is required to copy the keyframe from the keyframe queue into
— 182 —
Visualization and Data Analysis 2002, R. Erbacher, P. Chen, M. Gr ohn, J. Roberts, C. Wittenbrink, Editors,Proceedings of SPIE Volume 4665, pages 177–188, c� 2002 SPIE.
0
20
40
60
80
100
120
1 101 201 301 401 501Frame Number
Tim
e (m
sec)
0
100
200
300
400
500
600
700
800
900
1000
1 101 201 301 401 501
Frame Number
Tim
e (m
sec)
Figure 8. Distributed client rendering time (�) per frame, over-laid with frame type (keyframes are vertical spikes).
Figure 9. Non-distributed client rendering time (upper line) perframe, together with distributed client rendering time (lower line;same data as Figure 8).
Figure 10. Non-distributed client frame type (keyframes are ver-tical spikes).
Figure 11. Timing information from the distributed server’sKEYFRAME-RENDERER module (Figure 6). Shown is thekeyframe production time (�), the viewpoint wait time (Æ), thekeyframe render time (�), and the queue insert time (�).
texture memory. However, the average 35.4 millisecond latency difference is not perceptible while using the system; thisis best demonstrated by the animation which accompanies this paper. Along with the distributed architecture presented inFigure 4 above, this small latency difference is the primary research contribution of the current work.
Figures 9 and 10 explore what happens when we run both the client and the server on a single computer (the 4-processor SGI Onyx mentioned above). Figure 9 shows the rendering time for the non-distributed client (upper line),together with the distributed client (lower line; same data as Figure 8). The results here are similar to the results wereceived with the multithreaded single-executable version mentioned in Section 3 above. The non-distributed client notonly took longer to render spriteframes than the distributed client (average 256 versus 61.9 milliseconds), but as visuallyindicated in Figure 9 the frame rate is much more unstable for the non-distributed versus the distributed client (standarddeviation 225 versus 14.8 milliseconds). This is further reinforced by Figure 10, which shows the frame type for thenon-distributed client (keyframes are vertical spikes). Compared to the relatively steady keyframe rate of the distributedclient in Figure 8, the non-distributed keyframes arrive in a bursty manner. As we mention in Section 3 above, we believe
— 183 —
Visualization and Data Analysis 2002, R. Erbacher, P. Chen, M. Gr ohn, J. Roberts, C. Wittenbrink, Editors,Proceedings of SPIE Volume 4665, pages 177–188, c� 2002 SPIE.
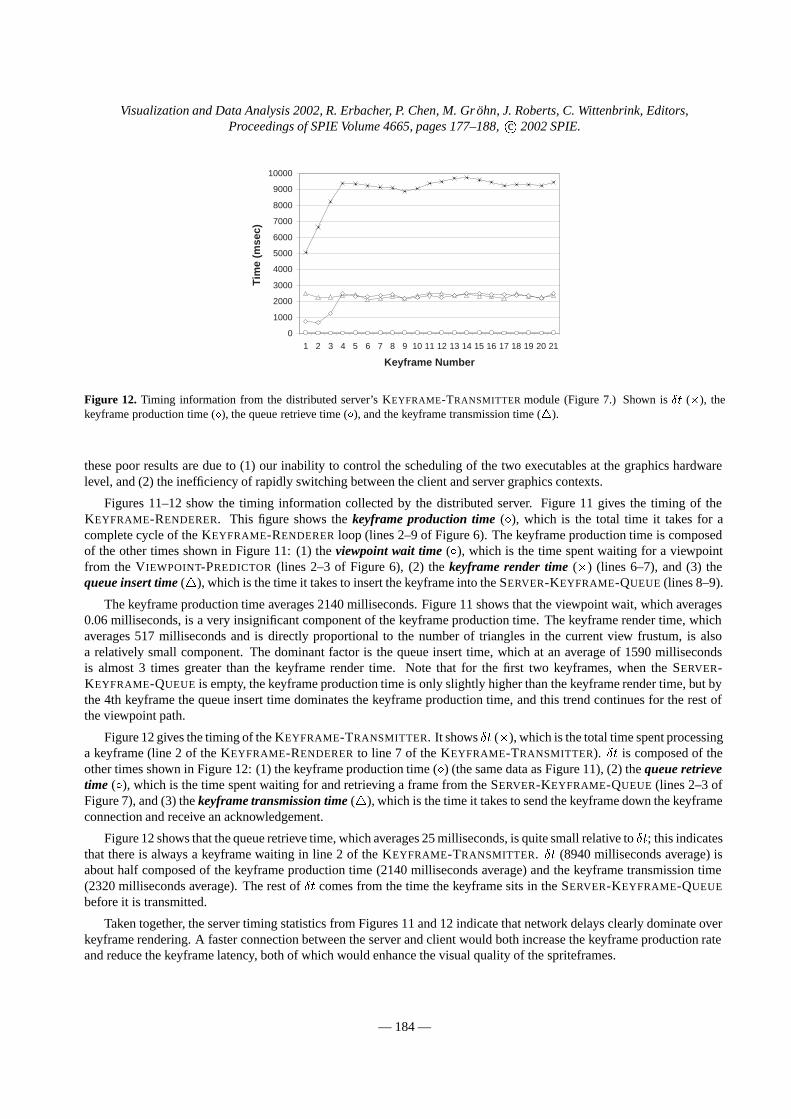
Figure 12. Timing information from the distributed server’s KEYFRAME-TRANSMITTER module (Figure 7.) Shown is Æ� (�), thekeyframe production time (�), the queue retrieve time (Æ), and the keyframe transmission time (�).
these poor results are due to (1) our inability to control the scheduling of the two executables at the graphics hardwarelevel, and (2) the inefficiency of rapidly switching between the client and server graphics contexts.
Figures 11–12 show the timing information collected by the distributed server. Figure 11 gives the timing of theKEYFRAME-RENDERER. This figure shows the keyframe production time (�), which is the total time it takes for acomplete cycle of the KEYFRAME-RENDERER loop (lines 2–9 of Figure 6). The keyframe production time is composedof the other times shown in Figure 11: (1) the viewpoint wait time (Æ), which is the time spent waiting for a viewpointfrom the VIEWPOINT-PREDICTOR (lines 2–3 of Figure 6), (2) the keyframe render time (�) (lines 6–7), and (3) thequeue insert time (�), which is the time it takes to insert the keyframe into the SERVER-KEYFRAME-QUEUE (lines 8–9).
The keyframe production time averages 2140 milliseconds. Figure 11 shows that the viewpoint wait, which averages0.06 milliseconds, is a very insignificant component of the keyframe production time. The keyframe render time, whichaverages 517 milliseconds and is directly proportional to the number of triangles in the current view frustum, is alsoa relatively small component. The dominant factor is the queue insert time, which at an average of 1590 millisecondsis almost 3 times greater than the keyframe render time. Note that for the first two keyframes, when the SERVER-KEYFRAME-QUEUE is empty, the keyframe production time is only slightly higher than the keyframe render time, but bythe 4th keyframe the queue insert time dominates the keyframe production time, and this trend continues for the rest ofthe viewpoint path.
Figure 12 gives the timing of the KEYFRAME-TRANSMITTER. It shows Æ� (�), which is the total time spent processinga keyframe (line 2 of the KEYFRAME-RENDERER to line 7 of the KEYFRAME-TRANSMITTER). Æ� is composed of theother times shown in Figure 12: (1) the keyframe production time (�) (the same data as Figure 11), (2) the queue retrievetime (Æ), which is the time spent waiting for and retrieving a frame from the SERVER-KEYFRAME-QUEUE (lines 2–3 ofFigure 7), and (3) the keyframe transmission time (�), which is the time it takes to send the keyframe down the keyframeconnection and receive an acknowledgement.
Figure 12 shows that the queue retrieve time, which averages 25 milliseconds, is quite small relative to �; this indicatesthat there is always a keyframe waiting in line 2 of the KEYFRAME-TRANSMITTER. � (8940 milliseconds average) isabout half composed of the keyframe production time (2140 milliseconds average) and the keyframe transmission time(2320 milliseconds average). The rest of � comes from the time the keyframe sits in the SERVER-KEYFRAME-QUEUE
before it is transmitted.
Taken together, the server timing statistics from Figures 11 and 12 indicate that network delays clearly dominate overkeyframe rendering. A faster connection between the server and client would both increase the keyframe production rateand reduce the keyframe latency, both of which would enhance the visual quality of the spriteframes.
— 184 —
Visualization and Data Analysis 2002, R. Erbacher, P. Chen, M. Gr ohn, J. Roberts, C. Wittenbrink, Editors,Proceedings of SPIE Volume 4665, pages 177–188, c� 2002 SPIE.
Figure 13. A series of frames from early in the animation, with a new keyframe introduced in the middle row. There is no discernablevisual change when the new spriteframe is introduced.
4.2. Visual Performance
Figures 13 and 14 give visual results from the 600-frame viewpoint path. In both figures, the first column shows the actualLOD-Sprite client images which the user sees. For comparison, the second column shows images from the same viewpointrendered from the full-resolution terrain geometry, and the third column shows difference images between the first andsecond columns. If LOD-Sprite worked perfectly, the LOD-Sprite images would be identical to the high-resolutionimages, and the difference images would be completely black, so any information in a difference image indicates visualquality loss.
Figure 13 shows three frames (26, 27, 28) from early in the viewpoint path. Frame 26 is the 13th spriteframe generatedfrom the last keyframe. In Frame 27 a new keyframe is introduced, and Frame 28 is the first spriteframe generated afterthe new keyframe. The sequence of images shows that, in this part of the animation, introducing a new keyframe resultsin no perceptual effects whatsoever — it is not possible to detect that a keyframe has been introduced.
Figure 14 shows three frames (592, 593, 594) from late in the viewpoint path. Frame 592 is the 12th spriteframegenerated from the last keyframe received by the client. In Frame 593 a new keyframe is introduced, and Frame 594 isthe first spriteframe generated after the new keyframe is received. The sequence of images shows that, in this part of theanimation, introducing a new keyframe does result in a perceptual “popping” effect in the central portion of the image —note the image information that abruptly changes between frames 592 and 593 in the difference images (white arrows).When viewed as an animation, the visual effect is a slight “popping” in the central part of the image.
5. RELATED WORK
Distributed LOD-Sprite fits into the general fields of (1) image-based modeling and rendering, (2) level-of-detail modelrepresentations, and (3) terrain rendering. These are all well-established fields in computer graphics and are not reviewedhere. This section reviews other attempts at frame rate management for interactive systems.
— 185 —
Visualization and Data Analysis 2002, R. Erbacher, P. Chen, M. Gr ohn, J. Roberts, C. Wittenbrink, Editors,Proceedings of SPIE Volume 4665, pages 177–188, c� 2002 SPIE.
Figure 14. A series of frames from late in the animation, with a new keyframe introduced in the middle row. This produces a slightpopping artifact in the middle part of the image (white arrows).
The most general approach for achieving a steady frame rate is to predict, based on the current scene complexityand other visual parameters, how to best choose LODs to meet a given frame time. Completely solving this problem isNP-complete, and thus researchers have presented various optimization schemes for approximate solutions. Examples ofthis approach are Funkhouser and Sequin, Maciel and Shirley,�� Gobbetti and Bouvier, and Mason and Blake.� Aneasier approach is to adjust LODs based on feedback from the time required to render previous frames. This techniquehas been used in flight simulators for decades,� although it suffers various problems such as being at least one frame lateas well as oscillating between frame rates.��
A large number of researchers have developed techniques for LOD and image sprite management based on view-dependent parameters such as (for example) screen-space projected error. While they do not directly consider frame time,these methods all tend to stabilize the frame rate. Among those which at least discuss their frame rate stability are Aliagaet al.,�� � Hoppe,��� �� Lindstrom et al.,�� Shade et al.,�� Maciel and Shirley,�� and Duchaineau et al.�
The most novel aspect of Distributed LOD-Sprite is that it utilizes a distributed rendering architecture to achieve a sta-ble frame rate; we are not aware of other techniques that use this approach. LOD-Sprite requires an LOD decomposition,and we currently use the techniques of both Lindstrom et al., �� and Luebke and Erikson.�� However, LOD-Sprite couldutilize and augment any of the LOD and frame-rate management approaches described above.
A novel approach to frame-rate management, which is also given in the context of a terrain rendering system, is thework of Qu et al.�� They describe a keyframeless image-based system which uses ray-casting. Their technique generatesa frame by warping the previous frame; it measures the age of each pixel, and re-casts a ray through the pixel once itgets too old. They stabilize the frame rate by only re-casting a certain number of old pixels per frame. They achievean impressively stable framerate (on exactly the same dataset that we use!), but because their technique does not takeadvantage of rendering hardware, their overall frame rate is slower that what we report in Section 4 above.
Yet another large class of applications guarantee a steady, interactive frame rate, no matter how bad images mightlook while in motion. However, these tend to be systems with different usage characteristics than interactive terrainvisualization. For example, Rusinkiewicz and Levoy�� describe a system for interactively viewing high-resolution scannedmodels of Michelangelo’s statues. In this case, users typically manipulate the statue in order to observe it from a particular
— 186 —
Visualization and Data Analysis 2002, R. Erbacher, P. Chen, M. Gr ohn, J. Roberts, C. Wittenbrink, Editors,Proceedings of SPIE Volume 4665, pages 177–188, c� 2002 SPIE.
orientation, and then do not move it for a period of time. While the model is stationary, the system gradually updates theimage quality. IRIS Performer�� has API hooks to directly support this class of applications.
6. CONCLUSIONS AND FUTURE WORK
In this paper we have described the Distributed LOD-Sprite technique, and our application of the technique to real-time, interactive terrain rendering. By decomposing LOD-Sprite into a client which renders spriteframes and a serverwhich renders keyframes, we have demonstrated a solution to the unstable frame rate problem. This problem is of greatimportance to real-time, interactive rendering systems, and applies in a general way to many image-based modeling andrendering (IBMR) techniques in addition to LOD-Sprite. Our solution is a promising approach which could be applied tomany other IBMR systems.
In addition to a steady frame rate, we have demonstrated a real-time, interactive rendering system which has theadditional benefits of LOD-Sprite. It is a general-purpose rendering technique that could accelerate rendering for anyapplication. It could be built upon any LOD decomposition technique. It improves the image quality of LOD techniquesby preserving surface complexity, and it improves the efficiency of IBMR techniques by increasing the range of viewpointchanges that are possible for a given level of image degradation.
We have several ideas for future work on this project. We first want to experiment with a faster network connectionbetween the client and server, for as discussed in Section 4.1 above the majority of the total keyframe processing time �can be attributed to the network. A 100-base-T Ethernet is available in our building, and we may also explore a directconnection between the two machines.
We also intend to revisit the idea of a multi-threaded but single executable implementation which runs on one machine.Although our initial effort to implement Distributed LOD-Sprite on a two-pipe Onyx were unsuccessful, there seems tobe no reason in principal why we could not get the client thread to use one pipe and the server thread to use another pipe.We are also interested in an implementation on a fast PC with two graphics cards.
We are integrating Distributed LOD-Sprite into a battlefield visualization system�; this system will further test Dis-tributed LOD-Sprite with realistically-sized terrain databases. As we mention in Section 3.3 above, we predict theselarger databases will necessitate a more sophisticated viewpoint prediction technique. In addition, a common problemwith many continuous-LOD techniques, including those we use in Distributed LOD-Sprite, ��� �� is caused by the suddencreation and destruction of triangles as the resolution level changes. This results in a continuous popping effect duringinteractive navigation. The solution is geomorphing, where the geometry is slowly changed over several frames. �� Weare investigating adding geomorphing to LOD-Sprite.
Finally, there are at least two aspects of the OpenGL graphics hardware we used for this project which yield inefficientperformance. One key addition to graphics hardware, which would benefit not only LOD-Sprite but many other IBMRtechniques as well, is a fast connection between graphics texture memory and general CPU memory. Another is arelaxation of the requirement that texture maps only have dimensions which are powers of two.
ACKNOWLEDGMENTS
We would like to acknowledge our collaborators Baoquan Chen, Eddy Kuo, and Arie Kaufman for their initial workon LOD-Sprite.� This work was supported by the Office of Naval Research. We give special thanks to our systemadministrators Gary Samuels and Toni Miller.
REFERENCES
1. ALIAGA, D., COHEN, J., WILSON, A., ZHANG, H., ERIKSON, C., HOFF, K., HUDSON, T., ST URZLINGER, W.,BAKER, E., BASTOS, R., WHITTON, M., BROOKS, F., AND MANOCHA, D. MMR: An interactive massive modelrendering system using geometric and image-based acceleration. 1999 ACM Symposium on Interactive 3D Graphics(April 1999), 199–206. ISBN 1-58113-082-1.
2. ALIAGA, D. G., AND LASTRA, A. Automatic image placement to provide a guaranteed frame rate. Proceedings ofSIGGRAPH 99 (August 1999), 307–316. ISBN 0-20148-560-5. Held in Los Angeles, California.
— 187 —
Visualization and Data Analysis 2002, R. Erbacher, P. Chen, M. Gr ohn, J. Roberts, C. Wittenbrink, Editors,Proceedings of SPIE Volume 4665, pages 177–188, c� 2002 SPIE.
3. CHEN, B., SWAN II, J. E., KUO, E., AND KAUFMAN, A. E. LOD-sprite technique for accelerated terrain render-ing. IEEE Visualization ’99 (October 1999), 291–298. ISBN 0-7803-5897-X. Held in San Francisco, California.
4. CHEN, S. E., AND WILLIAMS, L. View interpolation for image synthesis. Proceedings of SIGGRAPH 93 (August1993), 279–288. ISBN 0-201-58889-7. Held in Anaheim, California.
5. DAVIS, D., JIANG, T. Y., RIBARSKY, W., AND FAUST, N. Intent, perception, and out-of-core visualization appliedto terrain. IEEE Visualization ’98 (October 1998), 455–458. ISBN 0-8186-9176-X.
6. DUCHAINEAU, M. A., WOLINSKY, M., SIGETI, D. E., MILLER, M. C., ALDRICH, C., AND MINEEV-WEINSTEIN, M. B. ROAMing terrain: Real-time optimally adapting meshes. IEEE Visualization ’97 (November1997), 81–88. ISBN 0-58113-011-2.
7. DURBIN, J., SWAN II, J. E., COLBERT, B., CROWE, J., KING, R., KING, T., SCANNELL, C., WARTEL, Z.,AND WELSH, T. Battlefield visualization on the responsive workbench. IEEE Visualization ’98 (October 1998),463–466. ISBN 0-8186-9176-X.
8. FUNKHOUSER, T. A., AND SEQUIN, C. H. Adaptive display algorithm for interactive frame rates during visualiza-tion of complex virtual environments. Proceedings of SIGGRAPH 93 (August 1993), 247–254. ISBN 0-201-58889-7. Held in Anaheim, California.
9. GOBBETTI, E., AND BOUVIER, E. Time-critical multiresolution scene rendering. IEEE Visualization ’99 (October1999), 123–130. ISBN 0-7803-5897-X. Held in San Francisco, California.
10. HECKBERT, P. S. Survey of texture mapping. IEEE Computer Graphics & Applications 6, 11 (November 1986),56–67.
11. HOPPE, H. View-dependent refinement of progressive meshes. Proceedings of SIGGRAPH 97 (August 1997),189–198. ISBN 0-89791-896-7. Held in Los Angeles, California.
12. HOPPE, H. H. Smooth view-dependent level-of-detail control and its application to terrain rendering. IEEE Visual-ization ’98 (October 1998), 35–42. ISBN 0-8186-9176-X.
13. HORRY, Y., ICHI ANJYO, K., AND ARAI, K. Tour into the picture: Using a spidery mesh interface to makeanimation from a single image. Proceedings of SIGGRAPH 97 (August 1997), 225–232. ISBN 0-89791-896-7.Held in Los Angeles, California.
14. JULIER, S. J., AND UHLMANN, J. K. A non-divergent estimation algorithm in the presence of unknown corre-lations. Proceedings of the American Control Conference, Volume 4 (June 1997), 2369–2373. ISBN 07803383320780338324 0780338340 0780338359. Held in Albuquerque; NM.
15. LINDSTROM, P., KOLLER, D., RIBARSKY, W., HUGHES, L. F., FAUST, N., AND TURNER, G. Real-time, con-tinuous level of detail rendering of height fields. Proceedings of SIGGRAPH 96 (August 1996), 109–118. ISBN0-201-94800-1. Held in New Orleans, Louisiana.
16. LUEBKE, D., AND ERIKSON, C. View-dependent simplification of arbitrary polygonal environments. Proceedingsof SIGGRAPH 97 (August 1997), 199–208. ISBN 0-89791-896-7. Held in Los Angeles, California.
17. MACIEL, P. W. C., AND SHIRLEY, P. Visual navigation of large environments using textured clusters. 1995Symposium on Interactive 3D Graphics (April 1995), 95–102. ISBN 0-89791-736-7.
18. MASON, A. E. W., AND BLAKE, E. H. Automatic hierarchical level of detail optimization in computer animation.Computer Graphics Forum 16, 3 (August 1997), 191–200. ISSN 1067-7055.
19. MUELLER, C. Architectures of image generators for flight simulators. Computer science technical report TR95-015,University of North Carolina at Chapel Hill, 1995.
20. QU, H., WAN, M., QIN, J., AND KAUFMAN, A. Image based rendering with stable frame rates. IEEE Visualization2000 (October 2000), 251–258.
21. ROHLF, J., AND HELMAN, J. IRIS performer: A high-performance multiprocessing toolkit for real-time 3d graph-ics. Proceedings of SIGGRAPH 94 (July 1994), 381–395. ISBN 0-89791-667-0. Held in Orlando, Florida.
22. RUSINKIEWICZ, S., AND LEVOY, M. Qsplat: A multiresolution point rendering system for large meshes. Proceed-ings of SIGGRAPH 2000 (July 2000), 343–352. ISBN 1-58113-208-5.
23. SHADE, J., LISCHINSKI, D., SALESIN, D., DEROSE, T., AND SNYDER, J. Hierarchical image caching foraccelerated walkthroughs of complex environments. Proceedings of SIGGRAPH 96 (August 1996), 75–82. ISBN0-201-94800-1. Held in New Orleans, Louisiana.
24. TANNER, C. C., MIGDAL, C. J., AND JONES, M. T. The clipmap: A virtual mipmap. Proceedings of SIGGRAPH98 (July 1998), 151–158. ISBN 0-89791-999-8. Held in Orlando, Florida.