Page 1
I NTERACTIVE I NFORMATION RETRIEVAL WITH
STRUCTURED DOCUMENTS
Von der Fakultat fur Ingenieurwissenschaften
der Universitat Duisburg-Essen
zur Erlangung des akademischen Grades eines
Doktors der Naturwissenschaften
genehmigte Dissertation
von
Saadia Malik
aus Rawalpindi
Referent: Prof. Dr.-Ing. Norbert Fuhr
Korreferentin: Prof. Dr. Mounia Lalmas
Tag der mundlichen Prufung: 06. November 2009
Page 3
Dedicated to my family
Page 5
Contents
Acknowledgement vii
Abstract ix
1 Introduction 1
1.1 Objectives of the dissertation. . . . . . . . . . . . . . . . . . . . . . . . . . 4
1.2 Research questions. . . . . . . . . . . . . . . . . . . . . . . . . . . . . . . 4
1.3 Structure of dissertation. . . . . . . . . . . . . . . . . . . . . . . . . . . . . 5
2 Theoretic foundation 7
2.1 Information seeking. . . . . . . . . . . . . . . . . . . . . . . . . . . . . . . 8
2.1.1 Information need. . . . . . . . . . . . . . . . . . . . . . . . . . . . 8
2.1.2 Tasks . . . . . . . . . . . . . . . . . . . . . . . . . . . . . . . . . . 10
2.1.3 Relevance. . . . . . . . . . . . . . . . . . . . . . . . . . . . . . . . 11
2.1.4 Models and empirical studies. . . . . . . . . . . . . . . . . . . . . . 12
2.2 Information searching. . . . . . . . . . . . . . . . . . . . . . . . . . . . . . 13
2.2.1 Interactive information retrieval. . . . . . . . . . . . . . . . . . . . 13
2.2.2 Information retrieval. . . . . . . . . . . . . . . . . . . . . . . . . . 16
2.3 Query (Re)formulation. . . . . . . . . . . . . . . . . . . . . . . . . . . . . 18
2.3.1 Related terms. . . . . . . . . . . . . . . . . . . . . . . . . . . . . . 18
2.3.2 Relevance feedback. . . . . . . . . . . . . . . . . . . . . . . . . . . 19
2.4 Result presentation and visualisation. . . . . . . . . . . . . . . . . . . . . . 21
2.5 Evaluation. . . . . . . . . . . . . . . . . . . . . . . . . . . . . . . . . . . . 23
2.5.1 System-driven evaluation. . . . . . . . . . . . . . . . . . . . . . . . 23
2.5.2 User-centred evaluation. . . . . . . . . . . . . . . . . . . . . . . . 24
2.5.3 Hybrid evaluation. . . . . . . . . . . . . . . . . . . . . . . . . . . . 24
2.5.4 Operational evaluation. . . . . . . . . . . . . . . . . . . . . . . . . 24
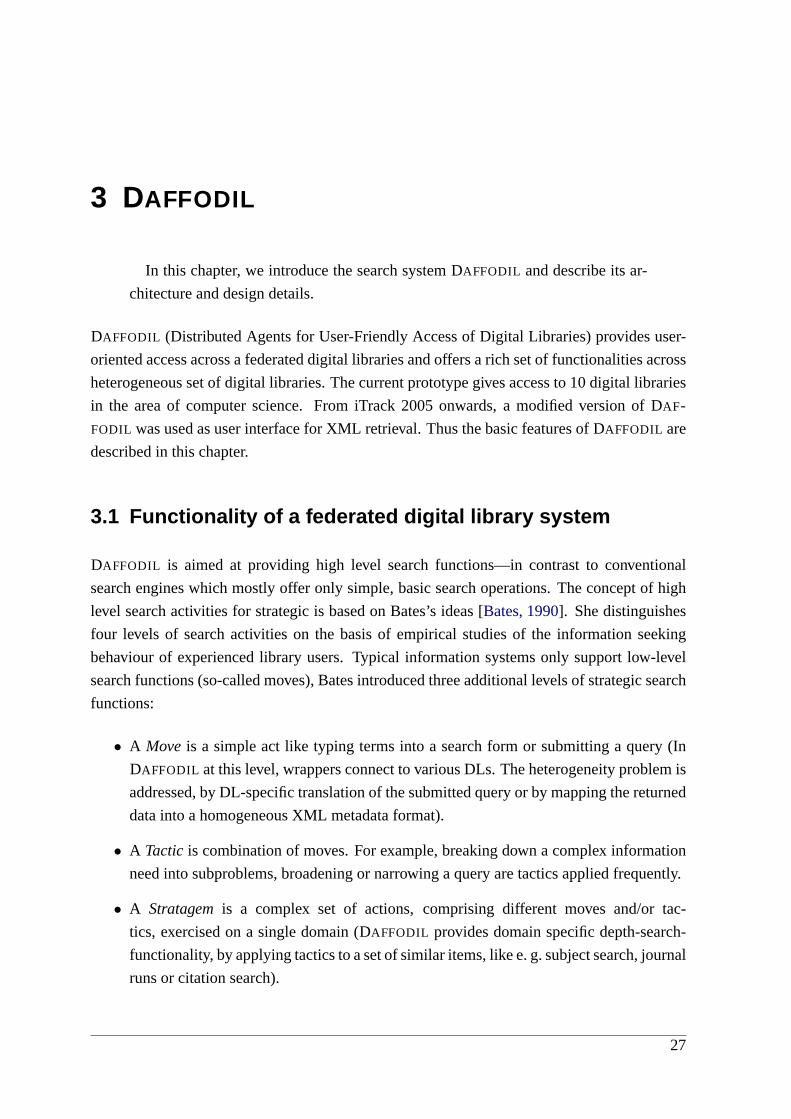
3 DAFFODIL 27
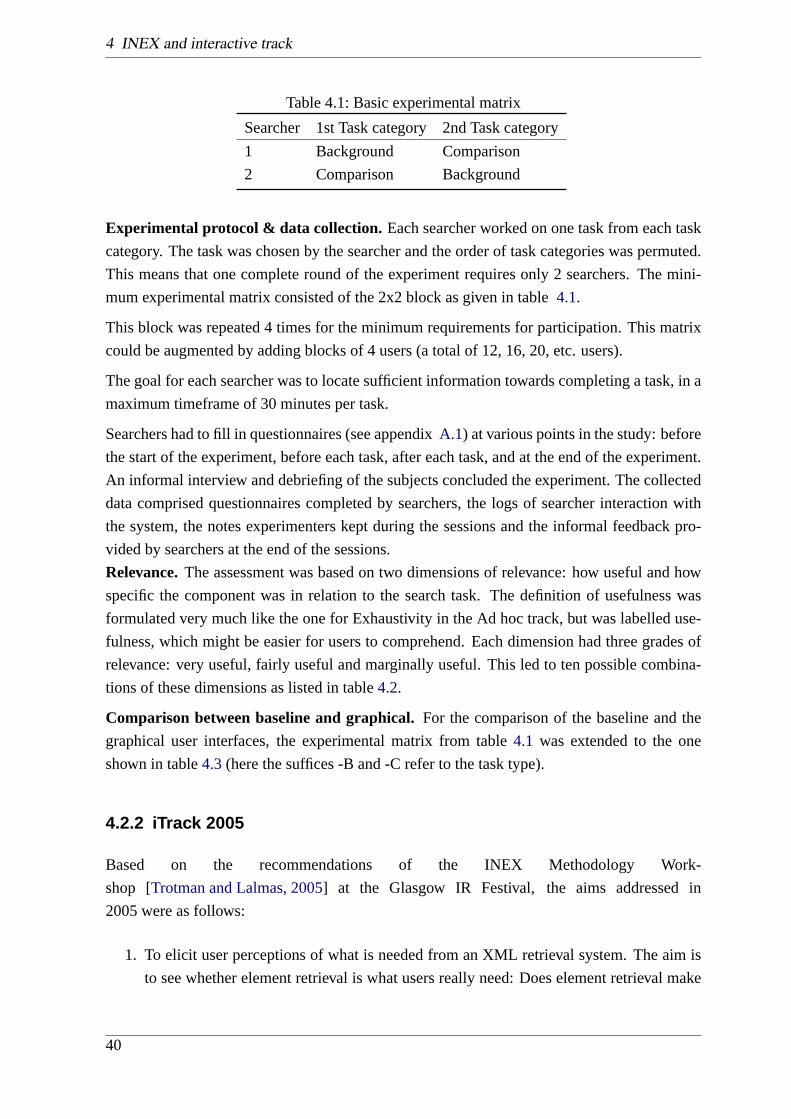
3.1 Functionality of a federated digital library system. . . . . . . . . . . . . . . 27
iii
Page 6
3.2 The WOB model . . . . . . . . . . . . . . . . . . . . . . . . . . . . . . . . 28
3.3 Agent-based Architecture. . . . . . . . . . . . . . . . . . . . . . . . . . . . 30
3.4 Daffodil’s tools . . . . . . . . . . . . . . . . . . . . . . . . . . . . . . . . . 31
4 INEX and interactive track 33
4.1 INEX . . . . . . . . . . . . . . . . . . . . . . . . . . . . . . . . . . . . . . 34
4.1.1 Document Collections. . . . . . . . . . . . . . . . . . . . . . . . . 35
4.1.2 Tasks and retrieval strategies. . . . . . . . . . . . . . . . . . . . . . 36
4.1.3 Topics. . . . . . . . . . . . . . . . . . . . . . . . . . . . . . . . . . 37
4.1.4 Relevance. . . . . . . . . . . . . . . . . . . . . . . . . . . . . . . . 38
4.1.5 Tasks/Tracks. . . . . . . . . . . . . . . . . . . . . . . . . . . . . . 38
4.2 Interactive track. . . . . . . . . . . . . . . . . . . . . . . . . . . . . . . . . 39
4.2.1 iTrack 2004. . . . . . . . . . . . . . . . . . . . . . . . . . . . . . . 39
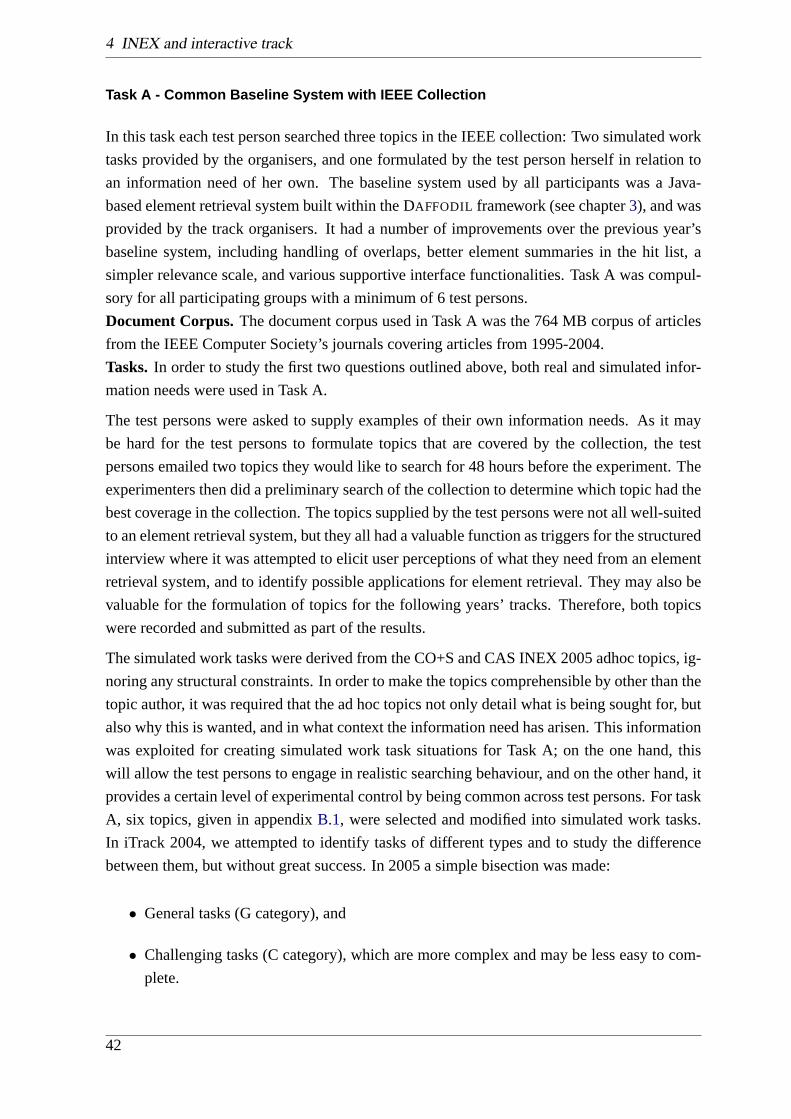
4.2.2 iTrack 2005. . . . . . . . . . . . . . . . . . . . . . . . . . . . . . . 40
4.2.3 iTrack 2006-2007. . . . . . . . . . . . . . . . . . . . . . . . . . . . 44
5 Content-centric query formulation 49
5.1 Introduction. . . . . . . . . . . . . . . . . . . . . . . . . . . . . . . . . . . 49
5.2 Research questions. . . . . . . . . . . . . . . . . . . . . . . . . . . . . . . 51
5.3 Usefulness of related terms. . . . . . . . . . . . . . . . . . . . . . . . . . . 51
5.4 Units of co-occurrence. . . . . . . . . . . . . . . . . . . . . . . . . . . . . 52
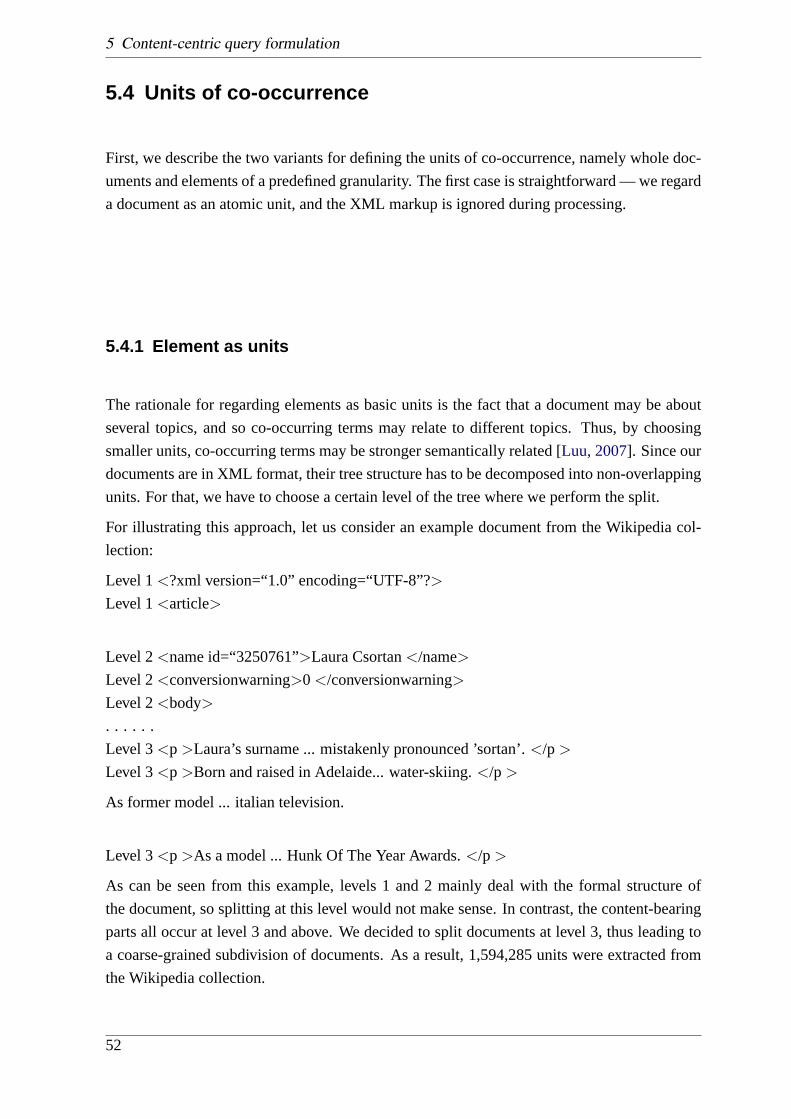
5.4.1 Element as units. . . . . . . . . . . . . . . . . . . . . . . . . . . . 52
5.5 Keyphrases extraction. . . . . . . . . . . . . . . . . . . . . . . . . . . . . . 53
5.5.1 Keyphrases. . . . . . . . . . . . . . . . . . . . . . . . . . . . . . . 53
5.5.2 Keyphrase Extraction Algorithm (KEA). . . . . . . . . . . . . . . . 53
5.5.3 Application of KEA . . . . . . . . . . . . . . . . . . . . . . . . . . 54
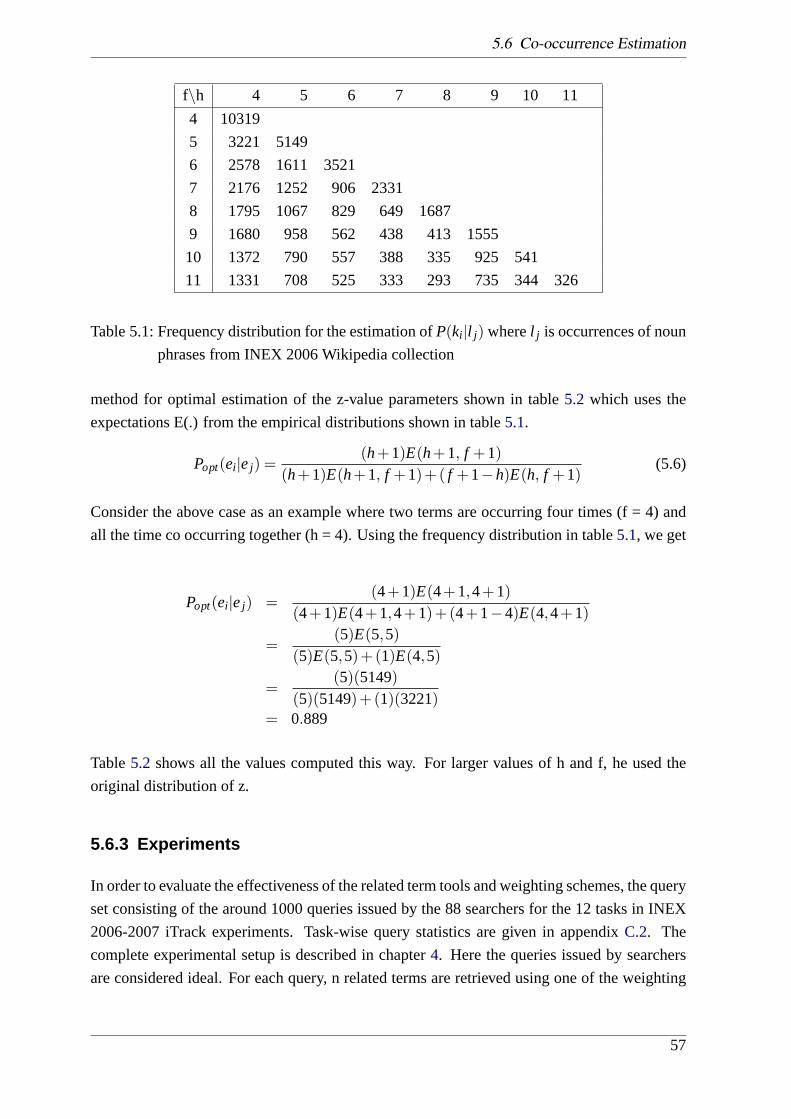
5.6 Co-occurrence Estimation. . . . . . . . . . . . . . . . . . . . . . . . . . . 55
5.6.1 Association Measurement. . . . . . . . . . . . . . . . . . . . . . . 55
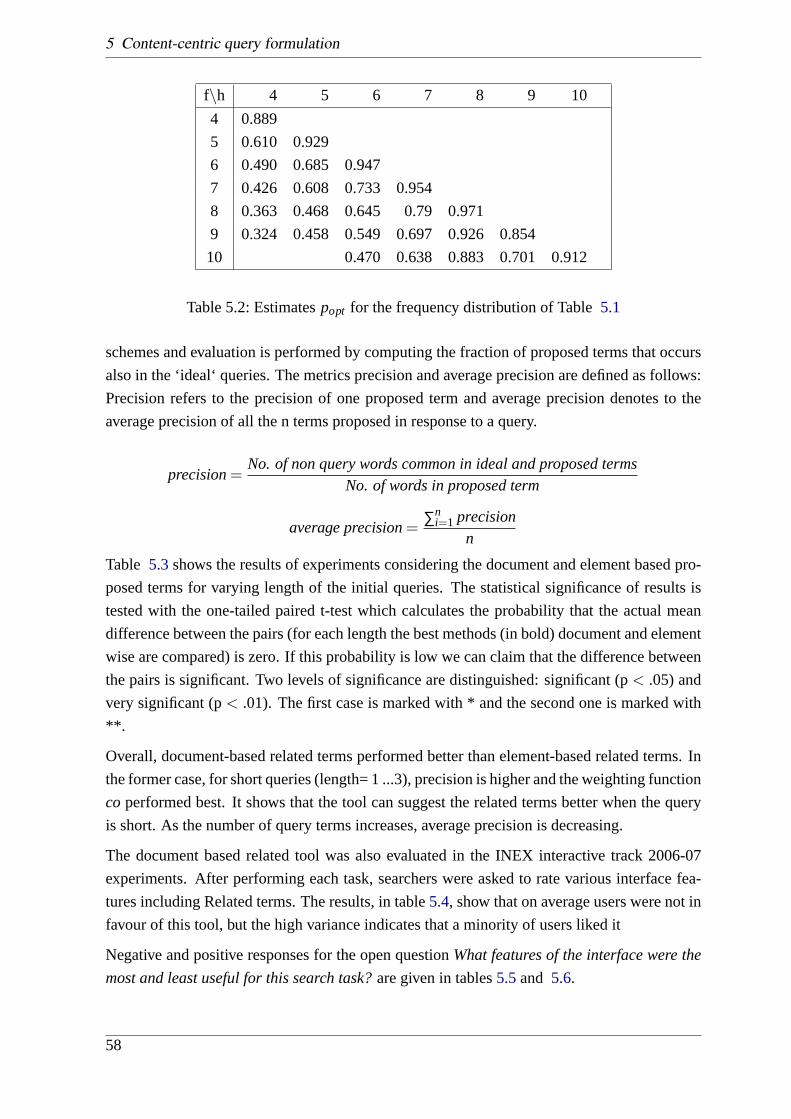
5.6.2 Parameter estimation. . . . . . . . . . . . . . . . . . . . . . . . . . 56
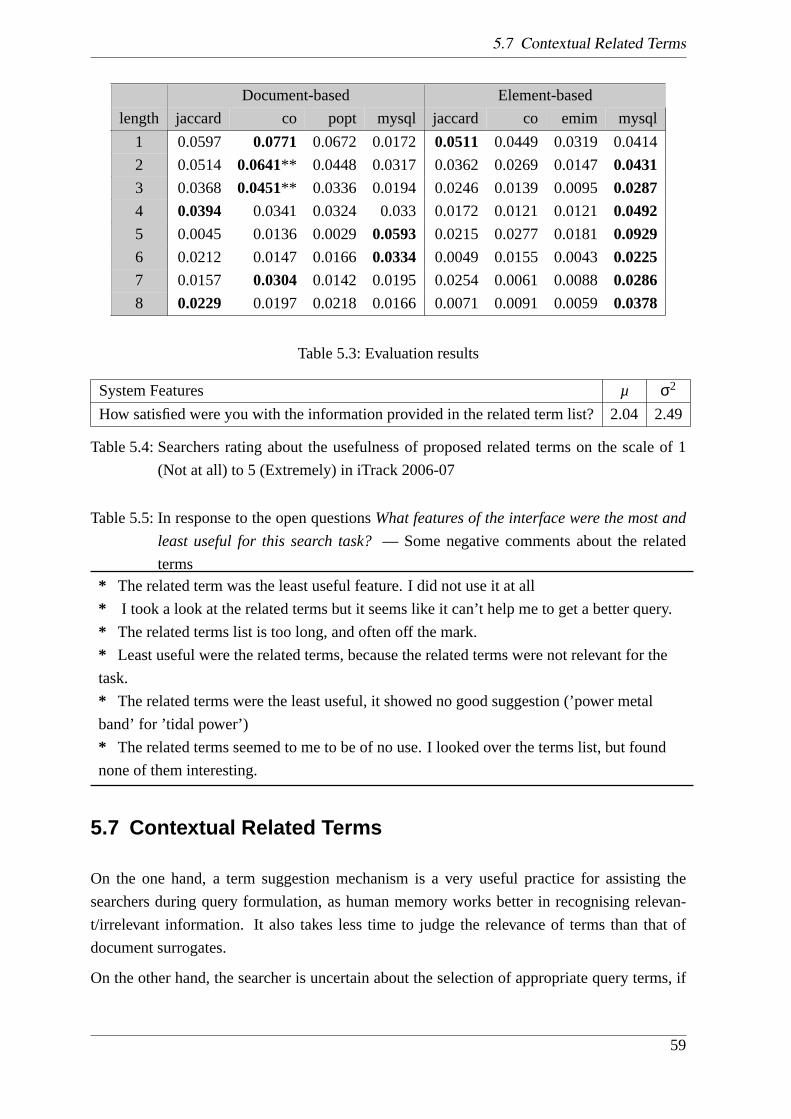
5.6.3 Experiments . . . . . . . . . . . . . . . . . . . . . . . . . . . . . . 57
5.7 Contextual Related Terms. . . . . . . . . . . . . . . . . . . . . . . . . . . . 59
5.8 Evaluation. . . . . . . . . . . . . . . . . . . . . . . . . . . . . . . . . . . . 62
5.9 Conclusion . . . . . . . . . . . . . . . . . . . . . . . . . . . . . . . . . . . 64
6 Element retrieval interfaces and visualisation 65
6.1 Introduction. . . . . . . . . . . . . . . . . . . . . . . . . . . . . . . . . . . 65
6.2 Research questions. . . . . . . . . . . . . . . . . . . . . . . . . . . . . . . 66
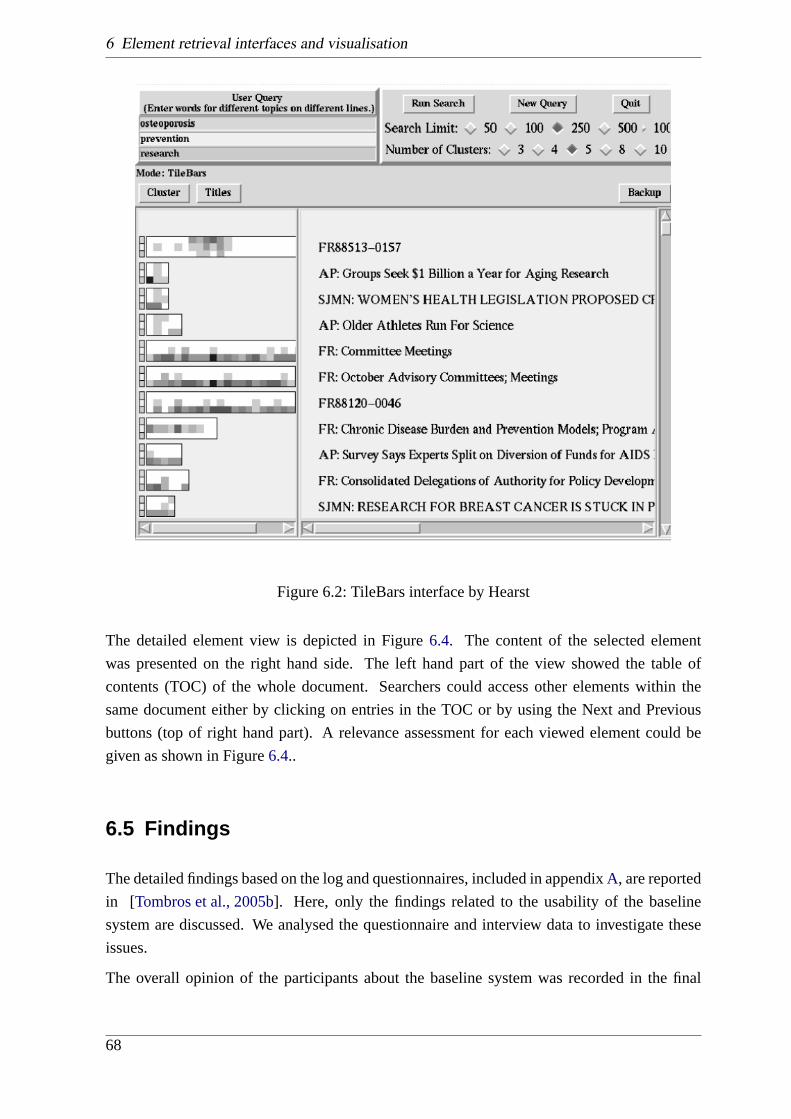
6.3 Related Work. . . . . . . . . . . . . . . . . . . . . . . . . . . . . . . . . . 66
6.4 Baseline System. . . . . . . . . . . . . . . . . . . . . . . . . . . . . . . . . 67
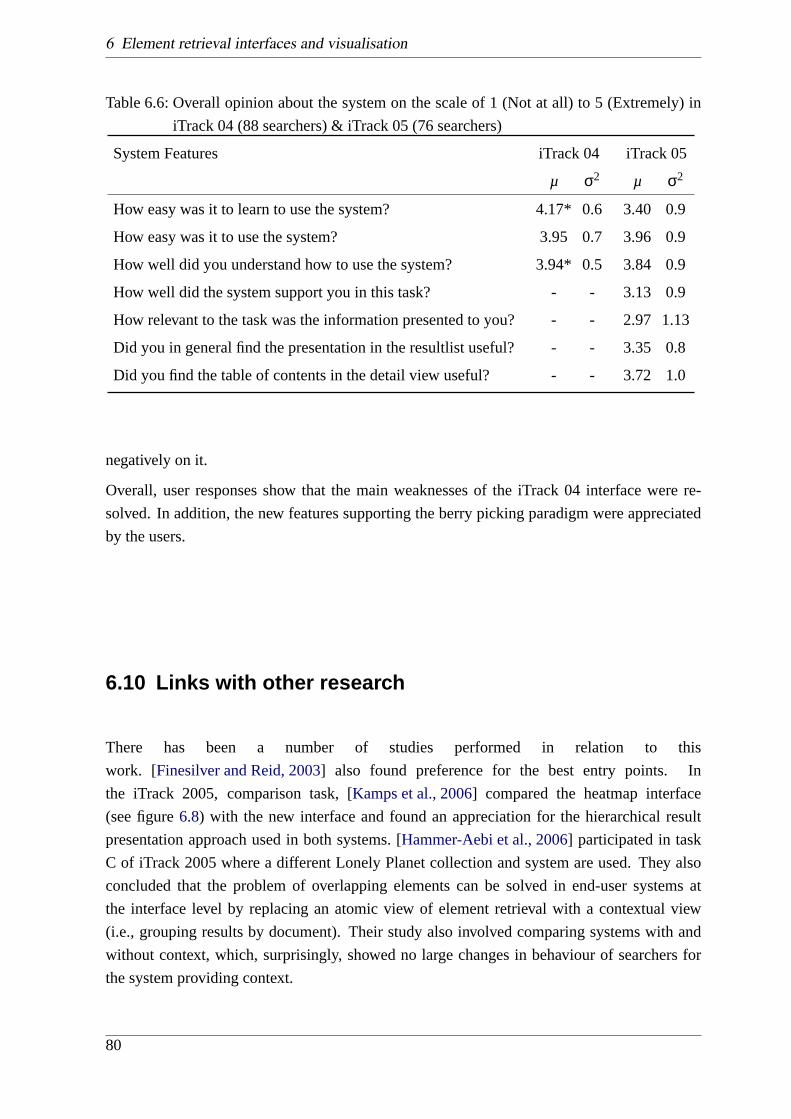
6.5 Findings. . . . . . . . . . . . . . . . . . . . . . . . . . . . . . . . . . . . . 68
Page 7
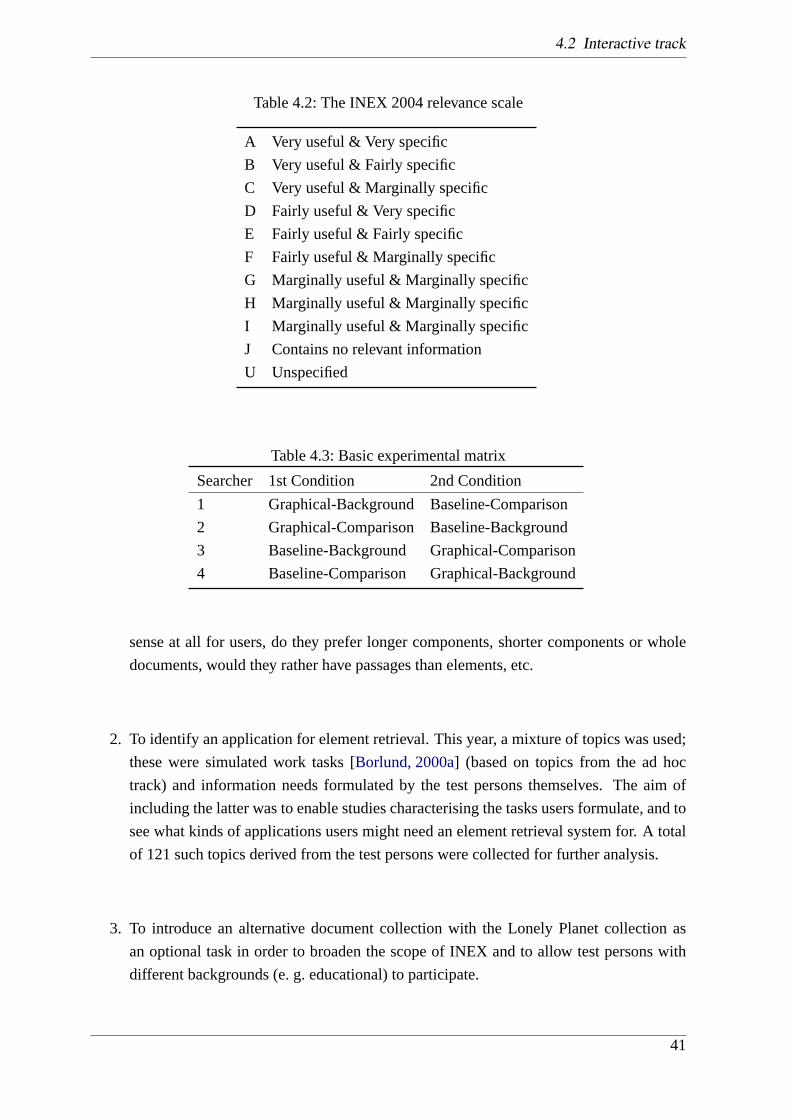
6.6 Baseline vs. graphical interface with treemap. . . . . . . . . . . . . . . . . 72
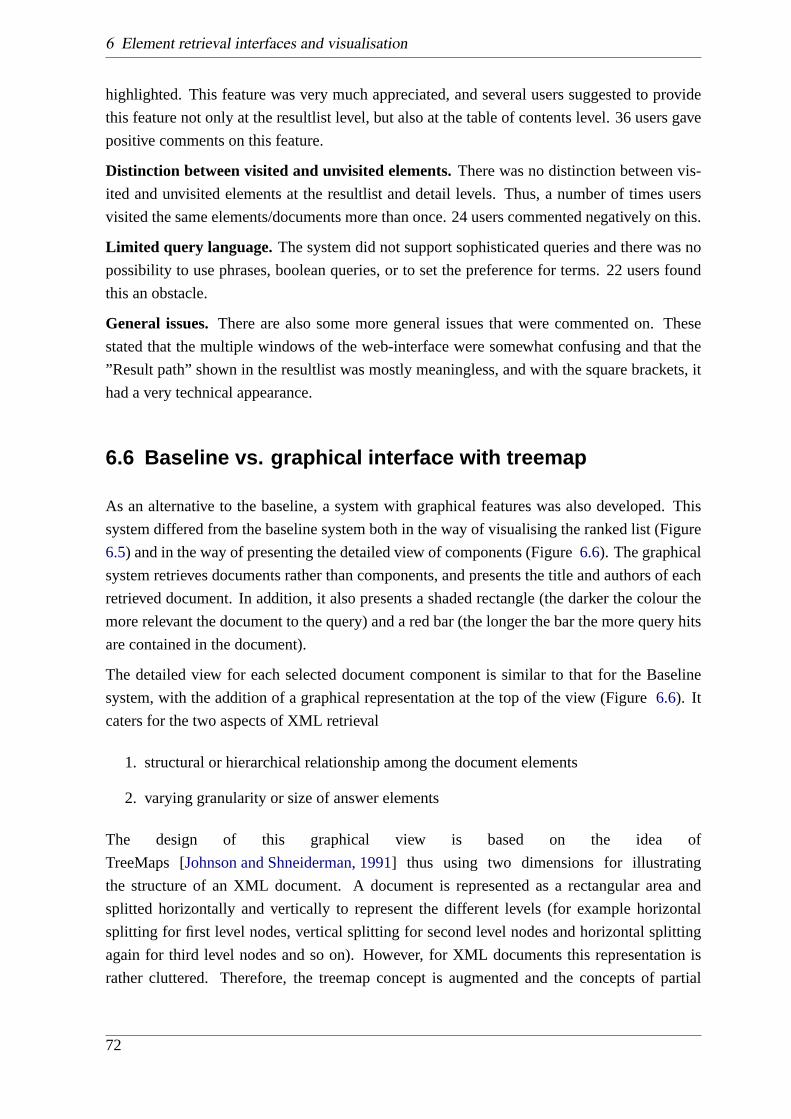
6.7 Findings. . . . . . . . . . . . . . . . . . . . . . . . . . . . . . . . . . . . . 73
6.8 iTrack05 system. . . . . . . . . . . . . . . . . . . . . . . . . . . . . . . . . 75
6.9 Findings. . . . . . . . . . . . . . . . . . . . . . . . . . . . . . . . . . . . . 78
6.10 Links with other research. . . . . . . . . . . . . . . . . . . . . . . . . . . . 80
6.11 Conclusion . . . . . . . . . . . . . . . . . . . . . . . . . . . . . . . . . . . 81
7 User preference for elements and their granularity 83
7.1 Research questions. . . . . . . . . . . . . . . . . . . . . . . . . . . . . . . 83
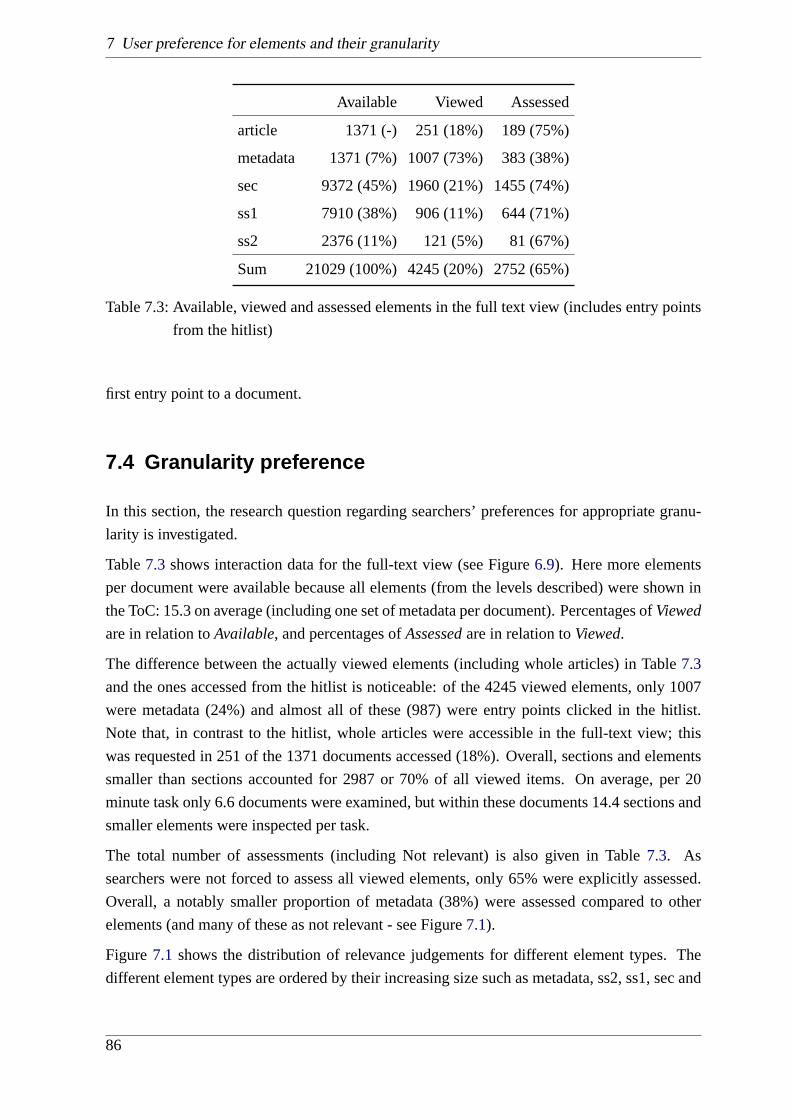
7.2 Experimental Settings. . . . . . . . . . . . . . . . . . . . . . . . . . . . . . 84
7.3 Entry point preference. . . . . . . . . . . . . . . . . . . . . . . . . . . . . 84
7.4 Granularity preference. . . . . . . . . . . . . . . . . . . . . . . . . . . . . 86
7.5 Element size preference. . . . . . . . . . . . . . . . . . . . . . . . . . . . . 87
7.6 Links with other research. . . . . . . . . . . . . . . . . . . . . . . . . . . . 90
7.7 Conclusion . . . . . . . . . . . . . . . . . . . . . . . . . . . . . . . . . . . 91
8 Element retrieval vs. passage retrieval 93
8.1 Introduction. . . . . . . . . . . . . . . . . . . . . . . . . . . . . . . . . . . 93
8.2 Research questions. . . . . . . . . . . . . . . . . . . . . . . . . . . . . . . 94
8.3 Related Work. . . . . . . . . . . . . . . . . . . . . . . . . . . . . . . . . . 94
8.4 User interfaces . . . . . . . . . . . . . . . . . . . . . . . . . . . . . . . . . 94
8.5 Experimental Settings. . . . . . . . . . . . . . . . . . . . . . . . . . . . . . 98
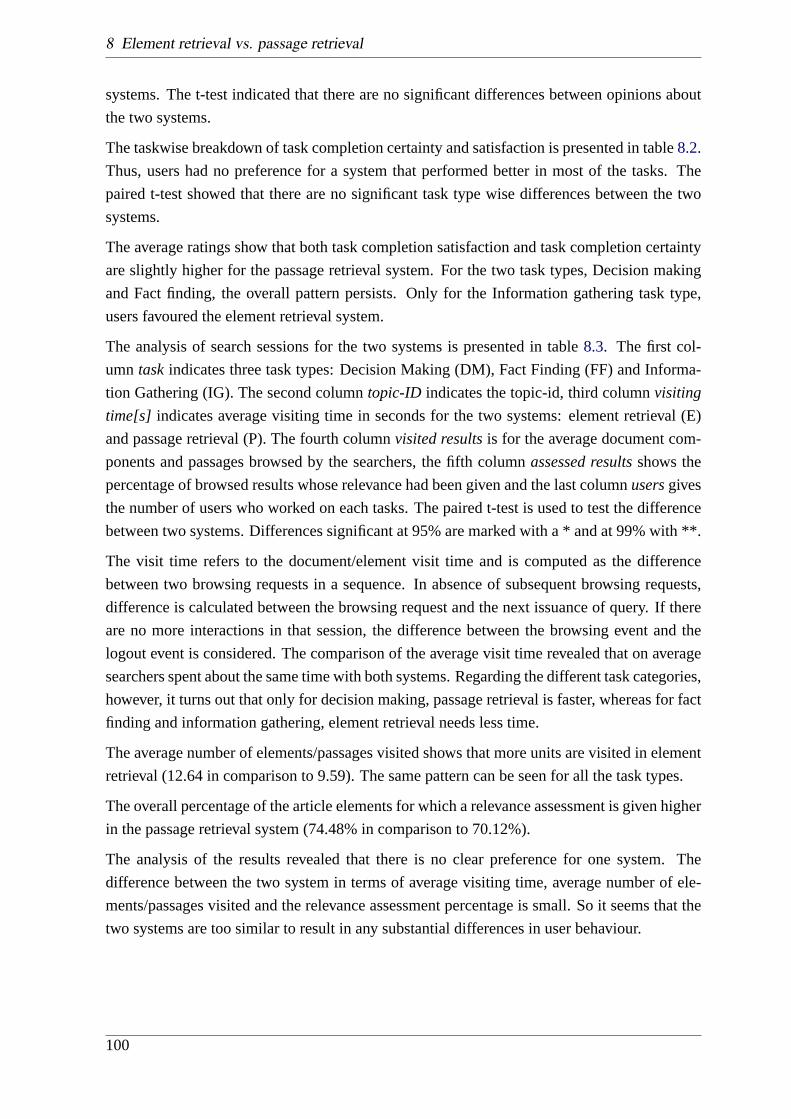
8.6 Findings. . . . . . . . . . . . . . . . . . . . . . . . . . . . . . . . . . . . . 99
8.6.1 Element vs Passage. . . . . . . . . . . . . . . . . . . . . . . . . . . 99
8.6.2 Contextual ToC vs. ToC based on retrieved passage. . . . . . . . . . 101
8.6.3 Relative importance of document parts and paragraph highlighting. . 103
8.7 Expectations. . . . . . . . . . . . . . . . . . . . . . . . . . . . . . . . . . .106
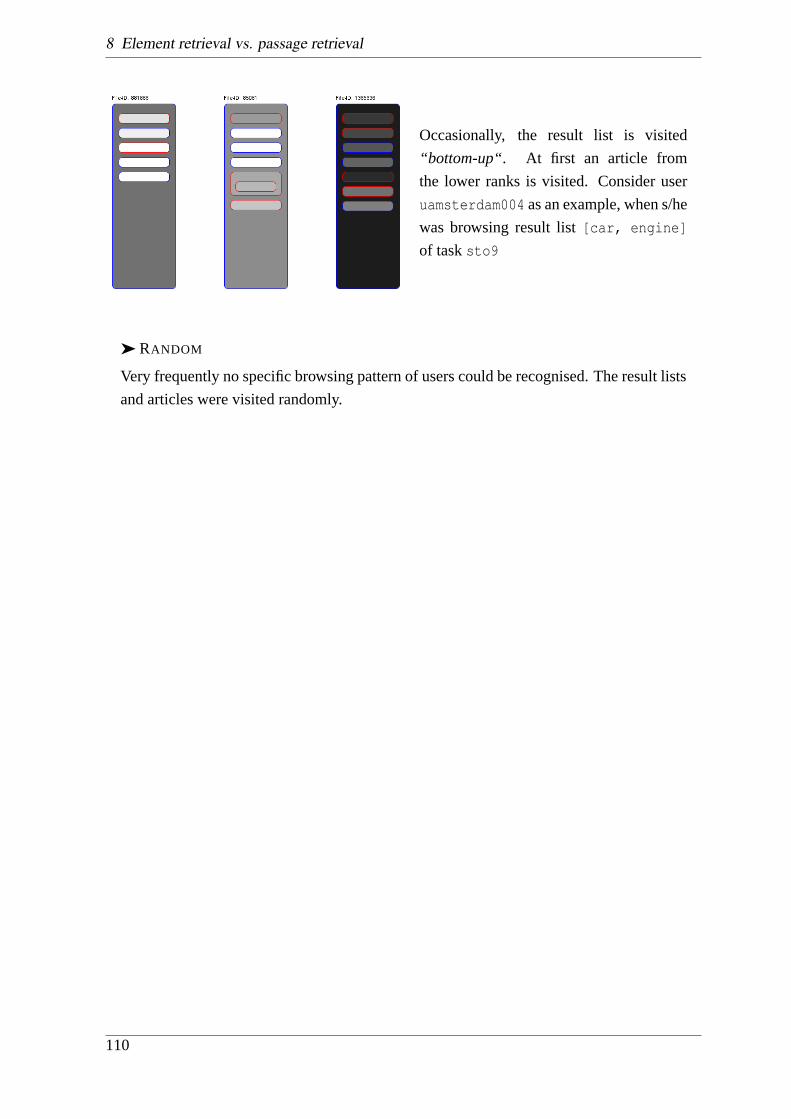
8.8 Visualising searchers interaction. . . . . . . . . . . . . . . . . . . . . . . . 107
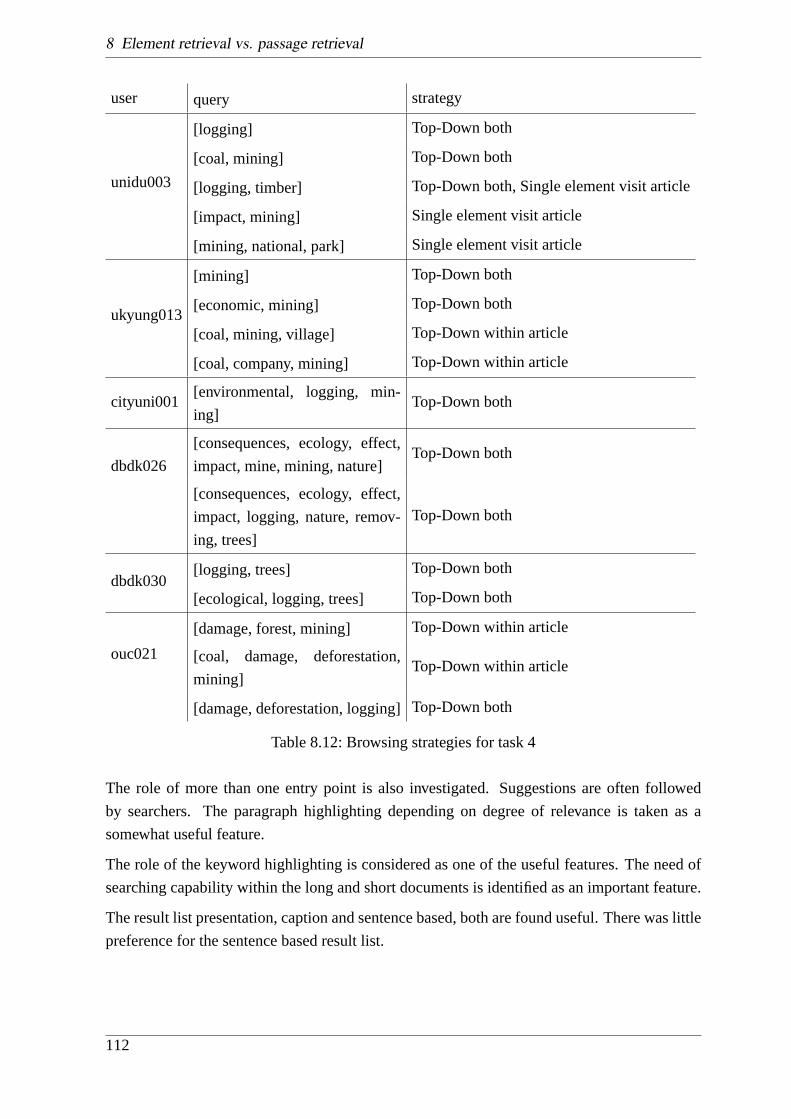
8.8.1 Browsing behaviour. . . . . . . . . . . . . . . . . . . . . . . . . . 108
8.9 Links with other research. . . . . . . . . . . . . . . . . . . . . . . . . . . . 111
8.10 Conclusion . . . . . . . . . . . . . . . . . . . . . . . . . . . . . . . . . . .111
9 Interaction patterns and interest indicators 113
9.1 Relevance feedback. . . . . . . . . . . . . . . . . . . . . . . . . . . . . . .113
9.2 Research questions. . . . . . . . . . . . . . . . . . . . . . . . . . . . . . .115
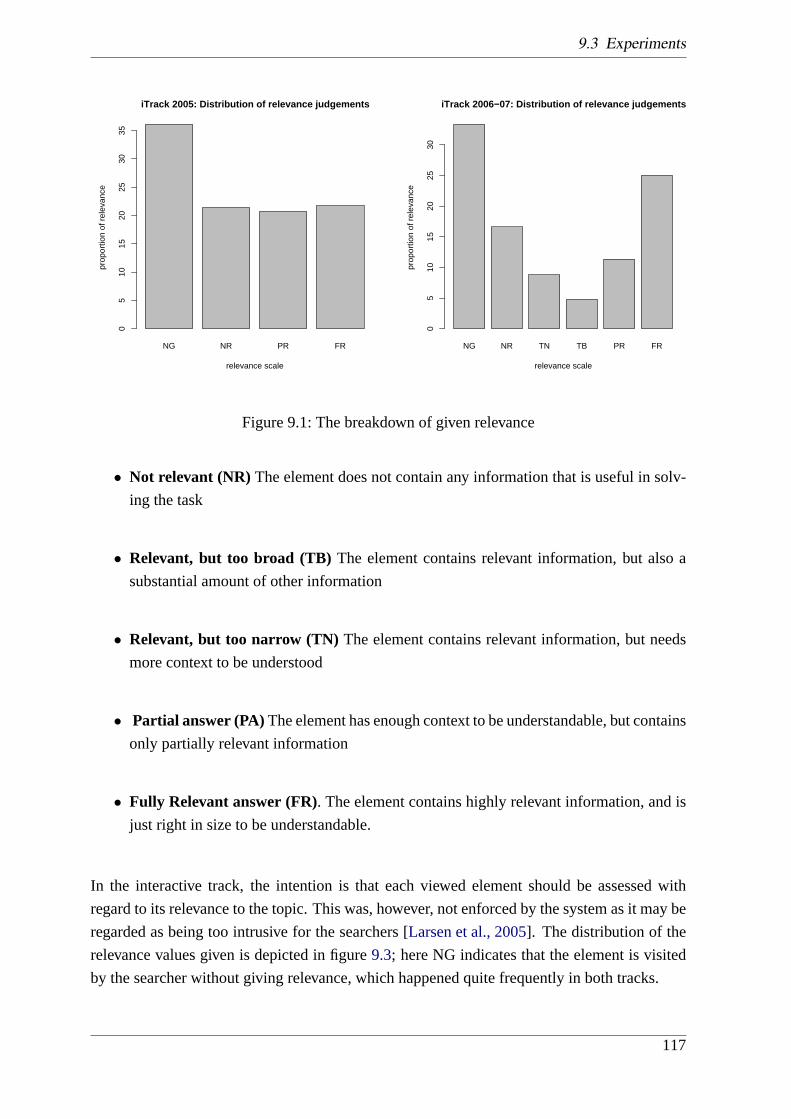
9.3 Experiments. . . . . . . . . . . . . . . . . . . . . . . . . . . . . . . . . . .116
9.4 Capturing Data. . . . . . . . . . . . . . . . . . . . . . . . . . . . . . . . .118
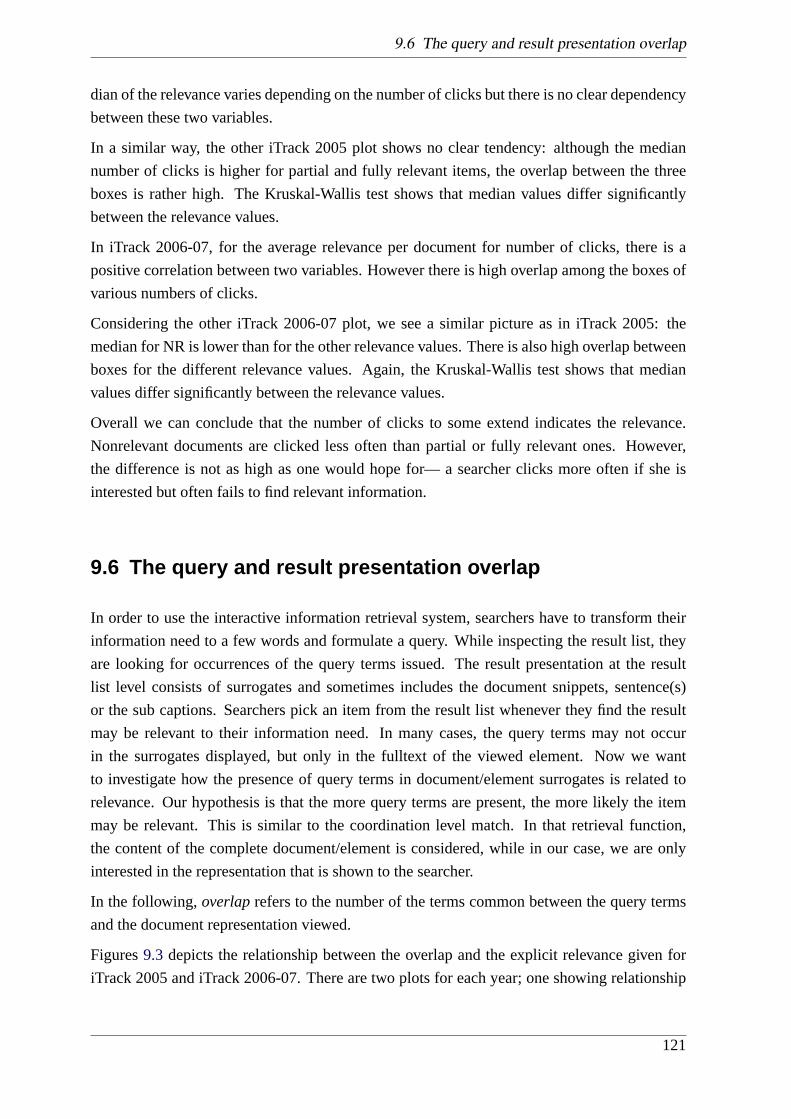
9.5 Clicks within the documents. . . . . . . . . . . . . . . . . . . . . . . . . . 120
9.6 The query and result presentation overlap. . . . . . . . . . . . . . . . . . . 121
9.7 Reading time . . . . . . . . . . . . . . . . . . . . . . . . . . . . . . . . . .123
Page 8
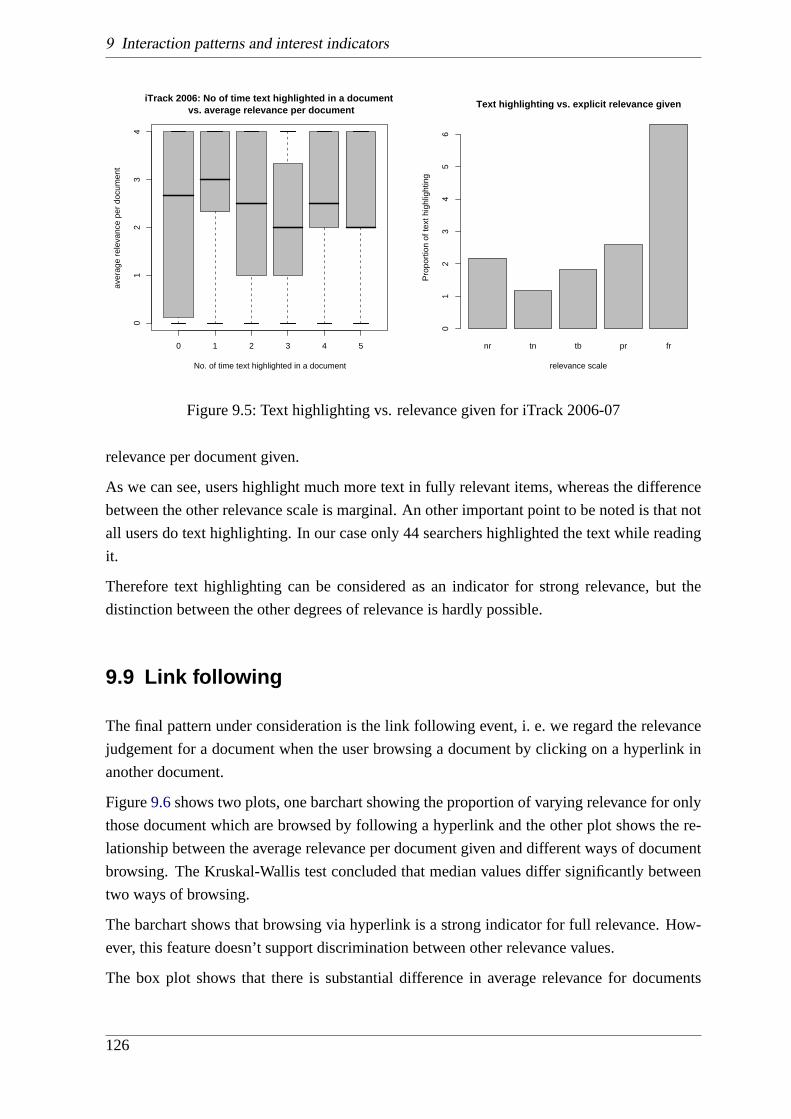
9.8 Highlighting text . . . . . . . . . . . . . . . . . . . . . . . . . . . . . . . .125
9.9 Link following . . . . . . . . . . . . . . . . . . . . . . . . . . . . . . . . .126
9.10 Interest indicators as relevance predictors. . . . . . . . . . . . . . . . . . . 127
9.11 Link with other research. . . . . . . . . . . . . . . . . . . . . . . . . . . . 131
9.12 Conclusion . . . . . . . . . . . . . . . . . . . . . . . . . . . . . . . . . . .131
10 Conclusion and outlook 135
List of figures 137
List of tables 138
Bibliography 141
Appendices 157
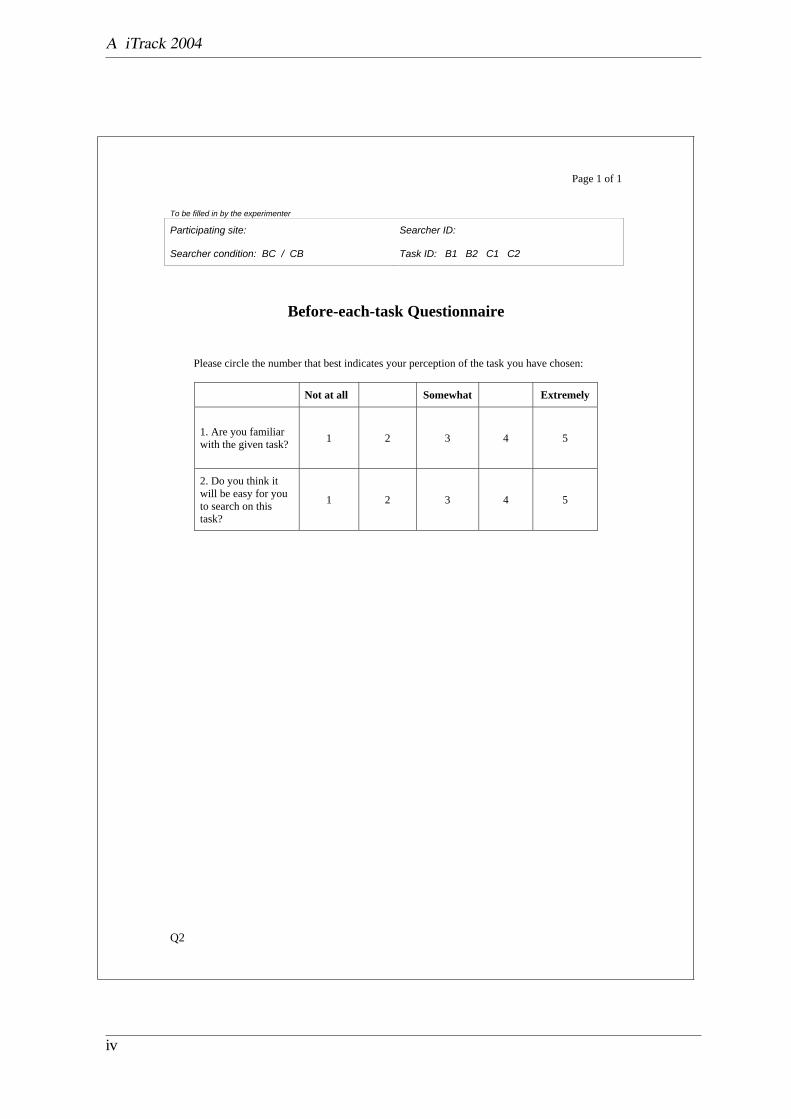
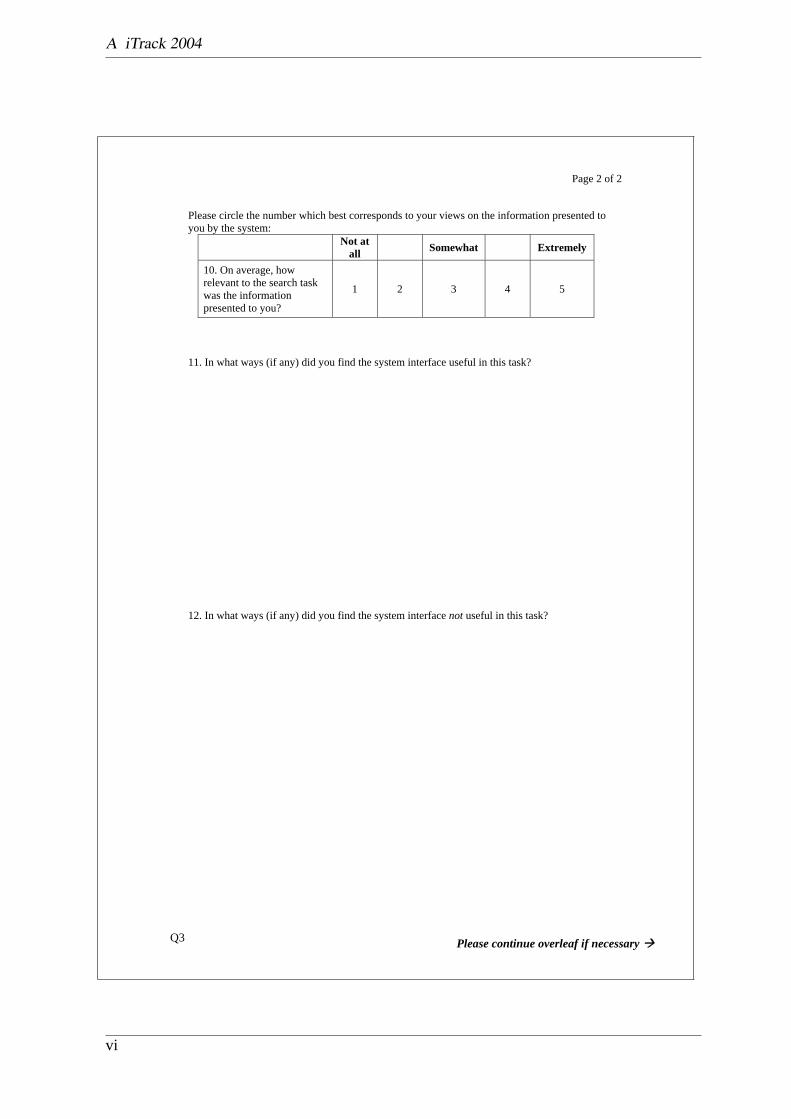
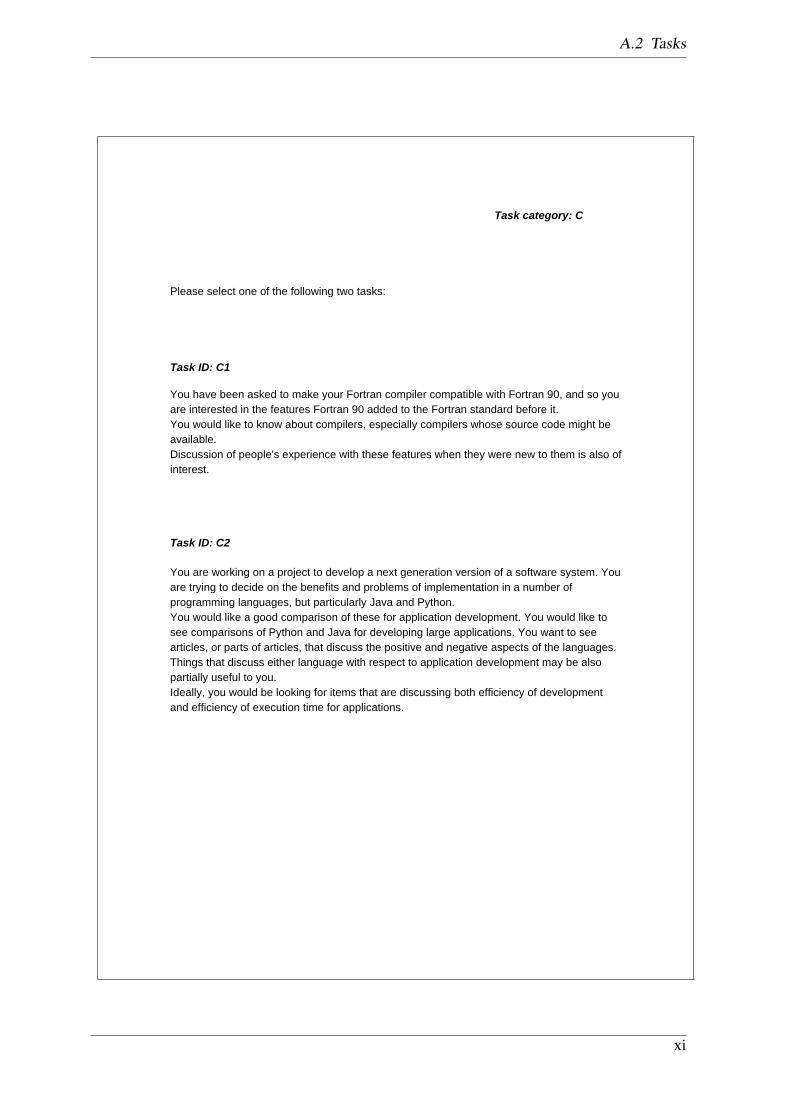
A iTrack 2004 i
A.1 Questionnaires . . . . . . . . . . . . . . . . . . . . . . . . . . . . . . . . . i
A.2 Tasks . . . . . . . . . . . . . . . . . . . . . . . . . . . . . . . . . . . . . . ix
B iTrack 2005 xiii
B.1 Questionnaires . . . . . . . . . . . . . . . . . . . . . . . . . . . . . . . . . xiii
B.2 Tasks . . . . . . . . . . . . . . . . . . . . . . . . . . . . . . . . . . . . . . xxi
C iTrack 2006-07 xxv
C.1 Search tasks. . . . . . . . . . . . . . . . . . . . . . . . . . . . . . . . . . .xxv
C.2 Questionnaires. . . . . . . . . . . . . . . . . . . . . . . . . . . . . . . . .xxix
C.3 Query statistics. . . . . . . . . . . . . . . . . . . . . . . . . . . . . . . . .xxix
C.4 Wikipedia document ID 945748. . . . . . . . . . . . . . . . . . . . . . . . xxix
D iTrack 2008 xxxix
D.1 Search tasks. . . . . . . . . . . . . . . . . . . . . . . . . . . . . . . . . . .xxxix
D.1.1 Fact finding. . . . . . . . . . . . . . . . . . . . . . . . . . . . . . .xxxix
D.1.2 Research. . . . . . . . . . . . . . . . . . . . . . . . . . . . . . . .xxxix
Page 9
Acknowledgements
All praises to the Allah Almighty who induced the man with intelligence, knowledge and
wisdom. It is He who gave me ability, perseverance and determination to complete this work
successfully.
It gives me great pleasure in acknowledging my profound gratitude to my supervisor, Norbert
Fuhr, for his inspiring guidance, continuous encouragement and valuable comments for revis-
ing parts of manuscript. Norbert was also truly generous in understanding my family needs. I
am fortunate to have had Norbert as my supervisor.
My special thanks to Mounia Lalmas for her encouragements and useful suggestions during
the period we worked together on INEX. I also take this opportunity to express my deep
appreciation to Birger Larsen and Anastosios Tombross for co-organising interactive track.
My thanks are also due to my fellow research scholars for their very co-operative, nice and
friendly company throughout the period of my studies. My special thanks to our brilliant and
helpful colleague, Henrik Nottelmann (Late), who left us too early.
Many appreciations and special thanks to Sascha Kriewel, Claus Peter Klas, Andre Schaefer,
Norbert Govert and Thomas Beckers for their technical, administrative and academic support.
My loving thanks are owed to my husband Saleem who bore with me patiently and stood along
me in every difficult moment through out. Many loves to my son Anas, who is a source of love
and happiness for me.
Last but not the least my special thanks to my parents, sisters, brothers and mamoon ji for
their special prayers and encouragement. Their un-conditional love and undoubted belief in
me have sustained me throughout this work.
vii
Page 11
Abstract
In recent years there has been a growing realisation in the IR community that the interaction
of searchers with information is an indispensable component of the IR process. As a result,
issues relating to interactive IR have been extensively investigated in the last decade. This
research has been performed in the context of unstructured documents or in the context of
the loosely-defined structure encountered in web pages. XML documents, on the other hand,
define a different context, by offering the possibility of navigating within the structure of a
single document, or of following links to other documents.
Relatively little work has been carried out to study user interaction with IR systems that make
use of the additional features offered by XML documents. As part of the INEX initiative for
the evaluation of XML retrieval, the INEX interactive track has focused on interactive XML
retrieval since 2004. Here user friendly exposition to various features of XML documents is
provided and some new features are designed and implemented to enable searchers to have
access to their desired information in an efficient manner.
In this study interaction entails three levels: query formulation, inspecting result list, and ex-
amining the detail. For query formulation, suggesting related terms is a conventional method
to assist searchers. Here we investigate the related terms derived from two different co-
occurrence units: elements and documents. In addition, contextual aspect is added to facilitate
the searchers for appropriate selection of terms. Results showed the usefulness of suggesting
related terms and some what acceptance of the contextual related tool.
For inspecting the result list, classic document retrieval systems such as web search engines
retrieve whole documents, and leave it to the searchers to collect their required information
from possibly a lengthy text. In contrast, element retrieval aims at a focused view of informa-
tion by pointing to the optimal access points of the document. A number of strategies have
been investigated for presenting result lists.
For examining the detail of a document, traditionally the complete document is presented to
a searcher and here again the searcher has to put in effort to reach its required information.
We investigated the use of additional support such as a table of contents along with document
detail. In addition, we also investigated graphical representations of documents depicting its
ix
Page 12
structure and granularity of retrieved elements along with their estimated relevance. Here the
table of contents was found to be a very useful features for examining details.
In order to conduct the analysis of searcher’s interaction, a visualisation technique based on
Tree Map was developed. It depicts the search interaction with element retrieval system. A
number of browsing strategies has been identified with the help of this tool.
The value of element retrieval for searchers and comparison between two focused approaches
such as element and passage retrieval system was also evaluated. The study suggests that
searchers find elements useful for their tasks and they locate a lot of the relevant information
in specific elements rather than full documents. Sections, in particular, appear to be helpful.
In order to provide user-specific support, the system needs feedback from searchers, who in
turn, are very reluctant to give this information explicitly. Therefore, we investigated to what
extent the different features can be used as relevance predictors. Of the five features regarded,
primarily the reading time is a useful relevance predictor. Overall, relevance predictors for
structured documents seem to be much weaker than for the case of atomic documents.
Page 13
1 Introduction
Online searching has taken an important place in our lives. Search engines are used for a
wide variety of tasks ranging from simple daily life inquiries to solving complex tasks—for
example for getting familiar to some concept for writing a research report. Online searching
has been in a steady growth for many years. About 7.8 billion web search queries were posed
alone in the USA in June 2008, representing a growth of 6.3% compared to same period in the
previous year [Bausch and McGiboney, 2008a]. The three largest search engine providers in
the United States are currently Google1, Yahoo!2 and MSN / Windows Live3 with 120, 113
and 99 million visitors respectively. On the average, one user visited 107 different domains in
58 sessions in a month [Bausch and McGiboney, 2008b].
Typically a search engine expects the search expression as query and matches the query with
the terms from textual documents. Information Retrieval (IR) facilitates this process. A wide
range of models for achieving this efficiently and effectively have been developed e.g. the
Boolean model, the Vector space model and the probabilistic model. In its early age, IR re-
search was focused to achieve this matching efficiently and effectively and evaluation of such
systems was performed in isolation in laboratories. With the advancement in internet tech-
nology, rapid growth of the world wide web and availability of digital information, interactive
information retrieval (IIR) became more significant and user-centered IR came into the focus
of many research activities.
Interaction between users and information systems is the distinguishing characteristic of IR.
It is the major component in all practical realisations of IR to such an extent that IR with-
out interaction is hardly conceivable [Saracevic, 1997]. IIR is the study of human interac-
tion with information retrieval systems [Robins, 2000] and its goal is to understand which
engines, information structures and interface functionalities best support the information
seeking in work (tasks) context [Ingwersen, 2000]. Since the last decade, there has been
a growing interest in interdisciplinary research approaches both in the information science
area, especially within the IR field, and in the computer science area, within the HCI field
([Hewins, 1990], [Koenemann and Belkin, 1996], [Sugar, 1995]). One central issue within IR
research today is how systems and intermediary mechanisms should be designed to support
1http://www.google.com (Last date accessed on January 6, 2009)2http://www.yahoo.com (Last date accessed on January 6, 2009)3http://www.msn.com (Last date accessed on January 6, 2009)
1
Page 14
1 Introduction
interactive information seeking tasks.
The state of the art search engines Google1, Yahoo!2 and MSN / Windows Live3 operate with
very simple interfaces. Searchers use these search engines whenever they have some infor-
mation need originating from the Anomalous State of Knowledge(ASK) [Belkin et al., 1982].
Users transform their information need into a query normally consisting of a few words and
issue it to the search engine. After matching, the search engine ranks and presents documents
listed in decreasing likelihood of relevance. Each document is represented by a surrogate typ-
ically consisting of its title, query-based summary of the document and its Uniform Resource
Locator (URL).
A user engages himself in an information seeking process by interacting with the result set
and by inspecting the documents depending on their relevance to the information need. This
is an iterative activity in which the searcher is indulged as long as the searcher’s information
need is not completely fulfilled. This information seeking can become a cumbersome task
when a user is searching in long documents such as books, manuals, legal documents, travel
guides, scientific articles, etc. The state of the art search engines leave it to the user to dig
their required information from the huge amount of retrieved information. For example, users
have to find out themselves which document parts contributed to the summary presented at the
result presentation level. These engines also lack the information of possible entry points into
the document and direct links to the retrieved part of the document. These missing features
make the information seeking task difficult.
Structured Document Retrieval (SDR) allows users to retrieve document components that are
more focussed to their information needs, e.g. a chapter of a book instead of an entire book,
a section or multiple sections of a document instead of a complete document. In general, any
document can be considered structured according to one or more structure types. The structure
can be either implicit or explicit. For example, a book may have a structure that consists of
certain components by virtue of being a book, e.g. it contains a title page, chapters, etc. The
chapters are composed of paragraphs which are composed of sentences, which are composed
of words, etc. If the book is a textbook, it will typically have a richer structure including a table
of contents, an introduction or preface, an index, a bibliography, etc. The chapters may contain
figures, graphs, photographs, tables, citations, etc. This structure may be formalised explicitly
by a “markup” language standard such as HTML, SGML or eXtensible Markup Language
(XML).
XML is a set of standards to exchange and publish the information in a structured man-
ner [Marchal, 2000]. In contrast to HTML, which is layout-oriented, XML follows the concept
of separating a document’s logical structure (using macro-level markup for chapters, sections,
paragraphs, etc.) and semantics (based on micro-level markup, such as MathML for mathe-
matical formulae, CML for chemical formulae, etc.) from its layout.
2
Page 15
Structured retrieval has become increasingly important in recent years because of the growing
use of XML. XML is used for web content, for documents produced by office productivity
suites, for the import and export of text content in general, and many other applications. This
is becoming a de facto standard. The principle of such retrieval is [Manning et al., 2008]:
A system should always retrieve the most specific part with appropriate granularity
of a document answering the query.
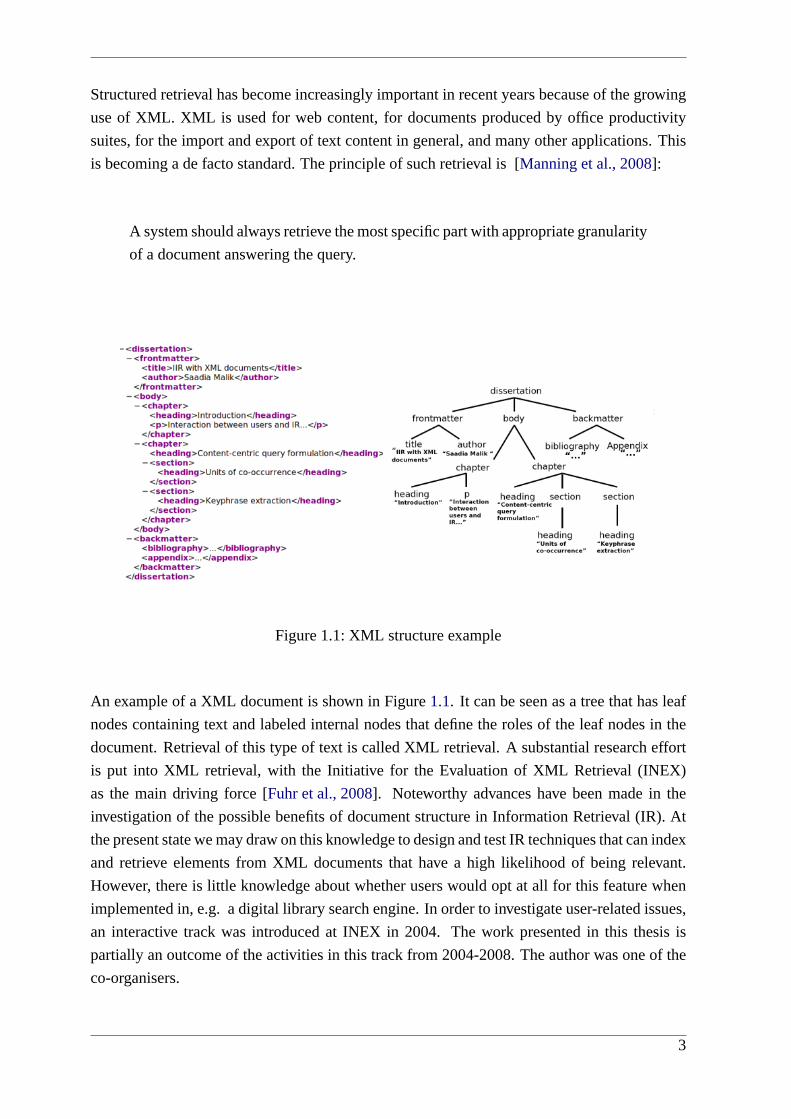
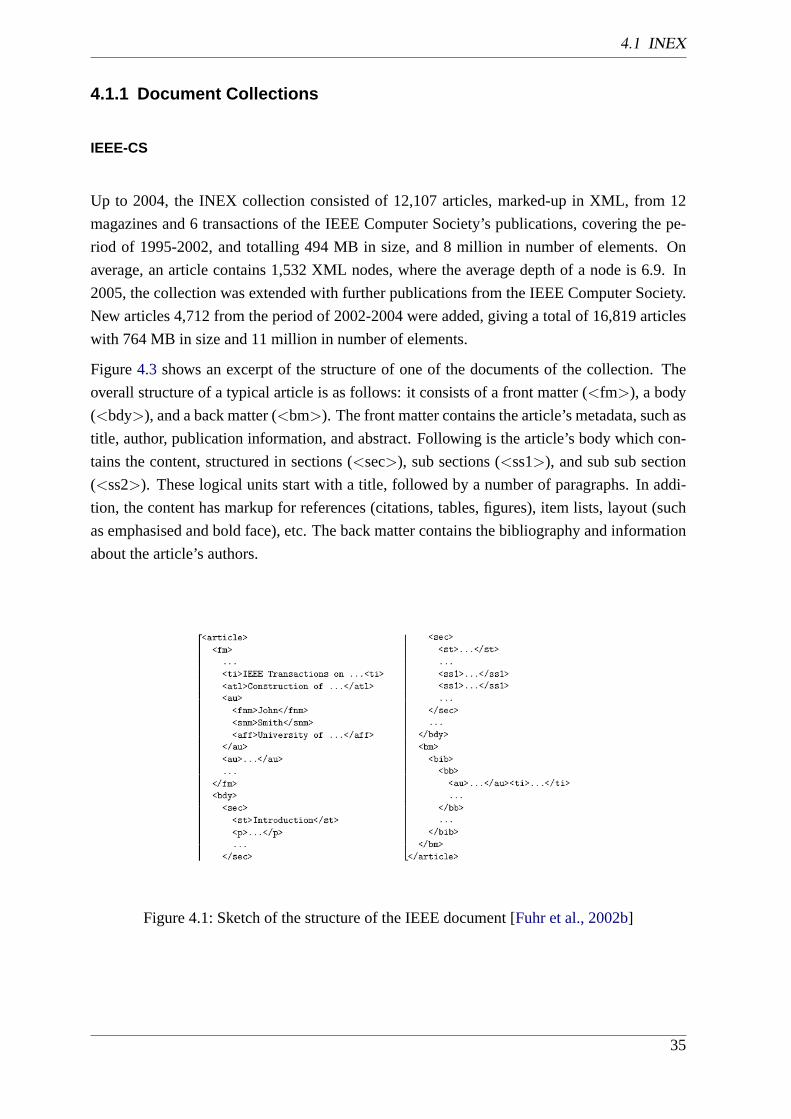
Figure 1.1:XML structure example
An example of a XML document is shown in Figure1.1. It can be seen as a tree that has leaf
nodes containing text and labeled internal nodes that define the roles of the leaf nodes in the
document. Retrieval of this type of text is called XML retrieval. A substantial research effort
is put into XML retrieval, with the Initiative for the Evaluation of XML Retrieval (INEX)
as the main driving force [Fuhr et al., 2008]. Noteworthy advances have been made in the
investigation of the possible benefits of document structure in Information Retrieval (IR). At
the present state we may draw on this knowledge to design and test IR techniques that can index
and retrieve elements from XML documents that have a high likelihood of being relevant.
However, there is little knowledge about whether users would opt at all for this feature when
implemented in, e.g. a digital library search engine. In order to investigate user-related issues,
an interactive track was introduced at INEX in 2004. The work presented in this thesis is
partially an outcome of the activities in this track from 2004-2008. The author was one of the
co-organisers.
3
Page 16
1 Introduction
1.1 Objectives of the dissertation
The main objective of this dissertation is to investigate the methods that can be effective and
supportive for users when they are interacting with XML documents. The dissertation attempts
to contribute to the field of IIR by:
• Investigating the usefulness of element retrieval for users
• Developing a number of result/document presentation strategies
• Developing query formulation support during the course of interaction with the search
system
• Identification of relevance indicating behaviour
• User-centered evaluation of the developed approaches considering different corpuses
• Setting up a framework for the user-centered evaluation
1.2 Research questions
The following research questions are addressed in this thesis:
• A searcher’s first interaction with the interactive retrieval system is query formulation.
Suggesting related terms is a conventional method to assist searchers. Should related
terms for expanding/replacing a query be based on complete documents or on elements?
Which information about each related term should be shown? What is the usefulness of
Keyword In Context (KWIC) when presented with the recommended related terms?
• After the query formulation, the searcher’s next interactions with the system are inspec-
tion of the result list and examining details of the results in order to find the relevant
information. Which is best strategy for presenting results? Which supports can be pro-
vided for examining details?
• Element and passage retrieval approaches are aimed at providing the focused view of
information. What are the similarities and differences between these two?
• Are elements valuable to users in a retrieval situation, or are users just as well served
by IR systems that retrieve whole documents? Is their preference towards elements or
towards documents? What granularity of elements do users prefer?
• Can we identify relevance indicating behaviour from the interaction logs of users?
4
Page 17
1.3 Structure of dissertation
1.3 Structure of dissertation
The remainder of this thesis is organised as follows:
Chapter 2: Theoretic foundation — This chapter provides the background material on in-
formation retrieval and interactive information retrieval. It also contains details of their con-
tributing elements. These include information needs, tasks, relevance, query (re)formulation,
result presentation, visualisation and evaluation.
Chapter 3: DAFFODIL — Here we introduce the search system DAFFODIL and describe its
architecture and design details.
Chapter 4: INEX and interactive track — In this chapter, we give the description of XML
retrieval, INEX and interactive track. The interactive track description includes the experi-
mental settings of the years 2004–2007.
Chapter 5: Content-centric query formulation — This chapter is about the development of
a tool that can assist searchers during query formulation. It suggests related terms and also
offers the context of these terms. Comparisons among the various weighting schemes and
document-based vs. element-based related terms are made.
Chapter 6: Element retrieval interfaces and visualisation— We focus on investigating
the different strategies for presenting the result list and document details. These include lists
of elements presentation, document wise result list presentation and relevant results in the
context of the document presentation. For the result detail, logical navigation support and a
visualisation approach is used. Usability studies are performed and their results are reported.
Chapter 7: User preference for elements and their granularity— This chapter is focused to
examine the value of element retrieval system for users in a retrieval situation. The preference
for the granularity is also investigated.
Chapter 8: Element retrieval vs. passage retrieval— The comparison between interfaces
based on these two systems is described in this chapter. In addition, the role of the table
of contents and the role of importance of one part of the document relative to others is also
investigated.
5
Page 18
1 Introduction
Chapter 9: Interaction patterns and interest indicators — In this chapter we analyse the
searchers interaction logs in order to find the user interest indicators. The investigated indi-
cators include time spent on a page, clicks to navigate within the document, query and result
presentation overlap, highlighting a piece of information with mouse and following a link to
another document. Descriptive statistical and classification methods are used to perform the
analysis.
Chapter 10: Conclusion— The conclusions drawn from the overall thesis and the avenues
for future work are identified in this chapter.
6
Page 19
2 Theoretic foundation
In this chapter we provide the background material on interactive information
retrieval. We start with the broader picture of information seeking and narrow
down to interactive information retrieval and classic information retrieval mod-
els. A description of their contributing elements is also given. These include
information needs, tasks, relevance, query (re)formulation, result presentation and
visualisation. The chapter concludes with a brief description of evaluation meth-
ods.
Since many years, there are two major directions in information retrieval research: Thesystem-
orientedapproach takes a simplified view on user behaviour: a user submits a query and then
looks through the ranked items one by one; thus, the goal of the system is to rank relevant
items at the top of the list, for which various well-founded models have been developed. In
contrast, thecognitiveapproach focuses on the user; based on empirical studies (mostly with
systems that are not state of the art from the research point of view), they construct models of
the user’s cognitive processes during retrieval. So far, there have been very few attempts to
integrate the two approaches.
The system-oriented view of information retrieval has been challenged on many fronts. These
include dynamic information needs, non-binary relevance, information seeking and the need to
take into account the interaction and human involvement in the evaluation. Recent theoretical
and empirical work in information seeking and retrieval suggests that information retrieval is
but one means of information seeking which takes place in a context determined by e. g. a per-
son’s task, its phase, and situation. For larger tasks one may identify multiple stages, strategies,
tactics or modes of information access and relevance [Ingwersen and Jarvelin, 2005].
The TREC interactive track [Voorhees and Harman, 2000] was an attempt to verify the as-
sumptions underlying the system-oriented approach. Quite surprisingly, the results of this
evaluation showed that differences in system performance vanish in interactive retrieval. As
described in [Turpin and Hersh, 2001] this result is due to the fact that users can easily iden-
tify the relevant entries in a list of documents. Obviously, a good ranking is not sufficient for
effective interactive retrieval. Thus, cognitive factors should be considered as well as provid-
ing rich interaction functions that support the user in accessing the required information more
efficiently.
7
Page 20
2 Theoretic foundation
Figure 2.1:A nested model - from information behaviour to information search-
ing [Wilson, 1999]
2.1 Information seeking
[Wilson, 1999] described the nested model of information behaviour, information seeking and
information searching behaviour as shown in figure2.1. Information behaviour refers to those
activities a person may engage in when identifying the own needs for information, searching
for such information in any way, and using or transferring that information. Information seek-
ing is part of this behaviour and information searching is one means of information seeking.
A failure to find information may result in the process of information seeking being contin-
ued. [Krikelas, 1983] stated that: Information seeking begins when someone perceives that
the current state of knowledge is less than that needed to deal with some issue (or problem).
The process ends when that perception no longer exists.
Information Seeking Behaviour is the purposive of seeking for information as a consequence of
a need to satisfy some goal. In the course of seeking, the individual may interact with manual
information systems (such as a newspaper or a library), or with computer-based systems (such
as the World Wide Web)[Wilson, 1999].
2.1.1 Information need
The most basic factor for information seeking or trigger of information seeking is the infor-
mation problem that irritates the user to action. Taylor [Taylor, 1962], Dervin [Dervin, 1977]
and Belkin et. al [Belkin, 1980, Belkin et al., 1982] outlined different aspects of information
8
Page 21
2.1 Information seeking
needs which are very well explained by [Marchionini, 1995] as follows.
[Taylor, 1962] defined four levels of information needs: visceral, conscious, formalised and
compromised. The visceral level is recognition of some deficiency, but not cognitively defined.
At the conscious level, the information seeker characterises the deficiency, places limits on it
and is able to express the problem, albeit with ambiguity. At the formalised level, the person
is able to articulate the clear statements of the problem (e.g. in English) and the compromised
level refers to the formalised statements as presented in a form constraint by search system
limitations (e.g. in a query language). Taylor’s work laid the foundation for a deeper concep-
tual understanding of the motivations or triggers for information seeking. As a consequence
we can have various types of information needs such as ambiguous, well-defined, known-items
etc.
[Dervin, 1977] has been particularly influential in focusing attention on user needs by virtue
of her model based on people’s needs to make sense of the world. The model posits that users
go through three phases in making sense of the world, i.e. facing and solving their information
problems. The first phase establishes the context for the information need, called the situation.
Given a situation, people find that there is a gap between what they understand and what they
need to make sense of the current situation. These gaps are manifested by questions. The
answers or hypotheses for these gaps are then put to use to move to the next situation. This
situation-gap-use model applies to more general human conditions than information seeking,
but has been adopted by researchers in information science and communications as a frame-
work for studying the information-seeking process.
Belkin and his colleagues [Belkin, 1980, Belkin et al., 1982] have developed a model of infor-
mation seeking that focuses on an information seekers’ anomalous states of knowledge (ASK).
In this model, information seekers are concerned with a problem but the problem itself and
the information needed to solve the problem are not clearly understood. Information seek-
ers must go through a process of clarification to articulate a search request, with the obvious
implication that search systems should support iterative and interactive dialogues with users.
This model was designed to explain generally open-ended information problems and does not
directly apply to fact- retrieval type problems or to accretional information seeking done by
experts in a field. The ASK model serves as a theoretical basis for the design of information
systems that are highly interactive.
Taylor’s visceral and conscious levels of information need correspond to what Dervin called
a “gap“, and what Belkin and his colleagues refer to as an ”anomalous state of knowledge“.
[Marchionini, 1989] has characterised the information problem as emerging from a defect in
one’s mental model some idea, event or object.
9
Page 22
2 Theoretic foundation
2.1.2 Tasks
Generally speaking, users’ information seeking is aimed at resolving problems and accom-
plishing tasks. Although tasks have drawn little attention in the studies of information search-
ing [Vakkari, 2003], people usually agree that information seeking is task-oriented. In other
words, it is tasks that motivate this activity. Therefore, it is necessary to take tasks into consid-
eration if we want to comprehensively understand human information behaviour.
A task can be described in general terms asa piece of activity to be done in order to achieve
a goal [Vakkari, 2003]; however, in terms of search behaviour it is useful to focus on search
tasks. Search tasks are natural, emerging from work tasks of real actors. For instance, looking
for a t value in a statistical table can be an example of a search task, while the work task could
be performing statistical analysis. Simulated work tasks are modifications of artificial goals
that attempt to provide the searcher with a more robust description of the information problem
[Vakkari, 2003]. These types of task may be used in laboratory evaluations to provide search
scenarios to assess search systems or sets of interface features.
The relationship between varying task complexity and information seeking has been investi-
gated in a number of studies.
[Campbell, 1988] reviewed task complexity across several research areas and classified the
treatment of complexity as: (1) primarily a psychological experience of the task performer, (2)
an interaction between the task and the task performers’ characteristics, and (3) a function of
objective task characteristics such as number of subtasks or the uncertainty of task outcome.
[Bystrom and Jarvelin, 1995] investigated the effect of task complexity on information types,
seeking and use. Their categorisation defines five levels of task complexity based on apriori
determinability of or uncertainty about task outcome, process and information requirements.
Thea priori determinabilityis a measure of the extent to which the searcher can deduce the
required task inputs (what information is necessary for searching), processes (how to find
required information) and outcomes (how to recognise the required information). They found
a relationship between task complexity and types of information needed, information channels
used, and sources used.
[Borlund, 2000a] has prompted to use simulated work task situations in order to create more
realistic search tasks. Simulated work tasks are short search narratives that describe not only
the need for information but also the situation — the work task — that led to the need of
information. Simulated tasks are intended to provide searchers with a search context against
which searchers can make the assessments.
[Toms et al., 2003] investigated the effect of task domain on search. These included: consumer
health, general research, shopping, and travel. They found significant differences among the
search approaches used in different domains. For shopping and travel, more time is spent on
10
Page 23
2.1 Information seeking
website browsing. For the research and the health domain, more focus was on the result hit
lists. They came up with design requirements for each of these domains.
[Bell and Ruthven, 2004] conflated the five category classification of Bystrom and Jarvelin
into three categories and tested whether they can predicatively influence the complexity of
artificial search tasks. They validated the Bystrom model of task complexity and proposed this
model as a means of predicting and manipulating task complexity.
2.1.3 Relevance
Relevance is a key concept in information science and retrieval. Earlier views were focused
on the semantic level as defined by [Glover et al., 2001] Relevance refers to the binary state
of whether a document is on the same topic as the query or not.
[Cooper, 1971] proposed utility as the top concept for anything that is valuable for the user in
the search results. He identified a number of notions that affect utility including informative-
ness, preciseness, credibility and clarity.
[Schamber et al., 1990] reexamined the literature on relevance and concluded that relevance
is a dynamic and multidimensional cognitive concept. It is a complex but systematic and
measureable phenomenon.
[Saracevic, 1996] identified five types of relevance: (1) system or algorithmic, (2) topical, (3)
pertinence or cognitive, (4) situational and (5) motivational. System or algorithmic relevance
is objective and is the same irrespective of the searcher. The other four types describe rele-
vance as a subjective concept that is dependent on the searchers and their information seeking
context. Topical relevance describes the degree of searchers’ belief that there is a match be-
tween document content and their information needs. Pertinence is similar but dependent on
a searcher’s cognitive state. Situational relevance is the relationship between the current task,
situation or problem and documents. Motivational, or ’affective’ relevance, describes the re-
lation between motivations, intentions and goals of a searcher and those of a document. To
have such relevance, documents must inspire positive feelings such as satisfaction, success and
accomplishment.
[Borlund, 2003] divided relevance into two basic classes: objective or system-oriented and
subjective or human-oriented relevance. The system-driven approach treats relevance as static
and objective as opposed to the cognitive approach that considers relevance to be a subjective
individualised mental experience.
Relevance has been regarded as a multi-graded phenomenon since a long time. Multiple de-
grees of relevance and their expression have been studied in laboratory settings.
Relevance, then, is a dynamic concept that depends on users’ individual judgements of the
11
Page 24
2 Theoretic foundation
quality of the relationship between information and information need at a certain point in
time.
2.1.4 Models and empirical studies
It is important to examine information seeking models as what searchers actually do when
searching for information since this may be very different from what other people think the
searchers do. The models under this category describe the variety of models users adopt to
find and get access to information resources.
[Kuhlthau, 1991], on the basis of a number of longitudinal studies, models the information
search process of students and library users. She identified a number of different stages during
the course of information seeking. These include initiation, selection, exploration, formula-
tion, collection and presentation. She associated the feelings of doubt, anxiety and frustration
with information seeking. The occurrence of these feelings had already been studied (Ford,
1980; Mellon, 1986), but anxiety had usually been associated with a lack of knowledge of
information sources and apparatus. The information search process spans information seeking
activity across a search session rather than regarding a single point in time.
This is similar to [Ellis, 1989]’s model of information seeking behaviour which proposed the
following characteristics: starting, chaining, browsing, differentiating, monitoring, extracting,
verifying and ending. During the session the searcher’s state of knowledge is dynamic rather
than static; it is changing as the search proceeds. The steps in either process do not have to be
taken sequentially and searchers can skip or repeat steps.
Kuhlthau’s model closely resembles that of [Eisenberg and Berkowitz, 1992]. They proposed
the Big Six Skills which represent a general approach to information problem-solving, consist-
ing of six logical steps or stages. The order of the stages changes with each search venture, but
each stage is necessary in order to achieve a successful resolution of an information problem.
The Big Six Skills involve task definition, information seeking strategies, location and access,
synthesis and evaluation. The model suggested that information seeking is a linear process;
each step leads to the next one like Kuhlthau’s model.
[Marchionini, 1995] proposes another model of the information seeking process. In his model
the information seeking process is composed of eight parallel sub-processes: recognise an
information problem, define and understand the problem, choose a search system, formulate a
query, execute search, examine results, extract information and reflect/iterate/stop. This model
defines the activities at each stage and is perhaps more suitable for electronic environments
than Ellis’s model.
[Wenger, 1996] introduced the idea of the “community of practice”: the notion that a person
can satisfy her information needs more efficiently if he is embedded in a community of practi-
12
Page 25
2.2 Information searching
tioners with similar interests and problems. Indeed, before the advent of modern information
retrieval systems, most information needs were satisfied by social means: by asking friends
and acquaintances, by going to the library and asking the librarian for help, or by enquiring at
specialised agencies.
[Choo et al., 2000] developed a model of information seeking on the Web that combines both
browsing and searching. They suggest that much of Ellis’s model is already implemented
by components currently available in Web browsers. Searchers can begin from a Web site
(starting), follow links to information resources (chaining), bookmark pages (differentiating),
subscribe to services that provide electronic mail alerts (monitoring) and search for informa-
tion within sites or information sources (extracting).
[Broder, 2002] classified the web queries into three types: navigational, informational, and
transactional. According to survey results, approximately 73% of queries were informational,
nearly 26% were navigational, and an estimated 36% were transactional. Some queries belong
to multiple categories. Based on the log analysis, Broder reports that 48% of the queries were
informational, 20% navigational and 30% transactional.
2.2 Information searching
Information searching can be seen as the combination of interactive information retrieval and
classic information retrieval, in order to take into account not only the searcher’s cognitive
aspects but also to consider the underlying models for matching of the information need with
the searched collection. Therefore we are considering interactive information retrieval first
and then classic information retrieval.
2.2.1 Interactive information retrieval
Wilson’s [Wilson, 1999] description of information searching and behaviour characterises in-
teractive information retrieval asInformation Searching Behaviour is the ‘micro-level’ of be-
haviour employed by the searcher in interacting with information systems of all kinds. It
consists of all the interactions with the system, whether at the level of human computer in-
teraction (for example, use of the mouse and clicks on links) or at the intellectual level (for
example, adopting a Boolean search strategy or determining the criteria for deciding which
of two books selected from adjacent places on a library shelf is most useful), which will also
involve mental acts, such as judging the relevance of data or information retrieved.
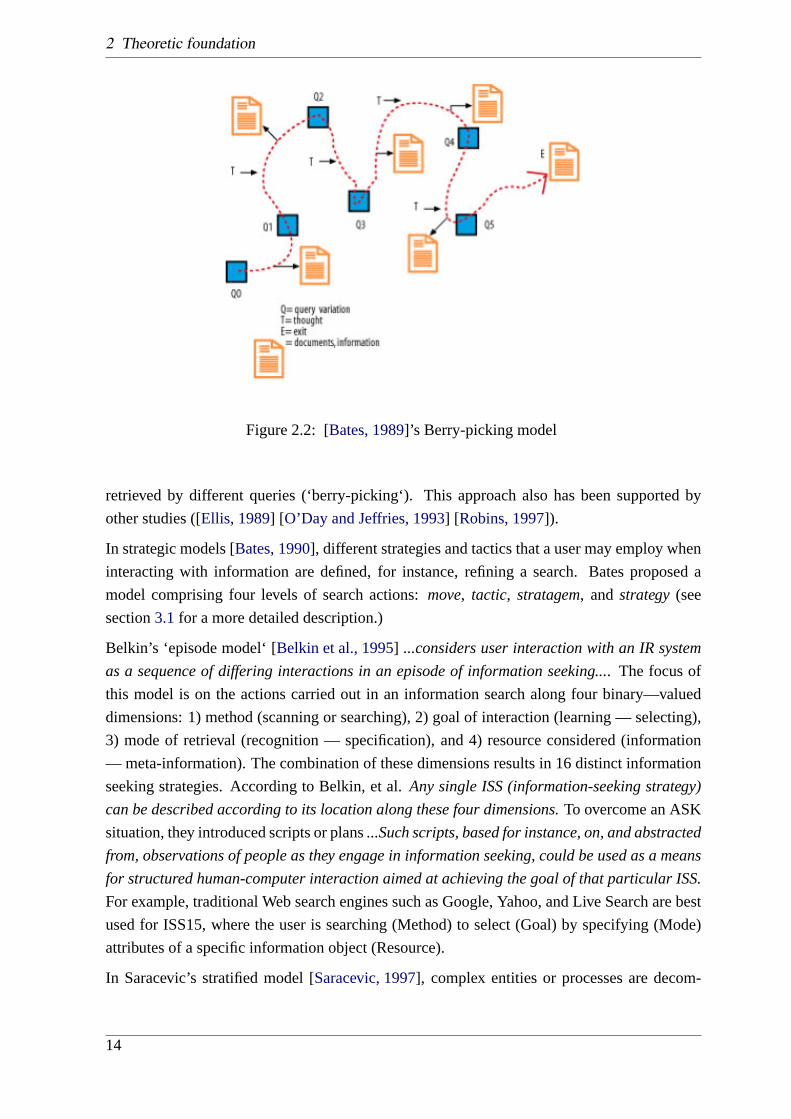
[Bates, 1989] proposes the ‘berry-picking‘ model (as shown in figure2.2.1) of information
seeking, which assumes that the user’s need changes while looking at the retrieved documents,
thus leading into new unanticipated directions. During the search, users collect relevant items
13
Page 26
2 Theoretic foundation
Figure 2.2: [Bates, 1989]’s Berry-picking model
retrieved by different queries (‘berry-picking‘). This approach also has been supported by
other studies ([Ellis, 1989] [O’Day and Jeffries, 1993] [Robins, 1997]).
In strategic models [Bates, 1990], different strategies and tactics that a user may employ when
interacting with information are defined, for instance, refining a search. Bates proposed a
model comprising four levels of search actions:move, tactic, stratagem, andstrategy(see
section3.1for a more detailed description.)
Belkin’s ‘episode model‘ [Belkin et al., 1995] ...considers user interaction with an IR system
as a sequence of differing interactions in an episode of information seeking.... The focus of
this model is on the actions carried out in an information search along four binary—valued
dimensions: 1) method (scanning or searching), 2) goal of interaction (learning — selecting),
3) mode of retrieval (recognition — specification), and 4) resource considered (information
— meta-information). The combination of these dimensions results in 16 distinct information
seeking strategies. According to Belkin, et al.Any single ISS (information-seeking strategy)
can be described according to its location along these four dimensions.To overcome an ASK
situation, they introduced scripts or plans...Such scripts, based for instance, on, and abstracted
from, observations of people as they engage in information seeking, could be used as a means
for structured human-computer interaction aimed at achieving the goal of that particular ISS.
For example, traditional Web search engines such as Google, Yahoo, and Live Search are best
used for ISS15, where the user is searching (Method) to select (Goal) by specifying (Mode)
attributes of a specific information object (Resource).
In Saracevic’s stratified model [Saracevic, 1997], complex entities or processes are decom-
14
Page 27
2.2 Information searching
posed into strata, to enable a more detailed study of each level, and their interdependence.
It views the process as involving a surface level where user and computer meet through an
interface, with several distinct levels or strata for both. For users, postulated levels are cog-
nitive, affective and situational. These levels represent users’ interpretations, motivations and
requirements respectively. For the computer, suggested levels are engineering, processing,
and content levels. These levels correspond to hardware, processing and data structures re-
spectively. Interaction is then an interplay between these different levels.
The interactive feedback and search process model by as described by Spink [Spink, 1997]
posits the cyclic nature of IR interaction. This model is derived from empirical studies. It
identifies a number of constituents of the search process when a person interacts with an IR
system. These include user judgements, search tactics or moves, interactive feedback loops,
and cycles. In words of SpinkEach search strategy may consist of one or more cycles{one or
more search commands ending in the display of retrieved items...}. Each cycle may consist of
one or more interactive feedback occurrences (user input, IR system output, user interpretation
and judgement, user input). An input may also represent a move within the search strategy...
and may be regarded as a search tactic to further the search.... Each move consists of a user
input or query requesting a system’s output.
Ingwersen’s principle of polyrepresentation [Ingwersen, 1996] offers a theoretical framework
for handling multiple contexts—associated with the information objects and with the searcher
in interactive information retrieval. The main hypothesis is based on...the more interpretations
of different cognitive and functional nature, based on an IS&R [Information Seeking & Re-
trieval] situation, that point to a set of objects in so-called cognitive overlaps, and the more in-
tensely they do so, the higher the probability that such objects are relevant (pertinent, useful) to
a perceived work task/interest to be solved, the information (need) situation at hand, the topic
required, or/and the influencing context of that situation....[Ingwersen and Jarvelin, 2005].
The interpretations take the form of different representations of context like the document
title, intellectually assigned descriptors from indexers and citations. The principle of polyrep-
resentation has been investigated by relatively few empirical studies. These studies illustrate
the holistic nature of polyrepresentation principle in different ways.
[Kelly et al., 2005] investigated polyrepresentation of the user’s cognitive space by combin-
ing different searcher statements of a single information need. [Lund et al., 2006] examined
the retrieval results from the 12 most effective TREC 5 search engines. In Lund’s study
the search engines illustrate different representations of IR system settings. [Larsen, 2004,
Skov et al., 2006] investigated polyrepresentation of information space and involved different
inter and intra-document representations. [Camps, 2007] investigated the principle by consid-
ering different types of element representations as evidences such as element content, element
context, element metadata and document metadata.
Bates’s Cascade Model [Bates, 2002] is a design model for operational online information re-
15
Page 28
2 Theoretic foundation
trieval systems. The model can be considered as an extension of the stratified model. The
model describes the layers in the design and is labelled FCascade because the layers interact
in a cascading manner. Design features of earlier layers inevitably affect the success of later
design features. Later features, if poorly designed, can block the effectiveness of the earlier
layers. Either way, without integrated good design across all layers, and constantly consider-
ing the layers in relation to each other in design and development, the resulting information
system is likely to be poor, or at least sub-optimal. For example, when an effective searching
algorithm is designed but the hardware is poor or the interface is not intuitive, the entire system
acceptance can be affected.
[Fuhr, 2008] recently proposed a theoretical framework for IIR named asProbability Ranking
Principle for IIR. The basic idea is that during IIR, a user moves between situations. In each
situation, the system presents to the user a list of choices, about which s/he has to decide, and
the first positive decision moves the user to a new situation. Each choice is associated with a
number of cost and probability parameters. Based on these parameters, an optimum ordering
of the choices can the derived — the PRP for IIR.
2.2.2 Information retrieval
Information retrieval is the science of determining and retrieving the information from a col-
lection in response to a searcher’s information need. [Lancaster, 1968] states the definition
of information retrieval asAn information retrieval system does not inform (i. e. change the
knowledge of) the user on the subject of his enquiry. It merely informs on the existence (or
non-existence) and whereabouts of documents relating to his request.
An information need typically is represented as a string of words and the IR system uses a
matching mechanism to decide how closely a document is related to the subject of the enquiry.
The matching mechanism is specified by the retrieval models.
Documents and varying atomic units
There is a number of possibilities for defining the basic retrieval unit regarded by the matching
mechanism: either complete documents, portions of documents, XML elements, or sentences
can be viewed as atomic units. For example, when documents are considered the entire content
of the documents are matched to the query.
Passage retrieval considers the matching of portions of the document such as sections and
paragraphs. The motivation behind this approach is twofold as described by the pioneer of
this approach [Salton et al., 1993]: efficiency and effectiveness. Efficiency is from the user’s
point of view since she is not faced with the mass of information; effectiveness refers to
smaller units which are easier to retrieve than the larger chunks of information. Such ap-
16
Page 29
2.2 Information searching
proaches are found useful in the case of large documents such as e. g. book-sized. Different
approaches have been investigated and passages are regarded in many different ways such
as arbitrary [Kaszkiel and Zobel, 2001], window-based [Callan, 1994, Zobel et al., 1995], se-
mantic [Hearst, 93, Ponte and Croft, 1997] and structural [Kaszkiel and Zobel, 2001].
Recent efforts are focusing on the element retrieval approach. This approach is based on the
structural and semantic markup of the collection, e.g. consisting of XML documents. The aim
of this retrieval is to retrieve such an element that has appropriate granularity and relevancy to
the query. Its power lies in its query expression in which one can not only specify the content
requirements but can also put constraints on the structure of the elements to be retrieved.
For example, one may be interested in sections or paragraphs of documents discussing ‘data
embedding‘ and having the title ‘watermarking‘. Another one can request the abstract of those
documents that are about interactive retrieval. The work in this thesis is performed with this
type of structured collection but is confined to content-centric queries, i.e. queries without
reference to specific structural properties of the documents being searched.
In the sentence-oriented approach, sentences in the collections are ranked according to the
maximum likelihood of relevance. The motivation behind this approach is to present the
searchers query-specific views and is proved to be very useful in the current state of the art
search engines.
Models
Research on retrieval models has been carried out quite independently from the work on cog-
nitive approaches described above. Classical models like Boolean and Fuzzy retrieval, the
vector space model and the probabilistic model are still dominating practical applications, and
can even be found within current research. However, most of today’s research on retrieval
models focuses on two major extensions of the probabilistic approach, namely probabilistic
inference and language models.
In [van Rijsbergen, 1986], the logical view on IR systems was introduced, where retrieval is
interpreted as uncertain inference; Rijsbergen proposed a probabilistic notion of uncertainty
for this purpose: Letq denote the current query andd a document, then the system should
aim at estimating the probabilityP(d → q). A major strength of this approach is its ability
to consider also complex inference processes (e. g. including additional knowledge like an
ontology). However, this model gives no specification on how its parameters can be derived
from real data.
As a better way for estimating the parameters of probabilistic models, language models
have been proposed a few years ago (see e. g. [Ponte and Croft, 1998, Hiemstra, 1998,
Croft and Lafferty, 2002]). These models first estimate a stochastic language model from cor-
pus data and then compute the probability that query and document are based on the same
17
Page 30
2 Theoretic foundation
language model. A language modelθ consists of probabilitiesP(w|θ) for the occurrence of
the wordsw from the vocabulary. For a given documentd, one can estimate its corresponding
language modelθd. In retrieval, one computes the probability that the queryq was generated
by the same language model. In [Fuhr, 2001b], [Fuhr, 2001a], it is shown that this approach
can be interpreted as a special case of probabilistic inference.
2.3 Query (Re)formulation
Without having the detailed knowledge of collection make-up and of the retrieval environment,
most users find it difficult to formulate queries which are well designed for the purpose of
retrieval. The observation of web search engines showed that users often make modification
to their initial queries [Spink et al., 2002]. The first query should be considered as a mere
guess [Efthimiadis, 1996].
There are a number of approaches that can help the users in such situations when their queries
are imprecise. These include non-interactive and interactive methods for query expansion. We
can contrast the two methods based on level of user involvement. Non-interactive methods
work without the intervention of users and expand the query at the algorithm level, while in
the other case, lists of terms are suggested to users and they can recognise and choose the
terms deemed more relevant to their task at hand.
2.3.1 Related terms
Term relationships can be established from a number of different resources either at the global
or local level. The global approach refers to the computation of a term-term relation con-
sidering all the documents from the entire corpus while the local approach is restricted to
the initial retrieved set of documents in response to the query [Attar and Fraenkel, 1977].
[Xu and Croft, 2000] incorporated the ideas from the global analysis into the local analysis
approach.
Conventional approaches for term-term similarity are based on statistical measures such as
e. g. co-occurrence frequencies, mutual information and chi square. There are a variety of
ways to estimate the word occurrences in a text, by considering complete documents, passages,
sentences or fixed-sized window [Terra and Clarke, 2003]. [Sanderson and Croft, 1999] ex-
tracted terms and built the concept hierarchies from search results and used term co-occurrence
to compute the term-term relationship.
New alternative approaches of term suggestion identify relevant query terms in collected logs
of user queries [Beeferman and Berger, 2000].
18
Page 31
2.3 Query (Re)formulation
2.3.2 Relevance feedback
Relevance feedback — explicit and implicit — has been shown to be an effective technique for
improving retrieval results ([Salton and Buckley, 1990] [Harman, 1992] [Buckley et al., 1994]
[White et al., 2004]).
Relevance feedback techniques require obtaining relevance information about the results re-
trieved and presented to searchers. These techniques use feedback to re-weight the query terms
for query modification.
Initially relevance feeback was thought of being user-directed where the user has to mark
the documents that are found relevant to her information need at hand. Later, this notion
is expanded to a bi-directional process where both the system and the user respond to one
another in interactive IR [Spink and Losee, 1996].
Empirical studies showed that interactive IR systems users desire explicit relevance feedback
features [Belkin et al., 2000]. However, much of the evidence indicated that relevance feed-
back features are under-utilised [Belkin et al., 2001a].
The study [Koenemann and Belkin, 1996] showed that better retrieval results can be achieved
when users have full control over the query modification process based on relevance feedback.
Implicit feedback
Implicit feedback techniques unobtrusively infer information needs from the search behaviour,
and can be used to individuate system responses and build models of system users. As a
major application area, implicit feedback techniques have been developed for recommender
and filtering systems.
There are a number of behaviours that have been described in the literature as potential rele-
vance feedback indicators. [Nichols, 1998] developed a classification scheme of observable
behaviours as shown in figure2.3.2, with a focus on its use in information filtering systems.
He presented a list of potentially observable behaviours; adding purchase, assess, repeated use,
refer, mark, glimpse, associate, and query to those mentioned above.
[Oard and Kim, 2001] extended the work, organising observable behaviours along two axes:
The behaviour axis refers to the underlying purpose of behaviour. It is further sub-divided into
four broad categories: examination, retention, reference and annotation
Examineis where a searcher studies a document, and examples of such behaviour are view
(e. g. reading time), listen and select.
Retainis where a searcher saves a document for later use and examples include bookmark,
save and print. Further examples of keeping behaviours on the Web, where information is
retained for later re-use,Referencebehaviours involve users linking all or part of a document
19
Page 32
2 Theoretic foundation
Figure 2.3:Classification of behaviours that can be used for implicit relevance feedback
to another document and examples include reply, link and cite.
Annotateare those behaviours that the searcher engages in to intentionally add personal value
to an information object, such as marking-up, rating and organising documents.
The horizontal axis: “Minimum Scope” refers to the smallest unit associated with the be-
haviour. ASegmentlevel includes operations whose minimum scope is a portion of an object
(e. g. a paragraph is a segment of a document).Objectsare self-contained items (e. g. docu-
ments). AClassis a group of objects (e. g. a collection of index documents.)
This table continually evolves as new behaviours are added, with the most recent addition
being the create behaviour added by [Kelly and Teevan, 2003]. Much of the current research
is concentrating on the examine and retain categories.
InfoScope, a system for filtering Internet discussion groups (USENET), investigated the use of
implicit and explicit feedback for modeling users [Stevens, 1993]. Three sources of implicit
evidence were used: whether a message was read or ignored, whether it was saved or deleted,
and whether or not a follow up message was posted. Stevens observed that implicit feedback
was effective for tracking long-term interests.
[Morita and Shinoda, 1994] investigated reading time as a source of implicit relevance feed-
20
Page 33
2.4 Result presentation and visualisation
back. Their results showed a strong positive correlation between reading time and ex-
plicit relevance given. When treating messages as relevant that the user read for more
than 20 seconds, this produced better recall and precision than with explicit rating by the
user. [Konstan et al., 1997] repeated this study in a more natural setting. Their results indicated
that recommendations based on reading time could be nearly as accurate as recommendations
based on explicit feedback. They also suggested some additional observable behaviours as
sources for implicit ratings namely printing, forwarding, and replying privately to a message.
[Claypool et al., 2001] categorised a series of different interest indicators and proposed a set of
observable behaviours that can be used as implicit measures of interest. The researchers found
a strong positive correlation between time and scrolling behaviours and the explicit ratings
assigned. However, since subjects were not engaged in a search task (just asked to browse a
set of interesting documents), the applicability of the findings to information seeking scenarios
is uncertain.
[Goecks and Shavlik, 2000] measured hyperlinks clicked, scrolling performed and processor
cycles used to unobtrusively predict the interests of a searcher. They integrated these measures
into an agent that employed a neural network and showed that it could predict user activity and
build a model of their interests that could be used to search the Web on their behalf.
[Joachims et al., 2007] examined the reliability of implicit feedback generated from click-
through data and query reformulations in World Wide Web (WWW) search. Results showed
that clicks are informative but biased. It is difficult to interpret clicks as absolute relevance
judgements. Relative preferences derived from clicks are reasonably accurate on average.
They found that relative preferences are accurate not only between results from an individual
query, but also across multiple sets of results within chains of query reformulations.
2.4 Result presentation and visualisation
After the background matching, a search engine returns the list of articles in decreasing likeli-
hood of relevance and results are presented to the user in form of document surrogates. This
is the dominant way of result presentation in state of the art search engines. The document
surrogates typically consist of titles, document summaries and document URLs.
Document summaries typically are extracts of documents, either independent of the
searcher’s information need [Beaulieu and Gatford, 1998] or query-based summaries. Em-
pirical studies showed that query-based sentences can facilitate assessing the relevance
of search results [Tombros and Sanderson, 1998] and that they are more effective docu-
ment representations than document snippets as presented by state of the art search en-
gines [White et al., 2003].
21
Page 34
2 Theoretic foundation
The principle of poly-representation [Ingwersen, 1992] has been the motivation for present-
ing the different contexts of the information object, as document title, summarization and its
metadata are all aimed at presenting the different contexts. [Tombros et al., 2005c] showed
that web pages have a wide range of attributes and these are likely to have an effect on the
information search process. These include colours, layouts and images. The preview of
web pages has been considered another form of the context of webpages normally not con-
veyed by the textual information. The role of thumbnails as document surrogate has been ex-
ploited by [Dziadosz and Chandrasekar, 2002] and [Woodruff et al., 2002]. The experiments
by [Dziadosz and Chandrasekar, 2002] suggests that thumbnails are likely to increase the rel-
evance assessment process but it could also increase the rate of false positive assessments. An
enhanced thumbnail is developed by [Woodruff et al., 2002] that allows the searcher to view
the relevant text magnified in the thumbnail. The visual and text representations for search re-
sults has recently been investigated by [Joho and Jose, 2008]. They concluded that it is safer
to show both kinds of representations and it might be useful for some searchers by giving them
a higher degree of control in selecting useful information. On the other hand, this strategy may
increase the cognitive load. Therefore they argued that search interfaces should be able to offer
the right form of additional document representation in an appropriate task or context.
Visual representation is a way for efficiently communicating information. [Hearst, 1999] clas-
sifies current visualisation techniques as follows: colour highlighting, brushing and linking,
panning and zooming, focus-plus-context, magic lens [Bier et al., 1994] and overview-plus-
detail.
• Brushing and linkingrefers to the connection of two or more views of the same data,
such that a change to the representation in one view affects the representation in the
other views as well e. g. when a display consists of two parts: a histogram and a list of
titles. Example of this type are [Eick and Wills, 1995] and [Tweedie et al., 1994].
• Panning and zoomingrefers to the actions of a movie camera that can scan sideways
across a scene (panning) or move in for a closeup or back away to get a wider view
(zooming). For example, text clustering can be used to show a top-level view of the main
themes in a document collection. Examples of this type are [Bederson et al., 1993] and
Google Maps.
• Focus-plus-contextmakes one portion of the view — the focus of attention — larger,
while simultaneously shrinking the surrounding objects. This type is exemplified with
[Leung and Aerley, 1994].
• Overview-plus-detail: An overview, such as a table-of-contents of a large manual,
is shown in one window. A mouse-click on the title of the chapter causes the text
of the chapter itself to appear in another window, in a linking action as The Super-
Book [Remde et al., 1987].
22
Page 35
2.5 Evaluation
In addition, there is a large number of methods for depicting tress and hierarchies
([Furnas and Zacks, 1994] [Shneiderman, 1992] [Lamping et al., 1995]). Such techniques
likely increase the cognitive load and are difficult to use.
2.5 Evaluation
One can distinguish between four types of evaluations: 1) system-oriented, 2) user-based,
3) hybrid-approach, and 4) operational. Each type aims to evaluate different aspects of IR
systems.
2.5.1 System-driven evaluation
System-oriented evaluations are based on the Cranfield model that tests the quality of IR sys-
tems by considering test collections. The main aim of such evaluations is to evaluate algo-
rithms: How good are indexing techniques? How good is the ranking algorithm? How good is
the relevance feedback. This type of evaluation doesn’t require the involvement of users and
can be performed in laboratories in the controlled settings.
Test collections are comprised of three components: 1) a set of documents varying from a
few thousand titles to terabytes of text, 2) queries created usually by collection creators and
occasionally derived from real queries, 3) relevance judgements containing the information
of relevant/irrelevant documents in response to each query. Relevance is obtained in differ-
ent ways for different collections, sometimes by recruiting the assessors and sometimes by
collaborative efforts.
Most collections are too large to be completely assessed for finding all relevant documents.
Thus, pooling is performed before obtaining the relevance judgements for each topic. The
main idea is to concentrate only on those documents that are most likely to be relevant. Mul-
tiple IR systems run the same topic to obtain lists of top ranking relevant documents. A fixed
number of top-ranking documents is taken from each run and then merged into one pool. As-
sessors then read each document and rate its relevance.
In order to evaluate the performance of a specific algorithm, two measures are used; precision
and recall. Precision reports the proportion of retrieved documents that are relevant and recall
measures the proportion of relevant document that are retrieved. High recall refers to retrieving
everything relevant but with possibly low precision and high precision means retrieving a
(possibly small) set of highly relevant documents. Systems are evaluated normally at various
levels of recall. The F-measure (equation2.1) combines precision and recall into one number.
23
Page 36
2 Theoretic foundation
One can tune the metrics according to interest in precision and recall.
F −measureα =(1+α) ·P·R
α ·P+R(2.1)
The assumption of the Cranfield approach are often criticised because 1) relevant documents
are assumed to be independent of each other, 2) all the documents are equally important, 3)
emphasises of high recall, 4) interaction is ignored.
2.5.2 User-centred evaluation
User-oriented measures evaluate systems as a whole including algorithm and interfaces. The
integral parts of such evaluations are experiment subjects, search tasks, system and collections.
Such evaluations are performed in relatively controlled environments. Control is imposed on
task, time taken to perform task, instructions, training, help and by permutating the order in
which tasks are performed.
Qualitative and quantitative analyses are performed for presenting the results. Qualitative
data is gathered by questionnaires (users’ characteristics, task-level standing before and af-
ter performing each task), think-alouds, semi-structured interviews, and by open discussions.
Qualitative data is gathered by system logs and video recordings. Results are presented using
statistical significance tests such as Mann-Whitney, t-test and Chi-square tests.
The TREC interactive track was set up to develop better methodologies for the evaluation of
IIR systems. The methodology employed by the track was critiqued due to the adaptation of
system-driven conditions for interactive experiment execution and evaluation. For instance,
interactive TREC doesn’t deal with information need but with pre-constructed information
requests, binary relevance assessments, etc. [Borlund, 2000b].
2.5.3 Hybrid evaluation
[Borlund, 2003] proposed the hybrid approach for the evaluation of interactive retrieval sys-
tems that takes into account the searcher, dynamic nature of information needs and relevance
and experimental control. She proposed the measures Ranked-Half-Life and Relative Rele-
vance to measure the effectiveness of an IR system. The measures are based on the subject
and objective types of relevance.
2.5.4 Operational evaluation
The fourth type is operational evaluation when the whole system is used in real situations
without any controlled settings. Searchers work with their own tasks, they decide when to
24
Page 37
2.5 Evaluation
stop, search without any training and it is difficult to interpret results but they are more re-
alistic. Longitudinal evaluations have some similarities with this type where an information
problem is assumed to persist over a longer period of time such as days, weeks, months or
even years. Some studies performed along these lines focused on the information seeking
behaviour [Ellis, 1989, Kuhlthau, 1991, Kelly, 2004].
25
Page 39
3 DAFFODIL
In this chapter, we introduce the search system DAFFODIL and describe its ar-
chitecture and design details.
DAFFODIL (Distributed Agents for User-Friendly Access of Digital Libraries) provides user-
oriented access across a federated digital libraries and offers a rich set of functionalities across
heterogeneous set of digital libraries. The current prototype gives access to 10 digital libraries
in the area of computer science. From iTrack 2005 onwards, a modified version of DAF-
FODIL was used as user interface for XML retrieval. Thus the basic features of DAFFODIL are
described in this chapter.
3.1 Functionality of a federated digital library system
DAFFODIL is aimed at providing high level search functions—in contrast to conventional
search engines which mostly offer only simple, basic search operations. The concept of high
level search activities for strategic is based on Bates’s ideas [Bates, 1990]. She distinguishes
four levels of search activities on the basis of empirical studies of the information seeking
behaviour of experienced library users. Typical information systems only support low-level
search functions (so-called moves), Bates introduced three additional levels of strategic search
functions:
• A Move is a simple act like typing terms into a search form or submitting a query (In
DAFFODIL at this level, wrappers connect to various DLs. The heterogeneity problem is
addressed, by DL-specific translation of the submitted query or by mapping the returned
data into a homogeneous XML metadata format).
• A Tactic is combination of moves. For example, breaking down a complex information
need into subproblems, broadening or narrowing a query are tactics applied frequently.
• A Stratagemis a complex set of actions, comprising different moves and/or tac-
tics, exercised on a single domain (DAFFODIL provides domain specific depth-search-
functionality, by applying tactics to a set of similar items, like e. g. subject search, journal
runs or citation search).
27
Page 40
3 DAFFODIL
• A Strategyis a complete plan for satisfying an information need. Typically, it consists
of more than one stratagem. Strategies are not supported by Daffodil automatically, yet.
Instead the user is enabled to work much more strategy-oriented, by applying the high
level functions of stratagems and tactics.
3.2 The WOB model
The graphical user interface design of DAFFODIL is based on the WOB model [Krause, 1995].
WOB is a German acronym for “object oriented directly manipulative graphical user interface
based on the tool metaphor”. It attempts to solve the inherent contradictions in the interface
design processlike that between flexible dialogue control and conversational promptingusing
a set of co-ordinated ergonomic techniques. It tries to fill the conceptual gap between interface
style guides (e. g. like Java Look and Feel Guidelines) and generic international standards (like
e. g. ISO 13407: Human-centred design processes for interactive systems).
The general software ergonomic principles of the WOB model are as described
in [Fuhr et al., 2002c]:
Strict Object Orientation and Interpretability of Tools Strongly related functionality of the
system is encapsulated in tools that are displayed as icons (not as menus). The tools
open views, which are ’normal’ dialogue windows. Due to well-defined dialogue guide-
lines, the chain of views a user is working on can be interpreted as a set of forms to
be filled. In contrast, experienced users will prefer the tool view, which enables them
to perform tasks more quickly; however, this view is cognitively more complex, and it
is not required for interpretation. The user can manipulate objects on the surface in a
direct manipulative manner. It is essential that consistency is guaranteed for the direc-
tion of the manipulation. Thus, the model requires an object-on-object interaction style
with a clear direction and semantics. The generally recommended interaction style is as
follows: To apply a function on an item, the latter has to be dragged to a tool.
Dynamic Adaptivity The interface adapts its layout and content always to the actual state
and context. This is mostly used for a reduction of complexity in non-trivial domains,
like browsing simultaneously in several relevant hierarchies at once. For example, the
user may set the relevant context by choosing a classification entry; when activating
the journal catalogue as the next step, the journals are filtered according to the valid
classification context, to reduce complexity.
Context Sensitive Permeability When known information is reusable in other contexts, it
will automatically be reused.
28
Page 41
3.2 The WOB model
Fig
ure
3.1:
DA
FF
OD
ILin
the
use
29
Page 42
3 DAFFODIL
Dialogue Guidelines The views of the tools are functionally connected, e. g. by means of
action buttons, hypertext links or rules which are triggered by plan recognition. A tool
can also open its view proactively if the user may need its function in a given situation.
Intelligent Components Tools and controls in the interface have access to context and state,
in order to decide, if their function is valuable for the user. If applicable, they shall
interact pro-actively with the user or the shared environment (the desktop).
3.3 Agent-based Architecture
In order to implement high-level search activities, an agent-based architecture (ABA) was cho-
sen (see e.g. [Wooldridge and Jennings, 1995]). The following features of agents are relevant
for IR applications [Fuhr et al., 2000]:
Autonomy An agent is a process of its own, and thus it can operate independently of other
agents.
Intelligence An agent is able to process knowledge and to draw inferences; in our case of an
IR application, an agent should be capable of uncertain reasoning.
Reactiveness An agent reacts when prompted by another agent.
Proactiveness An agent is able to take the initiative itself, e. g. when it detects changes in its
environment that require action.
Adaptiveness An agent can adapt its behaviour to the application it is being used for.
Communication An agent is able to communicate with other agents peer-to-peer.
For our DL application, communication and the control flow (including autonomy, reactive-
ness and proactiveness) are the most relevant features.
For the communication with digital libraries, so-calledwrappersare responsible. Thewrap-
persprovide access to a variety of heterogeneous data sources. Among them are locally avail-
able databases, and removeable web services and Internet sites that work with enquiry forms.
For the iTrack version of DAFFODIL three wrappers for collections IEEE-CS, Wikipedia and
Lonely Planet were set up. The wrappers have a common query language so that the client
can uniformly distribute the queries to the wrappers. The agents communicate among each
another over CORBA1 as shown in figure3.2.
The Middleware agents (so-calledServices) offer functions and data, that are necessary for the
realisation of stratagems and tactics. For example, there is a service for merging the metadata
1Common Object Request Broker Architecture
30
Page 43
3.4 Daffodil’s tools
of a document from different wrappers and there also exist specialised authors, journal and
conferences services. For iTrack DAFFODIL there are services for fetching document/element
details, contexts of related terms etc.
Figure 3.2:DAFFODIL Architecture
The event-based message architecture connecting the user interface tools also uses, via the
Message Transfer Agent (MTA), the cross-system message structure. Internal events, which
relate to ASK or TELL events, are transformed into messages and sent via HTTP to the corre-
sponding service. Then the answer is delivered to the original sender in the GUI.
3.4 Daffodil’s tools
The goal of DAFFODIL’s desktop is to provide an environment that allows for retrieval, search
and browse tasks, as well as collation, organisation and reuse of the retrieved information in a
user-friendly way.
When the user first sees the desktop, the most frequently used tools are open. The default
setting opens the search tool, but this setting is user specific and can be made a personal
choice or part of the user’s profile. A typical desktop state can be seen in figure3.1.
The tools built so far include:
- Search tool, to specify the search domain, set filters and compose queries. The queries
are broadcasted to a set of distributed information services (via agents and wrappers).
Integrated result lists are displayed for navigation and detail inspection.
31
Page 44
3 DAFFODIL
- Reference Browser, which can be invoked by dropping document items on it. Citation
indexes (like e. g. Citeseer2) are consulted to find references to and from the given item.
- Classification Browser, to allow hierarchical topic-driven access to the information
space. It enables browsing of classification schemes like e. g. the ACM Computing
Classification System.
- Thesaurus Browser, to transform search terms to broader or narrower terms. Subject-
specific or Web-based thesauri, like e. g. WordNet, are used for finding related terms.
Items can be used (via Drag&Drop) in another tool.
- Author Network Browser, to compute and browse co-author networks for a list of given
authors. The list can be either typed in or given by dropping a document on the tool.
- Journal Browser, to search for a journal title and browse many journal directories, often
with direct access to the meta-data or the full-text of articles.
- Conference Browser, to search for a conference title and browse conference proceedings.
The full-texts are directly accessible from within the tool, provided they are available in
any of the DLs connected.
- Personal Librarywhich stores DL objects in personal or group folders, along with the
possibility of enabling awareness for these items.
2http://citeseer.ist.psu.edu/ (Last date accessed on January 6, 2009)
32
Page 45
4 INEX and interactive track
In this chapter, we describe XML retrieval, INEX, and its interactive track. The
interactive track description includes the experimental settings of the years 2004-
2007. This chapter also includes details of the control system introduced in the
interactive track 2006-07.
The eXtensible Markup Language (XML)1 is a general-purpose specification for creating cus-
tom markup languages. It is classified as an extensible language because it allows its users to
define their own elements. XML can be used in two different ways. First, XML is employed
as a markup language where documents are considered to be trees which represent the docu-
ment structure. Secondly, XML is used as an interchange format for structured data. Here a
document is considered as a data structure consisting of fields, each of which has a specific
data type.
The widespread use of XML in scientific data repositories, digital libraries and on the web
brought about an explosion in the development of XML retrieval systems. These systems ex-
ploit the logical structure of documents (which is explicitly represented by the XML markup)
to retrieve document components, the so-called XML elements, instead of whole documents,
in response to a user query. This means that an XML retrieval system needs not only to find
relevant information in the XML documents, but also determine the appropriate level of granu-
larity to be returned to the user, and this with respect to both content and structural conditions.
Current work in XML IR focuses on exploiting the available structural information in docu-
ments to implement a more focused retrieval strategy and return document components (the
so-called XML elements) — instead of complete documents — in response to a user’s query.
This focused retrieval approach is of particular benefit for collections containing long docu-
ments or documents covering a wide variety of topics (e.g. books, user manuals, legal doc-
uments, etc.), where the users’ effort to locate relevant content can be reduced by directing
them to the most relevant parts of the documents. For example, in response to a user query on
a collection of scientific articles marked-up in XML, an XML IR system may return a mixture
of paragraph, section, article elements, that have been estimated to appropriately answer the
user’s query. This focused retrieval paradigm suggests that an XML retrieval system should
also determine the appropriate level of granularity to be returned to the user, in addition to
1http://en.wikipedia.org/wiki/XML (Last date accessed on January 6, 2009)
33
Page 46
4 INEX and interactive track
finding relevant information in the XML documents. Moreover, the relevance of a retrieved
component depends on meeting both content and structural conditions.
Consider the following information needs as examples
Find document components which are discussing data embedding and having
the title watermarking.
Find the abstract of those documents that are about interactive retrieval.
The work in this thesis is performed with this type of structured collection and is confined to
content-centric queries, i. e. queries without reference to specific structural properties of the
documents being searched.
4.1 INEX
Evaluating the effectiveness of XML retrieval systems requires a test collection where the rel-
evance assessments are provided according to a relevance criterion, which takes into account
the imposed structural aspects. In 2002, the Initiative for the Evaluation of XML Retrieval
(INEX) started to address these issues. The aim of the INEX initiative is to establish an infras-
tructure and provide means, in the form of a large XML test collection and appropriate scoring
methods, for the evaluation of content-oriented XML retrieval systems.
Evaluating retrieval effectiveness is typically done by using test collections assembled specif-
ically for evaluating particular retrieval tasks. A test collection usually consists of a set of
documents, a set of user requests (the so-called topics, or queries) and relevance assessments
of the documents with respect to the queries. The characteristics of traditional test collections
have been adjusted in order to appropriately evaluate content-oriented XML retrieval effec-
tiveness: the document collection comprises documents marked up in XML, the topics specify
requests relating both to the content of the desired XML elements and to their structural prop-
erties, and the relevance assessments are made on the XML element level rather than just on
the full document level. In addition, relevance is measured in a different way compared to
traditional information retrieval research, in order to quantify the systems’ ability to return the
right granularity of XML elements. Test collections as such have been built as a result of seven
rounds of the Initiative for the Evaluation of XML Retrieval (INEX 2002-8).
34
Page 47
4.1 INEX
4.1.1 Document Collections
IEEE-CS
Up to 2004, the INEX collection consisted of 12,107 articles, marked-up in XML, from 12
magazines and 6 transactions of the IEEE Computer Society’s publications, covering the pe-
riod of 1995-2002, and totalling 494 MB in size, and 8 million in number of elements. On
average, an article contains 1,532 XML nodes, where the average depth of a node is 6.9. In
2005, the collection was extended with further publications from the IEEE Computer Society.
New articles 4,712 from the period of 2002-2004 were added, giving a total of 16,819 articles
with 764 MB in size and 11 million in number of elements.
Figure4.3 shows an excerpt of the structure of one of the documents of the collection. The
overall structure of a typical article is as follows: it consists of a front matter (<fm>), a body
(<bdy>), and a back matter (<bm>). The front matter contains the article’s metadata, such as
title, author, publication information, and abstract. Following is the article’s body which con-
tains the content, structured in sections (<sec>), sub sections (<ss1>), and sub sub section
(<ss2>). These logical units start with a title, followed by a number of paragraphs. In addi-
tion, the content has markup for references (citations, tables, figures), item lists, layout (such
as emphasised and bold face), etc. The back matter contains the bibliography and information
about the article’s authors.
Figure 4.1:Sketch of the structure of the IEEE document [Fuhr et al., 2002b]
35
Page 48
4 INEX and interactive track
Wikipedia
From 2006 onward, INEX used a different document collection, made from a snapshot of the
English version of Wikipedia2 [Denoyer and Gallinari, 2006]. The collection consists of the
full-texts, marked-up in XML, of 659,388 articles of the Wikipedia project, and totalling more
than 60 GB (4.6 GB without images) with 30 million elements. On average, an article contains
161.35 XML nodes, where the average depth of an element is 6.72. As a major difference to
the IEEE-CS collection, Wikipedia doesn’t have a DTD and the number of different tag names
is much larger.
Lonely Planet
The Lonely Planet collection consists of 462 XML documents with information about desti-
nations, which is particularly useful for travellers who want to find interesting details for their
next holiday or business trip. The collection is called the ”WorldGuide” and has been provided
by the publishers of the Lonely Planet guidebooks. The collection not only contains useful in-
formation about countries, but also includes information about interesting regions and major
cities. For each destination an introduction is available, complemented with information about
transport, culture, major events, facts, and an image gallery that gives an impression of the
local scenery.
4.1.2 Tasks and retrieval strategies
The main retrieval task to be performed in INEX is the ad-hoc retrieval of XML documents.
In information retrieval literature, ad-hoc retrieval is described as a simulation of how a library
might be used, and it involves the searching of a static set of documents using a new set of
topics. While the principle is the same, the difference for INEX is that the library consists
of XML documents, the queries may contain both content and structural conditions and, in
response to a query, arbitrary XML elements may be retrieved from the library.
Three different retrieval strategies were defined and used since INEX 2005, based on different
user viewpoints regarding the structure of the output of an XML retrieval system:
• Focused, where it is assumed that a user prefers a single element that most exhaustively
discusses the topic of the query (most exhaustive element), while at the same time it is
most specific to that topic (most specific element).
• Thorough, where a user wants to see all highly exhaustive and specific elements
2http://www.wikipedia.com (Last date accessed on January 6, 2009)
36
Page 49
4.1 INEX
• Fetch and Browse- Supposing that a user is interested in highly exhaustive and specific
elements that are contained within highly relevant articles. This task has been further
divided in two parts:
– All In Context - assume that the user is interested in all relevant elements that are
contained within relevant articles.
– Best In Context- assume that the user is interested in the best entry points, one per
article, of highly relevant articles.
4.1.3 Topics
Within the main ad-hoc retrieval task in INEX, different subtasks were identified depending on
how structural constraints are expressed in queries. Since the precise definition of the subtasks
slightly varied from year to year, we give the specification used in INEX 2005 as an example
([Lalmas and Tombros, 2007]):
• In the Content-Only (CO) sub-task, queries ignore the document structure and contain
only content-related conditions.
• An extension of the CO sub-task that includes structural hints is the +S sub-task, where
a user may decide to add structural hints to his query to narrow down the number of
returned elements resulting from a CO query.
• In the Content and Structure (CAS) sub-task, structural constraints are explicitly stated
in the query and they can refer both to where to look for the relevant elements (i. e. sup-
port elements), and what type of elements to return (i. e. target elements). A structural
constraint can also be interpreted either as strict (i. e. the structural requirements must be
fulfilled strictly) or as vague (i. e. the structural constraints are interpreted as hints and
the main goal is to satisfy the overall information need). Strict and vague interpretations
can be applied to both support and target elements, giving a total of four strategies for
the CAS subtask.
In 2004, the Narrowed Extended XPath3 I (NEXI) was introduced as query language for spec-
ifying CO and CAS requests [Trotman and Sigurbjornosson, 2004].
The NEXI versions of the example information needs given on page34are as follows:
//sec[about(., data embedding) and about(title, water marking)]
//abstract[about(., interactive information retrieval)]3An XPath expression describes the location of an element or attribute in XML document. For detailhttp:
//www.w3.org/TR/xpath20/ (Last date accessed on January 6, 2009)
37
Page 50
4 INEX and interactive track
4.1.4 Relevance
In INEX, relevance has been considered as multi-dimensional and multi-graded.
In 2002, relevance was defined along two dimensions; topical relevance and document cov-
erage each having four scale values. Topical relevance refers to the extent to which the in-
formation contained in a document component is relevant to a topic of request. In contrast,
document coverage describes how much of the component of information is relevant to the
topic of request. A study [Kazai et al., 2004] showed that the use of the value ”too small” for
topical relevance led to some misinterpretations while assessing the coverage of an element.
Therefore, relevance dimensions were renamed in 2003 [Lalmas and Tombros, 2007].
In 2003 and 2004, two relevance dimensions — Exhaustivity and Specificity — were used to
measure the extent that an element covers and is focused on an information need respectively.
Each dimension has four grades to reflect how exhaustive or specific an element is: none,
marginally, fairly, and highly.
Studies [Pharo and Nordlie, 2005, Tombros et al., 2005b] showed that a 10-point relevance
scale, as a result of the combination of two dimensions and each grade, is very hard for users
to understand and could lead to an increased level of obtrusiveness in interactive user environ-
ments [Larsen et al., 2005].
As a result, there was a change in the procedure of assessing relevance. A highlighting as-
sessment approach was used to gather the relevance assessments. Here, three exhaustivity
values were assigned to a relevant element, while specificity of the relevant element was mea-
sured on a continuous (0, 1] relevance scale (based on the amount of highlighted text in the
element) [Lalmas and Tombros, 2007].
4.1.5 Tasks/Tracks
In addition to the main general ad-hoc retrieval task other specific tracks were defined:
1. Relevance feedback task- the aim of this track is to evaluate the effectiveness of rele-
vance feedback in the context of XML retrieval.
2. Natural query language processing task- its purpose is to promote the interaction among
the fields of Natural Language Processing and XML IR.
3. Heterogeneous collection track- it is intended to expand both the number and the syn-
tactic and semantic diversity of the collections to be used.
4. Document mining track- it deals with exploring algorithmic, theoretical and practical
issues regarding the classification, clustering and structure mapping of structured data.
38
Page 51
4.2 Interactive track
5. Multimedia track- it focuses on using the structure of the document to extract, relate,
and combine the relevances of different multimedia fragments.
6. Interactive track- investigates the behaviour of users when interacting with elements of
XML documents, and also develops approaches for element retrieval which are effective
in user-based environments.
4.2 Interactive track
The high-level goal of this track is twofold: firstly to study the behaviour of users when in-
teracting with components of XML documents, and secondly to investigate and develop ap-
proaches for XML retrieval which are effective in user-based environments. The settings of
three rounds of the interactive track (iTrack) are described below. The search systems used in
these rounds of iTrack will be described in later chapters.
4.2.1 iTrack 2004
Document Corpus. The document corpus used was the 500 MB corpus of 12,107
articles from the IEEE Computer Society’s journals covering articles from 1995-2002
[Govert and Kazai, 2003].
Topics. We used content only (CO) topics that refer to document contents. In order to make the
tasks comprehensible by other people besides the topic author, it was required to add why and
in what context the information need had arisen. Thus the INEX topics are in effect simulated
work task situations as developed by Borlund [Borlund, 2000a]. Four of the INEX 2004 CO
topics, given in appendixA.1, were used in the study. One of the simulated work tasks is given
in figure 4.2
Task ID: B2
You have tried to buy & download electronic books (ebooks) just to discover that problems arise when
you use the ebooks on different PC’s, or when you want to copy the ebooks to Personal Digital As-
sistants. The worst disturbance factor is that the content is not accessible after a few tries, because an
invisible counter reaches a maximum number of attempts. As ebooks exist in various formats and with
different copy protection schemes, you would like to find articles, or parts of articles, which discuss
various proprietary and covert methods of protection. You would also be interested in articles, or parts
of articles, with a special focus on various disturbance factors surrounding ebook copyrights.
Figure 4.2:A simulated work task example
Participating sites. The minimum requirement for sites to participate in iTrack 04 was to
provide runs using at least 8 searchers on the baseline version of the web-based XML retrieval
system provided. 10 sites participated in this experiment, with 88 users altogether.
39
Page 52
4 INEX and interactive track
Table 4.1:Basic experimental matrix
Searcher 1st Task category 2nd Task category
1 Background Comparison
2 Comparison Background
Experimental protocol & data collection. Each searcher worked on one task from each task
category. The task was chosen by the searcher and the order of task categories was permuted.
This means that one complete round of the experiment requires only 2 searchers. The mini-
mum experimental matrix consisted of the 2x2 block as given in table4.1.
This block was repeated 4 times for the minimum requirements for participation. This matrix
could be augmented by adding blocks of 4 users (a total of 12, 16, 20, etc. users).
The goal for each searcher was to locate sufficient information towards completing a task, in a
maximum timeframe of 30 minutes per task.
Searchers had to fill in questionnaires (see appendixA.1) at various points in the study: before
the start of the experiment, before each task, after each task, and at the end of the experiment.
An informal interview and debriefing of the subjects concluded the experiment. The collected
data comprised questionnaires completed by searchers, the logs of searcher interaction with
the system, the notes experimenters kept during the sessions and the informal feedback pro-
vided by searchers at the end of the sessions.
Relevance.The assessment was based on two dimensions of relevance: how useful and how
specific the component was in relation to the search task. The definition of usefulness was
formulated very much like the one for Exhaustivity in the Ad hoc track, but was labelled use-
fulness, which might be easier for users to comprehend. Each dimension had three grades of
relevance: very useful, fairly useful and marginally useful. This led to ten possible combina-
tions of these dimensions as listed in table4.2.
Comparison between baseline and graphical.For the comparison of the baseline and the
graphical user interfaces, the experimental matrix from table4.1 was extended to the one
shown in table4.3(here the suffices -B and -C refer to the task type).
4.2.2 iTrack 2005
Based on the recommendations of the INEX Methodology Work-
shop [Trotman and Lalmas, 2005] at the Glasgow IR Festival, the aims addressed in
2005 were as follows:
1. To elicit user perceptions of what is needed from an XML retrieval system. The aim is
to see whether element retrieval is what users really need: Does element retrieval make
40
Page 53
4.2 Interactive track
Table 4.2:The INEX 2004 relevance scale
A Very useful & Very specific
B Very useful & Fairly specific
C Very useful & Marginally specific
D Fairly useful & Very specific
E Fairly useful & Fairly specific
F Fairly useful & Marginally specific
G Marginally useful & Marginally specific
H Marginally useful & Marginally specific
I Marginally useful & Marginally specific
J Contains no relevant information
U Unspecified
Table 4.3:Basic experimental matrix
Searcher 1st Condition 2nd Condition
1 Graphical-Background Baseline-Comparison
2 Graphical-Comparison Baseline-Background
3 Baseline-Background Graphical-Comparison
4 Baseline-Comparison Graphical-Background
sense at all for users, do they prefer longer components, shorter components or whole
documents, would they rather have passages than elements, etc.
2. To identify an application for element retrieval. This year, a mixture of topics was used;
these were simulated work tasks [Borlund, 2000a] (based on topics from the ad hoc
track) and information needs formulated by the test persons themselves. The aim of
including the latter was to enable studies characterising the tasks users formulate, and to
see what kinds of applications users might need an element retrieval system for. A total
of 121 such topics derived from the test persons were collected for further analysis.
3. To introduce an alternative document collection with the Lonely Planet collection as
an optional task in order to broaden the scope of INEX and to allow test persons with
different backgrounds (e. g. educational) to participate.
41
Page 54
4 INEX and interactive track
Task A - Common Baseline System with IEEE Collection
In this task each test person searched three topics in the IEEE collection: Two simulated work
tasks provided by the organisers, and one formulated by the test person herself in relation to
an information need of her own. The baseline system used by all participants was a Java-
based element retrieval system built within the DAFFODIL framework (see chapter3), and was
provided by the track organisers. It had a number of improvements over the previous year’s
baseline system, including handling of overlaps, better element summaries in the hit list, a
simpler relevance scale, and various supportive interface functionalities. Task A was compul-
sory for all participating groups with a minimum of 6 test persons.
Document Corpus.The document corpus used in Task A was the 764 MB corpus of articles
from the IEEE Computer Society’s journals covering articles from 1995-2004.
Tasks. In order to study the first two questions outlined above, both real and simulated infor-
mation needs were used in Task A.
The test persons were asked to supply examples of their own information needs. As it may
be hard for the test persons to formulate topics that are covered by the collection, the test
persons emailed two topics they would like to search for 48 hours before the experiment. The
experimenters then did a preliminary search of the collection to determine which topic had the
best coverage in the collection. The topics supplied by the test persons were not all well-suited
to an element retrieval system, but they all had a valuable function as triggers for the structured
interview where it was attempted to elicit user perceptions of what they need from an element
retrieval system, and to identify possible applications for element retrieval. They may also be
valuable for the formulation of topics for the following years’ tracks. Therefore, both topics
were recorded and submitted as part of the results.
The simulated work tasks were derived from the CO+S and CAS INEX 2005 adhoc topics, ig-
noring any structural constraints. In order to make the topics comprehensible by other than the
topic author, it was required that the ad hoc topics not only detail what is being sought for, but
also why this is wanted, and in what context the information need has arisen. This information
was exploited for creating simulated work task situations for Task A; on the one hand, this
will allow the test persons to engage in realistic searching behaviour, and on the other hand, it
provides a certain level of experimental control by being common across test persons. For task
A, six topics, given in appendixB.1, were selected and modified into simulated work tasks.
In iTrack 2004, we attempted to identify tasks of different types and to study the difference
between them, but without great success. In 2005 a simple bisection was made:
• General tasks (G category), and
• Challenging tasks (C category), which are more complex and may be less easy to com-
plete.
42
Page 55
4.2 Interactive track
Table 4.4:The INEX 2005 experimental matrix, OT is Own task, and STG, STC are the two 2
simulated work task categories
Rotation 1 OT, STG, STC
Rotation 2 STC, OT, STG
Rotation 3 STG, STC, OT
Rotation 4 STG, OT, STC
Rotation 5 STC, STG, OT
Rotation 6 OT, STC, STG
In addition to their own information need, each test person chose one task from each category.
This allows the topic to be more “relevant“ and interesting to the test person. A maximum time
limit of 20 minutes applied for each task. Sessions could finish before this if the test person
felt they had completed the task.
Participating Groups. A total of 12 research groups signed up for participation in the Inter-
active Track and 11 completed the minimum number of required test persons. All 11 groups
participated in Task A with a total of 76 test persons searching on 228 tasks.
Experimental Protocol. A minimum of 6 test persons from each participating site were used.
Each test person searched on one simulated work task from each category (chosen by the test
person) as well as one of their own topics. The order in which task categories were performed
by searchers was permuted to neutralise learning effects. This means that one complete round
of the experiment required 6 searchers. The basic experimental matrix looked as shown in
table4.4.
Relevance Scale.The intention was that each viewed element should be assessed by the test
person (with regard to its relevance to the topic). This was, however, not enforced by the sys-
tem as we believe that it may be regarded as intrusive by the test persons [Larsen et al., 2005].
In addition, concerns had been raised that the iTrack 2004’s two dimensional scale
was far too complex for the test persons to be comprehended [Pharo and Nordlie, 2005,
Tombros et al., 2005b] . Therefore it was chosen to simplify the relevance scale, also in order
to ease the cognitive load on the test persons. The scale used was a simple 3-point scale mea-
suring the usefulness (or pertinence) of the element in relation to the test person’s perception
of the task.
Task B - Participation with own Element Retrieval System
This task allowed groups with working element retrieval system to test their system against
the baseline system. Groups participating in Task B were free to choose between the IEEE
43
Page 56
4 INEX and interactive track
Table 4.5:The INEX 2005 relevance scale
2 Relevant
1 Partially Relevant
0 Not Relevant
collection or the Lonely Planet collection, and had a large degree of freedom in setting up the
experiment to fit the issues they wanted to investigate in relation to their own system. If the
IEEE collection was used, DAFFODIL was offered as baseline system. For the Lonely Planet
collection, a baseline system was kindly provided by the Contentlab at Utrecht University4.
The recommended experimental setup was very close to that of Task A, with the main differ-
ence that simulated work tasks should be assigned to test persons rather than freely chosen.
This setting was chosen in order to allow for direct comparisons between the baseline system
and the local system. Task B was optional for those groups who had access to their own el-
ement retrieval system, and was separate from task A. Thus additional test persons needed to
be engaged for task B. Only one group, University of Amsterdam, participated in Task B with
14 test persons searching on 42 tasks [Kamps et al., 2006].
Task C - Searching the Lonely Planet Collection
This task allowed interested groups to carry out experiments with the Lonely Planet collec-
tion. Each test person searched four topics which were simulated work tasks provided by the
organisers. The system (B3-SDR) provided by Utrecht University was used in this task. The
system is a fully functional element retrieval system that supports several query modes. Task C
was optional for those groups who wished to do experiments with the new collection, and was
separate from task A and B. Thus additional test persons needed to be engaged for task C. Four
groups participated in Task C with 29 test persons searching 114 tasks [Larsen et al., 2006] .
4.2.3 iTrack 2006-2007
A major change in this round was the move from the IEEE-CS corpus to Wikipedia. As the
latter is different in a number of ways, we chose to repeat some of the conditions studied
in previous years in order to investigate if the results achieved there were also applicable
to the new collection. In addition, we put more emphasis on the search tasks and also on
investigating the differences and similarities between element retrieval and passage retrieval
(as recommended at the SIGIR 2006 Workshop on XML Element Retrieval Methodol-
4Seehttp://contentlab.cs.uu.nl/ (Last date accessed on January 6, 2009)
44
Page 57
4.2 Interactive track
ogy [Trotman and Geva, 2006]). Finally, we attempted to ease the burden of experimenters
and searchers by an online experimental control system that handles administration and
collection of electronic questionnaires, selection of tasks and logins to the search system, etc
Document Corpus.The document corpus used in Task A was the 4.6 GB corpus of encyclo-
pedia articles extracted from Wikipedia [Denoyer and Gallinari, 2006]. The corpus consists of
more than 650,000 articles formatted in XML.
Tasks.A multi-faceted set of twelve tasks with three task types (decision making, fact finding
and information gathering) was further split into two structural types (hierarchical and paral-
lel) [Toms et al., 2003]. The tasks were loosely based on the INEX 2006 adhoc track topics.
See AppendixC.1for the tasks and more information about them.
The twelve tasks were split into four categories allowing the searchers to choose between
two tasks, and at the same time ensuring that each searcher would perform at least one of
each type and structure. This allowed the topic to be more “relevant” and interesting to the
searcher. Because of the encyclopedic nature of Wikipedia (with most topics concentrated in
a few documents), we chose to allow fairly short time to solve each task and instead had each
searcher tackle more tasks. A maximum time limit of 15 minutes was applied. Sessions could
be finished before this if searchers felt they had completed the task.
Experimental setup. A minimum of 8 searchers from each participating group had to be
recruited. Each searcher searched on one simulated work task from each category (chosen
by the searcher). The order in which task categories were performed by searchers over the
two system versions were permuted in order to neutralise learning effects. This means that
one complete round of the experiment required 8 searchers. The basic experimental matrix is
given in table4.6:
Table 4.6:Rotation matrix with Element (S1) vs. Passage (S2) retrieval systems and task
groups
Rotation 1 S1-C1 S1-C2 S2-C3 S2-C4
Rotation 2 S1-C2 S1-C1 S2-C4 S2-C3
Rotation 3 S1-C3 S1-C4 S2-C1 S2-C2
Rotation 4 S1-C4 S1-C3 S2-C2 S2-C1
Rotation 5 S2-C8 S2-C7 S1-C6 S1-C5
Rotation 6 S2-C7 S2-C8 S1-C5 S2-C6
Rotation 7 S2-C6 S2-C5 S1-C8 S2-C7
Rotation 8 S2-C5 S2-C6 S1-C7 S2-C8
45
Page 58
4 INEX and interactive track
The tasks are distributed in eight categories (see AppendixC.1 for the tasks themselves).
These rotations are related to the searcher logins and the control system handles their
administration.
Control system. In the interactive experiments infrastructure, a number of questionnaires had
to be filled in by the searchers at various points in time for collecting the qualitative infor-
mation. These questionnaires included before and after experiment questions to collect their
biographic information and the overall search experience with the systems in use, respectively.
Before and after task questionnaires collected their familiarity and interest level with the task
at hand as well as their impression of the system support for performing the task. The task
questionnaires had to be repeated depending on the number of tasks at hand.
Another aspect of experimental setting was to permutate the task order among the searchers in
order to neutralise learning effects.
Generally, taking into account the searcher’s time limitations, a searcher was given certain
amount of time to work on one task. This implies that the experimenter had to keep an eye on
the clock so that task can be completed in the assigned time.
To conduct one experiment, experimenters had to login for each searcher a number of times
depending on the number of tasks and the experimenter had to control the order of tasks and
questionnaires in which they should be presented to searchers. After the completion of experi-
ments, all this information had to be filled in spreadsheets by the experimenter so that it could
be further processed for distribution and analysis.
In the first two rounds of the interactive track the experiments were conducted along the lines
sketched above. As a result, there was a high burden on the searcher to understand what
was going on and to bear the interventions of the experimenter. It was very difficult for an
experimenter to conduct more than one experiment at one time. Furthermore a lot of effort had
to be spent in order to administer, conduct and digitise the collected information.
Therefore, with regards to the above problems, a control system was designed. All of these
problems were addressed in the system design. The control system was designed in such a
way that if someone intends to compare their system with the baseline this is also possible.
Controlling the experimental setup
The twelve tasks are split into four categories giving the searchers a choice between two tasks,
and at the same time ensuring that each searcher would perform at least one of each type and
structure as shown in table4.8. The task details performed by the searcher can be seen in
appendixC.1. The study requires the comparison of two systems performing element retrieval
(S1) and passage retrieval system (S2).
One experiment requires at least 8 searchers to participate. Each searcher is assigned one of
46
Page 59
4.2 Interactive track
Table 4.7:Rotation details as kept in the database
rotationID description system1 system2
1 st1,st2,st3,st4,done,s1 s2
2 st2,st1,st4,st3,done,s1 s2
the 8 rotations. The rotation determines the order in which the task categories and the two
systems should be presented to a searcher, as shown in table4.6.
Rotation 1 implies that the searcher should be presented tasks of category C1 and element
retrieval system (S1) should be used to work on this task, afterwards task of category C2
should be performed using the same system S1 and the other two tasks should be performed
with the passage retrieval system (S2).
Experimental procedure
The experimenter logs the searcher into the control system. The control system gives links to
tutorials of both systems. The system administers theBefore Experiment QuestionnaireC.1.
The usermodelkeeps the information of its rotation,control keeps the iteration of the current
task category (such as first, second, third or fourth) to be performed and retrieves correspond-
ing tasks and forwards to theBefore Task QuestionnaireC.2. After choosing the task,control
forwards the searcher to the System Linkview to gain access to system. When a searcher
comes back after performing the task,control forwards to theAfter Task QuestionnaireC.3.
This step is repeated for all four task categories. The task order is looked up in the rotation
table shown in table4.7. At the end,control forwards the searcher toAfter experiment ques-
tionnaireC.4.
In order to login the searcher automatically to the DAFFODIL system, we had to dynamically
create a java webstart5 JNLP descriptor file containing information how and with which pa-
rameters system should be started. The parameters passed are searcherid, password, task id of
the task selected by searcher and the system on which search should be performed depending
on the rotation. For this purpose, we created a servlet that first generated this file and then the
browser launches the webstart and starts the DAFFODIL system.
When searchers login to the system, a separate thread is started to keep record of the time.
After the 15 minutes the searcher is informed by the message “You have now spent 15 minutes
on this task. Please click ’Finish task’ to proceed in the experiment”
The technology used for implementing this system included servlets, JSP, Java beans, MySQL
and Jakarta tomcat.
5http://java.sun.com/developer/technicalArticles/Programming/jnlp/ (Last date accessed on
January 6, 2009)
47
Page 60
4 INEX and interactive track
Table 4.8:Distribution of tasks into categoriesCategory Tasks
C1 1,2,3
C2 5,6,7
C3 9,10,11
C4 4,8,12
Category Tasks
C5 2,3,4
C6 6,7,8
C7 10,11,12
C8 1,5,9
Relevance scale.An important aspect of the study was to collect the searcher’s relevance
assessments for items presented by the system. We chose to use a relevance scale based on
[Pehcevski et al., 2005]. This scale balances the need for information on the granularity of
retrieved elements, allows degrees of relevance and is fairly simple and easy to visualise.
Searchers are asked to select an assessment score for each viewed piece of information that
reflects the usefulness of the seen information in solving the task. Five different scores are
available at the top left-hand side of the screen shown as icons:
The scores express two aspects (or dimensions) in relation to solving the task:
1. How muchrelevant information does the part of the document contain? It may be
highly relevant, partially relevant or not relevant at all.
2. How muchcontext is neededto understand the element? It may be just right, too large
or too small.
Figure 4.3:INEX 2006 interactive track relevance assessment scale
48
Page 61
5 Content-centric query formulation
A searchers’ first interaction with the interactive retrieval system is query for-
mulation. This chapter is about the development of a tool that can assist searchers
during query formulation. It suggests related terms and also offers the context of
these terms. Comparisons among the various weighting schemes and document
based and element based related terms are made.
5.1 Introduction
Query formulation, and especially query reformulation, are understood to be among
the most demanding tasks that users in interactive information retrieval systems face
[Belkin et al., 2001a]. Before entering the keywords into the search box, there is one criti-
cal step: A query must be formulated. Query formulation requires two types of mappings: a
semantic mapping of the vocabulary a user employs in articulating the task onto the system’s
vocabulary, and a mapping of the information seeker’s action (strategies, tactics) onto the rules
and features supported by the system [Marchionini, 1995].
Information retrieval is an interactive and iterative activity, and some researchers emphasise the
view of an trial-and-error activity [Swanson, 1977]. According to Swanson, an initial request
is a guess about the attributes of the desired documents, after which the response of the IR
system is employed to revise the initial guess for another try. [Efthimiadis, 1996] identifies
two query formulation stages: the initial query formulation stage in which the search strategy
is constructed and the query reformulation stage in which the initial query is adjusted manually
or with the assistance of a system. It is often argued that query reformulation is not any easier
than initial query formulation given that IR systems provide very little assistance. Users enter
the keywords they know in their initial query. If the initial query does not return the expected
search results, users then must submit their second best keywords. This reformulation process
can be even more frustrating and complex than the initial formulation because users often
experience difficulty in incorporating information from previously retrieved documents into
their queries [French et al., 1997].
Despite the perception that Web searching is simple and easy [Fast and Campbell, 2004],
approximately half of all Web users find they must reformulate their initial queries: 52%
49
Page 62
5 Content-centric query formulation
of the users in the 1997 Excite data set and 45% of the users in the 2001 Excite data set
[Spink et al., 2002] in fact made modifications to their initial query.
Searchers interact with the search engine on the surface level by submitting their queries to a
search box. They are actually interacting with the search engine on the cognitive, affective,
and situational levels in order to determine whether they want to submit new queries, add more
words, delete words, replace words with synonyms, combine two previous queries, or simply
re-enter previous queries [Rieh and Xie, 2006].
The study [Rieh and Xie, 2006] demonstrated that it is important to develop search tools that
can support the complex query reformulation behaviours that occur multiple times in the pro-
cess of IR interaction. To better support various kinds of query reformulation patterns iden-
tified in this study, innovative search tools are needed that offer much more dynamic and
interactive features. Based on the results of this study, an interactive reformulation tool can be
designed to promote and incorporate user involvement in the process of query reformulation.
For various reasons, searchers find query formulation and reformulation a very difficult task.
If a searcher’s information need lies within a new domain, it is very difficult to formulate an
effective query due to insufficient knowledge of the problem area. A second problem associ-
ated with this is vocabulary mismatch, which refers to the phenomenon that the searchers often
use different words to describe the concepts used by the authors of the searched documents.
[Furnas et al., 1987] observed that only 20% of the time two people use the same term to de-
scribe an object. The problem is more severe for short casual queries than for long elaborate
queries [Xu and Croft, 2000].
The proposal of related terms has become the standard method for helping searchers in such
situations. [Schatz et al., 1996] demonstrated and analysed the usefulness of term suggestions
based on a subject thesaurus and a term co-occurrence list. [Brajnik et al., 1996] conducted
a case study to investigate the value of query reformulation suggestions, terminological and
strategic help, and the best way to provide them.
[Schaefer et al., 2005] investigated the concept of proactive support for marking errors and
presenting suggestions during the user’s query formulation. The prototype evaluation showed
reduction of uncertainty and increase of user satisfaction.
User-controlled interaction appears to be preferred by most users, and they find support for
Bates’ hypothesis that users do not want fully automated search systems to which they can
delegate the whole search process [Bates, 1990]. Belkin and his colleagues carried out a
series of studies within the Text Retrieval Conference (TREC) Interactive Track in which they
attempted to address this problem by integrating interface design with development of the
relevance feedback that suggested both positive and negative terms [Belkin et al., 2001b].
Their results indicate that term suggestion was not difficult for users to understand and that in
fact it was preferred over automatic query expansion.
50
Page 63
5.2 Research questions
This chapter focuses on the computation of related terms and the development of a new tool for
presenting the related terms in the DAFFODIL system. First, we describe the methods used for
computing term-term similarity from a given corpus. For this, we regarded two variants, where
we used either a whole document or a single element as the basic unit of co-occurrence, and
we also employed several weighting formulae for computing term-term similarity. In addition
to the set of related terms, we also provide a KWIC index, which gives the user some context
for the related terms proposed.
5.2 Research questions
In this chapter, the following research questions are addressed:
1. Is suggesting related terms useful for assisting searchers in query formulation?
2. Which unit of co-occurrence gives better results — element or document?
3. Which weighting methods perform best for the ranking of the corpus-based related
terms?
4. How can contextually related terms be integrated into the interactive system DAFFODIL?
5.3 Usefulness of related terms
In order to determine the usefulness of related terms, we conducted a user study as part of the
INEX interactive track 2005 [Malik et al., 2006]. In these experiments, the term suggestions
were based on the online service Scirus1, which is a science search engine. It focuses on
scientific content sites and journal databases, highlights peer-reviewed articles, and covers
millions of science-related pages. To narrow down the search, co-occurrence analysis of the
result list is performed to propose related keywords in a clickable format. These terms were
downloaded by the DAFFODIL related term service and were presented as suggestions.
The new functionality of suggesting related query terms was found highly helpful: 29 of 76
users found this function useful in their performance of the search tasks. There were some
cases when the suggested terms either retrieved no documents (due to the fact that the term
suggestions were derived form a different corpus), or there was no obvious semantic relation-
ship to the query terms. These situations led to negative remarks by 11 searchers.
For this reason, we decided to compute collection-based related terms for the next INEX round.
1http://www.scirus.com (Last date accessed on January 6, 2009)
51
Page 64
5 Content-centric query formulation
5.4 Units of co-occurrence
First, we describe the two variants for defining the units of co-occurrence, namely whole doc-
uments and elements of a predefined granularity. The first case is straightforward — we regard
a document as an atomic unit, and the XML markup is ignored during processing.
5.4.1 Element as units
The rationale for regarding elements as basic units is the fact that a document may be about
several topics, and so co-occurring terms may relate to different topics. Thus, by choosing
smaller units, co-occurring terms may be stronger semantically related [Luu, 2007]. Since our
documents are in XML format, their tree structure has to be decomposed into non-overlapping
units. For that, we have to choose a certain level of the tree where we perform the split.
For illustrating this approach, let us consider an example document from the Wikipedia col-
lection:
Level 1<?xml version=“1.0” encoding=“UTF-8”?>
Level 1<article>
Level 2<name id=“3250761”>Laura Csortan</name>
Level 2<conversionwarning>0 </conversionwarning>
Level 2<body>
. . . . . .
Level 3<p >Laura’s surname ... mistakenly pronounced ’sortan’.</p >
Level 3<p >Born and raised in Adelaide... water-skiing.</p >
As former model ... italian television.
Level 3<p >As a model ... Hunk Of The Year Awards.</p >
As can be seen from this example, levels 1 and 2 mainly deal with the formal structure of
the document, so splitting at this level would not make sense. In contrast, the content-bearing
parts all occur at level 3 and above. We decided to split documents at level 3, thus leading to
a coarse-grained subdivision of documents. As a result, 1,594,285 units were extracted from
the Wikipedia collection.
52
Page 65
5.5 Keyphrases extraction
5.5 Keyphrases extraction
5.5.1 Keyphrases
Keywords and keyphrases are frequently used in document collections. Keyphrases are known
to be linguistic descriptors of documents [Witten et al., 1999]. They describe the content of
single documents and provide a kind of semantic metadata that is useful for a wide variety of
purposes. Keyphrases can be used as features in many text-related applications such as text
clustering, document similarity analysis and document summarization.
For example, academic papers are often accompanied by a set of keyphrases freely chosen by
the author. In libraries professional indexers select keyphrases from a controlled vocabulary
(also called subject headings) according to pre-defined cataloguing rules. On the Internet,
digital libraries, or any repositories of data also use keyphrases (also called content tags or
content labels) to organise and provide a thematic access to their data.
Manually extracting key phrases from a large corpus is too expensive. Instead, automatic key
phrase extraction can be a good practical alternative. Automatic keyphrase extraction is the
identification of the most important keyphrases from the document text by computers rather
than human beings.
There are number of off the shelf solutions available for the automatic extraction of the
keyphrases. These include KEA2, Yahoo3 term extraction tool, etc.
5.5.2 Keyphrase Extraction Algorithm (KEA)
KEA is an algorithm for automatically extracting keyphrases from text. KEA identifies can-
didate keyphrases using lexical methods, calculates feature values (term frequency(tf)*inverse
document frequency(idf), distance) for each candidate, and uses a machine-learning algorithm
to predict which candidates are good keyphrases. KEA consists of 2 phases: a training phase
and an extraction phase. Before extracting keyphrases from a collection, the extraction model
has to be built. The building phase (training phase) takes a sample collection with pre-assigned
keyphrases as input and internal parameters are trained using machine learning methods.
Candidate phrases KEA chooses candidate phrases in three steps. It first cleans the input
text, then identifies candidates, and finally stems and case-folds the phrases. For identification
of phrases, KEA applies the following rules:
2http://www.nzdl.org/Kea/ (Last date accessed on January 6, 2009)3http://developer.yahoo.com/search/content/V1/termExtraction.html (Last date accessed on Jan-
uary 6, 2009)
53
Page 66
5 Content-centric query formulation
1. Candidate phrases are limited to a certain maximum length (usually three words).
2. Candidate phrases cannot be proper names (i. e. single words that only ever appear with
an initial capital).
3. Candidate phrases cannot begin or end with a stopword.
Feature calculation Two features are calculated for each candidate phrase and used in train-
ing and extraction. They are:TF ∗ IDF , a measure of a phrase’s frequency in a document
compared to its rarity in general use; and first occurrence, which is the position of phrase’s
first appearance in the document.
5.5.3 Application of KEA
[Witten et al., 1999] performed experiments to determine the effect of training set size and
document length. The results showed that performance improves steadily up to a training
set of about 20 documents, and smaller gains are made until the training set holds 50 docu-
ments. Therefore they suggested thatIn a real-world situation where a collection without any
keyphrases is to be processed, human experts need only read and assign keyphrases to about
25 documents in order to extract keyphrases from the rest of the collection.
The effect of document length was investigated by considering full text documents in com-
parison to their abstracts. KEA extracted fewer keyphrases from abstracts than from full text
document. The result showed the reduced performance when using abstracts. The reason
seems to be as stated by author is that- not surprisingly - far fewer of the author’s keyphrases
appear in the abstract than can be found in the entire document.
For the application of KEA, our training set size in case of document based extraction was 50
and in case of element based extraction, 20 documents were used. The document selection
from the corpus was made randomly.
The system extracted 10 keyphrases in the document based extraction, and in the case of
elements, 3 keyphrases were extracted per element. No stemming was used for the reason that
stemmed terms sometimes are difficult to understand. As a result of extraction, we got 4,701
861 terms in the case of documents and 492,373 terms in the case of elements. The smaller
number in case of elements is caused by the following fact: Documents in the Wikipedia
collection are relatively small and splitting them further into document reduced their size even
more. As a result many keyphrases couldn’t meet the threshhold condition.
An example Wikipedia document along with its extracted phrases is given in appendixC.4.
54
Page 67
5.6 Co-occurrence Estimation
5.6 Co-occurrence Estimation
For the co-occurrence estimation, each keyphrase from a document is paired with all other
keyphrases from the same document and their co-occurrence statistics are computed over the
corpus. The co-occurrence threshold was set to 3 and only keyphrases occurring more than 3
times were considered.
5.6.1 Association Measurement
There is a number of methods for measuring the similarity between two concepts.
These include co-occurrence, Jaccard’s coefficient [van Rijsbergen, 1979], Expected Mu-
tual Information Measure (EMIM) [van Rijsbergen, 1979], Cosine [Salton et al., 1975], z-
value [Fangmeyer and Lustig, 1969], etc.
We consider a collection D of N documents denoted by the set of keysk = {1, ...,K}. For each
keyk∈ K, we define the key-document incidence wheretk : D →{0,1}, where ford ∈ D
tk(d) =
{1 if k occurs ind
0 otherwise
For each termk ∈ K, we define the quantitiesf 1k - the occurrence of the k andf 0
k - the non-
occurrence of k:
f ik =
{|{d ∈ D|k occurs in d}| for i=1
|{d ∈ D|k doesn’t occur in d}| for i=0
Furthermore, for two termsk, l ∈ K, we define mixed co-occurrencesni, jk,l for i, j ∈ {0,1}:
ni, jk,l = |{d ∈ D|tk(d) = i∧ tl (d) = j}|
The valuen1,1k,l is the number of documents in which the two terms k and l both appear and is
called the co-occurrence of the two terms.
As a consequence, we can build the following contingency table and define various weighting
schemes with its help.
n1,1k,l n0,1
k,l Σ = f 1l
n1,0k,l n0,0
k,l Σ = f 0l
Σ = f 1k Σ = f 0
k N
55
Page 68
5 Content-centric query formulation
CO(k, l) = n1,1k,l (5.1)
Jaccard(k, l) =n1,1
k,l
f 1l + f 1
k
(5.2)
z(k|l) =n1,1
k,l
f 1l
(5.3)
EMIM(k, l) =1
∑i=0
1
∑j=0
n1,1k,l log2(
n1,1k,l
f ik f j
l
) (5.4)
In addition to the above measures, MySql4 fulltext searching capabilities are also used to re-
trieve the query based term suggestions5. All the above measure are based on the occurrences
estimates while this measure favours the phrase that contains most of the query words. The
ranking of the proposed terms is based on the product of the weight of the term and its fre-
quency in the query. Its definition5.5 is based on the following parameters:
dtf = number of times the term appears in the document
U = number of unique terms in the document
N = total number of documents
df = number of documents containing the term
wt,d = wt,local ∗wt,global∗norm (5.5)
=log(dt f)+1
∑t∈d dt f∗ log(
N−d fd f
)∗ U(1+0.0115∗U)
5.6.2 Parameter estimation
The association measures that are based on the co-occurrence frequency are biased when the
frequency of the terms and their co occurrences are very small; e.g. consider the two cases
when there are two terms that are occurring four times and all the time occurring together and
there is the another case when two terms are appearing 100 times and co-occur 100 times. In
both cases, the maximum likelihood estimate for the probability of observing one term when
the other occurs would be 1.0. However, intuitively the later case is more reliable. Now the
question arises how can we differentiate between the two cases. [Fuhr, 1989] proposes a
4http://www.mysql.com (Last date accessed on January 6, 2009)5MySQL’s Full-Text Formulae with example (seehttp://www.databasejournal.com/features/mysql/
article.php/3512461/MySQLs-Full-Text-Formulas.htm (Last date accessed on January 6, 2009))
56
Page 69
5.6 Co-occurrence Estimation
f\h 4 5 6 7 8 9 10 11
4 10319
5 3221 5149
6 2578 1611 3521
7 2176 1252 906 2331
8 1795 1067 829 649 1687
9 1680 958 562 438 413 1555
10 1372 790 557 388 335 925 541
11 1331 708 525 333 293 735 344 326
Table 5.1:Frequency distribution for the estimation ofP(ki |l j) wherel j is occurrences of noun
phrases from INEX 2006 Wikipedia collection
method for optimal estimation of the z-value parameters shown in table5.2 which uses the
expectations E(.) from the empirical distributions shown in table5.1.
Popt(ei |ej) =(h+1)E(h+1, f +1)
(h+1)E(h+1, f +1)+( f +1−h)E(h, f +1)(5.6)
Consider the above case as an example where two terms are occurring four times (f = 4) and
all the time co occurring together (h = 4). Using the frequency distribution in table5.1, we get
Popt(ei |ej) =(4+1)E(4+1,4+1)
(4+1)E(4+1,4+1)+(4+1−4)E(4,4+1)
=(5)E(5,5)
(5)E(5,5)+(1)E(4,5)
=(5)(5149)
(5)(5149)+(1)(3221)= 0.889
Table5.2 shows all the values computed this way. For larger values of h and f, he used the
original distribution of z.
5.6.3 Experiments
In order to evaluate the effectiveness of the related term tools and weighting schemes, the query
set consisting of the around 1000 queries issued by the 88 searchers for the 12 tasks in INEX
2006-2007 iTrack experiments. Task-wise query statistics are given in appendixC.2. The
complete experimental setup is described in chapter4. Here the queries issued by searchers
are considered ideal. For each query, n related terms are retrieved using one of the weighting
57
Page 70
5 Content-centric query formulation
f\h 4 5 6 7 8 9 10
4 0.889
5 0.610 0.929
6 0.490 0.685 0.947
7 0.426 0.608 0.733 0.954
8 0.363 0.468 0.645 0.79 0.971
9 0.324 0.458 0.549 0.697 0.926 0.854
10 0.470 0.638 0.883 0.701 0.912
Table 5.2:Estimatespopt for the frequency distribution of Table5.1
schemes and evaluation is performed by computing the fraction of proposed terms that occurs
also in the ‘ideal‘ queries. The metrics precision and average precision are defined as follows:
Precision refers to the precision of one proposed term and average precision denotes to the
average precision of all the n terms proposed in response to a query.
precision=No. of non query words common in ideal and proposed terms
No. of words in proposed term
average precision= ∑ni=1 precision
n
Table 5.3shows the results of experiments considering the document and element based pro-
posed terms for varying length of the initial queries. The statistical significance of results is
tested with the one-tailed paired t-test which calculates the probability that the actual mean
difference between the pairs (for each length the best methods (in bold) document and element
wise are compared) is zero. If this probability is low we can claim that the difference between
the pairs is significant. Two levels of significance are distinguished: significant (p< .05) and
very significant (p< .01). The first case is marked with * and the second one is marked with
**.
Overall, document-based related terms performed better than element-based related terms. In
the former case, for short queries (length= 1 ...3), precision is higher and the weighting function
co performed best. It shows that the tool can suggest the related terms better when the query
is short. As the number of query terms increases, average precision is decreasing.
The document based related tool was also evaluated in the INEX interactive track 2006-07
experiments. After performing each task, searchers were asked to rate various interface fea-
tures including Related terms. The results, in table5.4, show that on average users were not in
favour of this tool, but the high variance indicates that a minority of users liked it
Negative and positive responses for the open questionWhat features of the interface were the
most and least useful for this search task?are given in tables5.5and 5.6.
58
Page 71
5.7 Contextual Related Terms
Document-based Element-based
length jaccard co popt mysql jaccard co emim mysql
1 0.0597 0.0771 0.0672 0.0172 0.0511 0.0449 0.0319 0.0414
2 0.0514 0.0641** 0.0448 0.0317 0.0362 0.0269 0.01470.0431
3 0.0368 0.0451** 0.0336 0.0194 0.0246 0.0139 0.00950.0287
4 0.0394 0.0341 0.0324 0.033 0.0172 0.0121 0.01210.0492
5 0.0045 0.0136 0.00290.0593 0.0215 0.0277 0.01810.0929
6 0.0212 0.0147 0.01660.0334 0.0049 0.0155 0.00430.0225
7 0.0157 0.0304 0.0142 0.0195 0.0254 0.0061 0.00880.0286
8 0.0229 0.0197 0.0218 0.0166 0.0071 0.0091 0.00590.0378
Table 5.3:Evaluation results
System Features µ σ2
How satisfied were you with the information provided in the related term list?2.04 2.49
Table 5.4:Searchers rating about the usefulness of proposed related terms on the scale of 1
(Not at all) to 5 (Extremely) in iTrack 2006-07
Table 5.5:In response to the open questionsWhat features of the interface were the most and
least useful for this search task?— Some negative comments about the related
terms* The related term was the least useful feature. I did not use it at all
* I took a look at the related terms but it seems like it can’t help me to get a better query.
* The related terms list is too long, and often off the mark.
* Least useful were the related terms, because the related terms were not relevant for the
task.
* The related terms were the least useful, it showed no good suggestion (’power metal
band’ for ’tidal power’)
* The related terms seemed to me to be of no use. I looked over the terms list, but found
none of them interesting.
5.7 Contextual Related Terms
On the one hand, a term suggestion mechanism is a very useful practice for assisting the
searchers during query formulation, as human memory works better in recognising relevan-
t/irrelevant information. It also takes less time to judge the relevance of terms than that of
document surrogates.
On the other hand, the searcher is uncertain about the selection of appropriate query terms, if
59
Page 72
5 Content-centric query formulation
Table 5.6:In response to the open questionsWhat features of the interface were the most and
least useful for this search task?— Some positive comments about the related terms
* The most useful feature was, surprisingly, the related terms function. Here (after a small
degree of trying and failing) I found the right word combination I was looking for.
* I found the only way to get close to the information I was seeking was by using related
terms.
* In this task the related terms was the most useful feature.
* Related terms list was very useful for disambiguation of search results in cases when
there were more people with the same name, related terms captured their different
professions (e. g. film maker, painter, banker)
* the search result with the related terms was not as good as I expected
the meaning of a suggested term is not apparent or the searcher’s knowledge is not sufficient to
grasp the meaning. Furthermore, even highly correlated terms may be useless or even distract-
ing for a searcher. For example, a user searches events in Versailles. One of the suggestion of
the related term tool is Treaty of Versailles; though this suggestion is referring to an event in
Versailles, a searcher may not recognise it due to lack of knowledge. This problem is identified
by one of the searchers in iTrack 2006
The list of related terms is too vast. In situations where I did not know the meaning
of a keyword extracted from the task description, the related terms did not help.
Some of them might have been synonyms but there was no way for me to know.
Therefore there is the need of some service that can explain on demand the meaning of a
proposed term. Context is very useful for determining the meaning of terms. Keyphrases
usually have many different meanings, and those meanings depend heavily on the context in
which those keywords appear. In the state of the art search engines, Keyword In Context
(KWIC) is a well known method of presenting the results. The sentence or sentences in which
the keyword appears is presented to a searcher for determining the usefulness of a result.
Sentences are by definition a coherent linguistic entity to overcome problems with semantics.
They present the query terms in a better way. Furthermore, they are small enough to allow
searchers to assess relevance in a short time [White, 2004]. Sentences are preferred over
paragraphs (as used in passage retrieval [Salton et al., 1993]) simply because they take less
time to assess. This allows searchers to make speedy judgements on the relevance/irrelevance
of the information presented to the them.
In order to show the contexts of proposed term, appropriate sentences of the Wikipedia collec-
60
Page 73
5.7 Contextual Related Terms
tion were extracted using the LingPipe6 tool. It extracts sentences heuristically by identifying
tokens in context that end sentences. The Lucene search engine7 is used to index and retrieve
the top k (with k between 3 and 10) sentences. When applying this method, the following
problems were faced:
1. Some sentences were too short. Some highly scoring sentences were often headings thus
too short to be indicative.
2. For example, most Wikipedia pages contain a section with external links, containing this
links as a list of bulleted items. The complete list was regarded as one sentence, and thus
it often became too long.
3. Some sentences were redundant. The top ranking sentences were often too similar in
case they were retrieved from the same document. Thus, keyword query terms were
shown in similar contexts and the value of the generated summary was diminished.
In order to resolve the above mentioned problems, the following measures were taken. Only
sentences exceeding a minimum length are considered for presentation as context (threshold:
15 tokens including punctuation). This is a frequently used threshold for removing captions,
titles and headings [Teufel and Moens, 1997]. The maximum length was set to 50. To avoid
the presentation of similar contexts, each context should come from different document. The
DAFFODIL system was enhanced by integrating the contextual related term tool. For this, the
suggestions of [Rieh and Xie, 2006] were taken into account. These are
1. Provide a secondary window in addition to the main window of a search engine in which
user and system interact.
2. Facilitate users in manipulating multiple queries in an efficient way.
3. Assist users in reformulating queries by providing context-based term suggestions.
4. Provide the ability to select query terms from the term suggestion list and allow users to
modify them.
In addition to these points, the top three contexts of the each proposed term are provided as
tooltip as depicted in figure5.1. There is also the possibility to view more than the top three
contexts in a separate window. In this case, the top ten contexts are shown (see figure5.2), and
the searcher can view the complete element detail for each of these sentence by clicking on it.
6http://alias-i.com/lingpipe/(Last date accessed on January 6, 2009)7http://lucene.apache.org/java/docs/(Last date accessed on January 6, 2009)
61
Page 74
5 Content-centric query formulation
Figure 5.1:Contextual related tool showing related terms along with top 3 KWIC as tooltip
for the term “heating House“
5.8 Evaluation
The evaluation of the tool was performed within iTrack 2008 where 30 searchers participated
in the experiments. The infrastructure of the experiment was similar to iTrack 2006-2007
with the following exceptions: only the element retrieval system was used and each searcher
worked on two tasks of her own choice. Tasks are given in appendixD.
Several questions in the questionnaire referred to system features. Here we are listing only
those questions which are about the contextual related tool. Searchers were asked to rate the
usefulness of different features of the system on the scale of 1 to 5, where 1 stood for ’Not at
all’, 3 ’Somewhat’ and 5 for ’Extremely’. These are as follows.
1. How satisfied were you with the information provided in the related term list?
2. How useful was/were
a) the related terms?
b) the related terms context?
c) the way of presenting the terms?
d) the way of presenting the context of terms?
62
Page 75
5.8 Evaluation
Figure 5.2:Contextual related tool showing related terms along with top 10 KWIC in separate
window
The results are summarised in table5.7. Results showed that searchers found the tool some-
what useful. In comparison to the previous year, results are a little better for the related terms
tool. Usefulness of related terms is also higher and there are no comments on the usefulness of
this tool. However, the results are not as good as we expected. This may be due to two major
reasons; Firstly, phrases often occur in the wrong order. The reverse order of phrase is due to
the alphabetical sorting of the components, in order to find the phrase in any order. Therefore,
one could keep the original order of phrases, even if some occurrences get lost. The second
problem ”no highlighting of terms in tooltip“ can be easily addressed.
System Features µ σ2
How satisfied were you with the information provided in the related term list?2.64 1.29
How useful were the related terms? 2.76 1.61
How useful were the related terms context? 2.64 1.69
How useful was the way of presenting the terms? 2.76 1.56
How useful was the way of presenting the context of terms? 2.76 1.61
Table 5.7:Searchers rating the usefulness of contextual related tool on the scale of 1 (Not at
all) to 5 (Extremely) in iTrack 08
63
Page 76
5 Content-centric query formulation
Table 5.8:Responses to open questionsWhat features of the interface were the most and least
useful for this search task?— Some positive comments about the related terms
* Some related terms have several contexts. Some are relevant and some not.
Perhaps the system should display the most relevant search result.
* It did present useful related terms related to the topic I was researching,
regardless of it actually leading to relevant results.
* I think the useful part of this system is providing related terms and their context.
it provides useful related terms lists. It helps the users to search
his/her topic in other possible ways.
* It was nice to have a list showing related searches next to the list of hits.
Table 5.9:In response to the open questionsWhat features of the interface were the most and
least useful for this search task?— Some negative comments about the related
terms* titles in the side window (related terms) did not relate to the search result they triggered.
* Please show only relevant related terms
* The related terms does not provide me good terms. So I almost never look at it.
5.9 Conclusion
In this chapter, we investigated the usefulness of related terms to assist searchers for query
formulation. Results showed the usefulness of suggesting related terms. In addition, there
were situations when chosen related terms retrieved no results, since those proposed terms
were based on another scientific collection.
It lead us to develop a collection based related tool. We considered different co-occurrence
units to compute the association relationship between terms. A number of weighting meth-
ods were compared in laboratory experiments. These experiments favoured document based
related terms and co-occurrence weighting scheme for short queries.
The two approaches were compared in iTrack 2006-07 and iTrack 2008. Results are a little
higher for the element based tool. The evaluation of the document based tool also identified
the need to add context to proposed terms. As a result a KWIC feature is added and evaluated
in interactive setting in the same year iTrack 2008. The acceptance of the tool is not up to
our expectations. This may be due to two problems; reverse order of proposed term and not
highlighting the related terms in the top 3 KWIC.
64
Page 77
6 Element retrieval interfaces and
visualisation
After the query formulation, the searcher’s next interactions with the system are
inspection of the result list and examining details of the results in order to find
the relevant information. In this chapter, we focus on investigating the different
strategies for these two purposes. These include linear vs. document-wise result
list presentation and the display of relevant results in the context of the document.
For the result detail, logical navigation support and specific visualisations are used.
Usability studies are performed and their results are reported. The chapter finishes
with the description of techniques used to visualise the search interaction with the
element retrieval system.
6.1 Introduction
Traditional information retrieval system interfaces display the query results in linear order and
decreasing likelihood of relevance. In the case of classic document retrieval systems, dealing
with atomic documents, presentation is simple. The best known representatives of this kind
are Web search engines. Each document is represented by a surrogate typically consisting of
its title, a query-based summary of the document and its Uniform Resource Locator(URL).
For the examination of a document, as it is treated as independent and atomic unit, access is
directly given to the document and no specific browsing and navigation facilities are provided.
Element retrieval systems contrast this kind of document retrieval in both of these aspects.
Element retrieval systems can retrieve more than one element from a document at different
ranks in the result list and the independence assumption also doesn’t hold. Furthermore, the
retrieved results from a document may also have the containment relationship where one re-
trieved element can be the ancestor of another retrieved element. For example, a section and
one of its subsections can be retrieved. Thus for designing the element retrieval interfaces
these problems should be taken into account. The structured nature of documents makes it
also possible to provide navigational support at the document examination level.
65
Page 78
6 Element retrieval interfaces and visualisation
6.2 Research questions
In this chapter, the following research questions are addressed
1. In response to the users’ query, an element retrieval system can retrieve more than one
element from a document. These elements may even be overlapping such that both a
parent and one or more of its child nodes can be retrieved. Which is the best strategy
to present the results in this case? Which is the best way to present the result items:
document metadata-based, element caption-based or sentence-based?
2. For the examination of a document, is it helpful to show the structured document using
some visualisation to depict its structure, the relationship among the retrieved elements
and their granularity?
6.3 Related Work
For visualizing the results of searches in longer (fulltext) documents, only a few systems have
been developed in research.
SuperBook [Remde et al., 1987], as shown in figure6.1, makes use of the structure of the
large documents to display query term hits in context. The results of the user query are shown
in the context of a table of contents hierarchy by enlarging the sections containing search
hits container sections and compressing the other parts. There are some problems with the
SuperBook interface. It uses automatic linking to any other occurrence of the same word in
hypertext. Users wander off by following links. Thus it would require more discriminating
links. Moreover, user form better mental models when a hierarchical structure is given.
The TileBars result visualisation technique (figure6.2) was introduced by
Hearst [Hearst, 1995]. This technique presents each result document in form of a rect-
angular bar. This bar is subdivided into a number of rows depending on the number of query
facets. It illustrates at one glance the length of a document and the distribution of topic-wise
passages within document.
So far, there has been little work on interactive XML retrieval. Finesilver and Reid describe
the setup of a small collection from Shakespeare’s plays in XML, followed by a study of end
user interaction with the collection [Finesilver and Reid, 2003]. Two interfaces were used: one
highlighting the best entry points and the other highlighting the relevant objects.
Some recent efforts have been made within the INEX interactive track [Larsen et al., 2006,
Tombros et al., 2005a]. Kamps et al. tested a web-based interface, that used a hierarchical
result presentation with summarization and visualisation [Kamps et al., 2006], and van Zwol,
66
Page 79
6.4 Baseline System
Figure 6.1:SuperBook interface by [Remde et al., 1987]
Spruit and Baas worked with graphical XML query formulation and different result presen-
tation techniques using also in a web-based interface [van Zwol et al., 2006b]. Besides these
systems, various techniques for visualisation of structured documents have been proposed in
[Crestani et al., 2004] and [Großjohann et al., 2002, Tombros et al., 2005a].
6.4 Baseline System
The user interface in iTrack 04 was a browser-based frontend connecting to the HyREX re-
trieval engine [Fuhr et al., 2002a, Govert et al., 2003]. Experimental details are given in chap-
ter4.
Following the design of standard Web search interfaces, the query form of this interface con-
sisted of a single search box. Here users could type in a query. In response to a user query, the
system presented a ranked list of XML elements including title and author of the document
in which the element occurred. In addition, a retrieval score expressing the similarity of the
element to the query and the path to the element was shown in form of a result path expression
(see Figure6.3). The searcher could scroll through the resultlist and access element details by
clicking on the result path. This would open a new window displaying this element.
67
Page 80
6 Element retrieval interfaces and visualisation
Figure 6.2:TileBars interface by Hearst
The detailed element view is depicted in Figure6.4. The content of the selected element
was presented on the right hand side. The left hand part of the view showed the table of
contents (TOC) of the whole document. Searchers could access other elements within the
same document either by clicking on entries in the TOC or by using the Next and Previous
buttons (top of right hand part). A relevance assessment for each viewed element could be
given as shown in Figure6.4..
6.5 Findings
The detailed findings based on the log and questionnaires, included in appendixA, are reported
in [Tombros et al., 2005b]. Here, only the findings related to the usability of the baseline
system are discussed. We analysed the questionnaire and interview data to investigate these
issues.
The overall opinion of the participants about the baseline system was recorded in the final
68
Page 81
6.5 Findings
Figure 6.3:iTrack 04: Query form and resultlist
Figure 6.4:iTrack 04: Detail view of an element
69
Page 82
6 Element retrieval interfaces and visualisation
questionnaire which users filled after the completion of both tasks. Users were asked to rate
the different features of the system on the scale of 1 to 5, where 1 stood for ’Not at all’, 3
’Somewhat’ and 5 for ’Extremely’. The results are summarised in Table6.1. The results
showed that the system was easy to learn to use, easy to use and well understood by the
searchers.
System Features µ σ2
How easy was it to learn to use the system? 4.17 0.6
How easy was it to use the system? 3.95 0.7
How well did you understand how to use the system?3.94 0.5
Table 6.1:Overall opinion about the system on the scale of 1 (Not at all) to 5 (Extremely) in
iTrack 04 Baseline (88 searchers)
In addition to these ratings, users were asked to comment on the different aspects of the system
after the completion of each task and after the completion of the experiment. Some of the
questions were:
• In what ways (if any) did you find the system interface useful in the task?
• In what ways (if any) did you find the system interface not useful in the task?
• What did you like about the search system? What did you dislike about the system?and
• Do you have any general comments?
The analysis of the most frequent comments are presented in the following paragraphs. Table
6.2summarises the positive and table6.3the negative results.
Element overlap. One of the critical issues of element retrieval is the possible retrieval of
overlapping result elements, i. e. components from the same document where one includes the
other (due to the hierarchic structure of XML documents). Typically these elements are shown
at non-adjacent ranks in the hit list. This is due to the fact that the HyREX retrieval engine
did not take care of overlapping elements and thus searchers frequently ended up accessing
elements of the same document at different points in time and at different result ranks.
Data from both the system logs and the questionnaires showed that searchers found the pres-
ence of overlapping elements distracting. By recognising that they had accessed the same
document already through a different retrieved element, searchers typically would return to
the resultlist and view another element instead of browsing again within a document visited
before. 31 users commented negatively on the element overlap.
70
Page 83
6.5 Findings
Table 6.2:Positive responses on system usefulness (iTrack 04, 88 searchers)
System Response
Features Count
Table of contents 66
Keyword highlighting 36
Simple/easy 34
Good results 13
Fast 8
Simple querying 6
Table 6.3:Negative responses on system usefulness (iTrack 04, 88 searchers)
System Response
Features Count
Overlapping elements 31
Insufficient summary 30
Distinction b/w visited & unvisited 24
Limited query language 22
Poor results 10
Limited collection 9
Slow 9
Document structure provides context. The presence of the logical structure of the docu-
ments alongside the contents of the accessed elements was a feature that searchers commented
positively on. The table of contents of each document (see Figure6.4) seemed to provide
sufficient context to searchers in order to decide on the usefulness of the document. 66 users
found the TOC of the whole article very useful because it provided easy browsing, navigation,
less scrolling or gave a quick overview of which elements might be relevant and which might
not be.
Element summaries.The resultlist presentation in the iTrack 04 system did not include any
element summarization. Only the title and authors of the document were displayed in addition
to the result path expression of the element and its similarity to the query. As a consequence
searchers had little clues available to decide on the usefulness of retrieved elements at this
point. 30 users commented on these insufficient clues.
Keyword highlighting. Within the detail presentation of an element, all query terms were
71
Page 84
6 Element retrieval interfaces and visualisation
highlighted. This feature was very much appreciated, and several users suggested to provide
this feature not only at the resultlist level, but also at the table of contents level. 36 users gave
positive comments on this feature.
Distinction between visited and unvisited elements.There was no distinction between vis-
ited and unvisited elements at the resultlist and detail levels. Thus, a number of times users
visited the same elements/documents more than once. 24 users commented negatively on this.
Limited query language. The system did not support sophisticated queries and there was no
possibility to use phrases, boolean queries, or to set the preference for terms. 22 users found
this an obstacle.
General issues.There are also some more general issues that were commented on. These
stated that the multiple windows of the web-interface were somewhat confusing and that the
”Result path” shown in the resultlist was mostly meaningless, and with the square brackets, it
had a very technical appearance.
6.6 Baseline vs. graphical interface with treemap
As an alternative to the baseline, a system with graphical features was also developed. This
system differed from the baseline system both in the way of visualising the ranked list (Figure
6.5) and in the way of presenting the detailed view of components (Figure6.6). The graphical
system retrieves documents rather than components, and presents the title and authors of each
retrieved document. In addition, it also presents a shaded rectangle (the darker the colour the
more relevant the document to the query) and a red bar (the longer the bar the more query hits
are contained in the document).
The detailed view for each selected document component is similar to that for the Baseline
system, with the addition of a graphical representation at the top of the view (Figure6.6). It
caters for the two aspects of XML retrieval
1. structural or hierarchical relationship among the document elements
2. varying granularity or size of answer elements
The design of this graphical view is based on the idea of
TreeMaps [Johnson and Shneiderman, 1991] thus using two dimensions for illustrating
the structure of an XML document. A document is represented as a rectangular area and
splitted horizontally and vertically to represent the different levels (for example horizontal
splitting for first level nodes, vertical splitting for second level nodes and horizontal splitting
again for third level nodes and so on). However, for XML documents this representation is
rather cluttered. Therefore, the treemap concept is augmented and the concepts of partial
72
Page 85
6.7 Findings
Figure 6.5:Ranked result list with the visualisation of number of hits within document iconic
representation of relevance
treemaps was introduced: here non-retrieved nodes and descendants of these items are
omitted [Kriewel, 2001].
Tooltips (on mouse-over) provide additional information about the retrieved components, such
as the first 150 characters of the contents and the component’s name, the selected section,
subsection, etc.
On top of the Treemap view, all the retrieved documents are shown as small rectangles with
grey shades along with theNextandPrevioushyperlinks.
6.7 Findings
The analysis of the open questions listed in section6.5is presented here. Some of the positive
and negative searchers’ comments are given in tables6.4and 6.5respectively.
Graphical view of documentThe graphical representation of the document is appreciated by
most of the searchers. It allows for easy browsing and all the relevant elements are marked
in one representation. It also provides information about the amount of information being
relevant.
One searcher suggested to combine the visual representation with the table of contents, where
73
Page 86
6 Element retrieval interfaces and visualisation
Figure 6.6:Result presentation with Partial Treemaps.
the size of the visualisation is reduced.
Document based result listThe searchers preferred the document based result list over the
scattered result list and the overlapping result list.
Gray square-based result list navigationwas found not useful due to the lack of textual
information.
Other findings included the “Insufficient Summaries”, “Document structure provides context”,
and “Keyword highlighting“ as described in the previous section.
iTrack 04 was the first attempt to set up an interactive track for XML retrieval, and there was
very little knowledge on which we could build upon when designing the interface. In contrast,
the design of the iTrack 05 interface was based on the experiences from the previous year.
In designing the new interface, we aimed at overcoming the main weaknesses of the 2004
interface.
74
Page 87
6.8 iTrack05 system
Table 6.4:Responses to the open questionsWhich aspects of the system did you find useful?
or Which system did you prefer?
* The graphical interface. Aggregated results from the same doc and the visualisation.
* Possibility to go through the table of contents.
* It gives a bit of context to the search and the specific part of interest.
* In the graphical interface I liked the graphical additions.
* The graphical interface, although it might be made more clear (the graphical article
view).
* Zooming in the relevant parts. Useful having a table of Contents. Easy to move within
the documents.
* It was easy to pin-point interesting parts of the article.
* I liked the gray fields to jump to sections in the document. Also I liked the accompanying
mouse over.
* The graphic overview of the articles, allowed for easy browsing.
* I liked the visual representation, but would prefer it smaller, or combined with the table
of contents.
6.8 iTrack05 system
For iTrack 05, the DAFFODIL framework was used and extended to meet the functionality of
XML retrieval.
The interface for iTrack 05 was designed by taking into account the findings of iTrack 04. Fur-
thermore, the berry picking model described in section6.3and iconic visualisation techniques
for better recall and immediate recognition were included. These are in conformance to the
design principles identified by Hearst [Hearst, 1999].
Additions to the Architecture. The base system had to be extended for INEX in order to deal
with the highly structured XML data. These extensions affected both the user interface and
the corresponding backend services, e. g. connecting the XML search engine.
Query formulation. The problem of limited query language expressiveness was resolved
by allowing Boolean queries, in combination with proactive query formulation support
[Schaefer et al., 2005]. The latter feature recognises syntactic errors and spelling mistakes,
and marks these. Besides full-text search, the system now also allowed for searching on meta-
data fields such as authors, title, year.
Resultlist presentation. In order to resolve the issues ofoverlapping elementsandelement
summarizationidentified in iTrack 04, results in the resultlist were now grouped document-
75
Page 88
6 Element retrieval interfaces and visualisation
Table 6.5:Some negative comments about the graphical system
* Grey squares on the top (treemap view). Difficult to distinguish score of relevance with
the grayed squares. Better show score.
* I get parts of the document in different parts of the result list. Confusing.
* 1. it was too abstract. More useful to see the gray scale highlights at the table of
contents. 2. I didn’t experienced the direct connection between the colours and the
relevance.The gray scale “link boxes” on the top were not useful for me without any textual
information.
* Bad article descriptions (“Elsewhere”). No logic displayed WHY the engine thinks an
article relevant.
* The black relevance boxes. Too many shades of gray.
* Repetition of the same article in result list (different parts). Not being able to go from
part to article.
* In general, not showing article structure or relation between different retrieved results.
* The arrow on the top, no indication to where it takes you (not to next relevant doc, just to
next component in the doc).
* No context in the result list. Rating not related to human experience.
* Lack of visual thing on the baseline interface. Assess different time same doc.
(components in different parts of the doc).
* The text-only search engine did not have the ability to browse the relevant hits within
one article.
wise and hits within documents were presented as possible entry points within the hierarchical
document structure. The document metadata information is shown as the top level element, as
depicted in Figure6.7.
In addition, whenever some element within a document is retrieved, the title of that element is
presented as a document entry point, depicted as a clickable folder icon. This change reflected
user preference for the TOC view, where titles of elements are displayed.
We also took into account the comments about the retrieval score and the result path expression
from iTrack 04. The retrieval score of each retrieved element was now shown in pictorial (as
opposed to numerical) form, and result path expressions of elements were removed from the
resultlist. The whole resultlist entry was made clickable.
The comments on the distinction between visited and unvisited elements were considered by
using an iconic visualisation technique. An eye icon is shown with any resultlist entry that
has been visited before. The analogy with the berry picking model is realised here by marking
76
Page 89
6.8 iTrack05 system
the paths where a user walked before to avoid looking twice at the same information. We also
adopted query term highlighting at the resultlist level, since searchers appreciated this feature
at the detail view level.
Figure 6.7:iTrack 05: Query form and resultlist
Detail view. The main layout of the detail level was kept the same as in iTrack 04, as shown
in Figure 6.9. Some additions were made for supporting document browsing. First, the entry
points from the resultlist level are now also highlighted in the detail view. Second, elements
already visited are indicated with an iconised eye in the table of contents.
Many participants in iTrack 04 felt that the two-dimensional relevance scale used in these ex-
periments was too complex [Pehcevski et al., 2005]. For this reason, we moved to a simple
3-point scale, measuring only the usefulness of an element in relation to the searcher’s percep-
tion of the task: 2 (Relevant), 1 (Partially Relevant), and 0 (Not Relevant). This three grade
relevance scale was visualised as shown in Figure6.9 (top left hand). The same icons were
added to the viewed element when a relevance value was assigned by the user. Here again one
more aspect of the berry picking model analogy was implemented successfully: the user puts
the ’good’ berries into her basket, and also can see which berries she has picked before.
77
Page 90
6 Element retrieval interfaces and visualisation
Figure 6.8:Element retrieval interface by [Kamps et al., 2006]
6.9 Findings
The analysis was performed along the same lines as in iTrack 04. The overall opinion of the
participants about the system was recorded in the final questionnaire that they filled after the
completion of all tasks. New questions enquiring about the distinct aspects of the system used
in 2005 were added. Questionnaires are included in appendixB. The results are summarised
in Table 6.6. Differences significant at the 95% level are marked with a∗ and at the 99% level
are marked∗∗. As can be seen, users were positive in general on both systems, and the major
difference between the two years was the better learnability of the 2004 system. This outcome
is due to the fact that normally they are used to of interacting with state-of-art search engines
for searching and browsing. These interfaces are all web-based.
In addition, there were many informal comments in response to the questions mentioned in
section 6.5. We analyse the data in the following paragraphs.
Resultlist presentation. Presentation of results in a hierarchy is generally found useful. 43
users commented positively on it, whereas 3 users found the information presented insufficient
for deciding about relevance or irrelevance. 2 users commented on the inconsistency of the
78
Page 91
6.9 Findings
Figure 6.9:iTrack 05: Detail view
result presentation. This situation occurred when a whole article was retrieved as a hit, with
no further elements within this article. 3 users disliked scrolling at the resultlist level.
Table of contents and query term highlighting. As in iTrack 04, the TOC is found to be
extremely useful and 32 users commented positively on it. Query term highlighting in the
resultlist and the detail view were also appreciated (22 positive comments).
Awareness in the detail view.The document entry points shown in the resultlist were also
displayed in the detail view, 14 users commented positively on it. In addition, icons indicating
visited elements and their relevance assessments are shown in the TOC: 3 users found this
useful. In addition, 15 users also wanted to have the relevance assessment information in the
resultlist.
Retrieval quality. Although the underlying retrieval engine had shown good retrieval results
in previous INEX rounds, it produced poor answers for some queries, so 25 users commented
negatively on this. A possible reason could be the limited material on the chosen search topic.
Other Issues. 4 users remarked positively on the interface usefulness and 3 liked the query
form. The response time of the system was perceived as being too high, 35 users commented
79
Page 92
6 Element retrieval interfaces and visualisation
Table 6.6:Overall opinion about the system on the scale of 1 (Not at all) to 5 (Extremely) in
iTrack 04 (88 searchers) & iTrack 05 (76 searchers)
System Features iTrack 04 iTrack 05
µ σ2 µ σ2
How easy was it to learn to use the system? 4.17* 0.6 3.40 0.9
How easy was it to use the system? 3.95 0.7 3.96 0.9
How well did you understand how to use the system? 3.94* 0.5 3.84 0.9
How well did the system support you in this task? - - 3.13 0.9
How relevant to the task was the information presented to you? - - 2.97 1.13
Did you in general find the presentation in the resultlist useful? - - 3.35 0.8
Did you find the table of contents in the detail view useful? - - 3.72 1.0
negatively on it.
Overall, user responses show that the main weaknesses of the iTrack 04 interface were re-
solved. In addition, the new features supporting the berry picking paradigm were appreciated
by the users.
6.10 Links with other research
There has been a number of studies performed in relation to this
work. [Finesilver and Reid, 2003] also found preference for the best entry points. In
the iTrack 2005, comparison task, [Kamps et al., 2006] compared the heatmap interface
(see figure6.8) with the new interface and found an appreciation for the hierarchical result
presentation approach used in both systems. [Hammer-Aebi et al., 2006] participated in task
C of iTrack 2005 where a different Lonely Planet collection and system are used. They also
concluded that the problem of overlapping elements can be solved in end-user systems at
the interface level by replacing an atomic view of element retrieval with a contextual view
(i.e., grouping results by document). Their study also involved comparing systems with and
without context, which, surprisingly, showed no large changes in behaviour of searchers for
the system providing context.
80
Page 93
6.11 Conclusion
6.11 Conclusion
This chapter described how an improved interface is designed by taking into account negative
searchers’ responses. The analysis of iTrack 04 showed several negative responses to the used
web-based interface. The main issues were the overlapping elements presented in a linear
resultlist, insufficient summaries to indicate the relevance of an item, the lack of distinction
between visited and unvisited items and a limited query language. Also some positive com-
ments were made, e. g. the document structure (TOC) provided sufficient context and was a
quick way of locating the interesting information. Keyword highlighting was also found to be
helpful in ’catching’ information parts that may be relevant to the existing query terms.
These findings were used to shift to an application-based interface. The analysis of iTrack 05
showed that the overlapping elements presentation in a hierarchy can provide sufficient sum-
marization and context for the decision of relevance or irrelevance. The second major improve-
ment was the addition of design elements based on the berry picking model [Bates, 1989],
which received substantial appreciation. These design elements included keyword highlight-
ing, iconic visualisation and provision of related terms.
Overall, the evaluations showed that interface design adaptations based on the 2004 findings
were taken as an improvement. The shift to an application based framework proved to be the
right step, as we gained more flexibility in features than in a web-based framework.
81
Page 95
7 User preference for elements and their
granularity
In this chapter we examine the value of an element retrieval system for users.
The preference for the granularity will also be investigated.
7.1 Research questions
A major issue in XML document retrieval is the question whether making elements retriev-
able is worth the additional effort: Are elements valuable to users in a retrieval situation, or
are users just as well served by IR systems that retrieve whole documents? In this chapter,
we examine indications of searcher preferences for whole documents versus elements from
their behaviour in an interactive experiment. The first research question about document entry
points is formulated as:
Do searchers opt for whole documents or elements in the hitlist of an XML IR
system?
The second question refers to the relevant items: Which is the appropriate granularity of ele-
ments preferred by searchers? One way to consider the granularity is considering the mark-up
of elements such as sections, subsections, and paragraphs and to analyse which granularity is
preferred by searchers.
Do searchers view and assess as relevant the full text of whole documents or
elements?
Another way to examine the granularity is by considering the size of elements. The size of
elements may not always correspond to its granularity since the length of elements can vary
from document to document. If the sections of one document are of very small size, the
same may not hold for all the documents. Therefore we need to analyse the granularity of
the elements in this respect. There are two possibilities to examine the size of elements: 1)
by counting the absolute number of words in elements, 2) by regarding the size of elements
relative to the document. Therefore we formulate the following question:
83
Page 96
7 User preference for elements and their granularity
How is the varying size of elements assessed by searchers, in an absolute way
or relative to the document size?
7.2 Experimental Settings
This study was part of the Interactive Track at INEX 2005 (see [Larsen et al., 2006] for de-
tails), where 73 test persons performed 219 tasks: each of them searched two given work tasks
(selected from two categories) and one of their own (11 of these tasks had to be discarded
due to logging problems). The corpus consisted of articles from the IEEE Computer Society’s
journals, and a maximum of 20 minutes was given to complete a task.
In response to a free-text query, the XML IR system returned a hitlist of selected high ranking
elements (represented by their titles), grouped by the containing documents (represented by
title, author, journal and year) as shown in figure6.7. Both the elements and the document
titles provided access to the full-text view: clicking on a document title displayed document
metadata (including an abstract) but not the full document. Clicking an element title displayed
the full text of the element directly in a new view as shown in figure6.9. The fulltext view
always showed a table of contents (ToC) of elements in the document, and the full text of the
selection. The following document levels could be viewed: article, metadata, sections (sec),
sub-sections (ss1) and sub-sub-sections (ss2). Searchers were instructed to assess all viewed
elements, but not forced to do so. Relevance assessments could be given on a 3-grade scale:
relevant, partially relevant and not relevant.
Searchers were given a full system tutorial before the start of search sessions. All interactions
with the system were logged in detail. In this chapter, we analyse the log data for aspects of
searcher preference for whole documents vs. elements.
7.3 Entry point preference
The entry points can be defined as document components from which the user can browse to
obtain optimal access to relevant document components. In this section, we will be investigat-
ing the research question relating to the best entry point. Do searchers prefer whole documents
or elements as an entry point to a document?
A total of 1371 documents were accessed in the experiment. In the hitlist these documents were
each represented by the document metadata (title, authors, journal and year), and an additional
3.2 clickable elements on average, e.g., sections and subsections. Searchers predominantly
clicked on the title of the whole document as their entry point to the full text: 71% of the
available documents were accessed this way, thus displaying metadata in the full-text view,
84
Page 97
7.3 Entry point preference
even though a large number of sections and subsections also could have been directly accessed.
Sections accounted for 17% of the entry points, sub-sections for 11% and sub-sub-sections
only for 1%. In the analysis we do not consider the possible overlap between elements (i.e. a
subsection and its containing section are both counted independently).
Accessible Clicked
metadata 1371 (24%) 987 (71%)
sec 2327 (40%) 233 (17%)
ss1 1862 (32%) 155 (11%)
ss2 189 (3%) 9 (1%)
Sum 5749 (100%) 1384 (100%)
Table 7.1:Available and accessed entry
points for all tasks
Accessible Clicked
metadata 952 (24%) 691 (73%)
sec 1602 (41%) 148 (15%)
ss1 1233 (32%) 108 (11%)
ss2 126 (3%) 6 (1%)
Sum 3913 (100%) 953 (100%)
Table 7.2:Rotation effects from second
task onward
The analysis showed that searchers predominantly selected metadata as their entry point for
accessing the retrieved document. This corresponded to searchers clicking on the title of the
documents, which might have led them to believe that they could access the full text of the
document. If they assumed so, it means that there should be a change in their behaviour after
performing the first task since they already learnt that clicking on the title of the result would
not show the fulltext. Therefore we did the same analysis by ignoring the first task performed
by each searcher. As shown in table7.2, results are no different from the previous case.
We also investigated via questionnaires how many searchers expected to view the details of
the document by clicking on a title and complained about it. We found only three such cases.
Their comments are as follows. “Clicking an article jumps to 1st section instead of full article”,
“Displaying just abstract of document when opening the document not useful”,“ I clicked the
title of the document in the result list but About the Article part opened. So, I had to click the
upper one (document itself) in the table of contents to view the whole document”.
Our results suggest that searchers predominantly selected metadata as their entry point for
accessing the retrieved documents. This corresponded to searchers clicking on the title of
the documents, which might have led them to believe that they could access the full text of the
document. The insistence of searchers to select this entry point from the ranked list, even when
it becomes evident that it does not provide them with access to the full text, can be attributed
to two reasons:
i) the information given by metadata was useful, or
ii) they expected at some point they may be given access to the full text by this action
In either case, there is a strong preference for searchers not choosing elements as entry points
to documents. However, there are still about 30% of cases where users selected elements as
85
Page 98
7 User preference for elements and their granularity
Available Viewed Assessed
article 1371 (-) 251 (18%) 189 (75%)
metadata 1371 (7%) 1007 (73%) 383 (38%)
sec 9372 (45%) 1960 (21%) 1455 (74%)
ss1 7910 (38%) 906 (11%) 644 (71%)
ss2 2376 (11%) 121 (5%) 81 (67%)
Sum 21029 (100%) 4245 (20%) 2752 (65%)
Table 7.3:Available, viewed and assessed elements in the full text view (includes entry points
from the hitlist)
first entry point to a document.
7.4 Granularity preference
In this section, the research question regarding searchers’ preferences for appropriate granu-
larity is investigated.
Table7.3 shows interaction data for the full-text view (see Figure6.9). Here more elements
per document were available because all elements (from the levels described) were shown in
the ToC: 15.3 on average (including one set of metadata per document). Percentages ofViewed
are in relation toAvailable, and percentages ofAssessedare in relation toViewed.
The difference between the actually viewed elements (including whole articles) in Table7.3
and the ones accessed from the hitlist is noticeable: of the 4245 viewed elements, only 1007
were metadata (24%) and almost all of these (987) were entry points clicked in the hitlist.
Note that, in contrast to the hitlist, whole articles were accessible in the full-text view; this
was requested in 251 of the 1371 documents accessed (18%). Overall, sections and elements
smaller than sections accounted for 2987 or 70% of all viewed items. On average, per 20
minute task only 6.6 documents were examined, but within these documents 14.4 sections and
smaller elements were inspected per task.
The total number of assessments (including Not relevant) is also given in Table7.3. As
searchers were not forced to assess all viewed elements, only 65% were explicitly assessed.
Overall, a notably smaller proportion of metadata (38%) were assessed compared to other
elements (and many of these as not relevant - see Figure7.1).
Figure7.1 shows the distribution of relevance judgements for different element types. The
different element types are ordered by their increasing size such as metadata, ss2, ss1, sec and
86
Page 99
7.5 Element size preference
Figure 7.1:Distribution of the relevance assessments for different element types
article. The chi-square test shows that there are very significant differences between relevant
and not relevant ones (strict and loose relevance interpretations are considered) for varying
granularities. There is a clear pattern in that the proportion of relevant elements is increasing
and the proportion of irrelevant ones is decreasing with increasing element size. Comparing
articles and metadata, more articles were assessed Relevant and more metadata were assessed
Not relevant.
On the whole, searchers tended to view and assess a relatively large number of sections and
subsections when browsing the full text, and a large proportion of these were assessed as
Relevant or Partially relevant; of the 2987 viewed representations of elements (sec, ss1, ss2)
51% were Relevant or Partially relevant.
The picture, where searcher preferred documents as their entry points, changes significantly
when searchers are presented with the full-text view. Elements are much more frequently
visited, and the proportion of relevant items is at the same level as that of full documents. This
suggests that searchers find full documents useful for their tasks, and they find a lot of relevant
information in specific elements rather than full documents. Sections, in particular, appear to
be the most useful document elements.
7.5 Element size preference
Now we investigate the preference of searchers for varying size of elements, where size is
considered either in an absolute way or relative to document size. This investigation is of
87
Page 100
7 User preference for elements and their granularity
importance, for two reasons. Firstly, element retrieval systems retrieve an element by only
considering the granularity marked by the tagging such as sections, paragraphs, documents
etc. Retrieval is performed without imposing any constraints on the size of elements. As a
consequence, sometimes very small elements are also retrieved, elements that are too short to
be indicative of relevant information. Secondly, searchers preference may guide us to define
the optimal size for marking up the elements.
This analysis gives us insight about the searchers’ preference for elements of varying sizes.
The size is measured as the number of words, both in absolute numbers and relative to the
document size (see figures7.2, 7.3).
Firstly element size is measured as the number of words contained in the element and now
we regard the distribution of relevance judgements for the different size intervals (figure7.2).
For example, let us consider the small element case. Elements consisting of 1-50 words are
marked around 98% not relevant, 2% partially relevant and only 1% as relevant. It is noticeable
how the proportion ofrelevantversusnot relevantchanges with increasing size. The ratio of
not relevantis constantly decreasing until around medium element size (400-500 words) and
remains constant. In contrast, the ratio of relevant elements is constantly increasing until
around element size of size 500-1000 words and remains stable afterwards.
Figure 7.2:Distribution of relevance judgements vs. element size in words
Next, we consider element size in relation to document size (figure7.4). The x-axis is showing
the relative size of element. It is computed as number of words in the element divided by the
number of words in the document. It is noticeable that the proportion of relevant is increas-
ing with the size of document. Elements comprising 10% to 40% of the document size are
88
Page 101
7.5 Element size preference
Figure 7.3:Frequency distribution of relevance judgements vs. element size in words
mostlyrelevant. In contrast, the proportion of irrelevant has peaks in intervals (0.0 - 0.03) and
afterwards it is continually decreasing. There are very few cases that fall in the interval 0.4 -
0.9 (see figure7.5) where the ratio of irrelevant is much larger than that of relevant ones. The
proportion of full articles (0.9 - 1.0) markedrelevantis similar to that of elements of 10% to
40% document size.
The chi-square test yielded that there are very significant differences between size (absolute
and relative) of relevant and not relevant elements. Here again strict and loose interpretations
of relevance are considered.
Comparing the figures7.4 and 7.2, there are similar patterns. For very small elements 1-
150 words and 0-0.1 relative document size, the proportion of irrelevant in comparison to
relevant ones is very high. For medium size elements having 150-250 words and 0.1 - 0.4
relative document size, there is an increase in the proportion of relevant elements. The peaks
of irrelevant ones are high again for medium size elements (250 - 400 words and 0.4 - 0.9
relative document size). Afterwards there is stability and the ratio of relevant ones is high.
Next, we compare figure7.1with figures7.4and7.2. One can notice that the patterns are also
similar in that for elements of very small granularity like metadata and subsubsection (ss2), the
proportion of irrelevant ones is higher than that of irrelevant ones. With increasing size, also
the proportion of relevant items is growing. However, the differences between small and large
items are highest for the two quantitative views, whereas the quality differences between ss2
and sections or full articles are smaller. Thus, element size seems to correlate much stronger
with relevance than element type.
89
Page 102
7 User preference for elements and their granularity
Figure 7.4:Distribution of relevance judgements vs. relative element size
Figure 7.5:Frequency distribution of relevance judgements vs. relative element size
7.6 Links with other research
The value of element retrieval for users was also studied in different set-
tings. [Pharo and Nordlie, 2005] participated in iTrack 2004 and investigated the value
of element retrieval. Their findings are not conclusive, but they indicate that giving
users access to the most relevant elements on lower levels of granularity is valuable, but
90
Page 103
7.7 Conclusion
only if the full article is present to provide context. [Hammer-Aebi et al., 2006] found
that users prefer elements of depth 2-4 rather than full documents and concluded that
element versus document retrieval is not so much a question of either-or, but rather of
both-and. [Ramırez and de Vries, 2006] found that for many tasks, searchers are happy with
small elements. [Pharo, 2008] showed that searchers prefer to use smaller sections of the
article as their source of information; however, to a large degree whole articles were judged as
more important than its sections and subsections.
7.7 Conclusion
The study presented in this chapter shows that searchers do find elements useful for their tasks
and they locate a lot of the relevant information in specific elements and in full documents.
Sections, in particular, appear to be most helpful. On the other hand, smaller elements—
independent of their type—are much less likely to be relevant.
91
Page 105
8 Element retrieval vs. passage retrieval
This chapter investigates the differences and similarities between element re-
trieval and passage retrieval systems. In addition, browsing behaviour of searchers
is also investigated.
8.1 Introduction
Passage retrieval is an earlier approach for identifying the relevant parts of documents rather
than retrieving documents as a whole [Salton et al., 1993]. There is one common aspect be-
tween element and passage retrieval: Both are aimed at providing a focused view of infor-
mation. Therefore it is worth investigating which approach provides a better view on XML
documents as recommended at the SIGIR 2006 Workshop on XML Element Retrieval Method-
ology [Trotman and Geva, 2006].
In chapter6 we found that in element retrieval systems, the ToC provides context and help
in browsing and navigating in the document while examining its detail. These experiments
were performed on the INEX IEEE collection. The specific nature of the scientific articles
could also assist searchers in extracting extra context from the logical structure of documents:
the idiosyncratic nature of scientific articles allows searchers to expect specific rhetorical roles
to be fulfilled in specific parts of a document (e. g. Introduction, Methodology, Conclusions,
etc.) [Tombros et al., 2005b]. As the Wikipedia corpus is different in a number of ways, we
have chosen to repeat some of the experiments studied in previous chapters. It is certainly
worthwhile to investigate whether similar observations hold when different document types
are used.
In addition to this we also want to investigate the relative importance of all the suggested entry
points, their highlighting and the role of query term highlighting. The best entry points can
be defined as document components from which the user can browse to obtain quick access to
relevant document components.
93
Page 106
8 Element retrieval vs. passage retrieval
8.2 Research questions
The following research questions are investigated in this chapter:
1. Which approach provides a better focused view of information: element retrieval or
passage retrieval? What are the similarities and differences between the two approaches?
2. Comparing the ToC derived from the structure of the document with the ToC based on
retrieved passages, which one supports the user in a better way?
3. The estimated relevance of elements from the same document may vary to a large extent.
Is it meaningful to show this difference?
4. Is keyword highlighting useful? Which form of result presentation is useful?
8.3 Related Work
[Kazai, 2007] investigated search and navigation in structured documents by comparing the
user behaviour in element and passage retrieval. She concluded that element retrieval led to
increased task performance with more document components found and judged relevant.
[Kazai and Trotman, 2007] studied the users’ perspective on the usefulness of structure for
XML retrieval. They found that XML retrieval users are unlike web users as they use advanced
search facilities, they prefer a list of results supplemented with branch points into the document
and they need better methods for navigation.
8.4 User interfaces
The experimental system is a Java-based front end built within the DAFFODIL framework and
its interface is similar to the one described in chapter6. Two system versions were tested: one
a passage retrieval backend and one is an element retrieval backend. The passage retrieval sys-
tem was PanopticTM/FunnelbackTM1 provided by CSIRO. The element retrieval system was
TopX [Theobald et al., 2005] provided by Max-Planck institute. Both versions have similar
search interfaces - the main difference between them lies in the backend retrieval approaches
and returned results.
In the passage retrieval system, non-overlapping elements (such as tables, paragraphs, lists,
templates, etc.) were indexed without using any sliding window method. Ranking is based on
1http://www.csiro.au/science/Panoptic.html (Last date accessed on January 6, 2009)
94
Page 107
8.4 User interfaces
Figure 8.1:TopX-based Element retrieval result list: Relevant-in-context showing high-
scoring elements grouped by document; query term highlighting; task and related
terms displayed
Figure 8.2:Element retrieval detail/full text view: ToC for navigation, query term highlight-
ing, display of a section; icons for viewed elements and relevance assessments;
background highlighting of currently viewed element
95
Page 108
8 Element retrieval vs. passage retrieval
Figure 8.3:Panoptoic based passage retrieval result list: Relevant-in-context showing high-
scoring passages with automatic summarization grouped by document; query term
highlighting; task and related terms displayed
Figure 8.4:Passage retrieval based detail/full text view: ToC for navigation and its headings
are based on automatic summarization, query term highlighting, display of a sec-
tion; icons for viewed elements and relevance assessments; background highlight-
ing of currently viewed element
96
Page 109
8.4 User interfaces
Panoptic’s default algorithms which incorporate anchor text evidence. The results are returned
using the thorough strategy (see section4.1.2).
The element retrieval search engine TopX is a top-k engine for XML that stops query process-
ing as soon as it can safely determine the k top-ranked result elements or documents according
to their aggregated scores with respect to all query conditions (i. e. content and structure).
The content scores are based on an extended BM25 model for XML. The results are returned
using the Fetch&Browse strategy, the top-scored target element inside a document determines
the document score. All the remaining elements per document are ranked accordingly.
In both versions, the passages/elements are grouped by document in the result list and up to
three highly ranking passages/elements are shown per document (see figures8.1, 8.3). In the
result list, selected parts are listed under each document and small icons indicate the degree of
potential usefulness.
In element retrieval, each element is a potential retrieval unit; however, with regard to varying
length of elements, we decided to retrieve only sections and subsections of the documents.
Since all the sections/subsections have captions, these are used to be presented as the text of
suggested document entry points.
In the case of passage retrieval, retrieved units can be arbitrary parts of documents; thus in
some cases no information is available that can be presented to the user as possible repre-
sentative of the unit. Therefore a sentence-oriented approach based on query-based automatic
summarization is applied to determine a representative sentence. Figure8.3shows an example
result list.
In both versions of the result list, selected parts are listed under each document and small
icons indicate the degree of potential usefulness. The same icons are used in the overview
of the document when viewing the full text (see figures8.2, 8.4). Finally, these parts are
highlighted in the text of the documents, where a green background indicates a stronger belief
in the usefulness than a yellow one. In addition to this, the element version shows a table of
contents drawn from the XML formatting. Therefore it visualises the logical structure of the
document and suggested entries have coloured icons while other document entries have white
icons.
In the passage retrieval system an overview of the retrieved passages is presented in the form
of a table of contents. The Searcher can switch between the retrieved passages by following
those links. However, this neither shows the logical structure of the document nor does it
indicate the order of the retrieved passages in the document.
Other parts of the document can easily be viewed by clicking at a different part in the overview.
Any part of the document which has already been viewed is indicated with a small eye icon.
97
Page 110
8 Element retrieval vs. passage retrieval
8.5 Experimental Settings
In the INEX 2006 interactive track, 90 searchers from various participating institutions were
asked to find information for addressing information seeking tasks by using two interactive
retrieval systems: one based on the passage retrieval backend and one on the element retrieval
backend.
Twelve search tasks of three different types (Decision making, Fact finding and Information
gathering), further split into two structural kinds (Hierarchical and Parallel), were used in the
track. The tasks were split into different categories allowing the searchers a choice between at
least two tasks in each category, and at the same time ensuring that each searcher will perform
at least one of each type and structure.
Searchers were asked to select an assessment score for each viewed piece of information that
reflected the usefulness of the seen information in solving the task. Five different scores were
available, expressing two aspects, or dimensions, in relation to solving the task: How much
relevant information does the part of the document contain, and how much context is needed
to understand the element?
The statistics given below are based on the pre experiment questionnaire listed in appendixC.1.
A total of 90 searchers were employed by participating sites. The average age of the searchers
was 27 years.
Their average overall searching experience was 9 years and experience in digital libraries
of scholarly articles (e. g. ACM Digital Library) was 3, in web search engines was 5 and
frequency of Wikipedia use was 3 on a scale from 1(never) to 5 (multiple times per day).
The education level of the participants spanned diploma holders (6%), undergraduate (25%),
graduate (29%), MSc (18%), and PhD (9%) levels.
Table 8.1:Overall opinion about the two systems system on the scale of 1 (Not at all) to 5
(Extremely)
System Features Element Passage
µ σ2 µ σ2
How would you rate this experience? 3.0 1.3 3.0 1.4
How easy was it to learn to use the system? 3.5 0.84 3.4 0.88
How easy was it to use the system? 3.5 0.7 3.6 0.9
98
Page 111
8.6 Findings
Task type Topic id Satisfaction Confidence
element passage element passage
Decision Making
1 2.67 2.50 2.83 2.50
2 3.10 3.60 3.10 3.40
3 3.48 3.39 3.59 3.44
4 2.50 3.00 3.50 3.50
µ 2.94 3.12 3.26 3.21
Fact finding
5 3.37 2.95 3.21 3.00
6 4.07 3.79 3.93 4.00
7 2.31 3.86 2.46 3.71
8 2.69 2.95 2.77 3.22
µ 3.11 3.39 3.09 3.48
Information gathering
9 2.83 2.43 2.83 2.71
10 3.15 2.71 3.15 2.35
11 2.55 2.73 2.27 3.00
12 4.29 4.00 4.29 3.50
µ 3.21 2.97 3.14 2.89
All overall 3.08 3.16 3.16 3.20
Table 8.2:Participants’ feedback for element and passage retrieval systems in response to
questions: How satisfied are you with the information you found? and How cer-
tain are you that you completed the task correctly?
8.6 Findings
8.6.1 Element vs Passage
The overall opinion of the participants about the two systems were recorded in the final ques-
tionnaire after the completion of four tasks. Searchers were asked to rate the different features
of the system and their experience on a scale of 1 (Not at all useful) to 5 (Extremely useful).
Questionnaires are included in appendixC.2.
The results are summarised in Table8.1. The table shows that searchers rated their searching
experience with element retrieval higher than that with passage retrieval. For the ease of use
and ease of learning, the votes were on the positive side, with no big differences between two
99
Page 112
8 Element retrieval vs. passage retrieval
systems. The t-test indicated that there are no significant differences between opinions about
the two systems.
The taskwise breakdown of task completion certainty and satisfaction is presented in table8.2.
Thus, users had no preference for a system that performed better in most of the tasks. The
paired t-test showed that there are no significant task type wise differences between the two
systems.
The average ratings show that both task completion satisfaction and task completion certainty
are slightly higher for the passage retrieval system. For the two task types, Decision making
and Fact finding, the overall pattern persists. Only for the Information gathering task type,
users favoured the element retrieval system.
The analysis of search sessions for the two systems is presented in table8.3. The first col-
umn task indicates three task types: Decision Making (DM), Fact Finding (FF) and Informa-
tion Gathering (IG). The second columntopic-ID indicates the topic-id, third columnvisiting
time[s] indicates average visiting time in seconds for the two systems: element retrieval (E)
and passage retrieval (P). The fourth columnvisited resultsis for the average document com-
ponents and passages browsed by the searchers, the fifth columnassessed resultsshows the
percentage of browsed results whose relevance had been given and the last columnusersgives
the number of users who worked on each tasks. The paired t-test is used to test the difference
between two systems. Differences significant at 95% are marked with a * and at 99% with **.
The visit time refers to the document/element visit time and is computed as the difference
between two browsing requests in a sequence. In absence of subsequent browsing requests,
difference is calculated between the browsing request and the next issuance of query. If there
are no more interactions in that session, the difference between the browsing event and the
logout event is considered. The comparison of the average visit time revealed that on average
searchers spent about the same time with both systems. Regarding the different task categories,
however, it turns out that only for decision making, passage retrieval is faster, whereas for fact
finding and information gathering, element retrieval needs less time.
The average number of elements/passages visited shows that more units are visited in element
retrieval (12.64 in comparison to 9.59). The same pattern can be seen for all the task types.
The overall percentage of the article elements for which a relevance assessment is given higher
in the passage retrieval system (74.48% in comparison to 70.12%).
The analysis of the results revealed that there is no clear preference for one system. The
difference between the two system in terms of average visiting time, average number of ele-
ments/passages visited and the relevance assessment percentage is small. So it seems that the
two systems are too similar to result in any substantial differences in user behaviour.
100
Page 113
8.6 Findings
Task Topic Visiting time Visited results Assessed results Users
E P E P E P E P
DM
1 537.67 391 14.17 11.67 81.82% 38.71% 6 3
2 516.40 460.07 18.20 8.33 80.37% 73.02% 10 15
3 458.67 394.95 10.56 9.95 76.92% 80.82% 27 19
4 369.00 443.00 16.25 10.50 44.44% 95.00% 4 2
µ 470.43 422.25 14.79 10.11 70.89% 71.89%
FF
5 433.42 449.14 9.21 10.32 75.71% 85.53% 19 22
6 422.27 446.79 10.13 7.93 73.33% 66.67% 15 14
7 413.77 429.86 8.46 6.43 78.12% 72.41% 13 7
8 432.88 457.65 9.58 9.50 68.10% 73.91% 26 20
µ 425.585 445.86** 9.34 8.54 73.82% 74.63%
IG
9 379.42 418.14 14.08 7.57 73.57% 61.36% 12 14
10 489.15 543.65 11.3 10.76 66.96% 82.37% 20 17
11 540.92 551.55 13.42 10.73 62.86% 80.00% 12 11
12 393.29 432.40 16.29 11.40 59.27% 83.93% 7 10
µ 450.69 486.43* 13.77* 10.12 65.67% 76.92%
All µ 448.91 451.52 12.64 9.59 70.12% 74.48%
Table 8.3:Analysis of search sessions for the two search systems
8.6.2 Contextual ToC vs. ToC based on retrieved passage
The table of contents in the element retrieval system is contextual and presents the overall
logical structure of the document. In contrast, in the passage retrieval system, the table is
presented in the form of a list of all the retrieved passages. Thus, there is the question how
searchers judged about these features and if this difference affected their behaviour. For this
purpose, the after task questionnaire contained the following two questions:
• How useful was the table of contents feature in assisting you with the task?
• What features of the interface were the most and least useful for this search task?
The question was asked on the likert scale from 0 to 5 where 0 implied didn’t use the specific
feature 1-2 implied not at all, 3 implied somewhat and 4-5 implied extremely useful. The
101
Page 114
8 Element retrieval vs. passage retrieval
results illustrated in figure8.5 show that there was a clear user preference for the element-
based ToC.
Figure 8.5:Usefulness of ToC
The analysis of the answers to the open-ended question revealed that table of contents is one
of the feature that is frequently commented on positively. There is only one negative com-
ment:“Least useful: Table of contents”, without mentioning any reason.
Only one participant could notice the difference between the two types of tables and com-
mented in the following way“Seeing only parts of the TOC needs getting used to it, I prefer
all TOC shown.”
Next we investigate how often searchers visited and assessed the retrieved document parts in
the two systems.
Granularity Element Passage
Available Visited Assessed Available Visited Assessed
Entry Others Entry Others
article 821(29%) 617(75%) 123(15%) 66% 640(32%) 503(79%) 108(17%) 69%
section 1526(54%) 163(11%) 353(23%) 68% 623(31%) 61(10%) 206(33%) 68%
subsection 485(17%) 48(10%) 61(13%) 71% 230(11%) 21(9%) 105(46%) 67%
paragraph - - - - 259(13%) 34(13%) 90(35%) 72%
table - - - - 259(13%) 1(1%) 4(2%) 100%
total 2832(100%) 2011(100%)
Table 8.4:Suggestions available at the table of contents in element and passage retrieval sys-
tems and searchers’ selections
The corresponding analysis of transaction logs is presented in table8.4. For both the element
and the passage retrieval systems, the table shows the proportion of retrieved items of different
102
Page 115
8.6 Findings
granularities such as articles, section, subsections, paragraphs and tables. We are considering
as available only those result items which were browsed further by searchers. The second
columnvisited shows the percentage of suggestions, in relation to available, that are taken
by searcher atentry point level andother indicates while browsing the document. Column
Assessedindicates the percentage of visited element whose relevance is also given. As an
example, consider the first row of table8.4. Articles represent 29% of the retrieved items
in element retrieval system. In 75% of these cases, they were chosen as entry points to a
document. Whereas in 15% of all cases they were browsed later at some point. In 10% of
the cases, they were not browsed. Regarding all visited articles, 66% of them were assessed.
Comparying these figures with those of the passage retrieval systems, we see that we get rather
similar results.
For sections we got substantial differences: They form 54% of the result items in element
retrieval and 31% in passage retrieval. These entry points to documents are chosen in around
10% in both systems. In absolute numbers, sections are browsed more frequently in element
retrieval than in passage retrieval i. e. 353 vs. 206 but percentage of visited is higher in the
latter case. It should be noted that searchers could browse any other document parts even if
they are not available as suggestions in the element retrieval system.
The result items at subsection level form 17% of all entries in element retrieval system and
11% in passage retrieval. These suggestions are chosen as entry points only in 9%/10% when
they occured in the result list. A major difference is encountered in browsing. In passage
retrieval 46% of the available subsections are visited but only 13% in the element retrieval
case.
The other granularities such as paragraph and tables are only available in passage retrieval.
The visiting and browsing behaviour is similar to that at the section and subsection level.
We can conclude that the table of contents was an important feature of the system, irrespective
of the fact whether it shows the complete logical structure or only the retrieved entries in the
document as a list. Searcher used it to browse and navigate within the documents. There was
only one searcher who could notice the difference between the two types of table of contents.
However all these figures should be taken with a grain of salt: the documents in the Wikipedia
are sometimes very short. Therefore perhaps it makes little difference if table of contents is
available or not as one can often see the complete document in one view.
8.6.3 Relative importance of document parts and paragraph highlighting
Both the element and passage retrieval system attempt to indicate the parts of the documents
that may be useful for the searcher. For each result list item, the system gives a degree of
relevance ranging from 0 to 1. For presentation purposes, the degree of relevance is divided
103
Page 116
8 Element retrieval vs. passage retrieval
into four intervals of equal size and each interval is mapped to one colour. The colours assigned
to the intervals are light yellow, yellow, light green and green.
The degree of relevance is indicated with the icons in the document table of contents. These
icons are divided into two parts showing the colour as mentioned above in the upper part and
and one to four orangish squares (for the four degree intervals) in the bottom part (see figures
8.1, 8.2, 8.3and 8.4).
For analysing this issue, the post-search questionnaires contained the following questions:
• How useful was the paragraph highlighting feature in assisting you with the task?
• What features of the interface were the most and least useful for this search task?
The question was answered on a likert scale from 0 to 5 where 0 implied didn’t use the specific
feature, 1-2 implied not at all, 3 implied somewhat and 4-5 implied extremely useful. Around
40% considered it as an extremely useful feature while 30% regarded it as somewhat useful,
28% voted 1 or 2 and 8% didn’t notice this feature.
Searchers commented only rarely on this feature; there are a few who commented negatively
on this feature, like e. g. “The paragraph highlighting did not do much for me. I prefer to
search the article myself and in this way find the relevant information.” or “ The paragraph
highlighting is useless as the highlighted passages are not the relevant passages. Often, only
the external links section is highlighted. The interesting passages are not highlighted at all”.
We can conclude that paragraph highlighting for distinguishing between potentially relevant
and irrelevant document parts is useful for most, but not for all participants. Therefore one
should allow for switching this feature on/off.
Usefulness of resultlist presentation
The resultlist presentation in the element retrieval system uses the captions of document, sec-
tion and subsections, whereas the passages retrieval uses a sentence-based query summariza-
tion approach whenever needed. In order to investigate which strategy is preferred by the
searchers, we analysed questionnaire data and the interaction logs.
After performing each of the tasks, the following two questions are posed about the result list
• To what extent did you find the presentation format (interface) useful?
• What features of the interface were the most and least useful for this search task?
The question was answered on a likert scale from 0 to 5 where 0 implied didn’t use the specific
feature 1-2 implied not at all, 3 implied somewhat and 4-5 implied extremely useful. The
analysis shows a slight preference for the passage retrieval system (see figure8.6).
104
Page 117
8.6 Findings
Figure 8.6:Usefulness of Resultlist
Now we want to analyse the searcher’s interaction in the two systems to see whether the length
of the surrogate influenced the searcher in viewing document details. The average length of the
document/element surrogate in the passage retrieval system is 34 characters while the average
length in the element retrieval is 18 characters. Comparing the lengths of relevant vs. irrelevant
items, we get 38 vs. 30 for passages and 18 vs. 17 for elements so the surrogates for passages
are not only longer than that of elements, there also is a length difference between relevant and
irrelevant passages.
The analysis of the open-ended questions about the usefulness of result list presentation re-
vealed that searchers found the entry point capability useful which allowed them to jump into
the specific part of the document
We can conclude that captions are equally useful in both types of systems, they convey the
information to determine the relevancy represented result item.
Query term highlighting
Query term highlighting has been identified as an important feature during the information
seeking process [Tombros et al., 2005b], since it makes it easier to locate the interesting infor-
mation. For validating this statement, the following two questions were asked:
• How useful was query term highlighting feature in assisting you with the task?
• What features of the interface were the most and least useful for this search task?
The question was answered on a likert scale from 0 to 5 where 0 implied didn’t use the specific
feature 1-2 implied not at all, 3 implied somewhat and 4-5 implied extremely useful. Around
125 users considered it as an extremely useful feature, 105 searchers found it somewhat im-
portant feature; only 64 users voted 1 or 2 and 42 searchers didn’t notice.
105
Page 118
8 Element retrieval vs. passage retrieval
The content analysis of the open ended question showed that most of the searcher’s com-
mented positively on the usefulness of query term highlighting. There were few searchers who
suggested that other functions could be more useful than query term highlighting, like the pos-
sibility to highlight terms other than the query terms: “highlighting the query in the docs was
of no use here (though being able to highlightother terms would have been).”
The other potentially useful function pointed out was the availability of search functions while
examining the details of the fulltext: “No search within documents; Searching tools are re-
quired; lacking feature: no search function to search for terms within long paragraph”
8.7 Expectations
There is a number of other interface features that were commented on for various reasons.
These include cases where the working of the particular function is in contrast to searchers’
intuition, a searcher found some feature obstacle in performing the task, or the searcher found
some feature lacking.
Missing featuresWhile inspecting the document details, the lengths of the documents vary.
For the longer document, some searcher identified the need of having more search functions
and found this feature lacking. One searcher identified the need for a copy function. Another
searcher missed the possibility to open more than one document at a time.
Automatic updation of ToC One user expected that when scrolling is performed, the table of
contents view of the document should depict the present position of the searcher somehow.
Paragraph assessmentOne searcher missed the possibility to rate the paragraphs that are not
part of the table of contents.I would have liked to select and rate such paragraphs (reached
by browsing) as well.
Visibility One searcher wanted to view the result list and task description while viewing the
document.
Annotations One searcher wanted to take notes while working on a task to collect and
compile the information.
Advance searchingThe searchers found it easier to work on the general task, when they tried
to do deep searching or more directed searches the system kept on giving the same kind of
information. This frustrated searchers. In words of one searcherI think that the programs
overall were okay just need a little more work in some areas. It gets frustrating trying to
narrow down what your looking for.
106
Page 119
8.8 Visualising searchers interaction
8.8 Visualising searchers interaction
In order to analyse the searchers’ interaction log along with questionnaires, a visualisation tool
was developed. The extensive application of this tool is an issue of further research. Here, we
use it to identify browsing strategies from the search logs. First, we introduce the tool and then
present identified browsing strategies and demonstrate its application for analysing the set of
searches carried out for task 4.
Figure 8.7:A sketch of visualisation
The approach of the search log visualisation is partially based on the TreeMaps visualisa-
tion [Johnson and Shneiderman, 1991]. A large number of queries were issued while working
on tasks. Since many of these queries are not identical but similar, they are transformed to a
set of distinct queries after three steps; 1) lower case conversion, 2) stopword removal and 3)
ordering of query terms. As a result many queries issued by different searchers are mapped
onto one representation. A composite view of all the searcher’s interaction with the result list
of this query representations is shown in the form of a row of bars. Each visited result list
article is presented by one bar. A bar is further sub-divided in order to show different sections
and subsections of the article and their structural relationship. Each part of the bar is assigned
a shade of grey colour. This refers to how long this element is visited, the darker the shade,
the longer the visiting time is. In case some element is not part of the result list but is visited
by searcher, this is indicated by a red border. At the top of each bar all the possible actions
are listed in the form of small boxes, each with a different colour. Example of these actions
are relevance assessment, text highlighting etc. Clicking on an article shows each searcher’s
individual interaction with the article in a similar way as the composite view (for details see
[Beckers, 2008]).
107
Page 120
8 Element retrieval vs. passage retrieval
8.8.1 Browsing behaviour
The search logs were analysed to identify prototypical browsing strategies. The identified
strategies are named as“top-down within article“, “single element visit article”, “top-down
results list”, “top-down both”, “Bottom-Up Results List ”’, and“Random”.
➤ TOP-DOWN WITHIN ARTICLE
The user visited an article in such a way that all of its elements
from top to bottom are visited. As an example, consider user
ouc005 in the results list[french, impressionism]) of the
task sto2. The article with id15169 (right) is visited in this
way.
➤ SINGLE ELEMENT VISIT ARTICLE
In this case, only one article element is visited. An example is
the behaviour of useragj003 in the results list[cathedral,
Chartres] of the tasksto3. Only the second section of the
article is visited. This action can be found quite often.
108
Page 121
8.8 Visualising searchers interaction
➤ TOP-DOWN RESULTLIST
Occasionally parts of result lists are browsed in top-down order. For example, user
ouc009 in the resultlist[additives, food] of Tasksto10 visited four articles one after
the other in descending rank order.
➤ TOP-DOWN BOTH
This strategy is a combination of the previous two“Top-Down” strategies . In this case
articles and elements within articles are browsed in top-down order. The userouc005 in
result list[energy, heating, panel, solar] of Tasksto11 is one of the examples.
➤ BOTTOM-UP RESULT LISTS
109
Page 122
8 Element retrieval vs. passage retrieval
Occasionally, the result list is visited
“bottom-up“. At first an article from
the lower ranks is visited. Consider user
uamsterdam004 as an example, when s/he
was browsing result list[car, engine]
of tasksto9
➤ RANDOM
Very frequently no specific browsing pattern of users could be recognised. The result lists
and articles were visited randomly.
110
Page 123
8.9 Links with other research
➤ HIERARCHICAL
Hierarchical browsing means that a searcher browses the result list in such a way that
each document and its entry points are examined to determine their relevancy. This strat-
egy can not be identified from the logs since this data is not sufficient for identifying
this strategy. One would need to use eye tracking in order to record the searcher’s way
of viewing the result list and the documents. This browsing strategy is the basis of the
EPRUM [Piwowarski, 2006] metric: The probability that a user browses from a consid-
ered element to any neighbour element. That is, a user, when considering an element, will
most probably look around to its close context (i. e. in an XML documents this would be
the previous siblings, next siblings, ancestors, etc.).
Browsing behaviour of an example task Geography
As an example application of the visualisation tool, we analysed the browsing behaviour for
task 4. Six searchers worked on this task. Their browsing strategies are given in table8.8.1.
Most frequently theTop-Down bothstrategy is used to view result list and documents. Other
strategies applied includeSingle element visit articleandTop-Down within article.
8.9 Links with other research
There has been little work in relation to the topic regarded in this chapter. [Kazai, 2007]
showed the preference for element retrieval. [Kazai and Trotman, 2007] found that searchers
prefer a list of results supplemented with branch points into the document and identified the
need for better methods of navigation. [Larsen et al., 2008] analysed the assessments given in
two systems, in the same settings, and reported no great differences between them.
8.10 Conclusion
This chapter investigated the similarities and differences between the element and the passage
retrieval system. The analysis suggests that element retrieval is preferred by searchers but
rather differences are small.
The importance of the contextual table of contents in comparison to passage retrieval system is
investigated. The results showed that searchers liked the ability to directly jump to any docu-
ment element and there is little preference for the contextual table of contents. One noteworthy
point is that only one searcher was able to identify the difference between the two systems.
111
Page 124
8 Element retrieval vs. passage retrieval
user query strategy
unidu003
[logging] Top-Down both
[coal, mining] Top-Down both
[logging, timber] Top-Down both, Single element visit article
[impact, mining] Single element visit article
[mining, national, park] Single element visit article
ukyung013
[mining] Top-Down both
[economic, mining] Top-Down both
[coal, mining, village] Top-Down within article
[coal, company, mining] Top-Down within article
cityuni001[environmental, logging, min-
ing]Top-Down both
dbdk026
[consequences, ecology, effect,
impact, mine, mining, nature]Top-Down both
[consequences, ecology, effect,
impact, logging, nature, remov-
ing, trees]
Top-Down both
dbdk030[logging, trees] Top-Down both
[ecological, logging, trees] Top-Down both
ouc021
[damage, forest, mining] Top-Down within article
[coal, damage, deforestation,
mining]Top-Down within article
[damage, deforestation, logging]Top-Down both
Table 8.12:Browsing strategies for task 4
The role of more than one entry point is also investigated. Suggestions are often followed
by searchers. The paragraph highlighting depending on degree of relevance is taken as a
somewhat useful feature.
The role of the keyword highlighting is considered as one of the useful features. The need of
searching capability within the long and short documents is identified as an important feature.
The result list presentation, caption and sentence based, both are found useful. There was little
preference for the sentence based result list.
112
Page 125
9 Interaction patterns and interest
indicators
This chapter is about the analysis performed on the searchers interaction logs to
find out the user interest indicators. These investigated indicators include time
spent on a page, clicks to navigate within the document, query and result presen-
tation overlap, highlighting piece of information with mouse, following a link to
another document. Descriptive statistical methods are used to perform the anal-
ysis. Classification of these indicators is also performed using data mining tech-
niques.
9.1 Relevance feedback
Relevance feedback is a very effective retrieval technique and its main goal is to generate a
query that is as close as possible to the searcher’s information need.
From the searcher’s perspective (in the explicit relevance feedback scenario), a searcher enters
the query, scans the results, marks the relevant/irrelevant items and asks for a reformulated
query. On the basis of this information, a new result is presented to the searcher.
The system matches the searcher’s query with the indexed information using one of the re-
trieval approaches such as Vector space model, probabilistic model, language models, etc.,
and presents the results to the user. As a by product, a space of terms or concepts is built
up. Each term is assigned a weight according to its importance. When a searcher marks
the relevant/irrelevant items, the weights of the terms are recalculated depending upon their
distribution in relevant/irrelevant documents. The actual weighting formula depends on the
underlying retrieval.
The most common and obvious method for applying relevance feedback is to ask for the
explicit rating of the retrieved items, where users tell the system what they think about
some object or piece of information. However, forcing the user to decide about the rel-
evance can alter the normal pattern of reading and browsing [Claypool et al., 1999]. If
users perceive that there is no benefit from providing the ratings, they may stop providing
113
Page 126
9 Interaction patterns and interest indicators
them [Goecks and Shavlik, 2000]. Hence the user continues to read the information and pro-
vides no relevance at all. With the GroupLens system [Konstan et al., 1997], it was found
that users were reading much more information than they were rating. There might be a
significant difference between a user’s real interest level and the user’s explicit rating since
users sometimes have difficulties expressing their interest explicitly on a single numeric
scale [Morita and Shinoda, 1994].
Hence, explicit ratings may not be as reliable and especially not as complete as is often pre-
sumed. Systems can rely on other sources for getting the relevant/irrelevant information. The
possible alternative is to obtain the rating unobtrusively by examining the searchers’ interac-
tion with the system and estimating the level of interest based on this data. Though these
estimates are not as accurate as the explicit rating, the underlying data can be captured for
free, and the combination with the explicit ratings can help in finding out the implicit in-
terest indicators. The need for methods that can estimate the interests has been identified
by [Konstan et al., 1997] and [Kelly and Teevan, 2003].
We believe an ideal solution is to improve the user interface to acquire implicit ratings by
watching user behaviour. Implicit ratings include measures of interest such as whether the
user reads an article and, if so, how much time the user spent reading it[Konstan et al., 1997].
More tools that allow for the accurate and reliable collection of data, such as the browser
developed by Claypool, et al. need to be developed, tested and shared, and further research
should be done into how the collection process can encourage implicit feedback to closely
match the user’s underlying intent[Kelly and Teevan, 2003].
Another possible way to obtain explicit accounts of why information was assessed at a cer-
tain relevance level is through the use of more sophisticated equipment and experimental
techniques. For example, it is possible to use eye tracking equipment to monitor the users’
eye movements while reading the contents. By analysing fixation periods and saccades, it is
possible to make inferences about the users’ perception of importance of the various infor-
mation. [Granka et al., 2004] investigated how users interact with the result page of a WWW
search engine using eye-tracking.
There are a number of behaviours that have been described in the literature as potential rele-
vance feedback indicators, as was shown in figure2.3.2. The relevance can be inferred from
these observable behaviours to perform implicit relevance feedback retrieval. These tech-
niques obtain the implicit relevance information by watching the users’ natural interaction
with the system. Such measures are generally thought to be less accurate than explicit mea-
sures [Nichols, 1998], but as large quantities of implicit data can be gathered at no extra cost
for the user, they are an attractive alternative.
Behaviours such as time spent reading [Morita and Shinoda, 1994, Konstan et al., 1997],
mouse activity [Goecks and Shavlik, 2000, Hijikata, 2004], scrolling behaviour
114
Page 127
9.2 Research questions
[Claypool et al., 2001]), items bookmarked [Seo and Zhang, 2000] and interactions with
a document [Kim et al., 2001] have been examined as implicit measures of user interest.
These behaviours can be used to indicate interest for a variety of systems such as recommender
systems, information filtering systems etc.
Reading time has been found to be a good indicator of interest for news reading
[Konstan et al., 1997, Morita and Shinoda, 1994] and web browsing [Claypool et al., 2001,
Seo and Zhang, 2000], but contradictory results have been found for IR tasks
[Kelly and Belkin, 2001, White et al., 2002].
We are considering different functional and cognitive evidences by taking into account various
choices made and actions performed by the searchers. These include searcher interaction with
document such as mouse movements in the document, e.g. highlighting the text and following
the mouse pointer while reading etc., navigating and browsing patterns within the document,
spending more time. The selection of result list items to view the details could be due to
overlap with the query terms. This overlap can also be considered as a possible evidence.
To gain an understanding of how searchers interact with the relevant piece of information in a
particular environment, we need to analyse their interaction and find patterns that can indicate
relevance. Therefore we analysed the following indicators:
1. The query and result presentation overlap
2. The number of clicks within a document
3. The time spent on an element
4. The text highlighting
5. The link following
9.2 Research questions
The following research questions are investigated in this chapter:
• The detail view of a document presents its table of contents and details of the presently
selected element from the table of contents. Searchers can navigate and browse other
document elements by clicking on any item of the table. Do searchers click more often
on relevant items?
• In case the surrogates of result list items or the table of contents in the detail view contain
any of the query terms, is this overlap an indicator of interest?
115
Page 128
9 Interaction patterns and interest indicators
• Is time spent on reading a part of a document an indicator of interest?
• Searcher can habitually highlight some text while reading it. Does highlighting show
interest of the searcher?
• A document may contain hyperlinks that take the searcher to other documents. Is the
document accessed by following the hyperlink likely to be relevant?
9.3 Experiments
The experiments were performed in iTrack 2005 and iTrack 2006-2007. Their experimental
setup is described in detail in chapter4.
An important aspect of the study was to collect the searcher’s assessments of the relevance of
the information presented by the system.
The scale used in iTrack 2005, was a simple 3-point scale measuring the usefulness (or perti-
nence) of the element in relation to the test person’s perception of the task:
• Not Relevant
• Partially Relevant
• Relevant
In iTrack 2006, there was a change in the relevance scale used based on the empirical work
[Pehcevski et al., 2005]. Their empirical analysis of the two INEX 2004 and 2005 relevance
definitions revealed that a much simpler relevance definition would have been a preferable
choice. They presented one such relevance definition, which is founded on results obtained
from interactive XML retrieval experiments, and which uses a five-graded nominal scale to
assess the relevance of an XML element. They demonstrated that the newly proposed relevance
scale was successfully used for the purposes of Task C in the Interactive track at INEX 2005,
where users did not find it hard to use. By analysing results from the topics judged by both the
assessors at INEX 2005 and the users participating in the INEX 2005 Interactive track, they
could also empirically establish a mapping between the new relevance scale and the continuous
specificity scale used at INEX 2005.
Searchers were asked to select an assessment score for each viewed piece of information that
reflected the usefulness of the seen information in solving the task. Five different scores were
available, expressing two aspects, or dimensions, in relation to solving the task: How much
relevant information does the part of the document contain, and how much context is needed
to understand the element? This was combined into five scores as follows:
116
Page 129
9.3 Experiments
NG NR PR FR
iTrack 2005: Distribution of relevance judgements
relevance scale
prop
ortio
n of
rel
evan
ce
05
1015
2025
3035
NG NR TN TB PR FR
iTrack 2006−07: Distribution of relevance judgements
relevance scale
prop
ortio
n of
rel
evan
ce
05
1015
2025
30Figure 9.1:The breakdown of given relevance
• Not relevant (NR) The element does not contain any information that is useful in solv-
ing the task
• Relevant, but too broad (TB) The element contains relevant information, but also a
substantial amount of other information
• Relevant, but too narrow (TN) The element contains relevant information, but needs
more context to be understood
• Partial answer (PA)The element has enough context to be understandable, but contains
only partially relevant information
• Fully Relevant answer (FR). The element contains highly relevant information, and is
just right in size to be understandable.
In the interactive track, the intention is that each viewed element should be assessed with
regard to its relevance to the topic. This was, however, not enforced by the system as it may be
regarded as being too intrusive for the searchers [Larsen et al., 2005]. The distribution of the
relevance values given is depicted in figure9.3; here NG indicates that the element is visited
by the searcher without giving relevance, which happened quite frequently in both tracks.
117
Page 130
9 Interaction patterns and interest indicators
9.4 Capturing Data
The system captures the events in the session, including input from the searchers and the
system’s response. Some details are given below:
• For each session Session ID, Login time, Logout time, Test Person ID, Simulated Task
ID, Rotation and System (passage based, wikipedia based).
• For each event, Begin and End Time stamps for every action, Session ID and Event type
as stated below.
• Types of events logged are
- Submitted queries (query type (e.g. free-text, use of fields, title etc); Exact query
terms as input by the test person)
- Query results (number of retrieved elements/documents; rank/RSV; DocID/ele-
mentID for all retrieved documents)
- Any viewed hits and how the user got there (DocID/elementID; Directly from
hitlist/From browsing)
- Any use of interface functionalities (e.g. Show only docs, Show docs and entry
points, Sort results etc.)
- Any browsing within documents (elementID; where the user came from)
- Relevance assessments (docID/elementID; assessment)
� �<?xml version=”1.0” encoding=” iso−8859−1”?>
<inex−itrack06>
<sessionsessionid=”11f.784eb401:110ca7e5251:−7ee2@UA”
userid=”agj001” timestamp=”2007/03/01 23:57:29:569” />
<events>
...
<event>
<eventid>
1d.601c30fd:1110fbaf23c:−[email protected] :5678
</eventid>
<timestamp>2007/03/01 23:57:51:152</timestamp>
<eventtype> resultlist</eventtype>
< article title =” Versailles ” file =”32703” rank=”1”
118
Page 131
9.4 Capturing Data
query=”Free−Text=versailles” xpath=” article”
rsv=”0.5231039017754349”>
<sec title =”A seat of power” file =”32703” rank=”1”
query=”Free−Text=versailles” xpath=” / article /body/ section”
rsv=”0.46265678955651596” />
<sec title =”Geography” file=”32703” rank=”1”
query=”Free−Text=versailles” xpath=” / article /body/ section[2] ”
rsv=”0.42668482913637895” />
<sec title =”History” file =”32703” rank=”1”
query=”Free−Text=versailles” xpath=” / article /body/ section[3] ”
rsv=”0.4356076698303029” />
</ article>
...
</event>
...
</events>
</inex−itrack06>� �Listing 9.1:XML log file; resultlist-Event
This logfile is of useragj001. Theevents-Element contains all the logged events. Listing 9.1
shows the logfile entry for aresultlist event. Result lists consist of up to 75 articles which
have sections (sec) and subsections (ss1). Every article element has the attributestitle,
file, rank, query, path andrsv.
The attributetitle is the title of article,sub-title is the title/subtitle of article element.
file denotes the unique ID of each file.rank is the rank within the resultlist andquery as
issued by searcher. Each article element has an XPath expression (xpath). This indicates the
location of the element in the article. An article has alwaysarticle as XPath-expression. An
example of a XPath-expression for section is/article[1]/body/section[2]. The retrieval
status value is given as attributersv.
Login- andLogout-Events are logged when user is logged into and logged out of the sys-
tem. When a document is requested, the following events are logged one after the other in
the given sequence.Detailquery when an element is requested,FetchingDetail while
loading andDetailbrowsing, when that element is presented to the user. Moreover, there
are events for clicking the back button (BackButton), for following internal and exter-
nal links (FollowedInternalLink and FollowedExernalLink), for highlighting of text
(HighlightedText), for reformulating query (GUIQueryChanged) and for giving a relevance
assessment (RelevanceAssessment).
Listing 9.2 shows an example of aDetailbrowsing-Event.
119
Page 132
9 Interaction patterns and interest indicators
� �<event>
<eventid> ...</eventid>
<timestamp>2007/03/01 23:59:33:805</timestamp>
<eventtype>detailbrowsing</eventtype>
<file>53316</file>
<rank>2</rank>
<coming−from>toc</coming−from>
<xpath>/article [1]</xpath>
< title >Palace of Versailles</ title >
<sub−title>Palace of Versailles</sub− title>
<query>versailles</query>
</event>� �Listing 9.2:XMLlog file; Detailbrowsing-Event
The detailbrowsing-Event shows that the article with the ID53316 is visited, which oc-
curred at the second rank in the resultlist of log file. The XPath expression/article[1]
indicates that article itself is browsed.
In the following sections, we investigate which logged user actions can be used as relevance
indicators.
9.5 Clicks within the documents
When a searcher chooses some result from the ranked result list to view the detail, the detail
view of the document shows the table of contents on the left hand side and details of the
chosen element on the right hand side. The searcher has the possibility of navigating within
the document by using the table of contents. The hypothesis tested in this pattern is that
searchers click more often in relevant documents. Since elements of a document may be of
different relevance, we compute the average importance of a document. For that, we map the
relevance scale onto numeric values from 0-2 for iTrack 2005 and from 0-4 for iTrack 2006-07.
There are two box plots for each of the years (Figure9.2); one for the average rele-
vance per document for the number of clicks and the other for the number of clicks for
each relevance scale. Each plot depicts the smallest observation, lower quartile (Q1), me-
dian, upper quartile (Q3) and largest observation. Dots are indicating outliers. The spac-
ing between the different parts of the box indicate variance and skewness. The R sys-
tem [R Development Core Team, 2006] is used to plot these graphs.
Consider the average relevance per document for number of clicks for iTrack 2005. The me-
120
Page 133
9.6 The query and result presentation overlap
dian of the relevance varies depending on the number of clicks but there is no clear dependency
between these two variables.
In a similar way, the other iTrack 2005 plot shows no clear tendency: although the median
number of clicks is higher for partial and fully relevant items, the overlap between the three
boxes is rather high. The Kruskal-Wallis test shows that median values differ significantly
between the relevance values.
In iTrack 2006-07, for the average relevance per document for number of clicks, there is a
positive correlation between two variables. However there is high overlap among the boxes of
various numbers of clicks.
Considering the other iTrack 2006-07 plot, we see a similar picture as in iTrack 2005: the
median for NR is lower than for the other relevance values. There is also high overlap between
boxes for the different relevance values. Again, the Kruskal-Wallis test shows that median
values differ significantly between the relevance values.
Overall we can conclude that the number of clicks to some extend indicates the relevance.
Nonrelevant documents are clicked less often than partial or fully relevant ones. However,
the difference is not as high as one would hope for— a searcher clicks more often if she is
interested but often fails to find relevant information.
9.6 The query and result presentation overlap
In order to use the interactive information retrieval system, searchers have to transform their
information need to a few words and formulate a query. While inspecting the result list, they
are looking for occurrences of the query terms issued. The result presentation at the result
list level consists of surrogates and sometimes includes the document snippets, sentence(s)
or the sub captions. Searchers pick an item from the result list whenever they find the result
may be relevant to their information need. In many cases, the query terms may not occur
in the surrogates displayed, but only in the fulltext of the viewed element. Now we want
to investigate how the presence of query terms in document/element surrogates is related to
relevance. Our hypothesis is that the more query terms are present, the more likely the item
may be relevant. This is similar to the coordination level match. In that retrieval function,
the content of the complete document/element is considered, while in our case, we are only
interested in the representation that is shown to the searcher.
In the following,overlaprefers to the number of the terms common between the query terms
and the document representation viewed.
Figures9.3 depicts the relationship between the overlap and the explicit relevance given for
iTrack 2005 and iTrack 2006-07. There are two plots for each year; one showing relationship
121
Page 134
9 Interaction patterns and interest indicators
●
1 2 3 4 5 6 7 8 9 10 11 12
0.0
0.5
1.0
1.5
2.0
iTrack 2005: Number of clicks within documents vs. average relevance
Number of clicks within document
aver
age
rele
vanc
e pe
r do
cum
ent
●●●
●●●●
●
●
●●●●●●●
●●
●●
●
●●●●
●
●●●●●●●●
●●●●●
●
●●●●
●●●●●●●
●●
0(nr) 1(pr) 2(fr)
24
68
1012
iTrack 2005: Clicks within documents vs.explicit relevance given
relevance scale
The
num
ber
of c
licks
●
1 2 3 4 5 6 7 8 9
01
23
4
iTrack 2006: Number of clicks within documents vs. average relevance
Number of clicks within document
aver
age
rele
vanc
e pe
r do
cum
ent
●●
●●
●●●●
●●
●●●●
●●
●●●
●●●●
●
●●●●
●●●
●●●
●●●●●●
●●
●●●
●●
●●●●●
●●●●●
●
●●●
●
●●
●
●●
●●●●●●● ●●●●●●●●●●●●●●●●●●●●●●●●●●●●●●●●●●●
0(nr) 1(tn) 2(tb) 3(pr) 4(fr)
24
68
1012
iTrack 2006: Clicks within documents vs.explicit relevance given
relevance scale
The
num
ber
of c
licks
Figure 9.2:Clicks within documents vs. given relevance for iTrack 2005 and iTrack 2006-07
between overlap and average relevance per document and the other illustrates the relationship
between given relevance and overlap.
Regarding average relevance for different overlap values in iTrack 2005, there are no notice-
able differences among different overlap values. The box plots of the different overlap values
are almost identical.
The second graph of iTrack 2005 depicts the various relevance values and their corresponding
distribution of overlap. There is a clear difference between non-relevant and the other two
relevance values. The box plots for pr and fr are the same. The Kruskal-Wallis test concluded
that median values differ significantly between the various relevance values.
122
Page 135
9.7 Reading time
Now we are considering the iTrack 2006-07 graph showing average relevance for different
overlap values. Here we have the biggest difference between 0 and higher overlap values. We
can see positive relationship between the degree of overlap and the relevance, but the medians
for the overlap 1, 2, 3 and 4 are the same and the boxes of overlap 2,3 and 4 are identical.
The other graph for the iTrack 2006-07 depicts the clear difference between not relevant and
other relevance values. The overlap is clearly higher for relevance values other than not rele-
vant whereas median is same for all the relevance values. The Kruskal-Wallis test concluded
that median values differ significantly. Therefore we can conclude that overlap indicate the
relevance to some extend but cannot be considered as strong indicator. There are situations
when searchers presumably find relevant information without noticing the overlap between
query and result presentation between the various relevance values.
9.7 Reading time
Now we regard the amount of time an individual spends reading an element and compare it to
her explicit relevance judgement.
When a searcher requests the details of some result item, an eventdetail query is generated.
When it is presented to the searcher, the eventdetail browsing is generated. The reading
time is measured as time span difference between the eventsdetail viewing andrelevance
assessment. The time is measured in seconds. Most of the reading time lies within the time
frame of 120 seconds. Therefore this limit is considered as a threshold.
Figures9.4depicts the box plots for iTrack 2005 and iTrack 2006-07.
Consider the iTrack 2005 plot showing the relationship between reading time and average
relevance per document. Here a time value of 10 implies 0-10 seconds, 20 implies 11 to 20
seconds and so on. There is a clear difference between box plots for 10 seconds and those
for higher values showing that items with short reading time are mostly less relevant whereas
larger reading time indicates higher relevance. The degree of relevance increases with larger
reading time till 70 seconds.
In a similar way, the other iTrack 2005 plot shows that partial and fully relevant items lead
to higher reading time than in the non relevant case, whereas there is almost no difference
between partial and full relevance. The Kruskal-Wallis test concluded that median values
differ for each relevance scale group.
The first iTrack 2006-07 plot shows the relationship between average time and average rele-
vance per document. We can see no positive relationship between reading time and relevance.
The relevance for less reading time is higher than relevance for higher reading time.
The second plot for iTrack 2006-07 shows no difference in median for various relevance val-
123
Page 136
9 Interaction patterns and interest indicators
0 1 2 3 4 5
0.0
0.5
1.0
1.5
2.0
iTrack 2005: Query and result presentation overlapvs. explicit relevance given
overlap
rele
vanc
e sc
ale
0(nr) 1(pr) 2(fr)
01
23
45
iTrack 2005: Explicit relevance given vs. query and result presentation overlap
relevance scale
over
lap
●●
0 1 2 3 4 5
01
23
4
iTrack 2006: Query and result presentation overlapvs. explicit relevance given
overlap
rele
vanc
e sc
ale
●●●●
●●
●●●
●
●
●●●●
●●●
●
●
●●
●
●
●
●●
●●
●
●
●
● ●●●● ●●●
●●●●
●●
●
●
●
●●●
●
●
●
●
●●
●●●●●
●
●●●●●●●●●
●
●●●●●●●●●●
0(nr) 1(tn) 2(tb) 3(pr) 4(fr)
01
23
45
iTrack 2006: Explicit relevance given vs. query and result presentation overlap
relevance scale
over
lap
Figure 9.3:Query and result representation overlap vs. given relevance for iTrack 2005 and
iTrack 2006-07
ues. There is also high overlap among boxes of different relevance scales. The Kruskal-Wallis
test concluded that median values differ.
Overall we can conclude that time spent reading can be considered as strong relevance indi-
cator in scientific articles used in iTrack 2005 and as a weak indicator in Wikipedia used in
iTrack 2006-07, but mainly for distinguishing nonrelevant items from those of other relevance
values.
124
Page 137
9.8 Highlighting text
10 30 50 70 90 110
0.0
0.5
1.0
1.5
2.0
iTrack 2005: Average time spent reading per documen vs. average relevance given
reading time
aver
age
rele
vanc
e pe
r do
cum
ent
●
●
●
●
●●
●
●
●
●
●●●
●
●
●
●
●
●
●
●
●
●
●
●
●
●
●
●
●
●
●
●
●
●
●
●
●
●●
●●
●
●
●
●
●
●●
●
●●
●
●●
●
●
●
●
●
●
●
●
●
●
●
●
●●
●
●
●
●
●
●
●
●
●●
●
●
●
●●
●
●
●
●
●
●
●●
●
●
●
●
●
●●●
●●
●
●●
●
●
●
●
●
●●
●●
●
●
●
●
●
●
●
●
●
●
●
●●●
●
●
●
●
●●●
●
●
●
●
●
●
●
●
●
●
●
●
●
●
●
●
●
●
●
●
●
●
●
●
●
●
●
●
●●
●
●
●●
●
●
●
●
●
●
0(nr) 1(pr) 2(fr)
020
4060
8010
012
0
iTrack 2005: Explicit relevance given vs.time spent on reading
relevance scale
time
in s
econ
ds
●●
10 30 50 70 90 110
01
23
4
iTrack 2006: Average time spent reading per documen vs. average relevance given
reading time
aver
age
rele
vanc
e pe
r do
cum
ent
●●
●●
●
●
●●●
●
●
●
●●
●●
●
●
●●
●
●
●
●
●
●
●
●
●
●
●
●
●●
●
●
●
●
●
●
●
●
●
●●
●
●
●
●
●
●
●
●
●
●
●
●
●
●
●
●
●
●
●●
●
●●
●●
●
●
●
●
●
●
●
●
●
●
●●
●
●
●
●
●
●
●
●
●
●
●
●
●
●
●
●
●
●
●
●
●
●
●
●
●●
●
●
●
●●
●
●
●
●
●
●
●
●
●
●
●
●
●
●
●
●
●
●
●
●●
●
●
●●
●
●
●
●
●
●
●●
●
●
●
●
●
●●●●
●
●
●
●
●●
●●
●
●
●
●
●
●
●
●
●
●
0(nr) 1(tn) 2(tb) 3(pr) 4(fr)
020
4060
8010
012
0
iTrack 2006: Explicit relevance given vs.time spent on reading
relevance scale
time
in s
econ
ds
Figure 9.4:Time spent reading vs. relevance values for iTrack 2005 and iTrack 2006-07
9.8 Highlighting text
While reading an element a searcher may copy some of its contents. This probably means that
the searcher is interested in the element. Furthermore, a searcher can also habitually highlight
portions of the elements that she is interested in, which may also be a relevance indicator. We
assume that the more a user highlights in a text, the higher is the relevance of corresponding
document.
Text highlighting by the user was only available in iTrack 2006-07. Figure9.5 shows two
plots; one shows a bar chart of the highlighting versus the explicit rating and the other plot
shows the relationship between number of times text is highlighted in a document and average
125
Page 138
9 Interaction patterns and interest indicators
0 1 2 3 4 5
01
23
4
iTrack 2006: No of time text highlighted in a document vs. average relevance per document
No. of time text highlighted in a document
aver
age
rele
vanc
e pe
r do
cum
ent
nr tn tb pr fr
Text highlighting vs. explicit relevance given
relevance scale
Pro
port
ion
of te
xt h
ighl
ight
ing
01
23
45
6
Figure 9.5:Text highlighting vs. relevance given for iTrack 2006-07
relevance per document given.
As we can see, users highlight much more text in fully relevant items, whereas the difference
between the other relevance scale is marginal. An other important point to be noted is that not
all users do text highlighting. In our case only 44 searchers highlighted the text while reading
it.
Therefore text highlighting can be considered as an indicator for strong relevance, but the
distinction between the other degrees of relevance is hardly possible.
9.9 Link following
The final pattern under consideration is the link following event, i. e. we regard the relevance
judgement for a document when the user browsing a document by clicking on a hyperlink in
another document.
Figure9.6shows two plots, one barchart showing the proportion of varying relevance for only
those document which are browsed by following a hyperlink and the other plot shows the re-
lationship between the average relevance per document given and different ways of document
browsing. The Kruskal-Wallis test concluded that median values differ significantly between
two ways of browsing.
The barchart shows that browsing via hyperlink is a strong indicator for full relevance. How-
ever, this feature doesn’t support discrimination between other relevance values.
The box plot shows that there is substantial difference in average relevance for documents
126
Page 139
9.10 Interest indicators as relevance predictors
browsed using other way browsed via hyperlink
01
23
4
iTrack 2006: Document browsed vs.explicit relevance given
relevance scale
aver
age
rele
vanc
e pe
r do
cum
ent
nr tn tb pr fr
Link following vs. explicit relevance given
relevance scale
Pro
port
ion
of li
nk fo
llow
ing
01
23
45
6
Figure 9.6:Link following vs. relevance given for iTrack 2006-07
browsed via following hyperlink and those browsed in other ways.
9.10 Interest indicators as relevance predictors
In the previous sections, we have investigated various types of user actions as interest
indicators. Now we want to apply machine learning methods for predicting relevance
based on this user data. In case these methods would work well, the predicting method
can be used as input to standard relevance feedback methods, thus implementing im-
plicit relevance feedback. For this purpose, we use the systems RapidMiner1 and R sys-
tem [R Development Core Team, 2006] for automatic classification, where each instance be-
longs to one of the classes ’relevant’ or ’nonrelevant’.
Training and Testing
For classification, normally the data is divided into two sets, i.e. training and test. The classifier
is trained on the training set. To predict the performance of a classifier, we need to assess its
error rate on a dataset that played no part in the formation of the classifier. This independent
sample is called the test data. The classifier predicts the class of each instance: if it is correct,
that is counted as success; if not, it is an error.
A more general way to mitigate any bias caused by the particular sample chosen is to repeat
1http://rapid-i.com (Last date accessed April 11, 2009)
127
Page 140
9 Interaction patterns and interest indicators
the whole process, training and testing, several times.
10-fold Cross-Validation
In 10-fold cross-validation [Witten and Frank, 2005], the original sample is partitioned into
10 subsamples. Of the 10 subsamples, a single subsample is retained as the validation data
for testing the model, and the remaining 9 subsamples are used as training data. The cross-
validation process is then repeated 10 times (the folds), with each of the 10 subsamples used
exactly once as the validation data. The 10 results from the folds then can be averaged to
produce a single estimation. The advantage of this method over repeated random sub-sampling
is that all observations are used for both training and validation, and each observation is used
for validation exactly once.
If there are very few instances of one class in a dataset, there is a chance that a given fold may
not contain any of this class instances. To ensure that this does not happen, stratified 10-fold
cross-validation is used where each fold contains roughly the same proportion of class labels
as in the original set of samples.
Support Vector Machine (SVM)
Support vector machines (SVMs) are a set of related supervised learning methods used for
classification and regression [Witten and Frank, 2005]2. Viewing input data as two sets of
vectors in an n-dimensional space, an SVM will construct a separating hyperplane in that
space, one which maximises the margin between the two data sets. To calculate the margin,
two parallel hyperplanes are constructed, one on each side of the separating hyperplane, which
are ”pushed up against” the two data sets. Intuitively, a good separation is achieved by the
hyperplane that has the largest distance to the neighboring datapoints of both classes, since
in general the larger the margin the better the generalisation error of the classifier. In our
experiments, we used SVMs with so-called linear kernels.
Decision Tree
In a decision tree each inner node corresponds to one attribute, each branch stands for one
possible value of this attribute (numeric values have to be discretized first), and in the classifi-
cation process, an instance walks through the tree by starting from the root and following the
branches according to its attribute values: when a leaf node is reached, the class corresponding
to this leaf is assigned [Witten and Frank, 2005].
2http://en.wikipedia.org/wiki/Support_vector_machine (Last accessed on April 20, 2009)
128
Page 141
9.10 Interest indicators as relevance predictors
Metrics
In order to measure the classification quality, we use the accuracy measure. The contingency
table shows the four different cases of combinations of classifier prediction and human judge-
ment.
True positive (TP) An instance is correctly predicted as true. This is a correct classification.
False positive (FP) An instance is incorrectly predicted as yes (or true) when it is infact no
(negative).
False negative (FN) An instance is incorrectly predicted as no (or negative) when it is infact
true (or yes).
True negative (TN) An instance is correctly predicted as false. This is a correct classification.
Relevance Human Judgement
Yes No
Classifier Yes TP (true positives) FP (false positives)
JudgementNo FN (false negatives) TN (true negatives)
Table 9.1:Contingency table for a class
An evaluation measure is theAccuracy awhich is defined as the ratio of the amount of correct
classification assignments to the amount of all classification assignments
a =TP+TN
TP+TN+FP+FN
Experimentation
Although we have multi-valued relevance scales, we want to predict only binary relevance in
our classification experiments (since this is already hard enough, as we will see). For this
purpose, we consider two different interpretations of relevance, which we call strict and loose.
Furthermore, we investigate relevance predictions both at the level of single element and at
the document level. In the element-based approach, a strict interpretation regards only fully
relevant items as relevant, and a loose one where everything that was not judged as ‘not rele-
vant‘. In the document-based approach, the average of the relevance judgements per document
is considered. Therefore the average relevance ranges from 0 to 3 for iTrack 2005 and from 0
to 4 for iTrack 2006-07. Different ranges for strict and loose are defined as follows:
129
Page 142
9 Interaction patterns and interest indicators
iTrack 2005: loosely relevant= relevance> 0.5
strictly relevant = relevance> 1
iTrack 2006: loosely relevant= relevance≥ 1
strictly relevant = relevance≥ 3.5
Using these definitions, classification experiments were performed both with the decision tree
and the SVM method. The tables9.2 and 9.3 show the resulting accuracy values for the
two different relevance interpretations, the two iTracks and for element and document-based
approaches. Different features are considered individually and also altogether.
Here ‘baseline‘ denotes the case where the majority class is assigned to each instance. Accu-
racy values are printed bold if they are at least 1% higher than the baseline and in italics if they
are at least 0.5% better. Differences significant at the 95% level are marked with a∗ and at the
99% level are marked∗∗.
Overall the classification accuracy is modest in comparison to the baseline. For the element-
based approach, we get improvements only for loose interpretation of relevance in both
iTracks, by using the decision tree method. The results for the different features show that
hardly anything but number of clicks helps in predicting relevance.
For the document-based approach, we regarded both averages and sums of element-wise fea-
turesreading timeandoverlap. Here the results for iTrack 2006-07 show no improvements at
all over the baseline. In contrast, the iTrack 2005 experiments show improvements for both
interpretations of relevance. For the strict interpretation, the accuracy gain is quite small and
seems to originate from number of clicks and the reading time. The highest improvements
have been achieved with the loose interpretation, where the overall reading time seems to be
the most indicative feature.
An alternative way of looking at individual features is the computation of information gain;
the corresponding results are shown in tables9.4and9.5. For the element-based classification,
all information gain values are rather small (< 0.1). In the document-based view, we get
somewhat higher values, especially for iTrack 2005, where the sum of reading times is the
strongest indicator for both interpretations of relevance.
Overall, the classification experiments have shown only small improvements over the baseline.
For iTrack 2006-07, there was no accuracy gain for the document-wise view, and only about
1.6% improvements for the element-wise view. Presumeably this poor result is due to the
heterogeneous structure of the Wikipedia collection.
130
Page 143
9.11 Link with other research
iTrack 2005 iTrack 2006-07
strict loose strict loose
baseline 65.96 66.51 61.43 75.94
all with svm 65.96 66.51 61.43 75.94
all with decision tree 66.34 70.52∗∗ 62.13 77.58∗
clicks 66.03 67.37 61.44 76.63
reading time 65.76 66.48 61.44 75.95
overlap 66.03 66.48 61.44 75.95
hyperlink - - 61.44 75.95
text highlighting - - 61.44 75.95
Table 9.2:Element-based accuracy percentage for iTrack 2005 and iTrack 2006-07 and two
relevance interpretations
In the iTrack 2005, the best results were achieved with the loose interpretation of relevance.
The most indicative feature is the reading time, especially for the document-wise view. Com-
paring document vs. single elements, we see that hardly any single feature seems to be in-
dicative for the element-based view, only the combination of features leads to a noticeable
improvements over the baseline. For the two interpretations of relevance, the strict one seems
to be the harder one to predict.
9.11 Link with other research
[Moe et al., 2007] indicated that eye-tracking data has potential to improve the performance
in implicit relevance feedback. They focused on the featurethorough readingand it corre-
sponds to the notion of having read text as opposed to just skimming or glancing over it. They
performed the experiments with 6 searchers in the iTrack 2006-07 setttings.
9.12 Conclusion
In this chapter, we have analysed the searchers’ interaction logs and investigated to what extent
the different features can be used as relevance predictors. From the five features regarded, pri-
marily the reading time is a useful relevance predictor but mainly for the whole document, and
the accuracy gain is with about 3% rather limited. Overall, relevance predictors for structured
documents seem to be much weaker than for the case of atomic documents.
131
Page 144
9 Interaction patterns and interest indicators
iTrack 2005 iTrack 2006-07
strict loose strict loose
baseline 62.02 70.23 67.37 75.28
all with svm (average) 62.77 70.23 67.37 75.28
all with svm (sum) 63.35 70.23 67.37 75.28
all with decision tree (average)62.33 73.08∗ 66.69 74.73
all with decision (sum) 62.58 73.33∗∗ 67.27 74.67
clicks 63.41 70.41 67.27 75.28
reading time (average) 62.75 70.91 67.27 75.28
overlap (average) 61.41 70.41 67.27 75.28
reading time (sum) 62.91 73.67∗∗ 67.27 75.27
overlap (sum) 62.58 70.41 67.27 75.28
hyperlink - - 66.68 75.28
text highlighting - - 67.27 75.28
Table 9.3:Document-based accuracy percentage for iTrack 2005 and iTrack 2006-07 and two
relevance interpretations
iTrack 2005 iTrack 2006-07
strict loose strict loose
clicks 0.025 0.06 0.025 0.043
reading time 0.049 0.07 0.049 0.049
overlap 0.017 0.02 0.021 0.029
hyperlink - - 0.003 0.007
text highlighting - - 0.009 0.008
Table 9.4:Element-based information gain of individual features for iTrack 2005 and iTrack
2006-07 and two relevance interpretations
132
Page 145
9.12 Conclusion
iTrack 2005 iTrack 2006-07
strict loose strict loose
clicks 0.041 0.095 0.010 0.040
reading time (average)0.097 0.114 0.078 0.074
overlap (average) 0.097 0.116 0.036 0.062
reading time (sum) 0.194 0.223 0.093 0.100
overlap (sum) 0.059 0.073 0.025 0.066
hyperlink - - 0.016 0.012
text highlighting - - 0.014 0.011
Table 9.5:Document-based information gain of individual features for iTrack 2005 and iTrack
2006-07 and two relevance interpretations
133
Page 146
9 Interaction patterns and interest indicators
134
Page 147
10 Conclusion and outlook
This chapter summarises the work undertaken in this thesis and gives directions
for future research.
The aim of this thesis was to investigate the ways in which searchers can be supported while
working on their tasks and searching in the structured document collection.
In order to assist searchers during query formulation, various weighting schemes, co-
occurrence units for computing related terms and the usefulness of contextual related terms are
investigated. Suggesting related terms is found useful for query formulatin and the contextual
related terms (KWIC) approach is one of the ways to make ambiguous terms understandable
to users.
The result presentation and element detail examining strategies are also investigated. For the
result list, the retrieved elements should be presented in a hierarchy and in context of their
documents. In the detail view, the table of contents of each document is found very useful.
Searchers found this a quick way of locating relevant information. It not only allows for easy
browsing but all the relevant elements can be marked in one representation and it can also
indicate element size.
An important aspect of XML retrieval is locating the focused result with appropriate granular-
ity. The value of element retrieval system to users in a retrieval situation and their preference
for the granularity are investigated. Searchers find a lot of the relevant information in specific
elements and full documents. Element size is a better discriminator of relevant elements than
element type. In any case, short elements are less likely to be relevant.
In addition, two focused approaches such as element and passage retrieval are also compared.
Here element retrieval is preferred by searchers although the differences are small.
Finally, we investigated implicit relevance indicators. These included time, clicks, overlap,
highlighting and following a link to another document. From the five features regarded, pri-
marily the reading time is a useful relevance predictor. Overall, relevance predictors for struc-
tured documents seem to be much weaker than for the case of atomic documents For future
work, we base our discussion on the two dimensional design space for XML retrieval pre-
sented in [Fuhr and Lalmas, 2007]. The first dimension lists the different levels of structure,
varying from a simple nesting over named fields and XPath up to XQuery. The second di-
135
Page 148
10 Conclusion and outlook
mension describes various levels of content typing, starting with text only, followed by data
types and finally object types. This thesis focused on content-only queries, thus combining
nested structure with text only. Extending our work to content-and-structure queries would be
a reasonable next step, where XPath queries are regarded, but restricted to text only. There
are already some efforts in this direction [Effing, 2002, van Zwol et al., 2006a] but their use
has not been exploited in interactive situations. Result presentation strategies for content-and-
structure queries also should be a matter of research. Another important point to be considered
is the use of other collections, especially collections with semantic tagging (like e.g. the Lonely
Planet collection).
There is also the need to investigate task and user group-specific interfaces, as users have vary-
ing tasks and different preferences. An important applications of the focused view is searching
and navigating in mobile devices. Such devices have inherent physical limitations, therefore
there is need to investigate device-specific interfaces for result presentation, navigation and
browsing.
The research presented here used two kinds of structured text collection namely IEEE-CS
and Wikipedia. There is also the need to investigate which result presentation approaches
and document presentation techniques are important for other kinds of documents, like e.g.
books/dissertations. Since 2007, there exists also a Book track in INEX which focuses on
book-specific relevance ranking strategies, UI issues and user behaviour.
Somewhat orthogonal to the XML structure is the named fields view; here an important appli-
cation would be patent retrieval, where the different parts (fields) of a patent document play
very different roles (e.g. the ’claims’ section versus the ’related work’ section). Patents and
other technical documents also call for better content typing, by supporting search operators
for technical measurements or (chemical) formulae.
At the highest level of content typing, we have object types which are regarded mainly in the
semantic web context, like e.g. for Wikipedia [Schenkel et al., 2007]. However, appropriate
retrieval methods considering uncertainty and vagueness are still at their infancy.
136
Page 149
List of Figures
1.1 XML structure example. . . . . . . . . . . . . . . . . . . . . . . . . . . . . 3
2.1 A nested model - from information behaviour to information search-
ing [Wilson, 1999] . . . . . . . . . . . . . . . . . . . . . . . . . . . . . . . 8
2.2 [Bates, 1989]’s Berry-picking model . . . . . . . . . . . . . . . . . . . . . 14
2.3 Classification of behaviours that can be used for implicit relevance feedback. 20
3.1 DAFFODIL in the use . . . . . . . . . . . . . . . . . . . . . . . . . . . . . . 29
3.2 DAFFODIL Architecture. . . . . . . . . . . . . . . . . . . . . . . . . . . . . 31
4.1 Sketch of the structure of the IEEE document [Fuhr et al., 2002b] . . . . . . . 35
4.2 A simulated work task example. . . . . . . . . . . . . . . . . . . . . . . . . 39
4.3 INEX 2006 interactive track relevance assessment scale. . . . . . . . . . . . 48
5.1 Contextual related tool showing related terms along with top 3 KWIC as
tooltip for the term “heating House“. . . . . . . . . . . . . . . . . . . . . . 62
5.2 Contextual related tool showing related terms along with top 10 KWIC in sep-
arate window . . . . . . . . . . . . . . . . . . . . . . . . . . . . . . . . . . 63
6.1 SuperBook interface by [Remde et al., 1987] . . . . . . . . . . . . . . . . . 67
6.2 TileBars interface by Hearst. . . . . . . . . . . . . . . . . . . . . . . . . . 68
6.3 iTrack 04: Query form and resultlist. . . . . . . . . . . . . . . . . . . . . . 69
6.4 iTrack 04: Detail view of an element. . . . . . . . . . . . . . . . . . . . . . 69
6.5 Ranked result list with the visualisation of number of hits within document
iconic representation of relevance. . . . . . . . . . . . . . . . . . . . . . . 73
6.6 Result presentation with Partial Treemaps.. . . . . . . . . . . . . . . . . . . 74
6.7 iTrack 05: Query form and resultlist. . . . . . . . . . . . . . . . . . . . . . 77
6.8 Element retrieval interface by [Kamps et al., 2006] . . . . . . . . . . . . . . 78
6.9 iTrack 05: Detail view . . . . . . . . . . . . . . . . . . . . . . . . . . . . . 79
7.1 Distribution of the relevance assessments for different element types. . . . . 87
7.2 Distribution of relevance judgements vs. element size in words. . . . . . . . 88
137
Page 150
List of Figures
7.3 Frequency distribution of relevance judgements vs. element size in words. . 89
7.4 Distribution of relevance judgements vs. relative element size. . . . . . . . . 90
7.5 Frequency distribution of relevance judgements vs. relative element size. . . 90
8.1 TopX-based Element retrieval result list: Relevant-in-context showing high-
scoring elements grouped by document; query term highlighting; task and re-
lated terms displayed. . . . . . . . . . . . . . . . . . . . . . . . . . . . . . 95
8.2 Element retrieval detail/full text view: ToC for navigation, query term high-
lighting, display of a section; icons for viewed elements and relevance assess-
ments; background highlighting of currently viewed element. . . . . . . . . 95
8.3 Panoptoic based passage retrieval result list: Relevant-in-context showing
high-scoring passages with automatic summarization grouped by document;
query term highlighting; task and related terms displayed. . . . . . . . . . . 96
8.4 Passage retrieval based detail/full text view: ToC for navigation and its head-
ings are based on automatic summarization, query term highlighting, display
of a section; icons for viewed elements and relevance assessments; background
highlighting of currently viewed element. . . . . . . . . . . . . . . . . . . . 96
8.5 Usefulness of ToC. . . . . . . . . . . . . . . . . . . . . . . . . . . . . . . .102
8.6 Usefulness of Resultlist . . . . . . . . . . . . . . . . . . . . . . . . . . . . 105
8.7 A sketch of visualisation. . . . . . . . . . . . . . . . . . . . . . . . . . . . 107
9.1 The breakdown of given relevance. . . . . . . . . . . . . . . . . . . . . . . 117
9.2 Clicks within documents vs. given relevance for iTrack 2005 and iTrack 2006-07122
9.3 Query and result representation overlap vs. given relevance for iTrack 2005
and iTrack 2006-07. . . . . . . . . . . . . . . . . . . . . . . . . . . . . . .124
9.4 Time spent reading vs. relevance values for iTrack 2005 and iTrack 2006-07. 125
9.5 Text highlighting vs. relevance given for iTrack 2006-07. . . . . . . . . . . 126
9.6 Link following vs. relevance given for iTrack 2006-07. . . . . . . . . . . . 127
C.1 iTrack06 Before Experiment Questionnaire. . . . . . . . . . . . . . . . . . xxxiii
C.2 iTrack06 Before Task Questionnaire. . . . . . . . . . . . . . . . . . . . . . xxxiv
C.3 iTrack06 After Task Questionnaire. . . . . . . . . . . . . . . . . . . . . . . xxxv
C.4 iTrack06 Post Experiment Questionnaire. . . . . . . . . . . . . . . . . . . . xxxvi
138
Page 151
List of Tables
4.1 Basic experimental matrix. . . . . . . . . . . . . . . . . . . . . . . . . . . 40
4.2 The INEX 2004 relevance scale. . . . . . . . . . . . . . . . . . . . . . . . 41
4.3 Basic experimental matrix. . . . . . . . . . . . . . . . . . . . . . . . . . . 41
4.4 The INEX 2005 experimental matrix, OT is Own task, and STG, STC are the
two 2 simulated work task categories. . . . . . . . . . . . . . . . . . . . . . 43
4.5 The INEX 2005 relevance scale. . . . . . . . . . . . . . . . . . . . . . . . 44
4.6 Rotation matrix with Element (S1) vs. Passage (S2) retrieval systems and task
groups . . . . . . . . . . . . . . . . . . . . . . . . . . . . . . . . . . . . . 45
4.7 Rotation details as kept in the database. . . . . . . . . . . . . . . . . . . . . 47
4.8 Distribution of tasks into categories. . . . . . . . . . . . . . . . . . . . . . 48
5.1 Frequency distribution for the estimation ofP(ki |l j) wherel j is occurrences of
noun phrases from INEX 2006 Wikipedia collection. . . . . . . . . . . . . . 57
5.2 Estimatespopt for the frequency distribution of Table5.1 . . . . . . . . . . . 58
5.3 Evaluation results. . . . . . . . . . . . . . . . . . . . . . . . . . . . . . . . 59
5.4 Searchers rating about the usefulness of proposed related terms on the scale of
1 (Not at all) to 5 (Extremely) in iTrack 2006-07. . . . . . . . . . . . . . . . 59
5.5 In response to the open questionsWhat features of the interface were the most
and least useful for this search task?— Some negative comments about the
related terms. . . . . . . . . . . . . . . . . . . . . . . . . . . . . . . . . . . 59
5.6 In response to the open questionsWhat features of the interface were the most
and least useful for this search task?— Some positive comments about the
related terms. . . . . . . . . . . . . . . . . . . . . . . . . . . . . . . . . . . 60
5.7 Searchers rating the usefulness of contextual related tool on the scale of 1 (Not
at all) to 5 (Extremely) in iTrack 08 . . . . . . . . . . . . . . . . . . . . . . 63
5.8 Responses to open questionsWhat features of the interface were the most and
least useful for this search task?— Some positive comments about the related
terms . . . . . . . . . . . . . . . . . . . . . . . . . . . . . . . . . . . . . . 64
139
Page 152
List of Tables
5.9 In response to the open questionsWhat features of the interface were the most
and least useful for this search task?— Some negative comments about the
related terms. . . . . . . . . . . . . . . . . . . . . . . . . . . . . . . . . . . 64
6.1 Overall opinion about the system on the scale of 1 (Not at all) to 5 (Extremely)
in iTrack 04 Baseline (88 searchers). . . . . . . . . . . . . . . . . . . . . . 70
6.2 Positive responses on system usefulness (iTrack 04, 88 searchers). . . . . . 71
6.3 Negative responses on system usefulness (iTrack 04, 88 searchers). . . . . . . . . 71
6.4 Responses to the open questionsWhich aspects of the system did you find
useful?or Which system did you prefer?. . . . . . . . . . . . . . . . . . . . 75
6.5 Some negative comments about the graphical system. . . . . . . . . . . . . 76
6.6 Overall opinion about the system on the scale of 1 (Not at all) to 5 (Extremely)
in iTrack 04 (88 searchers) & iTrack 05 (76 searchers). . . . . . . . . . . . 80
7.1 Available and accessed entry points for all tasks. . . . . . . . . . . . . . . . 85
7.2 Rotation effects from second task onward. . . . . . . . . . . . . . . . . . . 85
7.3 Available, viewed and assessed elements in the full text view (includes entry
points from the hitlist) . . . . . . . . . . . . . . . . . . . . . . . . . . . . . 86
8.1 Overall opinion about the two systems system on the scale of 1 (Not at all) to
5 (Extremely) . . . . . . . . . . . . . . . . . . . . . . . . . . . . . . . . . . 98
8.2 Participants’ feedback for element and passage retrieval systems in response
to questions: How satisfied are you with the information you found? and How
certain are you that you completed the task correctly?. . . . . . . . . . . . . 99
8.3 Analysis of search sessions for the two search systems. . . . . . . . . . . . 101
8.4 Suggestions available at the table of contents in element and passage retrieval
systems and searchers’ selections. . . . . . . . . . . . . . . . . . . . . . . . 102
8.12 Browsing strategies for task 4. . . . . . . . . . . . . . . . . . . . . . . . . . 112
9.1 Contingency table for a class. . . . . . . . . . . . . . . . . . . . . . . . . . 129
9.2 Element-based accuracy percentage for iTrack 2005 and iTrack 2006-07 and
two relevance interpretations. . . . . . . . . . . . . . . . . . . . . . . . . . 131
9.3 Document-based accuracy percentage for iTrack 2005 and iTrack 2006-07 and
two relevance interpretations. . . . . . . . . . . . . . . . . . . . . . . . . . 132
9.4 Element-based information gain of individual features for iTrack 2005 and
iTrack 2006-07 and two relevance interpretations. . . . . . . . . . . . . . . 132
9.5 Document-based information gain of individual features for iTrack 2005 and
iTrack 2006-07 and two relevance interpretations. . . . . . . . . . . . . . . 133
C.1 Task-Overview . . . . . . . . . . . . . . . . . . . . . . . . . . . . . . . . .xxix
C.2 Task-wise queries and their representation statistics. . . . . . . . . . . . . . xxxvii
140
Page 153
Bibliography
[Attar and Fraenkel, 1977]Attar, R. and Fraenkel, A. S. (1977). Local feedback in full-text
retrieval systems.Journal of the ACM, 24(3):397–417.
[Bates, 1989]Bates, M. J. (1989). The design of browsing and berrypicking techniques for
the online search interface.Online Review, 13(5):407–424.http://www.gseis.ucla.
edu/faculty/bates/berrypicking.html.
[Bates, 1990]Bates, M. J. (1990). Where should the person stop and the information search
interface start?Information Processing and Management, 26(5):575–591.
[Bates, 2002]Bates, M. J. (2002). The cascade of interactions in the digital library interface.
Information Processing and Management, 38(3):381–400.
[Bausch and McGiboney, 2008a]Bausch, S. and McGiboney, M. (2008a). Nielsen online an-
nounces june u.s. search share rankings.http://www.nielsen-netratings.com/pr/
pr_080718.pdf.
[Bausch and McGiboney, 2008b]Bausch, S. and McGiboney, M. (2008b). Nielsen online
reports topline u.s. data for june 2008.http://www.nielsen-netratings.com/pr/pr_
080714.pdf.
[Beaulieu and Gatford, 1998]Beaulieu, M. and Gatford, M. J. (1998). Interactive okapi at
trec-6. InText REtrieval Conference (TREC) TREC-6 Proceedings, pages 143–167.
[Beckers, 2008]Beckers, S. (2008). Visualisierung von suchinteraktion aus xml-logdaten.
Master’s thesis, Universitat Duisburg-Essen.
[Bederson et al., 1993]Bederson, B. B., Hollan, J. D., Perlin, K., Meyer, J., Bacon, D., and
Furnas, G. (1993). Pad++: A zoomable graphical sketchpad for exploring alternate interface
physics.Journal of Visual Languages and Computing, 7(1):3–31.
[Beeferman and Berger, 2000]Beeferman, D. and Berger, A. L. (2000). Agglomerative clus-
tering of a search engine query log. InKDD, pages 407–416.
141
Page 154
Bibliography
[Belkin et al., 1982]Belkin, N., Oddy, R., and Brooks, H. (1982). Ask for information re-
trieval: Part i. background and theory.The Journal of Documentation, 38(2):pp. 61–71.
[Belkin, 1980] Belkin, N. J. (1980). Anomalous states of knowledge as a basis for information
retrieval.Canadian Journal of Information Science, 5:133–143.
[Belkin et al., 2000]Belkin, N. J., Cool, C., Head, J., Jeng, J., Kelly, D., Lin, S., Lobash, L.,
Park, S. Y., Savage-knepshield, P., and Sikora, C. (2000). Relevance feedback versus local
context analysis as term suggestion devices: Rutgers? trec-8 interactive track experience.
In TREC-8, Proceedings of the Eighth Text Retrieval Conference, pages 565–574. Harman.
[Belkin et al., 2001a]Belkin, N. J., Cool, C., Kelly, D., Lin, S.-J., Park, S. Y., Perez-Carballo,
J., and Sikora, C. (2001a). Iterative exploration, design and evaluation of support for query
reformulation in interactive information retrieval.Inf. Process. Manage., 37(3):403–434.
[Belkin et al., 2001b]Belkin, N. J., Cool, C., Kelly, D., Lin, S.-J., Park, S. Y., Perez-Carballo,
J., and Sikora, C. (2001b). Iterative exploration, design and evaluation of support for query
reformulation in interactive information retrieval.Inf. Process. Manage., 37(3):403–434.
[Belkin et al., 1995]Belkin, N. J., Cool, C., Stein, A., and Thiel, U. (1995). Cases, scripts,
and information-seeking strategies: On the design of interactive information retrieval sys-
tems. Expert Systems with Applications, 9(3):379–395.http://www.scils.rutgers.
edu/˜belkin/articles/eswa.pdf.
[Bell and Ruthven, 2004]Bell, D. J. and Ruthven, I. (2004). Searcher’s assessments of task
complexity for web searching. InECIR, pages 57–71.
[Bier et al., 1994]Bier, E. A., Stone, M. C., Pier, K., Fishkin, K., Baudel, T., Conway, M.,
Buxton, W., and DeRose, T. (1994). Toolglass and magic lenses: the see-through interface.
In Conference companion on Human factors in computing systems, pages 445–446. ACM
Press.
[Borlund, 2000a]Borlund, P. (2000a). Evaluation of interactive information retrieval systems.
page 276. PhD dissertation.
[Borlund, 2000b]Borlund, P. (2000b). Experimental components for the evaluation of inter-
active information retrieval systems.Journal of Documentation, 56(1):71–90.
[Borlund, 2003] Borlund, P. (2003). The IIR evaluation model: a framework for evaluation of
interactive information retrieval systems.Information Research:an international electronic
journal, 8(3):1–38.http://informationr.net/ir/8-3/paper152.html.
[Brajnik et al., 1996]Brajnik, G., Mizzaro, S., and Tasso, C. (1996). Evaluating user inter-
faces to information retrieval systems: A case study on user support. In Frei, H.-P., Harman,
142
Page 155
Bibliography
D., Schauble, P., and Wilkinson, R., editors,Proceedings of the 19th Annual International
ACM SIGIR Conference on Research and Development in Information Retrieval, pages
128–136, New York. ACM.
[Broder, 2002]Broder, A. (2002). A taxonomy of web search.SIGIR Forum, 36(2):3–10.
[Buckley et al., 1994]Buckley, C., Salton, G., and Allen, J. (1994). The ef-
fect of adding relevance information in a relevance feedback environment. In
[Croft and van Rijsbergen, 1994], pages 292–301.
[Bystrom and Jarvelin, 1995]Bystrom, K. and Jarvelin, K. (1995). Task complexity affects
information seeking and use.Information Processing Management, 31(2):191–213.
[Callan, 1994]Callan, J. P. (1994). Passage-level evidence in document retrieval. In
[Croft and van Rijsbergen, 1994], pages 302–310.
[Campbell, 1988]Campbell, D. (1988). Task complexity: A review and analysis.Academy
of Management Review, 13:40–52.
[Camps, 2007]Camps, G. R. (2007).Structural Features in XML Retrieval. PhD thesis, SIKS,
the Dutch Research School for Information and Knowledge Systems.
[Choo et al., 2000]Choo, C. W., Detlor, B., and Turnbull, D. (2000). Information seeking on
the Web: An integrated model of browsing and searching.first-monday, 5(2).
[Claypool et al., 1999]Claypool, M., Gokhale, A., Miranda, T., Murnikov, P., Netes, D., and
Sartin, M. (1999). Combining content-based and collaborative filters in an online newspa-
per.
[Claypool et al., 2001]Claypool, M., Le, P., Wased, M., and Brown, D. (2001). Implicit
interest indicators. InIntelligent User Interfaces, pages 33–40.
[Crestani et al., 2004]Crestani, F., Vegas, J., and de la Fuente, P. (2004). A graphical user
interface for the retrieval of hierchically structured documents.Information Processing and
Management, 40(2):269–289.
[Croft and van Rijsbergen, 1994]Croft, B. W. and van Rijsbergen, C. J., editors (1994).Pro-
ceedings of the Seventeenth Annual International ACM SIGIR Conference on Research and
Development in Information Retrieval, London, et al. Springer-Verlag.
[Croft and Lafferty, 2002]Croft, W. B. and Lafferty, J., editors (2002).Language Models for
Information Retrieval. Kluwer, Boston et al.
143
Page 156
Bibliography
[Croft et al., 1998]Croft, W. B., Moffat, A., van Rijsbergen, C. J., Wilkinson, R., and Zobel,
J., editors (1998).Proceedings of the 21st Annual International ACM SIGIR Conference on
Research and Development in Information Retrieval, New York. ACM.
[Denoyer and Gallinari, 2006]Denoyer, L. and Gallinari, P. (2006). The Wikipedia XML
Corpus.SIGIR Forum.
[Dervin, 1977] Dervin, B. (1977). Useful theory for librarianship: Communication, not infor-
mation. 13:16–32.
[Dziadosz and Chandrasekar, 2002]Dziadosz, S. and Chandrasekar, R. (2002). Do thumbnail
previews help users make better relevance decisions about web search results? InSIGIR’02:
Proceedings of the 25th annual international ACM SIGIR conference on Research and de-
velopment in information retrieval, pages 365–366, New York, NY, USA. ACM.
[Effing, 2002] Effing, D. (2002). Unterstutzung von nutzern bei der erstellung von XIRQL-
anfragen. Master’s thesis, University of Dortmund, CS Dept.
[Efthimiadis, 1996]Efthimiadis, E. N. (1996). Query expansion.Annual Review of Informa-
tion Science and Technology, 31:121–187.
[Eick and Wills, 1995]Eick, S. G. and Wills, G. J. (1995). High interaction graphics.Eur. J.
Oper. Res., (3):445–459.
[Eisenberg and Berkowitz, 1992]Eisenberg, M. B. and Berkowitz, R. E. (1992). Information
problem-solving: The big six skills approach.
[Ellis, 1989] Ellis, D. (1989). A behavioural approach to information retrieval system design.
Journal of Documentation, 45(3):171–212.
[Fangmeyer and Lustig, 1969]Fangmeyer, H. and Lustig, G. (1969). The EURATOM auto-
matic indexing project. InIFIP Congress 68, Edinburgh, pages 1310–1314, Amsterdam.
North Holland Publishing Company.
[Fast and Campbell, 2004]Fast, J. V. and Campbell, D. G. (2004).ı still like google: uni-
versity student perceptions of searching opacs and the web. In67th annual meeting of the
American Society for Information Science and Technology, volume 41, pages 138–146.
[Finesilver and Reid, 2003]Finesilver, K. and Reid, J. (2003). User behaviour in the context
of structured documents. InSebastiani, Fabrizio (ed.), Advances in information retrieval.
25th European conference on IR research, ECIR 2003, Pisa, Italy, April 14-16, 2003. Pro-
ceedings. Berlin: Springer. Lect. Notes Comput. Sci. 2633, 104-119.
[French et al., 1997]French, J. C., Brown, D. E., and Kim, N.-H. (1997). A classification
approach to boolean query reformulation.J. Am. Soc. Inf. Sci., 48(8):694–706.
144
Page 157
Bibliography
[Fuhr, 1989] Fuhr, N. (1989). Models for retrieval with probabilistic indexing.Information
Processing and Management, 25(1):55–72.
[Fuhr, 2001a]Fuhr, N. (2001a). Language models and uncertain inference in information
retrieval. InProc. Workshop on Language Modelling and Information Retrieval, pages
6–11, Pittsburgh, PA. Carnegie Mellon University.
[Fuhr, 2001b]Fuhr, N. (2001b). Models in information retrieval. In Agosti, M., Crestani, F.,
and Pasi, G., editors,Lectures in Information Retrieval, pages 21–50. Springer, Heidelberg
et al.
[Fuhr, 2008] Fuhr, N. (2008). A probability ranking principle for interactive information re-
trieval. Information Retrieval, 11(3):251–265. http://dx.doi.org/10.1007/s10791-008-9045-
0.
[Fuhr et al., 2002a]Fuhr, N., Govert, N., and Großjohann, K. (2002a). HyREX: Hyper-media
retrieval engine for XML. In Jarvelin, K., Beaulieu, M., Baeza-Yates, R., and Myaeng,
S. H., editors,Proceedings of the 25th Annual International Conference on Research and
Development in Information Retrieval, page 449, New York. ACM. Demonstration.
[Fuhr et al., 2002b]Fuhr, N., Govert, N., Kazai, G., and Lalmas, M. (2002b). INEX: INi-
tiative for the Evaluation of XML retrieval. In Baeza-Yates, R., Fuhr, N., and Maarek,
Y. S., editors,Proceedings of the SIGIR 2002 Workshop on XML and Information Retrieval.
http://www.is.informatik.uni-duisburg.de/bib/docs/Fuhr_etal_02a.html.
[Fuhr et al., 2003]Fuhr, N., Govert, N., Kazai, G., and Lalmas, M., editors (2003).INitia-
tive for the Evaluation of XML Retrieval (INEX). Proceedings of the First INEX Work-
shop. Dagstuhl, Germany, December 8–11, 2002, ERCIM Workshop Proceedings, Sophia
Antipolis, France. ERCIM.http://www.ercim.org/publication/ws-proceedings/
INEX2002.pdf.
[Fuhr et al., 2000]Fuhr, N., Govert, N., and Klas, C.-P. (2000). An agent-based architecture
for supporting high-level search activities in federated digital libraries. InProceedings 3rd
International Conference of Asian Digital Library, pages 247–254, Taejon, Korea. KAIST.
[Fuhr et al., 2002c]Fuhr, N., Klas, C.-P., Schaefer, A., and Mutschke, P. (2002c). Daffodil:
An integrated desktop for supporting high-level search activities in federated digital li-
braries. InResearch and Advanced Technology for Digital Libraries. 6th European Confer-
ence, ECDL 2002, pages 597–612, Heidelberg et al. Springer.
[Fuhr and Lalmas, 2007]Fuhr, N. and Lalmas, M. (2007). Advances in xml retrieval: the inex
initiative. In IWRIDL ’06: Proceedings of the 2006 international workshop on Research
issues in digital libraries, pages 1–6, New York, NY, USA. ACM.
145
Page 158
Bibliography
[Fuhr et al., 2008]Fuhr, N., Lalmas, M., Trotman, A., and Kamps, J., editors (2008).Focused
access to XML documents: 6th International Workshop of the Initiative for the Evaluation
of XML Retrieval (INEX 2007), LNCS. Springer.
[Furnas et al., 1987]Furnas, G. W., Landauer, T. K., Gomez, L. M., and Dumais, S. T. (1987).
The vocabulary problem in human-system communication.Communications of the ACM,
30(11):964–971.
[Furnas and Zacks, 1994]Furnas, G. W. and Zacks, J. (1994). Multitrees: enriching and
reusing hierarchical structure. InProceedings of the SIGCHI conference on Human fac-
tors in computing systems, pages 330–336. ACM Press.
[Glover et al., 2001]Glover, E. J., Lawrence, S., Gordon, M. D., Birmingham, W. P., and
Giles, C. L. (2001). Web search—your way.Commun. ACM, 44(12):97–102.
[Goecks and Shavlik, 2000]Goecks, J. and Shavlik, J. (2000). Learning users’ interests by
unobtrusively observing their normal behavior. InProceedings of the 5th international
conference on Intelligent user interfaces, pages 129–132. ACM Press.
[Govert et al., 2003]Govert, N., Fuhr, N., Abolhassani, M., and Großjohann, K. (2003).
Content-oriented XML retrieval with HyREX. In [Fuhr et al., 2003], pages 26–32.http:
//www.ercim.org/publication/ws-proceedings/INEX2002.pdf.
[Govert and Kazai, 2003]Govert, N. and Kazai, G. (2003). Overview of the INitiative for
the Evaluation of XML retrieval (INEX) 2002. In [Fuhr et al., 2003], pages 1–17.http:
//www.ercim.org/publication/ws-proceedings/INEX2002.pdf.
[Granka et al., 2004]Granka, L. A., Joachims, T., and Gay, G. (2004). Eye-tracking analysis
of user behavior in www search. InSIGIR ’04: Proceedings of the 27th annual international
ACM SIGIR conference on Research and development in information retrieval, pages 478–
479, New York, NY, USA. ACM.
[Großjohann et al., 2002]Großjohann, K., Fuhr, N., Effing, D., and Kriewel, S. (2002). Query
formulation and result visualization for XML retrieval. InProceedings ACM SIGIR 2002
Workshop on XML and Information Retrieval. ACM. http://www.is.informatik.
uni-duisburg.de/bib/docs/Grossjohann_etal_02.html.
[Hammer-Aebi et al., 2006]Hammer-Aebi, B., Christensen, K. W., Lund, H., and Larsen, B.
(2006). Users, structured documents and overlap: interactive searching of elements and
the influence of context on search behaviour. InIIiX: Proceedings of the 1st international
conference on Information interaction in context, pages 46–55, New York, NY, USA. ACM.
146
Page 159
Bibliography
[Harman, 1992]Harman, D. (1992). Relevance feedback revisited. InProceedings of the
Fifteenth Annual International ACM SIGIR Conference on Research and Development in
Information Retrieval, pages 1–10, New York. ACM.
[Hearst, 1995]Hearst, M. A. (1995). TileBars: Visualization of term distribution information
in full text information access. InProceedings of the Conference on Human Factors in
Computer Systems, CHI’95.
[Hearst, 1999]Hearst, M. A. (1999). User interfaces and visualization. InModern Informa-
tion Retrieval. Addison Wesley.
[Hearst, 93]Hearst, M. A. (93). Texttiling: A quantitative approach to discourse segmenta-
tion. Technical Report S2K-93-24.
[Hewins, 1990]Hewins, E. T. (1990). Information need and use studies.Annual Review of
Information Science and Technology, 25.
[Hiemstra, 1998]Hiemstra, D. (1998). A linguistically motivated probabilistic model of in-
formation retrieval. InLecture Notes In Computer Science - Research and Advanced Tech-
nology for Digital Libraries - Proceedings of the second European Conference on Research
and Advanced Technology for Digital Libraries: ECDL’98, pages 569–584. Springer Ver-
lag.
[Hijikata, 2004] Hijikata, Y. (2004). Implicit user profiling for on demand relevance feedback.
In IUI ’04: Proceedings of the 9th international conference on Intelligent user interfaces,
pages 198–205, New York, NY, USA. ACM.
[Ingwersen, 1992]Ingwersen, P. (1992).Information Retrieval Interaction. Taylor Graham,
London.
[Ingwersen, 1996]Ingwersen, P. (1996). Cognitive perspectives of information retrieval.The
Journal of Documentation, 52(1):3–50.
[Ingwersen, 2000]Ingwersen, P. (2000). Users in context.www.itim.mi.cnr.it/Eventi/
essir2000/download/ingwersen.pdf.
[Ingwersen and Jarvelin, 2005] Ingwersen, P. and Jarvelin, K. (2005).The turn: integration
of information seeking and retrieval in context. Springer-Verlag New York, Inc., Secaucus,
NJ, USA.
[Joachims et al., 2007]Joachims, T., Granka, L., Pan, B., Hembrooke, H., Radlinski, F., and
Gay, G. (2007). Evaluating the accuracy of implicit feedback from clicks and query refor-
mulations in web search.ACM Trans. Inf. Syst., 25(2).
147
Page 160
Bibliography
[Johnson and Shneiderman, 1991]Johnson, B. and Shneiderman, B. (1991). Tree-maps: A
space filling approach to the visualization of hierarchical information structures. Technical
Report CS-TR-2657, University of Maryland, Computer Science Department.
[Joho and Jose, 2008]Joho, H. and Jose, J. M. (2008). Effectiveness of additional representa-
tions for the search result presentation on the web.Inf. Process. Manage., 44(1):226–241.
[Kamps et al., 2006]Kamps, J., de Rijke, M., and Sigurbjornsson, B. (2006). University of
amsterdam at inex 2005: Interactive track. InAdvances in XML Information Retrieval and
Evaluation: Fourth Workshop of the INitiative for the Evaluation of XML Retrieval (INEX
2005), Dagstuhl 28-30 November 2005, Lecture Notes in Computer Science.
[Kaszkiel and Zobel, 2001]Kaszkiel, M. and Zobel, J. (2001). Effective ranking with arbi-
trary passages.J. Am. Soc. Inf. Sci. Technol., 52(4):344–364.
[Kazai, 2007] Kazai, G. (2007). Search and navigation in structured document retrieval: Com-
parison of user behaviour in search on document passages and xml elements. InProceedings
of the 12th Australian Document Computing Symposium (ADCS).
[Kazai et al., 2004]Kazai, G., Masood, S., and Lalmas, M. (2004). A study of the assessment
of relevance for the inex’02 test collection. In26th European Colloquium on Information
Retrieval Research, ECIR’2004, University of Sunderland, UK.
[Kazai and Trotman, 2007]Kazai, G. and Trotman, A. (2007). Users’ perspectives on the
usefulness of structure for xml information retrieval. InProceedings of the 1st International
Conference on the Theory of Information Retrieval (ICTIR).
[Kelly, 2004] Kelly, D. (2004). Understanding implicit feedback and document preference: a
naturalistic user study.SIGIR Forum, 38(1):77.
[Kelly and Belkin, 2001]Kelly, D. and Belkin, N. J. (2001). Reading time, scrolling and
interaction: Exploring implicit sources of user preference for relevance feedback. InPro-
ceedings of the 24th Annual International ACM Conference on Research and Development
in Information Retrieval (SIGIR ’01), pages 408–409.
[Kelly et al., 2005] Kelly, D., Dollu, V. D., and Fu, X. (2005). The loquacious user: a
document-independent source of terms for query expansion. InSIGIR ’05: Proceedings
of the 28th annual international ACM SIGIR conference on Research and development in
information retrieval, pages 457–464, New York, NY, USA. ACM.
[Kelly and Teevan, 2003]Kelly, D. and Teevan, J. (2003). Implicit feedback for inferring user
preference: a bibliography.SIGIR Forum, 37(2):18–28.
148
Page 161
Bibliography
[Kim et al., 2001] Kim, J., Oard, D. W., and Romanik, K. (2001). User modeling for infor-
mation access based on implicit feedback. InProceedings of ISKO-France 2001.
[Koenemann and Belkin, 1996]Koenemann, J. and Belkin, N. J. (1996). A case for interac-
tion: A study of interactive information retrieval behavior and effectiveness. InCHI, pages
205–212.
[Konstan et al., 1997]Konstan, J. A., Miller, B. N., Maltz, D., Herlocker, J. L., Gordon, L. R.,
and Riedl, J. (1997). GroupLens: applying collaborative filtering to usenet news.Commu-
nications of the ACM, 40(3):77–87.
[Krause, 1995]Krause, J. (1995). Das WOB-modell. Research Report 1, Informationszen-
trum Sozialwissenschaften, Bonn.
[Kriewel, 2001] Kriewel, S. (2001). Visualisierung fur retrieval von XML-dokumenten. Mas-
ter’s thesis, University of Dortmund, CS Dept.
[Krikelas, 1983] Krikelas, J. (1983). Information seeking behaviour: Patterns and concepts.
In Drexel Library Quarterly, volume 19, pages 5–20.
[Kuhlthau, 1991]Kuhlthau, C. C. (1991). Inside the search process: Information seeking from
the user’s perspective.Journal of the American Society for Information Science, 42(5):361–
371.
[Lalmas and Tombros, 2007]Lalmas, M. and Tombros, A. (2007). Inex 2002 - 2006: Under-
standing xml retrieval evaluation. InDELOS Conference, pages 187–196.
[Lamping et al., 1995]Lamping, J., Rao, R., and Pirolli, P. (1995). A focus+context technique
based on hyperbolic geometry for visualizing large hierarchies. InProc. ACM Conf. Human
Factors in Computing Systems, CHI, pages 401–408. ACM.
[Lancaster, 1968]Lancaster, F. W. (1968).Information Retrieval Systems: Characteristics,
Testing, and Evaluation. Wiley, New York et al.
[Larsen, 2004]Larsen, B. (2004).References and Citations in Automatic Indexing and Re-
trieval Systems: Experiments with the Boomerang Effect. PhD thesis, The Royal School of
LIS, Copenhagen DK.http://www.db.dk/blar/dissertation.
[Larsen et al., 2006]Larsen, B., Malik, S., and Tombros, A. (2006). The interactive track at
INEX 2005. InAdvances in XML Information Retrieval and Evaluation: Fourth Workshop
of the Initiative for the Evaluation of XML Retrieval (INEX 2005), pages 398–410.
[Larsen et al., 2008]Larsen, B., Malik, S., and Tombros, A. (2008). A comparison of interac-
tive and ad-hoc relevance assessments. pages 348–358.
149
Page 162
Bibliography
[Larsen et al., 2005]Larsen, B., Tombros, A., and Malik, S. (2005). Obtru-
siveness and relevance assessment in interactive xml ir experiments. InPro-
ceedings of the INEX 2005 Workshop on Element Retrieval Methodology.
http://www.cs.otago.ac.nz/inexmw/proceedings.pdf.
[Leung and Aerley, 1994]Leung, Y. K. and Aerley, M. D. (1994). A review and taxonomy
of distortion-oriented presentation techniques.ACM Transactions on Computer-Human
Interaction, 1(2):126–160.
[Lund et al., 2006]Lund, B. R., Schneider, J. W., and Ingwersen, P. (2006). Impact of rel-
evance intensity in test topics on ir performance in polyrepresentative exploratory search
systems. InEvaluating Exploratory Search Systems, Proceedings of the SIGIR 2006 EESS
Workshop.
[Luu, 2007] Luu, U. P. (2007). Effective support for query formulation and reformulation.
Master’s thesis, Universitat Duisburg-Essen.
[Malik et al., 2006] Malik, S., Klas, C.-P., Fuhr, N., Larsen, B., and Tombros, A. (2006). De-
signing a user interface for interactive retrieval of structured documents — lessons learned
from the inex interactive track. InProc. European Conference on Digital Libraries.
[Manning et al., 2008]Manning, C. D., Raghavan, P., and Schı¿12tze, H. (2008).Introduction
to Information Retrieval. Cambridge University Press.
[Marchal, 2000]Marchal, B. (2000).XML by Example. QUE.
[Marchionini, 1989] Marchionini, G. (1989). Information-seeking strategies of novices us-
ing a full-text electronic encyclopedia.Journal of the American Society for Information
Science, 40(1):54–66.
[Marchionini, 1995] Marchionini, G. (1995).Information seeking in electronic environments.
Cambridge University Press, New York, NY, USA.
[Moe et al., 2007]Moe, K. K., Jensen, J. M., and Larsen, B. (2007). A qualitative look at
eye-tracking for implicit relevance feedback. InCIR.
[Morita and Shinoda, 1994]Morita, M. and Shinoda, Y. (1994). Information filtering based on
user behaviour analysis and best match text retrieval. In [Croft and van Rijsbergen, 1994],
pages 272–281.
[Nichols, 1998] Nichols, D. (1998). Implicit rating and filtering. InProceedings of 5th DE-
LOS Workshop on Filtering and Collaborative Filtering, pages 31–36. ERCIM.
[Oard and Kim, 2001]Oard, D. and Kim, J. (2001). Modeling information content using
observable behavior.
150
Page 163
Bibliography
[O’Day and Jeffries, 1993]O’Day, V. L. and Jeffries, R. (1993). Orienting in an information
landscape: How information seekers get from here to there. InProc. of the INTERCHI ’93,
pages 438–445. IOS Press.
[Pehcevski et al., 2005]Pehcevski, J., Thom, J. A., and Vercoustre, A. (2005). Users and
assessors in the context of inex: Are relevance dimensions relevant? InProceedings of the
INEX 2005 Workshop on Element Retrieval Methodology held at the University of Glasgow.,
pages 47–62.
[Pharo, 2008]Pharo, N. (2008). The effect of granularity and order in xml element retrieval.
Inf. Process. Manage., 44(5):1732–1740.
[Pharo and Nordlie, 2005]Pharo, N. and Nordlie, R. (2005). Context matters: An analysis of
assessments of xml documents. InCoLIS, pages 238–248.
[Piwowarski, 2006]Piwowarski, B. (2006). Eprum metrics and inex 2005. In Fuhr, N., Lal-
mas, M., Malik, S., and Kazai, G., editors,Advances in XML Information Retrieval and
Evaluation: Fourth Workshop of the INitiative for the Evaluation of XML Retrieval (INEX
2005). Springer-Verlag.
[Ponte and Croft, 1997]Ponte, J. M. and Croft, W. B. (1997). Text segmentation by topic. In
European Conference on Digital Libraries, pages 113–125.
[Ponte and Croft, 1998]Ponte, J. M. and Croft, W. B. (1998). A language modeling approach
to information retrieval. In [Croft et al., 1998], pages 275–281.
[R Development Core Team, 2006]R Development Core Team (2006).R: A Language and
Environment for Statistical Computing. R Foundation for Statistical Computing, Vienna,
Austria. ISBN 3-900051-07-0.
[Ramırez and de Vries, 2006]Ramırez, G. and de Vries, A. P. (2006). Relevant contextual
features in xml retrieval. InIIiX: Proceedings of the 1st international conference on Infor-
mation interaction in context, pages 56–65, New York, NY, USA. ACM.
[Remde et al., 1987]Remde, J. R., Gomez, L. M., and Landauer, T. K. (1987). Superbook:
An automatic tool for information exploration - hypertext? InHypertext, pages 175–188.
[Rieh and Xie, 2006]Rieh, S. Y. and Xie, H. I. (2006). Analysis of multiple query reformu-
lations on the web: The interactive information retrieval context.Inf. Process. Manage.,
42(3):751–768.
[Robins, 1997]Robins, D. (1997). Shifts on focus in information retrieval interaction. Tech-
nical report.http://www.asis.org/annual-97/shifts.htm.
151
Page 164
Bibliography
[Robins, 2000]Robins, D. (2000). Interactive information retrieval:context and basic
notation. Information Science, 3(2):57–61. http://inform.nu/Articles/Vol3/
v3n2p57-62.pd.
[Salton et al., 1993]Salton, G., Allan, J., and Buckley, C. (1993). Approaches to passage
retrieval in full text information systems. InSIGIR ’93: Proceedings of the 16th annual in-
ternational ACM SIGIR conference on Research and development in information retrieval,
pages 49–58, New York, NY, USA. ACM.
[Salton and Buckley, 1990]Salton, G. and Buckley, C. (1990). Improving retrieval perfor-
mance by relevance feedback.Journal of the American Society for Information Science,
41(4):288–297.
[Salton et al., 1975]Salton, G., Wong, A., and Yang, C. S. (1975). A vector space model for
automatic indexing.Communications of the ACM, 18:613–620.
[Sanderson and Croft, 1999]Sanderson, M. and Croft, B. (1999). Deriving concept hierar-
chies from text. InProceedings of the 22nd International Conference on Research and
Development in Information Retrieval, pages 206–213, New York. ACM.
[Saracevic, 1996]Saracevic, T. (1996). Modeling interaction in information retrieval. In
Proceedings of the American Society for Information Science, volume 33, pages 3–9.http:
//www.scils.rutgers.edu/˜tefko/articles.htm.
[Saracevic, 1997]Saracevic, T. (1997). The stratified model of information retrieval interac-
tion: Extension and application. InProceedings of the American Society for Information
Science, volume 34, pages 313–327.
[Schaefer et al., 2005]Schaefer, A., Jordan, M., Klas, C.-P., and Fuhr, N. (2005). Active sup-
port for query formulation in virtual digital libraries: A case study with DAFFODIL. In
Rauber, A., Christodoulakis, C., and Tjoa, A. M., editors,Research and Advanced Technol-
ogy for Digital Libraries. Proc. European Conference on Digital Libraries (ECDL 2005),
Lecture Notes in Computer Science, Heidelberg et al. Springer.
[Schamber et al., 1990]Schamber, L., Eisenberg, M., and Nilan, M. S. (1990). A re-
examination of relevance: toward a dynamic, situational definition.Inf. Process. Manage.,
26(6):755–776.
[Schatz et al., 1996]Schatz, B., Chen, H., Mischo, W. H., Cole, T. W., Hardin, J. B., and
Bishop, A. P. (1996). Federation diverse collections of scientific literature.Computer,
29(5):28–36.
[Schenkel et al., 2007]Schenkel, R., Suchanek, F. M., and Kasneci, G. (2007). Yawn: A
semantically annotated wikipedia xml corpus. InBTW, pages 277–291.
152
Page 165
Bibliography
[Seo and Zhang, 2000]Seo, Y.-W. and Zhang, B.-T. (2000). Learning user’s preferences by
analyzing web-browsing behaviors. InInternational Conference on Autonomous Agents
2000, pages 381–387.
[Shneiderman, 1992]Shneiderman, B. (1992). Tree visualization with tree-maps: A 2-d
space-filling approach.ACM Transactions on Graphics, 11(1):92–99.
[Skov et al., 2006]Skov, M., Larsen, B., and Ingwersen, P. (2006). Inter and intra-document
contexts applied in polyrepresentation. InIIiX: Proceedings of the 1st international confer-
ence on Information interaction in context, pages 97–101, New York, NY, USA. ACM.
[Spink, 1997] Spink, A. (1997). Study of interactive feedback during mediated information
retrieval. 48:382–394.
[Spink and Losee, 1996]Spink, A. and Losee, R. M. (1996). Feedback in information re-
trieval. pages 33–78.
[Spink et al., 2002]Spink, A., Wilson, T. D., Ford, N., Foster, A., and Ellis, D. (2002). Infor-
mation seeking and mediated searching study. part 3: successive searching.Journal of the
American Society for Information Science and Technology, 53(9):716–727.
[Stevens, 1993]Stevens, F. C. (1993).Knowledge-based assistance for accessing large,
poorly structured information spaces. PhD thesis, Boulder, CO, USA.
[Sugar, 1995]Sugar, W. (1995). User-centered perspective of information retrieval research
and analysis methods.Annual review of information science and technology, pages 77–109.
[Swanson, 1977]Swanson, D. R. (1977). Information retrieval as a trial-and-error process.
Library Quarterly, 47(2):128–148.
[Taylor, 1962] Taylor, R. S. (1962). The process of asking questions. 13:391–396.
[Terra and Clarke, 2003]Terra, E. and Clarke, C. L. A. (2003). Frequency estimates for statis-
tical word similarity measures. InNAACL ’03: Proceedings of the 2003 Conference of the
North American Chapter of the Association for Computational Linguistics on Human Lan-
guage Technology, pages 165–172, Morristown, NJ, USA. Association for Computational
Linguistics.
[Teufel and Moens, 1997]Teufel, S. and Moens, M. (1997). Sentence extraction as a classifi-
cation task.
[Theobald et al., 2005]Theobald, M., Schenkel, R., and Weikum, G. (2005). An efficient and
versatile query engine for topx search. InVLDB, pages 625–636. ACM.
153
Page 166
Bibliography
[Tombros et al., 2005a]Tombros, A., Larsen, B., and Malik, S. (2005a). The interac-
tive track at INEX 2004. In Fuhr, N., Lalmas, M., Malik, S., and Szlavik, Z., edi-
tors, Advances in XML Information Retrieval: Third International Workshop of the Ini-
tiative for the Evaluation of XML Retrieval, INEX 2004, Dagstuhl Castle, Germany,
December 6-8, 2004, Revised Selected Papers, volume 3493. Springer-Verlag GmbH.
http://www.springeronline.com/3-540-26166-4.
[Tombros et al., 2005b]Tombros, A., Malik, S., and Larsen, B. (2005b). Report on the INEX
2004 interactive track.SIGIR Forum, 39(1). http://www.sigir.org/forum/2005J/
tombros_sigirforum_2005j.pdf.
[Tombros et al., 2005c]Tombros, A., Ruthven, I., and Jose, J. M. (2005c). How users assess
web pages for information seeking.JASIST, 56(4):327–344.
[Tombros and Sanderson, 1998]Tombros, A. and Sanderson, M. (1998). Advantages of query
biased summaries in information retrieval. In [Croft et al., 1998], pages 2–10.
[Toms et al., 2003]Toms, E. G., Freund, L., Kopak, R., and Bartlett, J. C. (2003). The effect
of task domain on search. InCASCON ’03: Proceedings of the 2003 conference of the
Centre for Advanced Studies on Collaborative research, pages 303–312. IBM Press.
[Trotman and Geva, 2006]Trotman, A. and Geva, S. (2006). Passage retrieval and other xml-
retrieval tasks. InSIGIR 2006 Workshop on XML Element Retrieval Methodology, pages
43–49.
[Trotman and Lalmas, 2005]Trotman, A. and Lalmas, M. (2005). Report on the inex 2005
workshop on element retrieval methodology.SIGIR Forum, 39(2):46–51.
[Trotman and Sigurbjornosson, 2004]Trotman, A. and Sigurbjornosson, B. (2004). NEXI,
now and next.
[Turpin and Hersh, 2001]Turpin, A. H. and Hersh, W. (2001). Why batch and user evalua-
tions do not give the same results. In Croft, W. B., Harper, D., Kraft, D. H., and Zobel, J.,
editors,Proceedings of the 24th Annual International Conference on Research and devel-
opment in Information Retrieval, pages 225–231, New York. ACM Press.
[Tweedie et al., 1994]Tweedie, L., Spence, B., Williams, D., and Bhogal, R. (1994). The
attribute explorer. InConference companion on Human factors in computing systems, pages
435–436. ACM Press.
[Vakkari, 2003] Vakkari, P. (2003). Task-based information searching. 37:413–464.
[van Rijsbergen, 1979]van Rijsbergen, C. J. (1979).Information Retrieval. Butterworths,
London, 2. edition.
154
Page 167
Bibliography
[van Rijsbergen, 1986]van Rijsbergen, C. J. (1986). A non-classical logic for information
retrieval.The Computer Journal, 29(6):481–485.
[van Zwol et al., 2006a]van Zwol, R., Baas, J., van Oostendorp, H., and Wiering, F. (2006a).
Bricks: The building blocks to tackle query formulation in structured document retrieval.
In ECIR, pages 314–325.
[van Zwol et al., 2006b]van Zwol, R., Kazai, G., and Lalmas, M. (2006b). Inex 2005 multi-
media track. InAdvances in XML Information Retrieval and Evaluation: Fourth Workshop
of the Initiative for the Evaluation of XML Retrieval (INEX 2005).
[Voorhees and Harman, 2000]Voorhees, E. and Harman, D. (2000). Overview of the eighth
Text REtrieval Conference (TREC-8). InThe Eighth Text REtrieval Conference (TREC-8),
pages 1–24. NIST, Gaithersburg, MD, USA.
[White et al., 2004]White, R., Jose, J. M., van Rijsbergen, C., and Ruthven, I. (2004). A
simulated study of implicit feedback models. In28th European Conference on Information
Retrieval Research (ECIR 2004).
[White et al., 2002]White, R., Ruthven, I., and Jose, J. M. (2002). The use of implicit evi-
dence for relevance feedback in web retrieval. InProceedings of the 24th BCS-IRSG Euro-
pean Colloquium on IR Research, pages 93–109, London, UK. Springer-Verlag.
[White, 2004] White, R. W. (2004).Implicit Feedback for Interactive Information Retrieval.
PhD thesis, University of Glasgow.
[White et al., 2003]White, R. W., Jose, J. M., and Ruthven, I. (2003). Adapting to evolving
needs: Evaluating a behaviour-based search interface. In Gray, P., Johnson, H., and O’eil,
E., editors,Proceedings of HCI 2003: Designing for Society, volume 2, pages 125–128.
[Wilson, 1999] Wilson, T. D. (1999). Models in information behaviour research.Jour-
nal of Documentation, 55(3):249–270.http://informationr.net/tdw/publ/papers/
1999JDoc.html.
[Witten and Frank, 2005]Witten, I. H. and Frank, E. (2005).Data Mining: Practical Machine
Learning Tools and Techniques. Morgan Kaufmann, 2nd edition.
[Witten et al., 1999]Witten, I. H., Paynter, G. W., Frank, E., Gutwin, C., and Nevill-Manning,
C. G. (1999). Kea: practical automatic keyphrase extraction. InDL ’99: Proceedings of the
fourth ACM conference on Digital libraries, pages 254–255, New York, NY, USA. ACM.
[Woodruff et al., 2002]Woodruff, A., Rosenholtz, R., Morrison, J. B., Faulring, A., and
Pirolli, P. (2002). A comparison of the use of text summaries, plain thumbnails, and en-
hanced thumbnails for web search tasks.J. Am. Soc. Inf. Sci. Technol., 53(2):172–185.
155
Page 168
Bibliography
[Wooldridge and Jennings, 1995]Wooldridge, M. and Jennings, N. R., editors (1995).Intel-
ligent Agents: Theories, Architectures, and Languages. Springer, Heidelberg et al.
[Xu and Croft, 2000]Xu, J. and Croft, W. B. (2000). Improving the effectiveness of infor-
mation retrieval with local context analysis.ACM Transactions on Information Systems,
18(1):79–112.
[Zobel et al., 1995]Zobel, J., Moffat, A., Wilkinson, R., and Sacks-Davis, R. (1995). Efficient
retrieval of partial documents.Information Processing and Management, 31(3):361–377.
156
Page 169
Part
Appendices
157
Page 171
A iTrack 2004
A.1 Questionnaires
i
Page 172
Page 1 of 2
Q1
To be filled in by the experimenter
Participating site: Searcher ID:
Searcher condition: BC / CB
Before-experiment Questionnaire
1. Initials:
2. Age: 3. Gender (Please circle)
Male / Female
4. What is your first language?
5. Occupation:
6. What university degrees, minor or majors do you have or plan to take in the near future (if any)?
Degree/major Year __________________________________________________ _______ __________________________________________________ _______ __________________________________________________ _______
__________________________________________________ _______ 7. Have you participated in previous on-line searching studies, as
Experimenter Yes Test person Yes
No No
8. Overall, how many years have you been doing on-line searching? ________ years
More questions on the next page
A iTrack 2004
ii
Page 173
Page 2 of 2
Q1
Please, circle the number closest to your experience:
How much experience have you had
No experience Some
experience A great deal of
experience 9. Searching on computerised library catalogues either locally (e.g. your library) or remotely (e.g. Library of Congress)
1 2 3 4 5
10. Searching on digital libraries of scientific articles (e.g. ACM Digital Library)
1 2 3 4 5
11. Searching on WWW search engines 1 2 3 4 5
12. Searching on other systems, please specify the system on the line:
____________________
1 2 3 4 5
13. Reading or accessing journals and magazines published by the Institute of Electrical and Electronics Engineers (IEEE)
1 2 3 4 5
Please circle the number most appropriate to your searching behaviour:
Never Once or
twice a year
Once or twice a month
Once or twice a week
One or more times
a day
14. How often do you perform a search on any kind of system?
1 2 3 4 5
Please circle the number that best indicates to what extent you agree with the following statement:
Strongly disagree Disagree Neutral Agree Strongly
agree
15. I enjoy carrying out information searches
1 2 3 4 5
A.1 Questionnaires
iii
Page 174
Page 1 of 1
Q2
To be filled in by the experimenter
Participating site: Searcher ID:
Searcher condition: BC / CB Task ID: B1 B2 C1 C2
Before-each-task Questionnaire
Please circle the number that best indicates your perception of the task you have chosen:
Not at all Somewhat Extremely
1. Are you familiar with the given task? 1 2 3 4 5
2. Do you think it will be easy for you to search on this task?
1 2 3 4 5
A iTrack 2004
iv
Page 175
Page 1 of 2
Q3
To be filled in by the experimenter
Participating site: Searcher ID:
Searcher condition: BC / CB Task ID: B1 B2 C1 C2
After-each-task Questionnaire
Please circle the number which best corresponds to your opinion:
Not at all Somewhat Extremely
1. Was it easy to get started on this search? 1 2 3 4 5
2. Was it easy to do the search on the given task? 1 2 3 4 5
3. Are you satisfied with your search results? 1 2 3 4 5
4. Do you feel that the task has been fulfilled? 1 2 3 4 5
5. Do you feel that the search task was clear? 1 2 3 4 5
6. Was the search task interesting to you? 1 2 3 4 5
7. Did you know a lot about the topic of the task in advance?
1 2 3 4 5
8. Did you have enough time to do an effective search?
1 2 3 4 5
Please circle the number which best corresponds to the searching experience you just had:
Not at all Somewhat Extremely
9. How well did the system support you in this task? 1 2 3 4 5
More questions on the next page
A.1 Questionnaires
v
Page 176
Page 2 of 2
Q3
Please circle the number which best corresponds to your views on the information presented to you by the system:
Not at all Somewhat Extremely
10. On average, how relevant to the search task was the information presented to you?
1 2 3 4 5
11. In what ways (if any) did you find the system interface useful in this task? 12. In what ways (if any) did you find the system interface not useful in this task?
Please continue overleaf if necessary
A iTrack 2004
vi
Page 177
Page 1 of 2
Q4
To be filled in by the experimenter
Participating site: Searcher ID:
Searcher condition: BC / CB
Post-experiment Questionnaire
1. Please put the two search tasks you performed in order of difficulty:
- Most difficult: - Less difficult:
Please circle the number better corresponding to your view on the questions:
Not at all Somewhat Extremely
2. How understandable were the tasks? 1 2 3 4 5
3. To what extent did you find the tasks similar to other searching tasks that you typically perform?
1 2 3 4 5
4. How easy was it to learn to use the system? 1 2 3 4 5
5. How easy was it to use the system? 1 2 3 4 5
6. How well did you understand how to use the system?
1 2 3 4 5
More questions on the next page
A.1 Questionnaires
vii
Page 178
Page 2 of 2
Q4
7. What did you like about the search system? 8. What did you dislike about the search system?
9. Do you have any general comments?
Thank you for your help!!!
Please continue overleaf if necessary
A iTrack 2004
viii
Page 179
A.2 Tasks
A.2 Tasks
ix
Page 180
Task category: B Please select one of the following two tasks: Task ID: B1 You are writing a large article discussing virtual reality (VR) applications and you need to discuss their negative side effects. What you want to know is the symptoms associated with cybersickness, the amount of users who get them, and the VR situations where they occur. You are not interested in the use of VR in therapeutic treatments unless they discuss VR side effects. Task ID: B2 You have tried to buy & download electronic books (ebooks) just to discover that problems arise when you use the ebooks on different PC's, or when you want to copy the ebooks to Personal Digital Assistants. The worst disturbance factor is that the content is not accessible after a few tries, because an invisible counter reaches a maximum number of attempts. As ebooks exist in various formats and with different copy protection schemes, you would like to find articles, or parts of articles, which discuss various proprietary and covert methods of protection. You would also be interested in articles, or parts of articles, with a special focus on various disturbance factors surrounding ebook copyrights.
A iTrack 2004
x
Page 181
Task category: C Please select one of the following two tasks: Task ID: C1 You have been asked to make your Fortran compiler compatible with Fortran 90, and so you are interested in the features Fortran 90 added to the Fortran standard before it. You would like to know about compilers, especially compilers whose source code might be available. Discussion of people's experience with these features when they were new to them is also of interest. Task ID: C2 You are working on a project to develop a next generation version of a software system. You are trying to decide on the benefits and problems of implementation in a number of programming languages, but particularly Java and Python. You would like a good comparison of these for application development. You would like to see comparisons of Python and Java for developing large applications. You want to see articles, or parts of articles, that discuss the positive and negative aspects of the languages. Things that discuss either language with respect to application development may be also partially useful to you. Ideally, you would be looking for items that are discussing both efficiency of development and efficiency of execution time for applications.
A.2 Tasks
xi
Page 183
B iTrack 2005
B.1 Questionnaires
xiii
Page 184
Page 1 of 3
To be filled in by the experimenter
Participating site: Searcher ID:
Rotation: 1 2 3 4 5 6
Before-experiment Questionnaire
1. Initials:
2. Age:
3. Gender (Please circle)
Male / Female
4. What is your first language?
5. Current occupation:
6. What university degrees, minor or majors do you have or plan to take in the near future (if any)?
Degree/major Year
__________________________________________________ _______
__________________________________________________ _______
__________________________________________________ _______
__________________________________________________ _______
7. Have you participated in previous on-line searching studies, as
Experimenter Yes Test person Yes No No
8. Overall, how many years have you been doing on-line searching? ________ years
INEX2005 Interactive TrackQ1
More questions on the next page
B iTrack 2005
xiv
Page 185
Page 2 of 3
Please, circle the number closest to your experience:
How much experience have you had
No experience
Some experience
A great deal of
experience
9. Searching on computerised library catalogues either locally (e.g. your library) or remotely (e.g. Library of Congress)
1 2 3 4 5
10. Searching on digital libraries of scientific articles (e.g. ACM Digital Library)
1 2 3 4 5
11. Searching on WWW search engines
1 2 3 4 5
12. Searching on other systems, please specify the system(s) on the lines below:
____________________
____________________
1 2 3 4 5
13. Reading or accessing journals and magazines published by the Institute of Electrical and Electronics Engineers (IEEE)
1 2 3 4 5
Please circle the number most appropriate to your searching behaviour:
NeverOnce or
twice a year
Once or twice a month
Once or twice a week
One or more times
a day
14. How often do you perform a search on any kind of system?
1 2 3 4 5
Please circle the number that best indicates to what extent you agree with the following statement:
Strongly disagree
Disagree Neutral AgreeStrongly
agree
15. I enjoy carrying out information searches
1 2 3 4 5
INEX2005 Interactive TrackQ1
B.1 Questionnaires
xv
Page 186
Page 1 of 1
To be filled in by the experimenter
Participating site: Searcher ID:
Rotation: 1 2 3 4 5 6 Task: G1 G2 G3 C1 C2 C3 Own
Before-each-task Questionnaire
Please circle the number that best indicates your perception of the task you have chosen:
Not at all Somewhat Extremely
1. Are you familiar with the topic of the given task?
1 2 3 4 5
2. Do you think it will be easy for you to search on this task?
1 2 3 4 5
Please circle the number that best indicates your perception of the task you have chosen:
Long, e.g., a whole article
Medium, e.g., a
section in an article
Short, e.g., a single
paragraph
3. How large would you expect an ideal answer to be?
1 2 3 4 5
4. Do you expect that a single answer/piece of information/..? will be enough for your task?
Yes, the answer can probably be found within a single piece of information.
No, I expect that I will have to combine pieces of information from many sources to solve the task.
INEX2005 Interactive TrackQ2
B iTrack 2005
xvi
Page 187
Page 1 of 2
To be filled in by the experimenter
Participating site: Searcher ID:
Rotation: 1 2 3 4 5 6 Task: G1 G2 G3 C1 C2 C3 Own
After-each-task Questionnaire
Please circle the number which best corresponds to your opinion: Not at
allSomewhat Extremely
1. Was it easy to get started on this search?
1 2 3 4 5
2. Was it easy to do the search on the given task?
1 2 3 4 5
3. Are you satisfied with your search results?
1 2 3 4 5
4. Do you feel that the task has been fulfilled?
1 2 3 4 5
5. Do you feel that the search task was clear?
1 2 3 4 5
6. Was the search task interesting to you?
1 2 3 4 5
7. Did you know a lot about the topic of the task in advance?
1 2 3 4 5
8. Did you have enough time to do an effective search?
1 2 3 4 5
Please circle the number which best corresponds to the searching experience you just had:Not at
allSomewhat Extremely
9. How well did the system support you in this task?
1 2 3 4 5
INEX2005 Interactive TrackQ3
More questions on the next page
B.1 Questionnaires
xvii
Page 188
Page 2 of 2
Please circle the number which best corresponds to your views on the information presented to you by the system:
14. Was a single answer/piece of information/..? enough to solve your task?
Yes, the task could be solved with a single piece of information.
No, I had to combine pieces of information from many sources to solve the task.
15. In what ways (if any) did you find the system interface useful in this task?
16. In what ways (if any) did you find the system interface not useful in this task?
INEX2005 Interactive TrackQ3
Not at all
Somewhat Extremely
10. On average, how relevant to the search task was the information presented to you?
1 2 3 4 5
11. Did you in general find the presentation in the result list useful?
1 2 3 4 5
12. Did you find the parts of the documents in the result list useful?
1 2 3 4 5
13. Did you find the Table of Contents in the Full Text view useful?
1 2 3 4 5
Please continue overleaf if necessary
B iTrack 2005
xviii
Page 189
Page 1 of 2
To be filled in by the experimenter
Participating site: Searcher ID:
Rotation: 1 2 3 4 5 6
Post-experiment Questionnaire
1. Please rank the three tasks you have worked in relation to their difficulty:
- Most difficult:
- Middle difficult:
- Least difficult:
Please circle the number better corresponding to your view on the questions:Not at
allSomewhat Extremely
2. How understandable were the tasks?
1 2 3 4 5
3. To what extent did you find the tasks similar to other searching tasks that you typically perform?
1 2 3 4 5
4. How easy was it to learn to use the system?
1 2 3 4 5
5. How easy was it to use the system?
1 2 3 4 5
6. How well did you understand how to use the system?
1 2 3 4 5
INEX2005 Interactive TrackQ4 More questions on the next page
B.1 Questionnaires
xix
Page 190
Page 2 of 2
7. What did you like about the search system?
8. What did you dislike about the search system?
9. Do you have any general comments?
Thank you for your help!!!
INEX2005 Interactive TrackQ4 Please continue overleaf if necessary
B iTrack 2005
xx
Page 191
B.2 Tasks
B.2 Tasks
xxi
Page 192
Please select one of the following tasks:
Task ID: C1
One of your friends has recently bought a small handheld Global Positioning System (GPS) unit, and the possibilities offered by this technology have caught your interest. You would like to explore new killer applications for mobile devices. Therefore, you are looking for examples and descriptions of applications that use GPS, for devices such as mobile phones, PDAs (Personal Desktop Assistants) and other wireless and mobile devices.
Find, for instance, information that discusses examples of how applications that use GPS can be used to accomplish new tasks or provide new services.
Task ID: C2
In your daily work you sign on to a range of different systems both locally and remotely. On many of them you have different user IDs and different passwords, and you find it annoying to have to verify your identity again and again. In addition, you find it demanding to maintain all these IDs and passwords and to keep them secure. You have heard about LDAP (Lightweight Directory Access Protocol) and other single sign-on procedures, and wish to learn more about them to assess the potentials for creating a single sign-on procedure for your local network (with both Unix, Linux, PC and Mac platforms).
Find, for instance, information that discusses single sign-on procedures, or state of the art user-authentication methods.
Task ID: C3
Data security and authenticity is an important issue at your work place. One approach to ensure data authenticity is the so-called “steganography” where data is embedded in various media files like images, sound files, video files and so on. A commonly used data embedding technique is Watermarking where data can be effectively hidden in a file without the changes being visible to the common person. You want to learn more about Watermarking as a technique for data embedding that will enable you to verify the authenticity of a file.
Find, for instance, information that discusses the use of Watermarking techniques to hide information that will allow later validation of a files authenticity.
INEX2005 Interactive Track Page 1 of 1IEEE CS tasks, Category “C”
B iTrack 2005
xxii
Page 193
Please select one of the following tasks:
Task ID: G1
New anti-terrorism laws allow intelligence agencies like the FBI (Federal Bureau of Investigation) and CIA (Central Intelligence Agency) to monitor computer communications to spot suspected criminals and terrorists. You would like to find information about how this affects your own and other people’s privacy and to know what concerns have been raised.
Find, for instance, information that discusses the Carnivore or Echelon projects or other similar surveillance of computer communication.
Task ID: G2
Your department has produced a Linux-program and it is being discussed whether to release it under a public license such as GNU or GPL (General Public License). Therefore, you have been asked to find information about the implications of releasing the code under a public license as an open source program.
Find, for instance, information that discusses different licensing schemes or articles about the impact of open source programs.
Task ID: G3
Video games are being played by an ever increasing number of people of all ages, and the game industry is becoming a major economic player. You would therefore like to find non-technical information about how video games have affected people’s lives as well as how the games have changed the entertainment industry.
Find, for instance, information discussing the concerns that playing video games may lead to a rise in violent behaviour, or information about the effect of video games on the film industry.
INEX2005 Interactive Track Page 1 of 1Tasks, Category “G”
B.2 Tasks
xxiii
Page 195
C iTrack 2006-07
C.1 Search tasks
The twelve tasks are split into three different types:
• Fact finding, where the objective is to find “specific accurate or correct information or
physical things that can be grouped into classes or categories for easy reference.”.
• Information gathering, where the objective is to collect miscellaneous information about
a topic
• Decision making, where the objective is to select a course of action from among multiple
alternatives
The tasks are also split into two categories, depending on the “structure” of the search task:
• Parallel, where the search uses multiple concepts that exist on the same level in a con-
ceptual hierarchy; this is a breadth search (and in a traditional Boolean likely was a
series of OR relationships)
• Hierarchical, where the search uses a single concept for which multiple attributes or
characteristics are sought; this is a depth search, that is a single topic explored more
widely Each task also has an associated domain, which is the broad subject area to
which a topic belongs.
TableC.1shows the tasks on the base of this classifications:
ID Task Domain Type Structure
xxv
Page 196
C iTrack 2006-07
1
Your community is contemplating building
a bridge across a span of water measuring
1000 M in order to ease traffic congestion.
There will be a presentation this evening
about the type of bridge proposed for the
project. To date, many types of bridges have
been discussed: “folding bridge,“ “suspen-
sion bridge,“ ”retractable bridge,” and “bas-
cule bridge”. In order to be well informed
when you attend the meeting, you need infor-
mation on what type of bridge would best suit
the community’s needs, bearing in mind that
the solution must accommodate vehicles and
be sturdy enough to withstand a body of water
that can be rough and frozen over with ice in
winter.
EngineeringDecision
MakingHierarchal
2
Your friends who have an interest in art have
been debating the French Impressionism ex-
hibit at a local art gallery. One claims that
Renoir is the best impressionist ever, while
the other argues for another. You decide
to do some research first so you can enter
the debate. You consider Degas, Monet and
Renoir to construct an argument for the one
that best represents the spirit of the impres-
sionist movement. Who will you choose and
why?
EngineeringDecision
MakingHierarchal
3
As a tourist in Paris, you have time to make
a single day-trip outside the city to see one
of the attractions in the region. Your friend
would prefer to stay in Paris, but you are try-
ing to decide between visiting the cathedral in
Chartres or the palace in Versailles, since you
have heard that both are spectacular. What in-
formation will you use to make an informed
decision and convince your friend to join you?
You should consider the history and archi-
tecture, the distance and different options for
travelling there.
TravelDecision
MakingParallel
xxvi
Page 197
C.1 Search tasks
4
As a member of a local environmental group
who is starting a campaign to save a large lo-
cal nature reserve, you want to find some in-
formation about the impact of removing the
trees (logging) for the local pulp and paper in-
dustry and mining the coal that lies beneath it.
Your group has had a major discussion about
whether logging or mining is more ecologi-
cally devastating. To add to the debate, you
do your own research to determine which side
you will support.
GeographyDecision
MakingParallel
5
A friend has just sent an email from an Inter-
net cafe in the southern USA where she is on
a hiking trip. She tells you that she has just
stepped into an anthill of small red ants and
has a large number of painful bites on her leg.
She wants to know what species of ants they
are likely to be, how dangerous they are and
what she can do about the bites. What will
you tell her?
Science Fact Finding Hierarchal
6
You enjoy eating mushrooms, especially
chanterelles, and a friend who is an amateur
mushroom picker indicates that he has found
a good source, and invites you along. He
warns you that chanterelles can be confused
with a deadly species for which there is no
known antidote. You decide that you must
know what you are looking for before you go-
ing mushroom picking. What species was he
referring to? How can you tell the difference?
Food Fact Finding Hierarchal
7
As a history buff, you have heard of the quiet
revolution, the peaceful revolution and the
velvet revolution. For a skill-testing question
to win an iPod you have been asked how they
differ from the April 19th revolution.
History Fact finding Parallel
xxvii
Page 198
C iTrack 2006-07
8
In one of your previous Web experiences, you
came across a long list of castles that covered
the globe. At the time, you noted that some
are called castles, while others are called
fortresses, and Canada unexpectedly has cas-
tles while Denmark has also fortresses! So
now you wonder: what is the difference be-
tween a fortress and a castle? So you check
the Web for a clarification, and to find a good
example of a castle and fortress in Canada and
Denmark.
History or
TravelFact finding Parallel
9
A close friend is planning to buy a car for the
first time, but is worried about fuel costs and
the impact on the environment. The friend has
asked for help in learning about options for
vehicles that are more fuel efficient and envi-
ronmentally friendly. What types of different
types of engines, manufacturers and models
of cars might be of interest to your friend?
What would be the benefits of using such ve-
hicles?
CarInfo Gather-
ingHierarchal
10 FoodInfo Gather-
ingHierarchal
11
Friends are planning to build a new house and
have heard that using solar energy panels for
heating can save a lot of money. Since they
do not know anything about home heating and
the issues involved, they have asked for your
help. You are uncertain as well, and do some
research to identify some issues that need to
be considered in deciding between more con-
ventional methods of home heating and solar
panels.
Home Heat-
ing
Info Gather-
ingParallel
xxviii
Page 199
C.2 Questionnaires
12
You just joined the citizen’s advisory commit-
tee for the city of St. John’s, Newfoundland.
With the increase in fuel costs, the city coun-
cil is contemplating supplementing its power
with alternative energy. Tidal power and wind
power are being discussed among your fellow
committee members. As you want to be fully
informed when you attend the next meeting,
you research the pros and cons of each type.
EnergyInfo Gather-
ingParallel
Table C.1:Task-Overview
C.2 Questionnaires
C.3 Query statistics
C.4 Wikipedia document ID 945748
The extracted keyphrases are java.lang, package, core, classes, exception.
xxix
Page 200
Java.lang
java.lang is the core package of the Java programming language , containing the classes thatwould be necessary for a skeletal implementation of the Java platform . With a few excep-tions, the classes in this package correspond roughly to the functionality in the C standardlibrary . In particular, java.lang contains class Object, which all other classes extend, classesnecessary for exception handling and multithreading , wrapper s for the primitive type s,and convenience classes (containing only static method s). Containers and other importantgeneral purpose utility classes are in java.util. The classes of java.lang are documented inthe Java Language Specification.When compiling Java, the package java.lang is automati-cally imported. In other words, it is redundant (but allowed) to include the statementimportjava.lang.*;
and it is usually unnecessary to fully qualify the names of these classes (for examplejava.lang.Object). Generally, you don’t need to import java.lang.
Some classes which are part of the core functionality of the Javaplatform are locatedin other packages that start with ”java.lang” (seejava.lang.annotation, java.lang.instrument,java.lang.management, java.lang.ref , and java.lang.reflect ); most of these classes, althoughimportant, are not general-purpose or commonly used by many developers.
Classes
The classes are:
• Object - all other classes extend this class
Exception handling
• Error - a serious problem that usually should not be caught within the application
• Exception - a less serious problem that the application should catch and handle
• RuntimeException - an exception that is expected to occur at runtime due to bad inputor other user error; does not need to be caught
• StackTraceElement - part of the stack trace from an exception
• Throwable - an object that can be ”thrown” for exception handling
There are also a number of specific Errors and Exceptions. These are not listed here butcan be found in the class heirarchy.
Multithreading
• Thread - a thread
• ThreadGroup - a group of threads, which may share certain properties
• ThreadLocal and InheritableThreadLocal - automatically keeps a separate value foreach thread
1
C iTrack 2006-07
xxx
Page 201
Wrappers
• Boolean - wrapper for boolean primitive type
• Character - wrapper for boolean primitive type
• Character.Subset and Character.UnicodeBlock - nested classes of Character represent-ing standard sets of characters
• Number - abstract class that is the superclass of each of the numerical type wrappers
• Byte - wrapper for byte primitive type
• Double - wrapper for double primitive type
• Float - wrapper for float primitive type
• Integer - wrapper for int primitive type
• Long - wrapper for long primitive type
• Short - wrapper for short primitive type
• Void - wrapper for void return type; cannot be instantiated
Reflection and VM management
• Class - represents a particular class, used for reflection
• ClassLoader - represents a class loader (either the default class loader for the VM or auser-defined class loader)
• Compiler - represents a Java compiler
• Package - represents a package
• Process - to control external process es
• ProcessBuilder - manages a collection of process attributes
• Runtime - allows access to certain aspects of the virtual machine
• RuntimePermission and SecurityManager - Used for security management
Convenience classes
• Math - common mathematical functions, similar to math.h in C and C++
• StrictMath - like Math, but more strictly follows floating point standards; often usedwhen reproducibility is a key requirement
• System - direct access to certain VM features and the standard input and output streams
2
C.4 Wikipedia document ID 945748
xxxi
Page 202
Strings and string processing
• String - immutablestring
• StringBuffer - mutable string
• StringBuilder - like StringBuffer, but unsynchronized
Interfaces
• Appendable
• CharSequence
• Cloneable
• Comparable
• Iterable
• Readable
• Runnable
• Thread.UncaughtExceptionHandler
Annotations
• Deprecated
• Override
• SuppressWarnings
0.0.1 Enums
• Enum - superclass of all enumerated types
• Thread.State
External links
• Class hierarchy on java.sun.com
3
C iTrack 2006-07
xxxii
Page 203
C.4 Wikipedia document ID 945748
Figure C.1:iTrack06 Before Experiment Questionnaire
xxxiii
Page 204
C iTrack 2006-07
Figure C.2:iTrack06 Before Task Questionnaire
xxxiv
Page 205
C.4 Wikipedia document ID 945748
Figure C.3:iTrack06 After Task Questionnaire
xxxv
Page 206
C iTrack 2006-07
Figure C.4:iTrack06 Post Experiment Questionnaire
xxxvi
Page 207
C.4 Wikipedia document ID 945748
Topic-ID No. of Queries1No. of query
repres.2Ratio3
sto1 39 37 1.054
sto2 54 44 1.227
sto3 145 111 1.306
sto4 24 24 1.000
sto5 127 103 1.233
sto6 60 56 1.071
sto7 38 31 1.226
sto8 155 107 1.449
sto9 122 118 1.039
sto10 116 106 1.094
sto11 66 62 1.065
sto12 19 18 1.056
1 Actual number of queries issued by searchers2 Distinct number of represented queries; after lower case conversion, stop word
removal and sorted order3 Ratio between above two
Table C.2:Task-wise queries and their representation statistics
xxxvii
Page 209
D iTrack 2008
D.1 Search tasks
D.1.1 Fact finding
1. As a frequent traveller and visitor of many airports around the world you are keen on
finding out which is the largest. You also want to know the criteria used for defining
large airports.
2. The ”Seven summits” are the highest mountains on each of the seven continents. Climb-
ing all of them is regarded as a mountaineering challenge. You would like to know which
of these summits were first climbed successfully.
3. In the recent Olympics there were a controversy over the age of some of the female gym-
nasts. You want to know what the minimum age for Olympic competitors in gymnastics.
D.1.2 Research
1. You are writing a term paper about political processes in the United States and Eu-
rope, and want to focus on the differences in the presidential elections of France and the
United States. Find material that describes the procedure of selecting the candidates for
presidential elections in the two countries.
2. Every year there are several ranking lists over the best universities in the world. These
lists are seldom similar. You are writing an article discussing and comparing the different
ranking systems and need information about the different lists and what criteria and
factors they use in their ranking.
3. You have followed the news coverage of the conflict between Russia and Georgia over
South Ossetia. You are interested in the the historic background for the conflict and
would like to find as much information about it as possible. In particular you are in-
terested in material comparing this conflict whith the parallell border conflict between
Georgia and Abkhazia.
xxxix