128
A Correlation of Interactive Science ©2016 To the Next Generation Science Standards Grades 6-8

A Correlation of
Interactive Science ©2016
To the
Next Generation Science Standards
Grades 6-8

Introduction
The following document demonstrates how Interactive Science ©2016, Grades 6-8,
supports the Next Generation Science Standards (NGSS) for Middle School. Correlation
references are to the Student Edition, Teacher Edition, Teacher Lab Resource, STEM Activity
Book, Chapter Activities and Projects book, Scenario-Based Investigations book, and online
Quest/STEMQuest and Performance Expectation activities.
Interactive Science is a middle school science program composed of twelve student
modules spanning life, earth, physical, and nature topics that makes learning personal,
engaging, and relevant for today’s student. Interactive Science features an innovative
Write-in Student Edition that enables students to become active participants in their
learning and truly connect the Big Ideas of science to their world.
Online Quests and STEMQuests are problem-based learning activities designed to support
all three parts of the NGSS framework (Disciplinary Core Ideas, Cross-Cutting Concepts,
and Science and Engineering Practices) by diving deep into real world topics at each grade
level. A focus on the Science and Engineering Practices ensure your students can apply what
they have learned to new situations and new content.
Online Performance Expectation Activities are designed to meet specific NGSS
Performance Expectations and support the associated DCI, CCC, and SEPs.
Interactive Science Modules Quest and STEMQuest Activities
Science and Technology Testing, Testing…1, 2, 3
Earth’s Structure To Hike or Not to Hike
Earth’s Surface The Big Fossil Hunt
Water and the Atmosphere Shrinking Your Carbon Footprint
Astronomy and Space Science Searching for a Star
Ecology and the Environment To Cross or Not to Cross
Cells and Heredity Funky Fruit
The Diversity of Life Construction without Destruction
Human Body Systems Peak Performance Plan
Introduction to Chemistry Hot and Cool Chemistry
Forces and Energy Keep Hot Liquids Hot
Sound and Light Design to Stop a Thief

A Correlation of Interactive Science Grades 6-8 Modules, ©2016 Digital Refreshment
to the Next Generation Science Standards for Middle School
SE = Student Edition; TE = Teacher’s Edition; TLR = Teacher’s Lab Resource 3
Table of Contents
Physical Science ..................................................................................................... 4
Life Science .......................................................................................................... 44
Earth and Space Science .......................................................................................77
Engineering, Technology, and Applications of Science ........................................121
Copyright ©2015 Pearson Education, Inc. or its affiliate(s). All rights reserved.

A Correlation of Interactive Science Grades 6-8 Modules, ©2016 Digital Refreshment
to the Next Generation Science Standards for Middle School
SE = Student Edition; TE = Teacher’s Edition; TLR = Teacher’s Lab Resource 4
MS.Structure and Properties of Matter MS-PS1-1 Students who demonstrate understanding can: Develop models to describe the atomic composition of simple molecules and extended structures.
[Clarification Statement: Emphasis is on developing models of molecules that vary in complexity. Examples of simple molecules could include
ammonia and methanol. Examples of extended structures could include sodium chloride or diamonds. Examples of molecular-level models could include drawings, 3D ball and stick structures or computer representations showing different molecules with different types of atoms.] [Assessment
Boundary: Assessment does not include valence electrons and bonding energy, discussing the ionic nature of subunits of complex structures, or a complete depiction of all individual atoms in a complex molecule or extended structure.]
INTERACTIVE SCIENCE: In the Introduction to Chemistry module, the online Performance Expectation Activity “Structure and Properties of Matter (MS-PS1-1)” addresses this performance expectation. Diagrams describing the atomic composition of methane molecules, oxygen molecules, carbon dioxide molecules, and water molecules are shown in “Figure 5: Conservation of Mass” on SE/TE
page 25 of the Introduction to Chemistry module. An overview of the concepts of atoms and molecules is included on page 10 in Chapter 1, Lesson 2, “Classifying Matter.” Models showing the atomic structure of water molecules in different phases are shown in “Figure 1: Melting” on SE/TE page 49. The use of chemical symbols and chemical formulas as a way to model compounds is described in the section “How Are the Formulas and Names of Ionic Compounds Written?” on SE/TE pages 134–135. Models describing the atomic composition of water and sodium chloride are included in “Figure 6: A Sea of Bonding” on SE/TE pages 144–145.
A model describing the extended atomic structure of DNA is shown in “Figure 1: DNA” on SE/TE page 97 of the Introduction to Chemistry module. The structure of DNA is also described in Chapter 4, Lesson 1, “The Genetic Code” on SE/TE pages 108-113 of the Cells and Heredity module. Models of DNA, mRNA, and proteins are described in “Figure 2: Protein Synthesis” on SE/TE pages 116–117. Students interpret diagrams showing the atomic composition of simple molecules in “Figure 1:
Atoms and Molecules” on SE/TE page 10 of the Introduction to Chemistry module. Students make
models to illustrate chemical reactions involving simple molecules in “Differentiated Instruction: Jellybean Reaction” on TE page 25. Students use chemical formulas to develop models of simple molecules in the Apply It! on SE/TE page 135. Students use stick-and-ball building kits to develop models of simple molecules in “Differentiated Instruction: Visualizing Molecules” on TE page 145. Students develop models of simple molecules when they draw nitrogen molecules and hydrogen
molecules in the Apply It! on SE/TE pages 172–173. Students use models that describe the atomic composition of DNA in “Figure 4: DNA Replication” on SE/TE pages 112–113 of the Cells and Heredity module. Students use models describing protein synthesis on SE/TE pages 116–117. Students use models to describe the atomic structure of a water molecule in “Modeling Atoms and Molecules” on page 13 of the TLR Introduction to Chemistry. They use models to describe the atomic composition of DNA in “Modeling the Genetic Code” on page 102 of the TLR Cells and Heredity. They model DNA and RNA in “What Is RNA” on TLR page 103. They develop models of
compounds in “Models of Compounds” on pages 346–350 of the Chapter Activities and Projects book.
The performance expectation above was developed using the following elements from the NRC document A Framework for K-12 Science Education:
Science and Engineering Practices
Developing and Using Models Modeling in 6–8 builds on K–5 and progresses to
developing, using and revising models to describe, test, and predict more abstract phenomena and design systems.
Develop a model to predict and/or describe
phenomena.
Disciplinary Core Ideas
PS1.A: Structure and Properties of Matter Substances are made from different types of
atoms, which combine with one another in various ways. Atoms form molecules that range in size
from two to thousands of atoms.
Introduction to Chemistry SE/TE:
8–13, Classifying Matter
Crosscutting Concepts
Scale, Proportion, and Quantity Time, space, and energy phenomena can be
observed at various scales using models to study systems that are too large or too small. Introduction to Chemistry SE/TE: 49, Figure 1 – Melting 127, Apply It!

A Correlation of Interactive Science Grades 6-8 Modules, ©2016 Digital Refreshment
to the Next Generation Science Standards for Middle School
SE = Student Edition; TE = Teacher’s Edition; TLR = Teacher’s Lab Resource 5
Introduction to Chemistry SE/TE: 10, Figure 1 – Atoms and Molecules
135, Apply It! 173, Apply It! 176–177, Balancing Chemical Equations TE Only: 25, Differentiated Instruction – L1 Jellybean Reaction
145, Differentiated Instruction – L1 Visualizing Molecules 173, Differentiated Instruction – Jellybean Equation
181E, Describing Chemical Reactions 181F, Describing Chemical
Reactions TLR: 13, Modeling Atoms and Molecules 148, Did You Lose Anything? 149, Information in a Chemical
Equation 150, Is Matter Conserved? Cells and Heredity SE/TE: 112–113, Figure 4: DNA Replication
116–117, Figure 2: Protein Synthesis TLR: 102, Modeling the Genetic Code 103, What Is RNA? 104, Modeling Protein Synthesis 105 Oops!
Chapter Activities and Projects 346–350, Models of Compounds
80–87, Organizing the Elements 84–85, Figure 4: The Periodic Table 92–95, How Are Metals
Classified? 99–103, What Are the Families Containing Nonmetals? 125-129, Atoms, Bonding, and the Periodic Table 130–137, Ionic Bonds 132, Figure 3 – Formation of an
Ionic Bond 138–145, Covalent Bonds 140, Figure 2 – Covalent Bonds 144–145, Figure 6 – A Sea of
Bonding 146–151, Bonding in Metals TE Only:
9, Build Inquiry – Elements Everywhere 10, 21st Century Learning 13, Differentiated Instruction – L3 All About Matter 13, Build Inquiry – Getting the
Iron Out 92, Teacher Demo – Differentiate Alkali Metals 95, Differentiated Instruction – L3 Alloys 103, Differentiated Instruction – L3 Computer Chips
137, Enrich – Ionic Bonds 145, Differentiated Instruction – L3 Carbon Chains 145F, Enrich – Covalent Bonds TLR: 108, Element Chemistry
Solids may be formed from molecules, or they may be extended structures with repeating
subunits (e.g., crystals)
Introduction to Chemistry SE/TE: 41–42, How Do You Describe a Solid?
42, Figure 2 – Types of Solids 136, Ionic Crystals
147, What Is the Crystal Structure of a Metal? TE Only: 41, Build Inquiry–Observe Crystals 42, Teacher Demo–Classify Solids TLR:
40, Modeling Particles
137F, Enrich – Pulling Away Electrons 139, Figure 1 – Electron Sharing 140, Figure 2 – Covalent Bonds
144 Figure 5 – Nonpolar and Polar Molecules 145–146, Figure 6 – A Sea of Bonding 147, Figure 1 – Metallic Bonding 173, Apply It! TE Only
53, Differentiated Instruction – Diagram Changes 127, Differentiated Instruction – L1 Electron Dot Diagrams
145F, Enrich – Oil Spills 151, Differentiated Instruction – L1 Alloys
151D, Review and Reinforce – Bonding in Metals TLR: 40, Modeling Particles 109, How Do Ions Form? 122, Sharing Electrons

A Correlation of Interactive Science Grades 6-8 Modules, ©2016 Digital Refreshment
to the Next Generation Science Standards for Middle School
SE = Student Edition; TE = Teacher’s Edition; TLR = Teacher’s Lab Resource 6
MS.Structure and Properties of Matter MS-PS1-3 Students who demonstrate understanding can: Gather and make sense of information to describe that synthetic materials come from natural
resources and impact society. [Clarification Statement: Emphasis is on natural resources that undergo a chemical process to form the
synthetic material. Examples of new materials could include new medicine, foods, and alternative fuels.] [Assessment Boundary: Assessment is limited to qualitative information.]
INTERACTIVE SCIENCE: In the Introduction to Chemistry module, the online Performance Expectation Activity “Structure and Properties of Matter (MS-PS1-3)” addresses this performance expectation.
Students make sense of information to describe how some detergents have a beneficial impact on society in “Enrich: Oil Spills” on TE page 145F of the Introduction to Chemistry module. Students research synthetic glassy metals and evaluate the impact on society of these materials in “Sci-
Fi Metal” on SE/TE page 157. Students make sense of information about fuel cells when they answer the questions in “Figure 6: How Can Chemical Reactions Generate Speed?” on SE/TE pages 178–179. Students learn that many detergents use a nonrenewable natural resource (petroleum)
as a basis in “Can You Be Clean and Green?” on SE/TE page 193. Students research surfactants to gather and make sense of information related to the claims of detergent manufacturers in “Think Like a Scientist” on TE page 193.
The performance expectation above was developed using the following elements from the NRC document A Framework for K-12 Science Education:
Science and Engineering Practices
Obtaining, Evaluating, and Communicating Information
Obtaining, evaluating, and communicating information in 6–8 builds on K–5 and progresses
to evaluating the merit and validity of ideas and methods.
Gather, read, and synthesize information from multiple appropriate sources and assess the
credibility, accuracy, and possible bias of each publication and methods used, and describe how they are supported or not supported by evidence.
Introduction to Chemistry TE Only: 157, Technology and Society
193, Think Like a Student
Disciplinary Core Ideas
PS1.A: Structure and Properties of Matter Each pure substance has characteristic
physical and chemical properties (for any bulk
quantity under given conditions) that can be used to identify it. (Note: This Disciplinary Core Idea is also addressed by MS-PS1-2.)
Introduction to Chemistry SE/TE:
5–7, What Properties Describe Matter? 9, Elements 19, Figure 4 – Using Density 80–87, Organizing the Elements 88–95, Metals 93, Do the Math!
96–103, Nonmetals and Metalloids 118, Discovery of the Elements 124–129, Atoms, Bonding, and the Periodic Table
TE Only: 87F, Enrich – Properties of a
“Missing” Element 92, Teacher Demo – Differentiating Alkali Metals 95E, Enrich – More Properties of Metals 137, Differentiated Instruction –
L3 Melting Points TLR: 79–87, Copper or Carbon? That Is the Question
Crosscutting Concepts
Structure and Function Structures can be designed to serve particular
functions by taking into account properties of
different materials, and how materials can be shaped and used.
Introduction to Chemistry SE/TE: 146, My Planet Diary – Superconductors 148–149, Figure 2: Properties of Metals
150, Apply It! 151, Alloys 157, Sci-Fi Metal 182, My Planet Diary – Up in Flames TE Only: 157, Technology and Society
Forces and Energy
SE/TE: 152, Aerogel Windows 153, Thermal Expansion TE Only:
147E, Enrich – Thermostats 152, Frontiers and Technology 153, Everyday Science Sound and Light SE/TE: 16, My Planet Diary – The Fall of
Galloping Gertie

A Correlation of Interactive Science Grades 6-8 Modules, ©2016 Digital Refreshment
to the Next Generation Science Standards for Middle School
SE = Student Edition; TE = Teacher’s Edition; TLR = Teacher’s Lab Resource 7
90, Carbon—A Nonmetal 108, Element Chemistry 112–120, Shedding Light on Ions 123, Properties of Molecular
Compounds 126, Metal Crystals 127, What Do Metals Do? 176, Does It Dissolve? 183, pHone Home
PS1.B: Chemical Reactions
Substances react chemically in characteristic ways. In a chemical process, the atoms that make
up the original substances are regrouped into different molecules, and these new substances have different properties from those of the
reactants. (Note: This Disciplinary Core Idea is also addressed by MS-PS1-2 and MS-PS1-5.)
Introduction to Chemistry SE/TE:
165, Bonding and Chemical Change
165, Figure 3: Breaking and Making Bonds 173, Apply It! 174–177, How Is Mass Conserved During a Chemical Reaction? 180–181, What Are the Three
Types of Chemical Reactions? 180, Apply It! 213–214, What Are the Properties
of Acids? 215–217, What Are the Properties of Bases? 222–223, What Are the Products
of Neutralization? 229, Limestone and Acid Drainage TE Only: 168, Teacher Demo – A Toaster Reaction 181, Build Inquiry – The Disappearing Penny
187E, Enrich – Flameless Ration Heaters TLR: 137, What Happens When Chemicals React?
138, Observing Change
148, Did You Lose Anything? 180, Properties of Acids 181, Properties of Bases 182, What Can Cabbage Juice Tell You?
------------------------------------------------ Connections to Engineering, Technology,
and Applications of Science
Interdependence of Science, Engineering, and Technology Engineering advances have led to important
discoveries in virtually every field of science, and scientific discoveries have led to the development
of entire industries and engineered systems.
Introduction to Chemistry
SE/TE: 146, My Planet Diary – Superconductors 157, Sci-Fi Metal 178–179, Figure 6 – How Can Chemical Reactions Generate
Speed?
Forces and Energy TE Only: 147E, Enrich – Thermostats Influence of Science, Engineering and
Technology on Society and the Natural World
The uses of technologies and any limitations on their use are driven by individual or societal
needs, desires, and values; by the findings of scientific research; and by differences in such
factors as climate, natural resources, and economic conditions. Thus technology use varies from region to region and over time.
Introduction to Chemistry
TE Only : 145F, Enrich – Oil Spills 179, Differentiated Instruction – L3 Fuel Cells: Present and Future
Forces and Energy SE/TE:
130, Charge It! TE Only: 130, Museum of Science

A Correlation of Interactive Science Grades 6-8 Modules, ©2016 Digital Refreshment
to the Next Generation Science Standards for Middle School
SE = Student Edition; TE = Teacher’s Edition; TLR = Teacher’s Lab Resource 8
MS.Structure and Properties of Matter MS-PS1-4 Students who demonstrate understanding can: Develop a model that predicts and describes changes in particle motion, temperature, and state of a
pure substance when thermal energy is added or removed. [Clarification Statement: Emphasis is on qualitative
molecular-level models of solids, liquids, and gases to show that adding or removing thermal energy increases or decreases kinetic energy of the particles until a change of state occurs. Examples of models could include drawings and diagrams. Examples of particles could include molecules or
inert atoms. Examples of pure substances could include water, carbon dioxide, and helium.]
INTERACTIVE SCIENCE: In the Introduction to Chemistry module, the online Performance
Expectation Activity “Structure and Properties of Matter (MS-PS1-4)” addresses this performance expectation. Background on the states of matter is presented in the Introduction to Chemistry module, Chapter 2, “Solids, Liquids, and Gases.” In Lesson 1, SE/TE pages 40-47, solid, liquid, and gas are defined
and discussed. The arrangement of particles in solids is discussed in “How Do You Describe a Solid” on SE/TE page 41. The arrangement of particles in liquids is discussed in “How Do you Describe a
Liquid” on SE/TE page 43. The arrangement of particles in gases is discussed in “How Do you Describe a Gas?” on SE/TE page 45. On SE/TE page 47, the effect of temperature upon a gas is discussed. In Lesson 2, SE/TE pages 48-55, changes of state and the relationship to change in temperature and particle motion is presented. In Lesson 3, SE/TE pages 56-59, the effect on pressure and volume in gases as temperature changes is presented.
Students use models of particles in melting ice cubes in “Figure 1: Melting” on SE/TE page 49. Students develop models to describe changes in particle motion as particles move from one state to another in “Differentiated Instruction: Diagram Changes” on TE page 53. Students use models of gas particles at low and temperatures in “Figure 1: Temperatures and Gas Pressures” on SE/TE page 57 and “Figure 3: Charles’s Law” on SE/TE page 58. Students explain how a change in thermal energy relates to the motion of particles during a change of state in “Figure 5: The Changing States of Water” on SE/TE pages 54–55. Students form a hypothesis about change in
state in “What Happens When You Breathe on a Mirror?” on TLR page 43. In “Melting Ice” on TLR pages 44-52, students form a hypothesis about the source of thermal energy that causes ice to melt. In “Keeping Cool,” on TLR page 53, students observe the effect on the temperature of a liquid as it evaporates. In “Observing Sublimation,” on TLR page 54, students observe the effect on the temperature of the surrounding liquid as dry ice sublimates. In “How Are Pressure and Temperature Related?,” TLR page 56, and in “Hot and Cold Balloons,” on TLR page 57, students indirectly observe the relationship between temperature and the speed of molecules in a gas.
The performance expectation above was developed using the following elements from the NRC document A Framework for K-12 Science Education:
Science and Engineering Practices
Developing and Using Models Modeling in 6–8 builds on K–5 and progresses to developing, using and revising models to
describe, test, and predict more abstract phenomena and design systems.
Develop a model to predict and/or describe phenomena.
Introduction to Chemistry SE/TE Only: 49, Figure 1 – Melting 57, Figure 1 – Temperature and
Gas Pressure 58, Figure 3 – Charles’s Law TE Only: 45, Differentiated Instruction – L1 Model Gases
Disciplinary Core Ideas
PS1.A: Structure and Properties of Matter Gases and liquids are made of molecules or
inert atoms that are moving about relative to each other.
Introduction to Chemistry SE/TE: 40-47, States of Matter 48-55, Changes of State 56-59 Gas Behavior TE Only:
53, Differentiated Instruction – Diagram Changes 55, Differentiated Instruction – Diagram Changes in State
Crosscutting Concepts
Cause and Effect Cause and effect relationships may be used to
predict phenomena in natural or designed systems.
Introduction to Chemistry SE/TE Only: 49–50, What Happens to the Particles of a Solid as It Melts?
51–52, What Happens to the Particles of a Liquid When It Vaporizes? 53, What Happens to the Particles of a Solid as It Sublimes? 54–55, Figure 5: The Changing States of Water

A Correlation of Interactive Science Grades 6-8 Modules, ©2016 Digital Refreshment
to the Next Generation Science Standards for Middle School
SE = Student Edition; TE = Teacher’s Edition; TLR = Teacher’s Lab Resource 9
46, Teacher to Teacher 47, Differentiated Instruction – L1 Temperature and Movement of Particles
53, Differentiated Instruction – L1 Diagram Changes TLR: 43, What Happens When You Breathe on a Mirror?
TLR: 56, How are Pressure and Temperature of a Gas Related? 57, Hot and Cold Balloons
In a liquid, the molecules are constantly in contact with others; in a gas, they are widely
spaced except when they happen to collide. In a solid, atoms are closely spaced and may vibrate in
position but do not change relative locations.
Introduction to Chemistry SE/TE: 40-47, States of Matter
41, Figure 1 – Solid 43, Figure 3 – Liquid
45, Figure 5 – Gas 48-55, Changes of State 56-59, Gas Behavior TE Only: 41, Build Inquiry – Observe
Crystals 45, Address Misconceptions 45, Differentiated Instruction TLR: 39, What Are Solids, Liquids, and Gases?
56, How Are Pressure and Temperature Related? 57, Hot and Cold Balloons
The changes of state that occur with variations
in temperature or pressure can be described and predicted using these models of matter.
Introduction to Chemistry SE/TE: 48-55, Changes of State 49, Figure 1 – Melting 51, Figure 2 – Types of Vaporization
56-59, Gas Behavior 57, Figure 1 – Temperature and Gas Pressure 58, Figure 3 – Charles’s Law TE Only: 51, Build Inquiry - Evaporation TLR:
44-52, Melting Ice 53, Keeping Cool 54, Observing Sublimation
56–57, How are Pressure and Temperature of a Gas Related? 58–59, How are Volume and Temperature of a Gas Related?
66, Scuba Diving TE Only: 52, Differentiated Instruction – L3 Defrosters 55, Differentiated Instruction – L1 Changing the Freezing Point of Water
TLR: 43, What Happens When You Breathe on a Mirror? 53, Keeping Cool
54, Observing Sublimation 56, How Are Temperature and Pressure Related?
57, Hot and Cold Balloons

A Correlation of Interactive Science Grades 6-8 Modules, ©2016 Digital Refreshment
to the Next Generation Science Standards for Middle School
SE = Student Edition; TE = Teacher’s Edition; TLR = Teacher’s Lab Resource 10
PS3.A: Definitions of Energy The term “heat” as used in everyday language
refers both to thermal energy (the motion of atoms or molecules within a substance) and the
transfer of that thermal energy from one object to another. In science, heat is used only for this
second meaning; it refers to the energy transferred due to the temperature difference between two objects. (Secondary to MS-PS1-4)
Introduction to Chemistry SE/TE: 26, Temperature, Thermal Energy 27, Thermal Energy and Changes
in Matter 47, Temperature 149, Thermal Conductivity
TE Only: 27, Differentiated Instruction 47, 21st Century Learning
Forces and Energy SE/TE: 139, Heat 139, Vocabulary Skill 139, Figure 2 – Heat 140–143, The Transfer of Heat
141, Figure 1 – Heat Transfer TE Only: 138, Teacher to Teacher
The temperature of a system is proportional to
the average internal kinetic energy and potential energy per atom or molecule (whichever is the appropriate building block for the system’s
material). The details of that relationship depend on the type of atom or molecule and the
interactions among the atoms in the material. Temperature is not a direct measure of a system’s total thermal energy. The total thermal energy
(sometimes called the total internal energy) of a system depends jointly on the temperature, the
total number of atoms in the system, and the state of the material. (secondary to MS-PS1-4)
Introduction to Chemistry SE/TE: 26, Temperature and Thermal Energy 47, Temperature
49–51, What Happens to the
Particles of a Solid as It Melts? 50, Apply It! 51–52, What Happens to Particles of a Liquid as It Vaporizes? TE Only: 47, Differentiated Instruction – L1
Temperature and Movement of Particles TLR: 53, Keeping Cool

A Correlation of Interactive Science Grades 6-8 Modules, ©2016 Digital Refreshment
to the Next Generation Science Standards for Middle School
SE = Student Edition; TE = Teacher’s Edition; TLR = Teacher’s Lab Resource 11
Forces and Energy SE/TE: 118, Thermal Energy 136–139, Temperature, Thermal
Energy, and Heat 138, Apply It! TE Only: 138, Teach Key Concepts TLR: Temperature and Thermal Energy

A Correlation of Interactive Science Grades 6-8 Modules, ©2016 Digital Refreshment
to the Next Generation Science Standards for Middle School
SE = Student Edition; TE = Teacher’s Edition; TLR = Teacher’s Lab Resource 12
MS.Chemical Reactions MS-PS1-2 Students who demonstrate understanding can: Analyze and interpret data on the properties of substances before and after the substances interact
to determine if a chemical reaction has occurred. [Clarification Statement: Examples of reactions could include burning sugar
or steel wool, fat reacting with sodium hydroxide, and mixing zinc with HCl.] [Assessment Boundary: Assessment is limited to analysis of the following properties: density, melting point, boiling point, solubility, flammability, and odor.]
INTERACTIVE SCIENCE: In the Introduction to Chemistry module, the online Performance Expectation Activity “Structure and Properties of Matter (MS-PS1-2)” addresses this performance expectation. Change in physical and chemical properties is discussed in the Introduction to Chemistry module in Chapter 5, Lesson 1, “Observing Chemical Change,” on SE/TE pages 163-167. On page 163,
students learn about the chemical changes to a copper penny that becomes tarnished. On page 165, students contrast the properties of the reactants oxygen and magnesium with the properties of the product magnesium oxide. Students explain why the formation of table salt from sodium and chlorine is a chemical reaction in “Differentiated Instruction: Table Salt” on TE page 165. Students research the chemical reaction that happens when fruits ripen in “Differentiated Instruction: Ripening” on TE page 165. Students interpret data on the chemical reaction that occurs when vinegar is added to baking soda in “Teacher Demo: Hopping Corn” on TE page 167. They interpret
data on the chemical reaction that occurs when bread is toasted in “Teacher Demo: A Toaster Reaction” on TE page 168. Students use data to explain chemical reactions and compare properties in “What Happens When Chemicals React?” on TLR page 137 and in “Observing Change” on TLR page 138. In “Where’s the Evidence?” on TLR pages 139-147, students observe three different chemical reactions and record their observations of changes in properties from reactants to products.
The performance expectation above was developed using the following elements from the NRC document A Framework for K-12 Science Education:
Science and Engineering Practices
Analyzing and Interpreting Data
Analyzing data in 6–8 builds on K–5 and progresses to extending quantitative analysis to
investigations, distinguishing between correlation and causation, and basic statistical techniques of data and error analysis.
Analyze and interpret data to determine similarities and differences in findings.
Introduction to Chemistry SE/TE: 184, Figure 2 – Graphs of Exothermic and Endothermic
Reactions 187, Figure 5 – Catalysts
TE Only: 187, Build Inquiry – Comparing Reaction Rates 187D, Review and Reinforce –
Controlling Chemical Reactions TLR: 139–147, Where’s the Evidence? 152, Can You Speed Up or Slow Down a Reaction? 153, Modeling Activation Energy
154, Effect of Temperature on
Disciplinary Core Ideas
PS1.A: Structure and Properties of Matter
Each pure substance has characteristic physical and chemical properties (for any bulk
quantity under given conditions) that can be used to identify it. (Note: This Disciplinary Core Idea is also addressed by MS-PS1-3.)
Introduction to Chemistry
SE/TE: 5–7, What Properties Describe Matter? 9, Elements 19, Figure 4 – Using Density 80–87, Organizing the Elements 88–95, Metals
93, Do the Math! 96–103, Nonmetals and Metalloids 118, Discovery of the Elements 124–129, Atoms, Bonding, and the Periodic Table
TE Only: 87F, Enrich – Properties of a “Missing” Element 92, Teacher Demo – Differentiating Alkali Metals 95E, Enrich – More Properties of
Crosscutting Concepts
Patterns
Macroscopic patterns are related to the nature of microscopic and atomic-level structure.
Introduction to Chemistry SE/TE: 80–87, Organizing the Elements
92–95, How Are Metals Classified? 96–105, Nonmetals and Metalloids 136–137, What Are Properties of Ionic Compounds? 141–142, What Are Properties of
Molecular Compounds? 148–149, What Are Properties of Metals? 148–149, Figure 2: Properties of Metals 163-167, Observing Chemical Change
TE Only: 87F, Enrich – Properties of a “Missing” Element 95E, Enrich – Metals 137F, Enrich – Pulling Away

A Correlation of Interactive Science Grades 6-8 Modules, ©2016 Digital Refreshment
to the Next Generation Science Standards for Middle School
SE = Student Edition; TE = Teacher’s Edition; TLR = Teacher’s Lab Resource 13
Chemical Reactions STEMQuest: Hot and Cool Chemistry Energy Salts
------------------------------------
Connections to Nature of Science
Scientific Knowledge is Based on Empirical Evidence
Science knowledge is based upon logical and
conceptual connections between evidence and
explanations. (MS-PS1-2)
Introduction to Chemistry SE/TE: 166-169, How Do You Identify a
Chemical Reaction?
TE Only: 167, Teacher Demo—Hopping Corn 167, Differentiated Instruction – L1 Changes in Wood 167, 21st Century Learning TLR:
138, Observing Change 139-147, Where’s the Evidence? STEMQuest: Hot and Cool Chemistry Energy Salts
Metals 137, Differentiated Instruction – L3 Melting Points TLR:
79–87, Copper or Carbon? That Is the Question 90, Carbon—A Nonmetal 108, Element Chemistry 112–120, Shedding Light on Ions 123, Properties of Molecular Compounds
126, Metal Crystals 127, What Do Metals Do? 176, Does It Dissolve? 183, pHone Home
PS1.B: Chemical Reactions Substances react chemically in characteristic
ways. In a chemical process, the atoms that make up the original substances are regrouped into different molecules, and these new substances
have different properties from those of the reactants. (Note: This Disciplinary Core Idea is also addressed by MS-PS1-3.)
Introduction to Chemistry
SE/TE: 165, Bonding and Chemical Change 165, Figure 3: Breaking and Making Bonds 173, Apply It! 174–177, How Is Mass Conserved
During a Chemical Reaction? 180–181, What Are the Three Types of Chemical Reactions? 180, Apply It! 213–214, What Are the Properties of Acids?
215–217, What Are the Properties of Bases? 222–223, What Are the Products of Neutralization? 229, Limestone and Acid Drainage TE Only: 168, Teacher Demo – A Toaster
Reaction 181, Build Inquiry – The
Disappearing Penny 187E, Enrich – Flameless Ration Heaters TLR: 137, What Happens When
Chemicals React? 138, Observing Change 148, Did You Lose Anything? 180, Properties of Acids 181, Properties of Bases 182, What Can Cabbage Juice Tell
You?
Electrons 165, Differentiated Instruction – L1 Table Salt 167, 21st Century Learning
TLR: 77, Expanding the Periodic Table 92, How Much Goes Away 107, What Are the Trends in the Periodic Table? 122, Sharing Electrons 123, Properties of Molecular
Compounds 137, What Happens When Chemicals React? 138, Observing Change
139-147, Where’s the Evidence?

A Correlation of Interactive Science Grades 6-8 Modules, ©2016 Digital Refreshment
to the Next Generation Science Standards for Middle School
SE = Student Edition; TE = Teacher’s Edition; TLR = Teacher’s Lab Resource 14
MS.Chemical Reactions MS-PS1-5 Students who demonstrate understanding can: Develop and use a model to describe how the total number of atoms does not change in a chemical
reaction and thus mass is conserved. [Clarification Statement: Emphasis is on law of conservation of matter, and on physical
models or drawings, including digital forms, that represent atoms.] [Assessment Boundary: Assessment does not include the use of atomic masses, balancing symbolic equations, or intermolecular forces.]
INTERACTIVE SCIENCE: In the Introduction to Chemistry module, the online Performance Expectation Activity “Structure and Properties of Matter (MS-PS1-5)” addresses this performance expectation. The concept of conservation of mass is explored in the Introduction to Chemistry module, Chapter
1, Introduction to Matter, “Conservation of Mass,” SE/TE page 25 and Chapter 5, Chemical Reactions, “How Is Mass Conserved During a Chemical Reaction?,” SE/TE pages 174-177.
In “Figure 5: Conservation of Mass” on SE/TE page 25, students use models of molecules to show how mass is conserved when methane and oxygen react to produce carbon dioxide and water. Students develop and use a model in “Differentiated Instruction: Visualizing Conservation of Mass” on TE Page 25. Students use models to describe the conservation of mass in “Differentiated Instruction: Jellybean Reaction” on TE page 25. On SE/TE page 177, students use models of
molecules to balance a chemical equation for hydrogen and oxygen forming and demonstrate conservation of mass. Students model conservation of mass using coins in “Did You Lose Anything?” on TLR page 148 and using bolts and nuts in “Is Matter Conserved?” on TLR page 150.
The performance expectation above was developed using the following elements from the NRC document A Framework for K-12 Science Education:
Science and Engineering Practices
Developing and Using Models Modeling in 6–8 builds on K–5 and progresses to
developing, using and revising models to describe, test, and predict more abstract
phenomena and design systems. Develop a model to describe unobservable
mechanisms.
Introduction to Chemistry SE/TE: 25, Figure 5 – Conservation of Mass 177, Balancing Chemical Equations TE Only:
25, Differentiated Instruction – L1 Visualizing Conservation of Mass 25, Differentiated Instruction –
L1 Jellybean Reaction 175, Build Inquiry – Still There 177, Build Inquiry – A Balancing Act
TLR: 148, Did You Lose Anything? 150, Is Matter Conserved?
Disciplinary Core Ideas
PS1.B: Chemical Reactions Substances react chemically in characteristic
ways. In a chemical process, the atoms that make up the original substances are regrouped into
different molecules, and these new substances have different properties from those of the
reactants. (Note: This Disciplinary Core Idea is also addressed by MS-PS1-3.)
Introduction to Chemistry SE/TE: 165, Bonding and Chemical Change
165, Figure 3: Breaking and Making Bonds 173, Apply It! 180–181, What Are the Three Types of Chemical Reactions? 180, Apply It!
213–214, What Are the Properties
of Acids? 215–217, What Are the Properties of Bases? 222–223, What Are the Products of Neutralization? 229, Limestone and Acid Drainage TE Only:
25, Teacher Demo – Conservation of Mass 175, Differentiated instruction –
Crosscutting Concepts
Energy and Matter Matter is conserved because atoms are
conserved in physical and chemical processes.
Introduction to Chemistry SE/TE: 25, Figure 5 – Conservation of Mass 174–177, How Is Mass Conserved During a Chemical Reaction?
TE Only: 25, Teacher Demo – Conservation of Mass 175, Differentiated Instruction – L3 Conservation of Matter 175, Differentiated Instruction – L3 Lavoisier’s Experiment
175, Build Inquiry – Still There 177, Differentiated Instruction 177, Build Inquiry – A Balancing Act TLR: 148, Did You Lose Anything? 150, Is Matter Conserved?
174, How is Mass Conserved During a Chemical Reaction? 176-177, Balancing Chemical Equations

A Correlation of Interactive Science Grades 6-8 Modules, ©2016 Digital Refreshment
to the Next Generation Science Standards for Middle School
SE = Student Edition; TE = Teacher’s Edition; TLR = Teacher’s Lab Resource 15
_____________________________ Connections to Nature of Science
Science Models, Laws, Mechanisms, and
Theories Explain Natural Phenomena Laws are regularities or mathematical
descriptions of natural phenomena.
Introduction to Chemistry
SE/TE: 24, Conservation of Mass 24, Figure 5: Conservation of Mass 174–177, How Is Mass Conserved During a Chemical Reaction?
178–179, Figure 6 – How Can Chemical Reactions Generate
Speed? TE Only: 25, Teacher Demo – Conservation of Mass 175, Differentiated instruction –
L1 Conservation of Mass 175, Differentiated Instruction – L3 Lavoisier’s Experiment 175, Build Inquiry – Still There TLR: 148, Did You Lose Anything? 150, Is Matter Conserved?
L1 Conservation of Mass 175, Differentiated Instruction – L3 Lavoisier’s Experiment 175, Build Inquiry – Still There
TLR: 137, What Happens When Chemicals React? 138, Observing Change 180, Properties of Acids 181, Properties of Bases 182, What Can Cabbage Juice Tell
You? The total number of each type of atom is
conserved, and thus the mass does not change.
Introduction to Chemistry SE/TE: 25, Figure 5 – Conservation of
Mass 174–177, How Is Mass Conserved During a Chemical Reaction? TE Only: 25, Teacher Demo – Conservation of Mass 175, Differentiated Instruction
175, Build Inquiry – Still There 177, Differentiated Instruction 177, Build Inquiry – A Balancing Act TLR:
148, Did You Lose Anything?
150, Is Matter Conserved? 174, How is Mass Conserved During a Chemical Reaction? 176-177, Balancing Chemical Equations

A Correlation of Interactive Science Grades 6-8 Modules, ©2016 Digital Refreshment
to the Next Generation Science Standards for Middle School
SE = Student Edition; TE = Teacher’s Edition; TLR = Teacher’s Lab Resource 16
MS.Chemical Reactions MS-PS1-6 Students who demonstrate understanding can: Undertake a design process to construct, test, and modify a device that either releases or absorbs
thermal energy by chemical processes.* [Clarification Statement: Emphasis is on the design, controlling the transfer of energy to
the environment, and modification of a device using factors such as type and concentration of a substance. Examples of designs could involve chemical reactions such as dissolving ammonium chloride or calcium chloride.] [Assessment Boundary: Assessment is limited to the criteria of
amount, time, and temperature of substance in testing the device.]
INTERACTIVE SCIENCE: In the Introduction to Chemistry module, the online Performance
Expectation Activity “Structure and Properties of Matter (MS-PS1-6)” addresses this performance expectation. Endothermic and exothermic reactions are explored in the Introduction to Chemistry module in Chapter 5, Lesson 1, “Observing Chemical Change,” in “Changes in Energy,’ on pages SE/TE 168-
169. In the Do the Math! feature on SE/TE page 169, students graph and interpret data to determine if a reaction was exothermic or endothermic. In “Figure 6: How Can Chemical Reactions
Generate Speed?”, students explain the chemical reactions that release energy in a fuel cell. In the Cells and Heredity module, Chapter 2, “Cell Processes and Energy,” students obtain information about the chemical reactions for photosynthesis on SE/TE page 49, and cellular respiration on SE/TE page 52. These are described in terms of releasing energy when complex molecules are broken down and absorbing energy when simple molecules are combined.
Students design, construct, test, and modify a closed reaction chamber that absorbs thermal energy in “Design and Build a Closed Reaction Chamber” on pages 353–357 of the Chapter Activities and Projects book. Students explore the chemical reactions and thermal consequences when natural gas burns in “The Pipeline Is Burning” on pages 152–153 of the Scenario-Based Investigations book.
The performance expectation above was developed using the following elements from the NRC document A Framework for K-12 Science Education:
Science and Engineering Practices
Constructing Explanations and Designing
Solutions Constructing explanations and designing solutions
in 6–8 builds on K–5 experiences and progresses to include constructing explanations and designing solutions supported by multiple sources of
evidence consistent with scientific knowledge, principles, and theories.
Undertake a design project, engaging in the design cycle, to construct and/or implement a
solution that meets specific design criteria and constraints.
Science and Technology SE/TE:
128, Apply It! Introduction to Chemistry STEMQuest: Hot and Cool Chemistry Design Your Pack Pack Building
Heat It Up or Ice It Down, Reflect on Your Pack
Disciplinary Core Ideas
PS1.B: Chemical Reactions
Some chemical reactions release energy,
others store energy.
Cells and Heredity SE/TE: 49, The Photosynthesis Equation
52, The Cellular Respiration Equation Introduction to Chemistry SE/TE: 168–169, Changes in Energy
169, Do the Math!
178–179, Figure 6: How Can Chemical Reactions Generate Speed? STEMQuest: Hot and Cool Chemistry Energy Salts Design Your Pack
Pack Building Heat It Up or Ice It Down Reflect on Your Pack
Crosscutting Concepts
Energy and Matter
The transfer of energy can be tracked as
energy flows through a designed or natural system.
Cells and Heredity SE/TE: 49, The Photosynthesis Equation 52, The Cellular Respiration
Equation
Introduction to Chemistry
SE/TE:
169, Do the Math! 184, Graphing Changes in Energy 184, Figure 2: Graphs of Exothermic and Endothermic Reactions 187, Catalysts and Inhibitors
187, Figure 5 – Catalysts STEMQuest: Hot and Cool Chemistry Energy Salts Design Your Pack

A Correlation of Interactive Science Grades 6-8 Modules, ©2016 Digital Refreshment
to the Next Generation Science Standards for Middle School
SE = Student Edition; TE = Teacher’s Edition; TLR = Teacher’s Lab Resource 17
Chapter Activities and Projects 353–357, Design and Build a Closed Reaction Chamber
ETS1.B: Developing Possible Solutions A solution needs to be tested, and then
modified on the basis of the test results, in order to improve it. (secondary to MS-PS1-6)
Introduction to Chemistry
STEMQuest: Hot and Cool Chemistry Design Your Pack Pack Building Heat It Up or Ice It Down Reflect on Your Pack
Chapter Activities and Projects 353–357, Design and Build a Closed Reaction Chamber
Scenario-Based Investigations 152–153, The Pipeline Is Burning ETS1.C: Optimizing the Design Solution Although one design may not perform the best
across all tests, identifying the characteristics of the design that performed the best in each test
can provide useful information for the redesign process—that is, some of the characteristics may
be incorporated into the new design. (secondary to MS-PS1-6)
Introduction to Chemistry STEMQuest: Hot and Cool Chemistry Pack Building Reflect on Your Pack
Chapter Activities and Projects
353–357, Design and Build a Closed Reaction Chamber The iterative process of testing the most
promising solutions and modifying what is proposed on the basis of the test results leads to greater refinement and ultimately to an optimal
solution. (secondary to MS-PS1-6)
Introduction to Chemistry
STEMQuest: Hot and Cool Chemistry Pack Building Chapter Activities and Projects
353–357, Design and Build a Closed Reaction Chamber
Forces and Energy STEMQuest: Keep Hot Liquids Hot Contain the Heat
*The performance expectations marked with an asterisk integrate traditional science content with engineering through a Practice or Disciplinary Core Idea.

A Correlation of Interactive Science Grades 6-8 Modules, ©2016 Digital Refreshment
to the Next Generation Science Standards for Middle School
SE = Student Edition; TE = Teacher’s Edition; TLR = Teacher’s Lab Resource 18
MS.Forces and Interactions MS-PS2-1 Students who demonstrate understanding can: Apply Newton’s Third Law to design a solution to a problem involving the motion of two colliding
objects.* [Clarification Statement: Examples of practical problems could include the impact of collisions between two cars, between a car and
stationary objects, and between a meteor and a space vehicle.] [Assessment Boundary: Assessment is limited to vertical or horizontal interactions in one dimension.]
INTERACTIVE SCIENCE: In the Forces and Energy module, the online Performance Expectation Activity “Forces and Interactions (MS-PS2-1)” addresses this performance expectation. Newton’s Third Law of Motion is introduced in the Forces and Energy module in SE/TE Chapter 2,
Lesson 3, “What Is Newton’s Third Law of Motion?,” on SE/TE pages 48-49.
Students apply Newton’s Third law to design a solution for making hockey easier, safer, or more fun in “21st Century Learning” on TE page 49. On this same TE page, students investigate action-reaction pairs in “Teacher Demo: Action-Reaction in Action” and in “Differentiated Instruction: Make
a Rocket.” Students examine opposing forces in Quick Lab “Interpreting Illustrations” on TLR page 54. They investigate action-reaction pairs in Inquiry Warm-Up “How Pushy is a Straw?” on TLR page 55.
The performance expectation above was developed using the following elements from the NRC document A Framework for K-12 Science Education:
Science and Engineering Practices
Constructing Explanations and Designing Solutions
Constructing explanations and designing solutions in 6–8 builds on K–5 experiences and progresses
to include constructing explanations and designing solutions supported by multiple sources of evidence consistent with scientific ideas,
principles, and theories. • Apply scientific ideas or principles to design an
object, tool, process or system.
Forces and Energy
TE Only: 49, 21st Century Learning
Disciplinary Core Ideas
PS2.A: Forces and Motion • For any pair of interacting objects, the force
exerted by the first object on the second object is equal in strength to the force that the second
object exerts on the first, but in the opposite direction (Newton’s third law). Forces and Energy SE/TE: 48-49, What is Newton’s Third Law of Motion? 48, Figure 3 – Action-Reaction Pairs
49, Did You Know?, Figure 4 – Action-Reaction Forces 50-51, What Makes a Bug Go Splat? TE Only: 49, Teacher Demo – Action-Reaction in Action
49, Differentiated Instruction – L3
Make a Rocket 49, 21st Century Learning 51A, After the Inquiry Warm-Up TLR: 54, Interpreting Illustrations 55, How Pushy Is a Straw?
Crosscutting Concepts
Systems and System Models • Models can be used to represent systems and
their interactions—such as inputs, processes and outputs—and energy and matter flows within
systems.
Forces and Energy SE/TE: 49, Figure 4 – Action-Reaction
Forces 55, Inquiry Warm-Up - How Pushy Is a Straw?
------------------------------------------------- Connections to Engineering, Technology,
and Applications of Science Influence of Science, Engineering, and Technology on Society and the Natural
World • The uses of technologies and any limitations on
their use are driven by individual or societal needs, desires, and values; by the findings of
scientific research; and by differences in such factors as climate, natural resources, and economic conditions.
Scenario-Based Investigations 170–171, Please Drop In
*The performance expectations marked with an asterisk integrate traditional science content with engineering through a Practice or
Disciplinary Core Idea.

A Correlation of Interactive Science Grades 6-8 Modules, ©2016 Digital Refreshment
to the Next Generation Science Standards for Middle School
SE = Student Edition; TE = Teacher’s Edition; TLR = Teacher’s Lab Resource 19
MS.Forces and Interactions MS-PS2-2 Students who demonstrate understanding can: Plan an investigation to provide evidence that the change in an object’s motion depends on the sum
of the forces on the object and the mass of the object. [Clarification Statement: Emphasis is on balanced (Newton’s First
Law) and unbalanced forces in a system, qualitative comparisons of forces, mass and changes in motion (Newton’s Second Law), frame of reference, and specification of units.] [Assessment Boundary: Assessment is limited to forces and changes in motion in one-dimension in an inertial reference
frame, and to change in one variable at a time. Assessment does not include the use of trigonometry.]
INTERACTIVE SCIENCE: In the Forces and Energy module, the online Performance Expectation
Activity “Forces and Interactions (MS-PS2-2)” addresses this performance expectation. Units of measurement and reference points for making observations are discussed in the Forces and Energy module, Chapter 1, Lesson 1, “Describing Motion.” On SE/TE pages 4-6, reference points and relative motion are presented. In the Art in Motion feature on SE/TE page 5, students write about
reference points. In the 21st Century Learning feature on TE page 5, pairs of student simulate the motion of Earth around the sun and describe the motion from the reference point of the sun and
Earth. In the Apply It! feature on SE/TE page 6, students write about relative position. On TE page 6, students identify different reference points to observe Earth’s motion. Different units of distance in the SI system of measurements are described on SE/TE page 7. In Figure 2, Measuring Distance, on SE/TE page 7, students convert units of distance among various different units. In the Build Inquiry feature on TE page 7, students identify appropriate units of measurement to use in measuring classroom objects. Students describe motion from multiple reference points in
enrichment activity on TE page 7E. Students observe motion from multiple reference points in “What Is Motion” on TLR page 9 and “Identifying Motion” on TLR page 10. Force and its effect on motion are explored in Chapter 2, Lesson 1, “Nature of Force” on SE/TE pages 32–35. In “Figure 2: Net Force” on SE/TE pages 34–35, illustrations are used to demonstrate that a change in motion is caused by the net force acting on an object. Students calculate the net force in three different situations: when forces cause motion because they are added together and they have
the same direction, when forces cause motion because they have opposite direction but are unbalanced, and when forces do not cause motion because they are in opposite directions but are balanced. In the Apply it! feature on SE/TE page 35, students draw a diagram to illustrate two forces and the resulting net force. The effects of friction and the force of gravity are described. On TE page 35E, students graph the relationship between mass and force at a constant speed and interpret the graph. Students observe how equal and unequal forces affect the motion of an object in “Is the Force With You?” on TLR page 37. Students measure forces in “What Is Force?” on TLR
page 38. They model unbalanced forces in a game of tug-of-war during the Quick Lab “Modeling Unbalanced Forces” on TLR page 39. Newton’s first, second, and third law of motion are detailed in Chapter 2, Lesson 3, “Newton’s Laws of Motion” on SE/TE pages 44–51. Students use Newton’s first law of motion to explain the motions of a roller coaster in “Figure 1: Inertia” on SE/TE page 45. They illustrate Newton’s second law of
motion in “Figure 2: Newton’s Second Law” on SE/TE page 46. They investigate motion and forces in “What Changes Motion?” on TLR page 51. They investigate Newton’s first law in “Around and Around on TLR page 52. They investigate mass and acceleration in “Newton’s Second Law” on TLR
page 53.
The performance expectation above was developed using the following elements from the NRC document A Framework for K-12 Science Education:
Science and Engineering Practices
Planning and Carrying out Investigations Planning and carrying out investigations to
answer questions or test solutions to problems in 6–8 builds on K–5 experiences and progresses to
include investigations that use multiple variables and provide evidence to support explanations or
design solutions.
Disciplinary Core Ideas
PS2.A: Forces and Motion • The motion of an object is determined by the
sum of the forces acting on it; if the total force on the object is not zero, its motion will change. The
greater the mass of the object, the greater the force needed to achieve the same change in
motion. For any given object, a larger force
causes a larger change in motion
Crosscutting Concepts
Stability and Change • Explanations of stability and change in natural
or designed systems can be constructed by examining the changes over time and forces at
different scales.

A Correlation of Interactive Science Grades 6-8 Modules, ©2016 Digital Refreshment
to the Next Generation Science Standards for Middle School
SE = Student Edition; TE = Teacher’s Edition; TLR = Teacher’s Lab Resource 20
• Plan an investigation individually and collaboratively, and in the design: identify
independent and dependent variables and controls, what tools are needed to do the
gathering, how measurements will be recorded, and how many data are needed to support a claim.
Forces and Energy
TLR: 39, Modeling Unbalanced Forces 40, Observing Friction 41-49, Sticky Sneakers 51, What Changes Motion? 52, Around and Around
-----------------------------------------
Connections to Nature of Science
Scientific Knowledge is Based on
Empirical Evidence
• Science knowledge is based upon logical
and conceptual connections between
evidence and explanations Forces and Energy SE/TE: 44–45, What Is Newton’s First Law of Motion? TLR: 39, Modeling Unbalanced Forces
40, Observing Friction 41-49, Sticky Sneakers 51, What Changes Motion?
52, Around and Around
Forces and Energy SE/TE: 32–35, The Nature of Force 34–35, Figure 2: Net Force
35, Apply It! 44–45, What Is Newton’s First Law of Motion? 46–47, What Is Newton’s Second Law of Motion? 46, Figure 2: Newton’s Second Law
TE Only: 35E, Enrich – Net Force, Mass, and Change in Motion TLR:
39, Modeling Unbalanced Forces 40, Observing Friction 41-49, Sticky Sneakers
51, What Changes Motion? 52, Around and Around 53, Newton’s Second Law PS2.A: Forces and Motion
• All positions of objects and the directions of forces and motions must be described in an arbitrarily chosen reference frame and arbitrarily
chosen units of size. In order to share information with other people, these choices must also be
shared.
Forces and Energy
SE/TE:
4-6, Describing Motion 7, Measuring Distance TE Only: 5, 21st Century Learning 6, 21st Century Learning 7, Differentiated Instruction – L3
SI Units 7, Build Inquiry – Describe Distance 7E, Enrichment – Exploring Reference Points TLR:
9, What is Motion? 10, Identifying Motion
Forces and Energy SE/TE: 34–35, How Do Forces Affect Motion?
34–35, Figure 2: Net Force 44–51, Newton’s Laws of Motion 56–59, Free Fall and Circular Motion 58, Figure 2 – Satellite Motion 64, Safety Restraints TE Only:
35E, Enrich – The Nature of Force TLR: 37, Is the Force With You? 38, What Is Force?
39, Modeling Unbalanced Forces 41–49, Sticky Sneakers 51, What Changes Motion?
53, Newton’s Second Law 57, What Makes an Object Move in a Circle? 59, Orbiting Earth

A Correlation of Interactive Science Grades 6-8 Modules, ©2016 Digital Refreshment
to the Next Generation Science Standards for Middle School
SE = Student Edition; TE = Teacher’s Edition; TLR = Teacher’s Lab Resource 21
MS.Forces and Interactions MS-PS2-3 Students who demonstrate understanding can: Ask questions about data to determine the factors that affect the strength of electric and magnetic
forces. [Clarification Statement: Examples of devices that use electric and magnetic forces could include electromagnets, electric motors, or
generators. Examples of data could include the effect of the number of turns of wire on the strength of an electromagnet, or the effect of increasing the number or strength of magnets on the speed of an electric motor.] [Assessment Boundary: Assessment about questions that require quantitative
answers is limited to proportional reasoning and algebraic thinking.]
INTERACTIVE SCIENCE: In the Forces and Energy module, the online Performance Expectation
Activity “Forces and Interactions (MS-PS2-3)” addresses this performance expectation. Electric fields are discussed in Chapter 6, Lesson 1, “Electric Charge and Static Electricity” on SE/TE pages 158–163 of the Forces and Energy module. The factors affecting the strength of electrical forces are explored in “How Does Charge Build Up?” on SE/TE pages 161-163. A discussion of magnetic force
is included in “How Do Magnetic Poles Interact?” on SE/TE pages 198–199. Students learn about factors that affect magnetic force in “Enrich: William Gilbert and the Science of Magnetism” on TE page
199E. Students obtain information about factors that affect the strength of magnetic forces in Chapter 7, Lesson 2, “Magnetic Fields” on SE/TE pages 200–205; in Chapter 7, Lesson 3, in “What Is a Magnetic Field Produced by a Current Like?” on SE/TE page 209; and in “What Are the Characteristics of Solenoids and Electromagnets?” on SE/TE pages 210-211. In the Enrich activity “A Turn for the Better” on TE page 211F, students learn about the relationship between current turns of wire around a core and electromagnetic strength.
Students observe the effects of increased electric charge in “Drawing Conclusions: Electricity” on TLR page 149. In this lab, they observe the effect of electric charge before and after causing a charge in a comb. Students investigate the relationship between an electric current and the magnetic field it creates in “Can a Magnet Move a Wire?” on TLR page 201. Students use magnets of various sizes and strengths to build a piece of artwork in “Magnetic Art” on pages 402–406 of the Chapter Activities and Projects book.
The performance expectation above was developed using the following elements from the NRC document A Framework for K-12 Science Education:
Science and Engineering Practices
Asking Questions and Defining Problems Asking questions and defining problems in grades 6–8 builds from grades K–5 experiences and
progresses to specifying relationships between variables, and clarifying arguments and models.
• Ask questions that can be investigated within the scope of the classroom, outdoor environment, and museums and other public facilities with
available resources and, when appropriate, frame a hypothesis based on observations and scientific
principles.
Forces and Energy SE/TE:
203, Apply It! TLR: 193, Predict the Field
Disciplinary Core Ideas
PS2.B: Types of Interactions • Electric and magnetic (electromagnetic) forces can be attractive or repulsive, and their sizes
depend on the magnitudes of the charges, currents, or magnetic strengths involved and on
the distances between the interacting objects.
Forces and Energy SE/TE: 158–163, Electric Charge and Static Electricity 160, Figure 2: Electric Fields
198–199, How Do Magnetic Poles Interact?
198, Figure 2: Attraction and Repulsion 200–205, Magnetic Fields 209, What Is a Magnetic Field Produced by a Current Like? 210-211, What Are the
Characteristics of Solenoids and Electromagnets?
Crosscutting Concepts
Cause and Effect • Cause and effect relationships may be used to predict phenomena in natural or designed
systems.
Forces and Energy SE/TE: 161-163, How Does Charge Build Up? 207, Targeted Reading Skill – Relate Cause and Effect
209, What Is a Magnetic Field
Produced by a Current Like? 210-211, What Are the Characteristics of Solenoids and Electromagnets? 211, Apply It! TLR:
182, Natural Magnets 193, Predict the Field 199, Electromagnet

A Correlation of Interactive Science Grades 6-8 Modules, ©2016 Digital Refreshment
to the Next Generation Science Standards for Middle School
SE = Student Edition; TE = Teacher’s Edition; TLR = Teacher’s Lab Resource 22
TE Only: 160, Teacher Demo: Electric Field Exerts a Force 161, Differentiated Instruction –
Model How Objects Are Charged 163, 21st Century Learning – Differentiated Instruction 165E, Enrich – St. Elmo’s’ Fire 199E, Enrich – William Gilbert and the Science of Magnetism 211E, Review and Reinforce –
Electromagnetic Force 211F, Enrich – A turn for the Better TLR:
148, Can You Move a Can Without Touching It? 149, Drawing Conclusions:
Electricity 183–191, Detecting Fake Coins 193, Predict the Field 198, Magnetic Fields From Electric Current 201, Can a Magnet Move a Wire?
Chapter Activities and Projects 402–406, Magnetic Art
A Correlation of Interactive Science Grades 6-8 Modules, ©2016 Digital Refreshment
to the Next Generation Science Standards for Middle School
SE = Student Edition; TE = Teacher’s Edition; TLR = Teacher’s Lab Resource 23
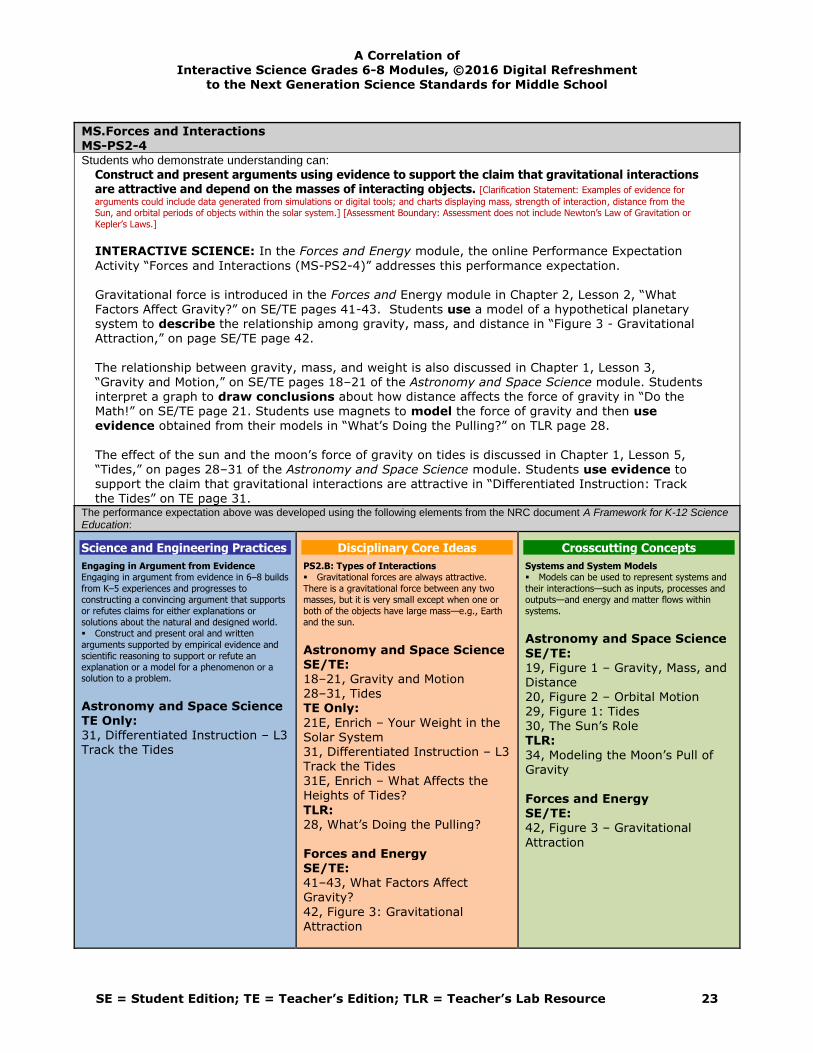
MS.Forces and Interactions MS-PS2-4 Students who demonstrate understanding can: Construct and present arguments using evidence to support the claim that gravitational interactions
are attractive and depend on the masses of interacting objects. [Clarification Statement: Examples of evidence for
arguments could include data generated from simulations or digital tools; and charts displaying mass, strength of interaction, distance from the Sun, and orbital periods of objects within the solar system.] [Assessment Boundary: Assessment does not include Newton’s Law of Gravitation or
Kepler’s Laws.]
INTERACTIVE SCIENCE: In the Forces and Energy module, the online Performance Expectation
Activity “Forces and Interactions (MS-PS2-4)” addresses this performance expectation. Gravitational force is introduced in the Forces and Energy module in Chapter 2, Lesson 2, “What Factors Affect Gravity?” on SE/TE pages 41-43. Students use a model of a hypothetical planetary system to describe the relationship among gravity, mass, and distance in “Figure 3 - Gravitational
Attraction,” on page SE/TE page 42.
The relationship between gravity, mass, and weight is also discussed in Chapter 1, Lesson 3, “Gravity and Motion,” on SE/TE pages 18–21 of the Astronomy and Space Science module. Students interpret a graph to draw conclusions about how distance affects the force of gravity in “Do the Math!” on SE/TE page 21. Students use magnets to model the force of gravity and then use evidence obtained from their models in “What’s Doing the Pulling?” on TLR page 28.
The effect of the sun and the moon’s force of gravity on tides is discussed in Chapter 1, Lesson 5, “Tides,” on pages 28–31 of the Astronomy and Space Science module. Students use evidence to support the claim that gravitational interactions are attractive in “Differentiated Instruction: Track the Tides” on TE page 31.
The performance expectation above was developed using the following elements from the NRC document A Framework for K-12 Science Education:
Science and Engineering Practices
Engaging in Argument from Evidence Engaging in argument from evidence in 6–8 builds
from K–5 experiences and progresses to constructing a convincing argument that supports
or refutes claims for either explanations or solutions about the natural and designed world. Construct and present oral and written
arguments supported by empirical evidence and
scientific reasoning to support or refute an explanation or a model for a phenomenon or a solution to a problem.
Astronomy and Space Science TE Only: 31, Differentiated Instruction – L3 Track the Tides
Disciplinary Core Ideas
PS2.B: Types of Interactions Gravitational forces are always attractive.
There is a gravitational force between any two masses, but it is very small except when one or
both of the objects have large mass—e.g., Earth and the sun.
Astronomy and Space Science SE/TE: 18–21, Gravity and Motion 28–31, Tides TE Only:
21E, Enrich – Your Weight in the Solar System 31, Differentiated Instruction – L3 Track the Tides
31E, Enrich – What Affects the Heights of Tides?
TLR: 28, What’s Doing the Pulling? Forces and Energy SE/TE: 41–43, What Factors Affect Gravity?
42, Figure 3: Gravitational Attraction
Crosscutting Concepts
Systems and System Models Models can be used to represent systems and
their interactions—such as inputs, processes and outputs—and energy and matter flows within
systems.
Astronomy and Space Science
SE/TE: 19, Figure 1 – Gravity, Mass, and Distance 20, Figure 2 – Orbital Motion 29, Figure 1: Tides 30, The Sun’s Role TLR:
34, Modeling the Moon’s Pull of Gravity
Forces and Energy SE/TE: 42, Figure 3 – Gravitational
Attraction

A Correlation of Interactive Science Grades 6-8 Modules, ©2016 Digital Refreshment
to the Next Generation Science Standards for Middle School
SE = Student Edition; TE = Teacher’s Edition; TLR = Teacher’s Lab Resource 24
--------------------------------------------------- Connections to Nature of Science
Scientific Knowledge is Based on Empirical
Evidence Science knowledge is based upon logical and
conceptual connections between evidence and explanations.
Astronomy and Space Science SE/TE: 29, Figure 1: Tides 30, The Sun’s Role TE Only: 31, Differentiated Instruction – Le
Track the Tides 31E, Enrich – What Affects the
Heights of Tides?
TE Only: 43, Plant Response to Gravity

A Correlation of Interactive Science Grades 6-8 Modules, ©2016 Digital Refreshment
to the Next Generation Science Standards for Middle School
SE = Student Edition; TE = Teacher’s Edition; TLR = Teacher’s Lab Resource 25
MS.Forces and Interactions MS-PS2-5 Students who demonstrate understanding can: Conduct an investigation and evaluate the experimental design to provide evidence that fields exist
between objects exerting forces on each other even though the objects are not in contact. [Clarification
Statement: Examples of this phenomenon could include the interactions of magnets, electrically-charged strips of tape, and electrically-charged pith balls. Examples of investigations could include first-hand experiences or simulations.] [Assessment Boundary: Assessment is limited to electric and
magnetic fields. Assessment is limited to qualitative evidence for the existence of fields.]
INTERACTIVE SCIENCE: In the Forces and Energy module, the online Performance Expectation
Activity “Forces and Interactions (MS-PS2-5)” addresses this performance expectation.
Gravitational fields are introduced in the Forces and Energy module in Chapter 2, Lesson 2, “What Factors Affect Gravity?” SE/TE pages 41-43. Students obtain information about electric fields in Chapter 6, Lesson 1, “How Do Charges Interact?,” on SE/TE pages 159-160. Magnetic fields are
introduced in Chapter 7, Lesson 2, “What Is a Magnetic Field’s Shape?” on SE/TE pages 201-203. The magnetic field of Earth is illustrated in “Figure 3: Earth’s Magnetic Field” on SE/TE page 204.
Students learn about electromagnetic fields in Chapter 7, Lesson 3, “Electromagnetic Force,” on SE/TE pages 209-211.
Students observe how the electric force of a charged balloon affects a stream of water in “Teacher Demo: Electric Field Exerts a Force” on TE page 160. Students demonstrate the forces acting at a distance from magnetic fields in the Apply it! feature on SE/TE page 203. They demonstrate that an electrical field can act at a distance to move an aluminum can in “Can You Move a Can Without Touching It?” on TLR page 148. Students conduct an investigation and evaluate the
experimental design to show a magnetic field acts at a distance when they use a magnet to detect fake coins in “Detecting Fake Coins” on TLR pages 188–191. Students conduct an investigation to show how iron filings in a Petri dish align if a magnet is placed beneath the Petri dish in “Predict the Field” on TLR page 193. Students conduct an investigation using iron filings and a magnet to model the effect of Earth’s magnetic field in “Earth’s Magnetic Field” on TLR page 195. Students conduct an investigation to show the effect of electric fields acting at a distance on
a compass in “Magnetic Fields From Electric Current” on TLR page 198. Students conduct an
investigation to show how an electromagnetic field can produce mechanical motion in “Can a Magnet Move a Wire?” on TLR page 201.
The performance expectation above was developed using the following elements from the NRC document A Framework for K-12 Science Education:
Science and Engineering Practices
Planning and Carrying Out Investigations Planning and carrying out investigations to
answer questions or test solutions to problems in 6–8 builds on K–5 experiences and progresses to
include investigations that use multiple variables and provide evidence to support explanations or design solutions.
Conduct an investigation and evaluate the
experimental design to produce data to serve as the basis for evidence that can meet the goals of the investigation.
Forces and Energy SE/TE: 203, Apply It! TLR: 182–190, Detecting Fake Coins 193, Predict the Field
198, Magnetic Fields From Electric Currents 201, Can a Magnet Move a Wire?
Disciplinary Core Ideas
PS2.B: Types of Interactions Forces that act at a distance (electric,
magnetic, and gravitational) can be explained by
fields that extend through space and can be mapped by their effect on a test object (a charged object, or a ball, respectively).
Astronomy and Space Science SE/TE:
18-21, Gravity and Motion
21, Do the Math! 29, Figure 1 – Tides 30, The Sun’s Role TE Only: 18A, Content Refresher 21E, Enrich – Your Weight in the
Solar System 31E, Enrich – What Affects the Heights of Tides? TLR: 27, What Factors Affect Gravity?
Crosscutting Concepts
Cause and Effect Cause and effect relationships may be used to
predict phenomena in natural or designed
systems.
Forces and Energy SE/TE:
159, Figure 1 – Repel or Attract?
161, Figure 3 – Charge Buildup 203, Apply It! 211, Apply It! TE Only: 200A – Content Refresher
165E, Enrich – St. Elmo’s Fire 204, Teacher Demo – Earth’s Magnetic Field 205, Differentiated Instruction – Multimedia Presentation

A Correlation of Interactive Science Grades 6-8 Modules, ©2016 Digital Refreshment
to the Next Generation Science Standards for Middle School
SE = Student Edition; TE = Teacher’s Edition; TLR = Teacher’s Lab Resource 26
Forces and Energy SE/TE: 41–43, What Factors Affect Gravity?
159–160, How Do Charges Interact? 159, Figure 1 – Repel or Attract 160, Figure 2 – Electric Fields 161, Figure 3 – Charge Buildup 201–203, What Is a Magnetic Field’s Shape?
201, Figure 1 – Magnetic Field Lines 202, Figure 2 – Magnetic Fields 204, Figure 3 – Earth’s Magnetic
Field 209–211, Electromagnetic Force 209, Figure 2 – Change Magnetic
Field Characteristics 210, Figure 3 – A Solenoid and an Electromagnet TE Only: 43, Teacher Demo 160, Teacher Demo – Electric
Field Exerts a Force 202, Address Misconceptions – Contact Forces and Field Forces 210, Build Inquiry – Modeling a Solenoid’s Magnetic Field TLR: 148, Can You Move a Can Without
Touching It? 149, Drawing Conclusions 182–190, Detecting Fake Coins 193, Predict the Field 194, Spinning in Circles 195, Earth’s Magnetic Field 196, Electromagnetism
197, Magnetic Fields From Electric Current 201, Can a Magnet Move a Wire?
TLR: 148, Can You Move a Can Without Touching It? 149, Drawing Conclusions
182–190, Detecting Fake Coins 193, Predict the Field 201, Can a Magnet Move a Wire?

A Correlation of Interactive Science Grades 6-8 Modules, ©2016 Digital Refreshment
to the Next Generation Science Standards for Middle School
SE = Student Edition; TE = Teacher’s Edition; TLR = Teacher’s Lab Resource 27
MS.Energy MS-PS3-1 Students who demonstrate understanding can: Construct and interpret graphical displays of data to describe the relationships of kinetic energy to
the mass of an object and to the speed of an object. [Clarification Statement: Emphasis is on descriptive relationships
between kinetic energy and mass separately from kinetic energy and speed. Examples could include riding a bicycle at different speeds, rolling different sizes of rocks downhill, and getting hit by a wiffle ball versus a tennis ball.]
INTERACTIVE SCIENCE: In the Forces and Energy module, the online Performance Expectation Activity “Forces and Interactions (MS-PS3-1)” addresses this performance expectation. The relationship between the kinetic energy of an object and the mass and speed of that object is
discussed in the Forces and Energy module, Chapter 4, Lesson 1, “Kinetic Energy,” on SE/TE pages 108–113. In “Figure 2: Kinetic Energy” on SE/TE page 110, students rank objects by amount of kinetic energy. In the Do the Math! feature on SE/TE page 111, students draw conclusions about
the relative amount of kinetic energy of a running person and a running dog. Students investigate the relationship between kinetic energy and speed by dropping a tennis ball and measuring the height of the bounce in “How High Does a Ball Bounce?” on TLR page 99. Students investigate the
effects of increasing the mass of a moving skateboard and kinetic energy’s relationship with mass and speed in “Mass, Velocity, and Kinetic Energy” on TLR page 109. Students construct graphical displays showing the relative amounts of kinetic and potential energy of a roller coaster as it progresses up and down ramps in “Figure 4: Conserving Energy While You Ride” on SE/TE page 124–125.
The performance expectation above was developed using the following elements from the NRC document A Framework for K-12 Science Education:
Science and Engineering Practices
Analyzing and Interpreting Data Analyzing data in 6–8 builds on K–5 and progresses to extending quantitative analysis to investigations, distinguishing between correlation and causation, and basic statistical techniques of data and error analysis. • Construct and interpret graphical displays of data to identify linear and nonlinear relationships.
Forces and Energy SE/TE: 124–125, Figure 4: Conserving
Energy While You Ride 127, Review and Assessment
Disciplinary Core Ideas
PS3.A: Definitions of Energy • Motion energy is properly called kinetic energy; it is proportional to the mass of the moving object and grows with the square of its speed.
Forces and Energy SE/TE: 110-111, Kinetic Energy 110, Figure 2 – Kinetic Energy 111, Relate Cause and Effect
111, Do the Math! TLR: 99, How High Does a Ball Bounce? 109, Mass, Velocity, and Kinetic Energy
Crosscutting Concepts
Scale, Proportion, and Quantity • Proportional relationships (e.g. speed as the ratio of distance traveled to time taken) among different types of quantities provide information about the magnitude of properties and processes.
Forces and Energy SE/TE:
111, Calculating Kinetic Energy 111, Do the Math! 124–125, Figure 4 – Conserving Energy While You Ride

A Correlation of Interactive Science Grades 6-8 Modules, ©2016 Digital Refreshment
to the Next Generation Science Standards for Middle School
SE = Student Edition; TE = Teacher’s Edition; TLR = Teacher’s Lab Resource 28
MS.Energy MS-PS3-2 Students who demonstrate understanding can: Develop a model to describe that when the arrangement of objects interacting at a distance
changes, different amounts of potential energy are stored in the system. [Clarification Statement: Emphasis is
on relative amounts of potential energy, not on calculations of potential energy. Examples of objects within systems interacting at varying distances could include: the Earth and either a roller coaster cart at varying positions on a hill or objects at varying heights on shelves, changing
the direction/orientation of a magnet, and a balloon with static electrical charge being brought closer to a classmate’s hair. Examples of models could include representations, diagrams, pictures, and written descriptions of systems.] [Assessment Boundary: Assessment is limited to two
objects and electric, magnetic, and gravitational interactions.]
INTERACTIVE SCIENCE: In the Forces and Energy module, the online Performance Expectation Activity “Forces and Interactions (MS-PS3-2)” addresses this performance expectation.
Students obtain information about potential energy in a gravitational field in the Forces and
Energy module in Chapter 4, Lesson 1, “Potential Energy,” on SE/TE page 112. Students calculate the gravitational potential energy of three rock climbers and rank the climbers according to the amount of potential energy. Students use models of arrangements of objects when they interpret diagrams of a person jumping on a trampoline in “Figure 4: Elastic Potential Energy” on SE/TE page 113. Students use models of a roller coaster to construct bar graphs showing the relative
amounts of potential and kinetic energy as the roller coaster moves up and down the tracks in “Figure 4: Conserving Energy While You Ride” on SE/TE pages 124–125. In Lesson 2, SE/TE page 115, students draw conclusions about the change in the potential energy of a basketball as its position changes. In “Determining Mechanical Energy” on TLR page 111, students drop a ball from four different heights onto clay to observe the difference in the effect and explain these differences in terms of increased potential energy due to position. In “Design and Build a Roller
Coaster” on Chapter Activities and Projects pages 386–392, students build a roller coaster and change variables to determine how potential energy is stored in the system. Students obtain information about the interaction of electrical charges and the force between charged objects in Chapter 6, Lesson 1, “Electric Charge and Static Electricity,” on SE/TE pages
158–161 of the Forces and Energy module. Students label drawings to develop models that describe how the position of charged spheres relative to each other changes when the charges on
the spheres change (thus changing the amount of potential energy) in “Figure 1: Repel or Attract?” on SE/TE page 159. Students label photographs to develop models describing that as the distance between a charged balloon and a student’s hair decreases, the student’s hair becomes attracted to the balloon (thus changing the amount of potential energy stored in the student–balloon “system”) in “Figure 3: Charge Buildup” on SE/TE page 161. Students investigate how the interaction of a charged balloon and an aluminum can changes as the balloon is brought closer to the can in “Can You Move a Can Without Touching It?” on TLR page 148.
Students obtain information about magnets and the interaction of magnetic poles in “How Do Magnetic Poles Interact?” on SE/TE page 198–199 of the Forces and Energy module. Students label drawings to develop models describing that when the distance between magnetic poles decreases, the arrangement of the poles relative to each other changes (thus changing the amount of potential energy stored in the magnet–magnet system) in “Figure 2: Attraction and Repulsion”
on SE/TE page 198. Students investigate how the interaction of two toy cars changes when a bar magnet is attached to each car and the distance between the cars decreases in “Magnetic Poles” on TLR page 192.
The performance expectation above was developed using the following elements from the NRC document A Framework for K-12 Science Education:
Science and Engineering Practices
Developing and Using Models Modeling in 6–8 builds on K–5 and progresses to developing, using and revising models to describe, test, and predict more abstract phenomena and design systems.
Disciplinary Core Ideas
PS3.A: Definitions of Energy • A system of objects may also contain stored (potential) energy, depending on their relative positions.
Crosscutting Concepts
Systems and System Models • Models can be used to represent systems and their interactions – such as inputs, processes, and outputs – and energy and matter flows within systems.

A Correlation of Interactive Science Grades 6-8 Modules, ©2016 Digital Refreshment
to the Next Generation Science Standards for Middle School
SE = Student Edition; TE = Teacher’s Edition; TLR = Teacher’s Lab Resource 29
• Develop a model to describe unobservable mechanisms.
Forces and Energy SE/TE: 112, Figure 3 – Gravitational Potential Energy
Forces and Energy SE/TE: 112, Potential Energy 112, Figure 3 – Gravitational
Potential Energy 115, Figure 1, Mechanical Energy 124–125, Figure 4 – Conserving Energy While You Ride 158–161, Electric Charge and Static Electricity 159, Figure 1 – Repel or Attract?
161, Figure 3 – Charge Buildup 198–199 How Do Magnetic Poles Interact? 198, Figure 2 – Attraction and
Repulsion TLR: 111, Determining Mechanical
Energy 148, Can You Move a Can Without Touching It? 192, Magnetic Poles PS3.C: Relationship Between Energy and Forces • When two objects interact, each one exerts a force on the other that can cause energy to be transferred to or from the object.
Forces and Energy SE/TE:
116, Mechanical Energy and Work 158–161, Electric Charge and Static Electricity 159, Figure 1 – Repel or Attract? 161, Figure 3 – Charge Buildup
198–199 How Do Magnetic Poles Interact? 198, Figure 2 – Attraction and Repulsion TLR: 111, Determining Mechanical Energy
148, Can You Move a Can Without Touching It? 192, Magnetic Poles
Forces and Energy SE/TE: 124–125, Figure 4 – Conserving Energy While You Ride
161, Figure 3 – Charge Buildup 198, Figure 2 – Attraction and Repulsion TLR: 111, Determining Mechanical Energy
Chapter Activities and Projects 386–392, Design and Build a Roller Coaster

A Correlation of Interactive Science Grades 6-8 Modules, ©2016 Digital Refreshment
to the Next Generation Science Standards for Middle School
SE = Student Edition; TE = Teacher’s Edition; TLR = Teacher’s Lab Resource 30
MS.Energy MS-PS3-3 Students who demonstrate understanding can: Apply scientific principles to design, construct, and test a device that either minimizes or
maximizes thermal energy transfer.* [Clarification Statement: Examples of devices could include an insulated box, a solar
cooker, and a Styrofoam cup.] [Assessment Boundary: Assessment does not include calculating the total amount of thermal energy transferred.]
INTERACTIVE SCIENCE: In the Forces and Energy module, the online Performance Expectation Activity “Forces and Interactions (MS-PS3-3)” addresses this performance expectation. Temperature and thermal energy are discussed in Chapter 5, Lesson 1 “Temperature, Thermal Energy, and Heat,” on SE/TE pages 136–139 of the Forces and Energy module. Students obtain information about heat transfer in Chapter 5, Lesson 2, “The Transfer of Heat,” on SE/TE pages
140–143. The citations below indicate additional areas in Interactive Science where these and related ideas are presented.
The performance expectation above was developed using the following elements from the NRC document A Framework for K-12 Science Education:
Science and Engineering Practices
Constructing Explanations and Designing Solutions • Constructing explanations and designing solutions in 6–8 builds on K–5 experiences and progresses to include constructing explanations and designing solutions supported by multiple sources of evidence consistent with scientific ideas, principles, and theories. Apply scientific ideas or principles to design, construct, and test a design of an object, tool, process or system.
Ecology and the Environment TLR: 144-152, Design and Build a Solar Cooker Forces and Energy
SE/TE: 153, Science Matters, Make Way for Heat TE Only: 142, 21st Century Learning – Creativity
TLR: 125-133, Lab Investigation, Build
Your Own Thermometer STEMQuest: Keep Hot Liquids Hot Contain the Heat Keep the Heat In
Keep the Cold Out Reflect on Your Insulating Container Chapter Activities and Projects: 414-420, In Hot Water
Disciplinary Core Ideas
PS3.A: Definitions of Energy • Temperature is a measure of the average kinetic energy of particles of matter. The relationship between the temperature and the total energy of a system depends on the types, states, and amounts of matter present.
Forces and Energy SE/TE: 136-137, What Determines the
Temperature of an Object?
138-139, What Is Thermal Energy? TE Only: 139A, After the Inquiry Warm-Up – How Cold Is the Water? TLR:
124, How Cold Is the Water? 125-133, Build Your Own Thermometer 134, Temperature and Thermal Energy PS3.B: Conservation of Energy and Energy Transfer • Energy is spontaneously transferred out of hotter regions or objects and into colder ones.
Forces and Energy SE/TE:
139, Heat 140-143, The Transfer of Heat TE Only: 139, Support the Big Q – Where Does Heat Go?
Crosscutting Concepts
Energy and Matter • The transfer of energy can be tracked as energy flows through a designed or natural system.
Forces and Energy SE/TE: 120-125, Energy Transformations and Conservation 140-143, The Transfer of Heat TE Only:
125A, After the Inquiry
Warm-Up – What Would Make a Card Jump? TLR: 113, What Would Make a Card Jump? 136, Visualizing Convection
Currents STEMQuest: Keep Hot Liquids Hot Contain the Heat

A Correlation of Interactive Science Grades 6-8 Modules, ©2016 Digital Refreshment
to the Next Generation Science Standards for Middle School
SE = Student Edition; TE = Teacher’s Edition; TLR = Teacher’s Lab Resource 31
142, Build Inquiry – Heat Flow From Lamps 143, Differentiated Instruction – Observing Conduction
143A, After the Inquiry Warm-Up - What Does It Mean to Heat Up? 143E, Enrich – Radiating Heat TLR: 135, What Does It Mean to Heat Up?
136, Visualizing Convection Currents STEMQuest: Keep Hot Liquids Hot
Contain the Heat ETS1.A: Defining and Delimiting an Engineering Problem • The more precisely a design task’s criteria and constraints can be defined, the more likely it is that the designed solution will be successful. Specification of constraints includes consideration of scientific principles and other relevant knowledge that is likely to limit possible solutions. (secondary to MS-PS3-3)
Ecology and the Environment TLR: 144-152, Design and Build a
Solar Cooker
Forces and Energy STEMQuest: Keep Hot Liquids Hot Contain the Heat Keep the Heat In
Keep the Cold Out Reflect on Your Insulating Container Chapter Activities and Projects 414-420, In Hot Water ETS1.B: Developing Possible Solutions • A solution needs to be tested, and then modified on the basis of the test results in order to improve it. There are systematic processes for evaluating solutions with respect to how well they meet criteria and constraints of a problem. (secondary to MS-PS3-3)
Ecology and the Environment
TLR: 144-152, Design and Build a Solar Cooker

A Correlation of Interactive Science Grades 6-8 Modules, ©2016 Digital Refreshment
to the Next Generation Science Standards for Middle School
SE = Student Edition; TE = Teacher’s Edition; TLR = Teacher’s Lab Resource 32
Forces and Energy STEMQuest: Keep Hot Liquids Hot Keep the Cold Out
Reflect on Your Insulating Container Chapter Activities and Projects 414-420, In Hot Water
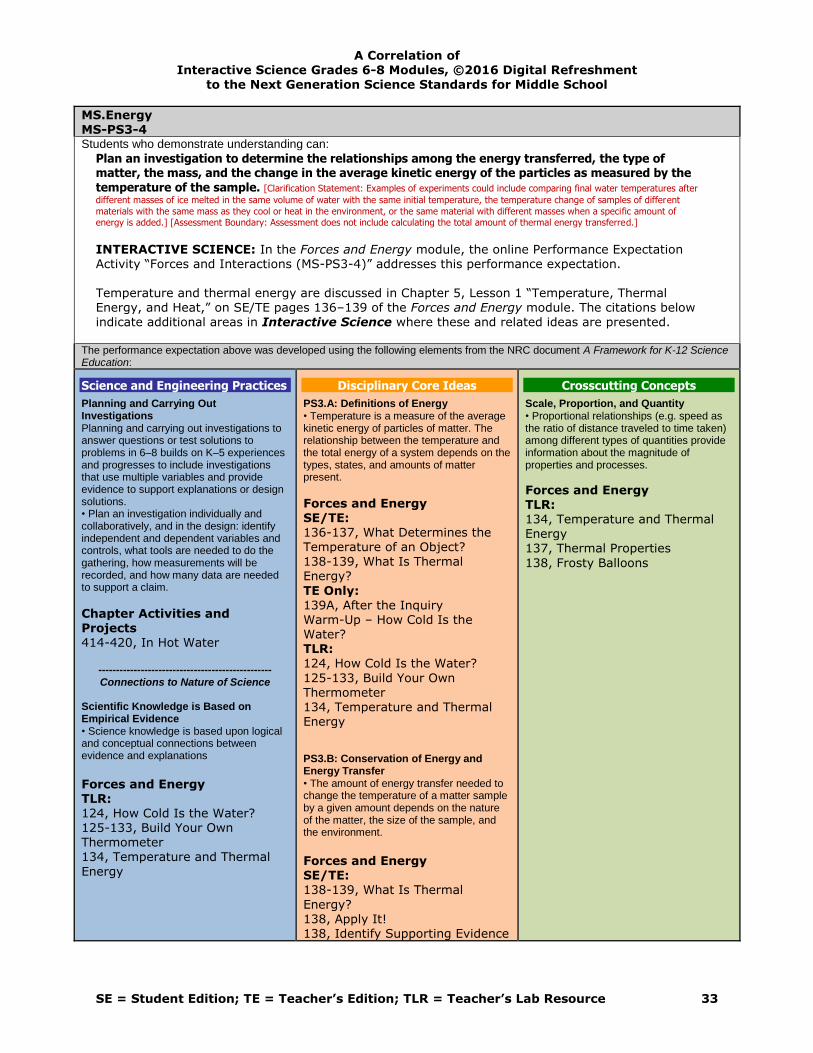
A Correlation of Interactive Science Grades 6-8 Modules, ©2016 Digital Refreshment
to the Next Generation Science Standards for Middle School
SE = Student Edition; TE = Teacher’s Edition; TLR = Teacher’s Lab Resource 33
MS.Energy MS-PS3-4 Students who demonstrate understanding can: Plan an investigation to determine the relationships among the energy transferred, the type of
matter, the mass, and the change in the average kinetic energy of the particles as measured by the temperature of the sample. [Clarification Statement: Examples of experiments could include comparing final water temperatures after
different masses of ice melted in the same volume of water with the same initial temperature, the temperature change of samples of different
materials with the same mass as they cool or heat in the environment, or the same material with different masses when a specific amount of energy is added.] [Assessment Boundary: Assessment does not include calculating the total amount of thermal energy transferred.]
INTERACTIVE SCIENCE: In the Forces and Energy module, the online Performance Expectation Activity “Forces and Interactions (MS-PS3-4)” addresses this performance expectation. Temperature and thermal energy are discussed in Chapter 5, Lesson 1 “Temperature, Thermal Energy, and Heat,” on SE/TE pages 136–139 of the Forces and Energy module. The citations below indicate additional areas in Interactive Science where these and related ideas are presented.
The performance expectation above was developed using the following elements from the NRC document A Framework for K-12 Science Education:
Science and Engineering Practices
Planning and Carrying Out Investigations Planning and carrying out investigations to answer questions or test solutions to problems in 6–8 builds on K–5 experiences and progresses to include investigations that use multiple variables and provide evidence to support explanations or design solutions. • Plan an investigation individually and collaboratively, and in the design: identify independent and dependent variables and controls, what tools are needed to do the gathering, how measurements will be recorded, and how many data are needed to support a claim.
Chapter Activities and Projects 414-420, In Hot Water
------------------------------------------------- Connections to Nature of Science
Scientific Knowledge is Based on Empirical Evidence • Science knowledge is based upon logical and conceptual connections between evidence and explanations
Forces and Energy TLR: 124, How Cold Is the Water? 125-133, Build Your Own Thermometer 134, Temperature and Thermal
Energy
Disciplinary Core Ideas
PS3.A: Definitions of Energy • Temperature is a measure of the average kinetic energy of particles of matter. The relationship between the temperature and the total energy of a system depends on the types, states, and amounts of matter present.
Forces and Energy SE/TE: 136-137, What Determines the Temperature of an Object?
138-139, What Is Thermal Energy?
TE Only: 139A, After the Inquiry Warm-Up – How Cold Is the Water? TLR: 124, How Cold Is the Water?
125-133, Build Your Own Thermometer 134, Temperature and Thermal Energy PS3.B: Conservation of Energy and Energy Transfer • The amount of energy transfer needed to change the temperature of a matter sample by a given amount depends on the nature of the matter, the size of the sample, and the environment.
Forces and Energy SE/TE: 138-139, What Is Thermal
Energy? 138, Apply It! 138, Identify Supporting Evidence
Crosscutting Concepts
Scale, Proportion, and Quantity • Proportional relationships (e.g. speed as the ratio of distance traveled to time taken) among different types of quantities provide information about the magnitude of properties and processes.
Forces and Energy TLR: 134, Temperature and Thermal Energy 137, Thermal Properties
138, Frosty Balloons

A Correlation of Interactive Science Grades 6-8 Modules, ©2016 Digital Refreshment
to the Next Generation Science Standards for Middle School
SE = Student Edition; TE = Teacher’s Edition; TLR = Teacher’s Lab Resource 34
TE Only: 138, Make Analogies 138, Apply It! TLR:
134, Temperature and Thermal Energy
*The performance expectations marked with an asterisk integrate traditional science content with engineering through a Practice or Disciplinary Core
Idea.

A Correlation of Interactive Science Grades 6-8 Modules, ©2016 Digital Refreshment
to the Next Generation Science Standards for Middle School
SE = Student Edition; TE = Teacher’s Edition; TLR = Teacher’s Lab Resource 35
MS.Energy MS-PS3-5 Students who demonstrate understanding can: Construct, use, and present arguments to support the claim that when the kinetic energy of an
object changes, energy is transferred to or from the object. [Clarification Statement: Examples of empirical evidence
used in arguments could include an inventory or other representation of the energy before and after the transfer in the form of temperature changes or motion of object.] [Assessment Boundary: Assessment does not include calculations of energy.]
INTERACTIVE SCIENCE: In the Forces and Energy module, the online Performance Expectation Activity “Forces and Interactions (MS-PS3-5)” addresses this performance expectation. Energy transformations are discussed in Chapter 4, Lesson 3, “Energy Transformations and
Conservation,” on SE/TE pages 120–125 of the Forces and Energy module. The citations below indicate additional areas in Interactive Science where this idea is presented.
The performance expectation above was developed using the following elements from the NRC document A Framework for K-12 Science Education:
Science and Engineering Practices
Engaging in Argument from Evidence Engaging in argument from evidence in 6–8 builds on K–5 experiences and progresses to constructing a convincing argument that supports or refutes claims for either explanations or solutions about the natural and designed worlds. • Construct, use, and present oral and written arguments supported by empirical evidence and scientific reasoning to support or refute an explanation or a model for a phenomenon.
Forces and Energy
TE Only: 125, Differentiated Instruction – Oral Presentation Chapter Activities and Projects 386-392, Design and Build a
Roller Coaster Scenario-Based Investigations 166-168, Stuck at the Top
------------------------------------------------- Connections to Nature of Science
Scientific Knowledge is Based on Empirical Evidence • Science knowledge is based upon logical and conceptual connections between evidence and explanations
Forces and Energy TLR: 112, Forms of Energy 113, What Would Make a Card Jump?
114, Soaring Straws
Disciplinary Core Ideas
PS3.B: Conservation of Energy and Energy Transfer • When the motion energy of an object changes, there is inevitably some other change in energy at the same time.
Forces and Energy SE/TE: 120-123, How Are Different Forms of Energy Related? 124-125, What Is the Law of
Conservation of Energy?
TE Only: 122, 21st Century Learning – Critical Thinking 123, Differentiated Instruction – Pole Vault Energy 123, Build Inquiry – Model Pole
Vaulting 125, Differentiated Instruction – Oral Presentation TLR: 113, What Would Make a Card Jump?
114, Soaring Straws Chapter Activities and Projects
386-392, Design and Build a Roller Coaster
Crosscutting Concepts
Energy and Matter • Energy may take different forms (e.g. energy in fields, thermal energy, energy of motion).
Forces and Energy SE/TE: 108-109, How Are Energy, Work,
and Power Related? 110-113, What Are Two Types of Energy? 114-116, How Can You Find an
Object’s Mechanical Energy? 117-119, What Are Other Forms
of Energy? TLR: 110, What Makes a Flashlight Shine? 112, Forms of Energy Chapter Activities and
Projects 386-392, Design and Build a Roller Coaster Scenario-Based Investigations 166-168, Stuck at the Top

A Correlation of Interactive Science Grades 6-8 Modules, ©2016 Digital Refreshment
to the Next Generation Science Standards for Middle School
SE = Student Edition; TE = Teacher’s Edition; TLR = Teacher’s Lab Resource 36
MS.Waves and Electromagnetic Radiation MS-PS4-1 Students who demonstrate understanding can: Use mathematical representations to describe a simple model for waves that includes how the
amplitude of a wave is related to the energy in a wave. [Clarification Statement: Emphasis is on describing waves with
both qualitative and quantitative thinking.] [Assessment Boundary: Assessment does not include electromagnetic waves and is limited to standard repeating waves.]
INTERACTIVE SCIENCE: In the Sound and Light module, the online Performance Expectation Activity “Waves and Electromagnetic Radiation (MS-PS4-1)” addresses this performance expectation.
The definition, characteristics, and types of mechanical waves are discussed on SE/TE pages 4–9 of Chapter 1, Lesson 1, “What Are Waves?” in the Sound and Light module. The relationship between wave amplitude and the energy in waves is described in “Amplitude” on SE/TE page 11.
Students use models of waves to identify areas of compression and areas of rarefaction in “Figure 3: Motion in a Longitudinal Wave” on SE/TE page 8 and in the “Apply It!” on this same page.
Students use models of a transverse wave to measure its amplitude in “Figure 1: Amplitude” on SE/TE page 11. Students use models of a transverse wave to identify wavelength and frequency in “Figure 2: Properties of Waves” on SE/TE pages 12–13. Students use mathematical representations to describe a simple model for waves when they construct a table by using mathematical formulas to show the relationship between wavelength, frequency, and speed in “Do the Math!” on SE/TE page 14. Students predict how the amplitude of the waves in the wave pool at an amusement park will change if the timing and strength (i.e., energy) of the waves changed in
“Figure 3: Ride the Waves” on SE/TE page 15. Students use mathematical representations when they use a graph to answer questions related to patterns in the orbit of one of Jupiter’s moons in “Enrich: Moon Waves” on TE page 15E. Students investigate how amplitude and energy are related in “What Do Waves Look Like?” on TLR page 12.
The performance expectation above was developed using the following elements from the NRC document A Framework for K-12 Science Education:
Science and Engineering Practices
Using Mathematics and Computational
Thinking Mathematical and computational thinking at the
6–8 level builds on K–5 and progresses to identifying patterns in large data sets and using mathematical concepts to support explanations
and arguments. Use mathematical representations to describe
and/or support scientific conclusions and design solutions.
Sound and Light SE/TE: 14, Do the Math!
TE Only:
15E, Enrich – Moon Waves --------------------------------------------------
Connections to Nature of Science Scientific Knowledge is Based on Empirical
Evidence Science knowledge is based upon logical and
conceptual connections between evidence and explanations.
Disciplinary Core Ideas
PS4.A: Wave Properties
A simple wave has a repeating pattern with a specific wavelength, frequency, and amplitude.
Sound and Light SE/TE: 4–9, What Are Waves?
9, Figure 4 – Waves Transfer Energy 10–15, Properties of Waves 11, Figure 1: Amplitude 12–13, Figure 2: Properties of Waves
14, Do the Math! 15, Figure 3 – Ride the Waves 28, Wall of Water 29, The Operatic Superpower TE Only: 7, Teacher Demo – Diagram Transverse Waves
9, Differentiated Instruction – L3 Torsional Waves 9E, Enrich – Waves in the World Around You
Crosscutting Concepts
Patterns
Graphs and charts can be used to identify patterns in data.
Sound and Light
SE/TE: 14, Do the Math! 37, Figure 3: Speed of Sound in Air 38, Do the Math! 43, Apply It! 74, Figure 2: The Electromagnetic
Spectrum
TE Only: 15E, Enrich – Moon Waves 37, Differentiated Instruction – L3 Properties of Sound Waves 43, Differentiated Instruction – L3
Research Decibel Levels 57E, Enrich – Range of Hearing

A Correlation of Interactive Science Grades 6-8 Modules, ©2016 Digital Refreshment
to the Next Generation Science Standards for Middle School
SE = Student Edition; TE = Teacher’s Edition; TLR = Teacher’s Lab Resource 37
Sound and Light SE/TE: 6, Waves and Energy 6, Figure 1: Forming a Mechanical
Wave TLR: 10, What Causes Mechanical Waves? 12, What Do Waves Look Like? 11, Three Types of Waves
13, Teacher Demo – Speed of a Wave 13, Differentiated Instruction – Make a Presentation
15, Differentiated Instruction – Solve Problems 15, Differentiated Instruction – Wave Pool 15E, Enrich – Mon Waves TLR: 9, What Are Waves?
10, What Causes Mechanical Waves? 11, Three Types of Waves 12, What Do Waves Look Like?
13, Properties of Waves 14, What Affects the Speed of a Wave?

A Correlation of Interactive Science Grades 6-8 Modules, ©2016 Digital Refreshment
to the Next Generation Science Standards for Middle School
SE = Student Edition; TE = Teacher’s Edition; TLR = Teacher’s Lab Resource 38
MS.Waves and Electromagnetic Radiation MS-PS4-2 Students who demonstrate understanding can: Develop and use a model to describe that waves are reflected, absorbed, or transmitted through
various materials. [Clarification Statement: Emphasis is on both light and mechanical waves. Examples of models could include drawings,
simulations, and written descriptions.] [Assessment Boundary: Assessment is limited to qualitative applications pertaining to light and mechanical waves.]
INTERACTIVE SCIENCE: In the Sound and Light module, the online Performance Expectation Activity “Waves and Electromagnetic Radiation (MS-PS4-2)” addresses this performance expectation.
The materials that sound waves travel through are explored in Chapter 2, Lesson 1, “The Nature of Sound,” on SE/TE pages 34–39 of the Sound and Light module. Students use a model of sound waves to identify areas of rarefaction and compression in “Figure 1: Sound Waves” on SE/TE page 35. They use a model of a bird’s anatomy to show how birds produce sound in “Enrich: The Sound
of Nature” on SE/TE page 39F. A discussion of pitch, loudness, and the Doppler affect is provided in
“Properties of Sound” on SE/TE pages 40– 45. Students make models representing different sound frequencies (pitch) in “Figure 1: Pitch” on SE/TE page 41. Students can develop and use a model to represent loudness in “Build Inquiry: Model Sound Intensity” on TE page 42. Students use a model to show how headphones transmit sound waves through air in “Figure 4: How Your Headphones Work” on SE/TE page 45. Echolocation, sonar and ultrasound imaging, which make use of reflected sound waves, are discussed in Lesson 5 on SE/TE pages 55–56. Students use models
to describe how echolocation and sonar work in “Figure 1: Echolocation” on SE/TE page 55 and “Apply It!” on SE/TE page 56, respectively. Students investigate reflected sound waves and explain how these waves moved in “Designing Experiments” on TLR page 55. The properties of electromagnetic waves, which include light waves, are described in Chapter 3, Lesson 1, “The Nature of Electromagnetic Waves,” on SE/TE pages 68–71 of the Sound and Light
module. Students use a model of light in “Figure 2: Light as a Wave” on SE/TE page 70. They write labels to develop and use a model of light waves emitted by a flashlight in “Apply It!” on SE/TE page 71. They develop a model of the electromagnetic spectrum in “Differentiated Instruction:
Make a Drawing” on TE page 75. They develop and use a model of the electromagnetic spectrum in “Figure 6: Surfing the Spectrum” on SE/TE page 79.
Light waves are discussed in the Sound and Light module in Chapter 4. Absorption of light waves is presented in Lesson 1, “Light and Color,” on SE/TE pages 98-103. Students use a model to show
which colors are produced by absorption, transmittal, and reflection of light waves in “Figure 2: Color of an Opaque Object” on SE/TE page 100. They develop and use models to indicate how the colors we see are affected by red, green, and blue filters in “Apply It!” on SE/TE page 101. Students learn about the reflection of light waves in Lesson 2, “Reflection and Mirrors,” on SE/TE pages 104-109. They develop models by adding labels to illustrations showing how light reflects off different materials in “Figure 1: Diffuse and Regular Reflection” on SE/TE page 105. They use models
showing how light reflects off of mirrors in “Figure 3: Concave Mirror” on SE/TE page 107, “Figure 4: Convex Mirror” on SE/TE page 108, and “Apply It!” on SE/TE page 109. They use a model showing how light is reflected and refracted by water droplets in “Figure 3: Water + Light = A Rainbow” on SE/TE page 113. They develop a model of reflected light waves in “Differentiated Instruction: Diagramming a Mirage” on TE page 115. They draw and add labels to develop and use
models illustrating how light is transmitted and reflected in cameras and telescopes in (respectively) “Apply It!” on SE/TE page 123 and “Figure 1: Reflecting and Refracting Telescopes”
on SE/TE page 124. They develop a model of a reflecting telescope in “Seeing Double” on SE/TE page 130. They develop and use a model to show how light reflects off of (and is absorbed and scattered by) a chameleon’s skin in “Hiding in Plain Sight” on SE/TE page 131. Seismic waves, which are mechanical waves, are explored in the Earth’s Structure module, Chapter 4, Lesson 2, “What Are Seismic Waves?” on SE/TE pages 111-113. Students use models of three types of seismic waves in “Figure 2: P, S, and Surface Waves” on SE/TE page 113. Students model
seismic waves in “Properties of Seismic Waves” on TLR page 102.
The performance expectation above was developed using the following elements from the NRC document A Framework for K-12 Science Education:

A Correlation of Interactive Science Grades 6-8 Modules, ©2016 Digital Refreshment
to the Next Generation Science Standards for Middle School
SE = Student Edition; TE = Teacher’s Edition; TLR = Teacher’s Lab Resource 39
Science and Engineering Practices
Developing and Using Models Modeling in 6–8 builds on K–5 and progresses to
developing, using, and revising models to describe, test, and predict more abstract phenomena and design systems.
Develop and use a model to describe
phenomena.
Sound and Light SE/TE: 35, Figure 1 – Sound Waves
41, Figure 1 – Pitch 71, Apply It! 73, Figure 1 – Comparing Electromagnetic Waves
74, Figure 2 – The Electromagnetic Spectrum 79, Figure 6 – Surfing the
Spectrum 99, Figure 1 – Types of Materials 100, Figure 2 – Color of an Opaque Object 101, Apply It! 105, Figure 1 – Diffuse and Regular Reflection
108, Figure 4 – Convex Mirror 115, Figure 5 – Concave Lens 116, Figure 7 – How a Convex Lens Works 123, Apply It!
124, Figure 1 – Reflecting and
Refracting Telescopes 130, Seeing Double 131, Hiding in Plain Sight TE Only: 42, Build Inquiry – Model Sound Intensity 43, Differentiated Instruction – L1
Make a Drawing 75, Differentiated Instruction – L1 Make a Drawing 107, Differentiated Instruction – L3 Diagram Reflected Rays 115, Differentiated Instruction – L1 Diagramming a Mirage
TLR:
52, Hearing Sound STEMQuest: Design to Stop a Thief Light Behavior
Disciplinary Core Ideas
PS4.A: Wave Properties A sound wave needs a medium through which
it is transmitted.
Sound and Light
SE/TE: 34-39, The Nature of Sound 35, Figure 1: Sound Waves Properties of Sound 38, Did You Know? 40–45, Properties of Sound TE Only:
37, Differentiated Instruction – L1 Feel Sound Waves
38, Teacher Demo – Stiffness and Speed of Sound 39, Differentiated Instruction – L3 Write a Story
39F, The Sound of Nature 44, Teacher Demo – Model the Doppler Effect 49E, Enrich – Musical Wood TLR: 35, What Is Sound? 36, Understandings Sound
37, Ear to the Sound 48, Listen to This 51, How Can You Change Pitch? PS4.B: Electromagnetic Radiation When light shines on an object, it is reflected,
absorbed, or transmitted through the object, depending on the object’s material and the frequency (color) of the light.
Sound and Light SE/TE: 98–101 What Determines Color? 100, Figure 2 – Color of an
Opaque Object 101, Apply It! 104–109, Reflection and Mirrors 105, Figure 1 – Diffuse and Regular Reflection 107, Figure 3 – Concave Mirror
108, Figure 4 – Convex Mirror
109, Apply It! TE Only: 100, Teacher Demo – Light Reflected by Opaque Materials 103E, Enrich – Colors: Reflected, Absorbed, Passed Through
107, Teacher Demo – Model Reflection From a Concave Mirror 107, Differentiated Instruction – L3 Diagram Reflected Rays
Crosscutting Concepts
Structure and Function Structures can be designed to serve particular
functions by taking into account properties of different materials, and how materials can be
shaped and used.
Sound and Light SE/TE: 109, Apply It! 122–125, Using Light 123, Apply It! 124, Figure 1 – Reflecting and Refracting Telescopes
125, Figure 2 – Microscope 130, Seeing Double
TE Only: 125, Differentiated Instruction – L3 Scanning Electron Microscope (SEM) TLR:
110, How Does a Pinhole Camera Work? 111, What a View! STEMQuest: Design to Stop a Thief Make Light Go Where You Want It
Optical Demonstration An Optimal Optical Solution Reflect on Your Demonstration

A Correlation of Interactive Science Grades 6-8 Modules, ©2016 Digital Refreshment
to the Next Generation Science Standards for Middle School
SE = Student Edition; TE = Teacher’s Edition; TLR = Teacher’s Lab Resource 40
TLR: 92, Developing Hypotheses 93–101, Changing Colors 103, Observing
STEMQuest: Design to Stop a Thief Light Behavior Make Light Go Where You Want It Optical Demonstration An Optimal Optical Solution Reflect on Your Demonstration The path that light travels can be traced as
straight lines, except at surfaces between different transparent materials (e.g., air and
water, air and glass) where the light path bends. (MS-PS4-2)
Sound and Light SE/TE: 104–109, Reflection and Mirrors 106, Figure 2 – Image in a Plane Mirror 110–117, Refraction and Lenses 113, Figure 3 – Water + Light = A
Rainbow 116, Figure 7 – How a Convex Lens Works 117, Apply It! 122–125, Using Light 123, Apply It! 124, Figure 1: Reflecting and
Refracting Telescopes TE Only: 71E, Enrich – Measuring the Speed of Light 107, Teacher Demo – Model Reflection From a Concave Mirror
113, Build Inquiry – Observing Refraction of Light 116, Teacher Demo – Focal Point 117E, Enrich – Light Benders 121E, Enrich – A Better View TLR: 102, How Does Your Reflection
Wink? 104, Mirror Images
106, Bent Pencil STEMQuest: Design to Stop a Thief Light Behavior Make Light Go Where You Want It
Optical Demonstration An Optimal Optical Solution Reflect on Your Demonstration

A Correlation of Interactive Science Grades 6-8 Modules, ©2016 Digital Refreshment
to the Next Generation Science Standards for Middle School
SE = Student Edition; TE = Teacher’s Edition; TLR = Teacher’s Lab Resource 41
A wave model of light is useful for explaining
brightness, color, and the frequency-dependent bending of light at a surface between media.
Sound and Light SE/TE 68–69, What Makes Up Electromagnetic Waves? 71, Wave Model of Light 71, Figure 2: Light as a Wave 71, Apply It!
TE Only: 70, Build Inquiry – Observe How Filters Polarize Light 71, Differentiated Instruction – L1 Polarized Sunglasses
However, because light can travel through
space, it cannot be a matter wave, like sound or water waves.
Sound and Light SE/TE 71, Particle Model of Light 71, Figure 3 – The Photoelectric Effect

A Correlation of Interactive Science Grades 6-8 Modules, ©2016 Digital Refreshment
to the Next Generation Science Standards for Middle School
SE = Student Edition; TE = Teacher’s Edition; TLR = Teacher’s Lab Resource 42
MS.Waves and Electromagnetic Radiation MS-PS4-3 Students who demonstrate understanding can: Integrate qualitative scientific and technical information to support the claim that digitized signals
are a more reliable way to encode and transmit information than analog signals. [Clarification Statement:
Emphasis is on a basic understanding that waves can be used for communication purposes. Examples could include using fiber optic cable to transmit light pulses, radio wave pulses in Wi-Fi devices, and conversion of stored binary patterns to make sound or text on a computer screen.]
[Assessment Boundary: Assessment does not include binary counting. Assessment does not include the specific mechanism of any given device.]
INTERACTIVE SCIENCE: In the Sound and Light module, the online Performance Expectation Activity “Waves and Electromagnetic Radiation (MS-PS4-3)” addresses this performance expectation. Students list the advantages and disadvantages of using voice recognition software to create a word-processing document in “Relate Text and Visuals” on SE/TE page 120 of the Science and
Technology module. Students can integrate qualitative scientific and technical information by reading the discussion regarding designing a computer mouse on SE/TE pages 124–131 and then answering the questions in “Enrich – A Redesigned Mouse” on TE page 131E. A discussion of the use of computers in mapmaking is provided in Chapter 1, Lesson 3, “Mapping Technology,” on SE/TE pages 18–23 in the Earth’s Surface module. Students can integrate technical information from their textbooks to answer questions regarding the advantages of using
computers for mapmaking in “Teach Key Concepts” on TE page 19. A discussion of the use of digitized satellite images to make maps is included in “Maps From Satellite Images” on SE/TE page 20. A discussion of the technologies involved with cell phones, satellite communications, and the global positioning system is included on pages 84–86 of the Sound and Light module.
The performance expectation above was developed using the following elements from the NRC document A Framework for K-12 Science Education:
Science and Engineering Practices
Obtaining, Evaluating, and Communicating Information Obtaining, evaluating, and communicating
information in 6-8 builds on K-5 and progresses to evaluating the merit and validity of ideas and
methods. Integrate qualitative scientific and technical
information in written text with that contained in media and visual displays to clarify claims and
findings.
Science and Technology SE/TE: 120, Relate Text and Visuals
STEMQuest: Testing, Testing…1,
2, 3 Analog and Digital Recordings Evaluate Recording Technologies
Disciplinary Core Ideas
PS4.C: Information Technologies and Instrumentation Digitized signals (sent as wave pulses) are a
more reliable way to encode and transmit information.
Science and Technology SE/TE: 120, Relate Text and Visuals 122, Apply It!
TE Only: 131E, Enrich – A Redesigned Mouse STEMQuest: Testing, Testing…1,
2, 3 Analog and Digital Recordings
Evaluate Recording Technologies Earth’s Surface SE/TE: 20, Maps From Satellite Images TE Only: 19, Teach Key Concepts
Crosscutting Concepts
Structure and Function Structures can be designed to serve particular
functions.
Science and Technology SE/TE: 122, Apply It!
TE Only: 131E, Enrich – A Redesigned Mouse STEMQuest: Testing, Testing…1, 2, 3 Constructing a Microphone
Analog and Digital Recordings
Evaluate Recording Technologies Reflect on Your Recording Method Sound and Light SE/TE: 84–85, How Does a Cell Phone
Work? 86–87, How Does Satellite Communications Work? 123, Apply It!

A Correlation of Interactive Science Grades 6-8 Modules, ©2016 Digital Refreshment
to the Next Generation Science Standards for Middle School
SE = Student Edition; TE = Teacher’s Edition; TLR = Teacher’s Lab Resource 43
Forces and Energy SE/TE: 230, Magnetic Pictures
Sound and Light SE/TE: 84–85, How Does a Cell Phone Work? 86–87, How Does Satellite Communications Work? 92, Channel Surfin’ on an Infrared
Wave 123, Cameras TE Only: 92, Museum of Science
--------------------------------------------------- Connections to Engineering, Technology,
and Applications of Science
Influence of Science, Engineering, and Technology on Society and the Natural World
Technologies extend the measurement, exploration, modeling, and computational capacity
of scientific investigations.
Science and Technology
TLR: 17, Reading Satellite Images Forces and Energy SE/TE: 230, Magnetic Pictures
--------------------------------------------------- Connections to Nature of Science
Science is a Human Endeavor
Advances in technology influence the progress of science and science has influenced advances in
technology.
Science and Technology SE/TE: 120, Relate Text and Visuals
Sound and Light SE/TE 84–85, How Does a Cell Phone Work?
86–87, How Does Satellite
Communication Work?
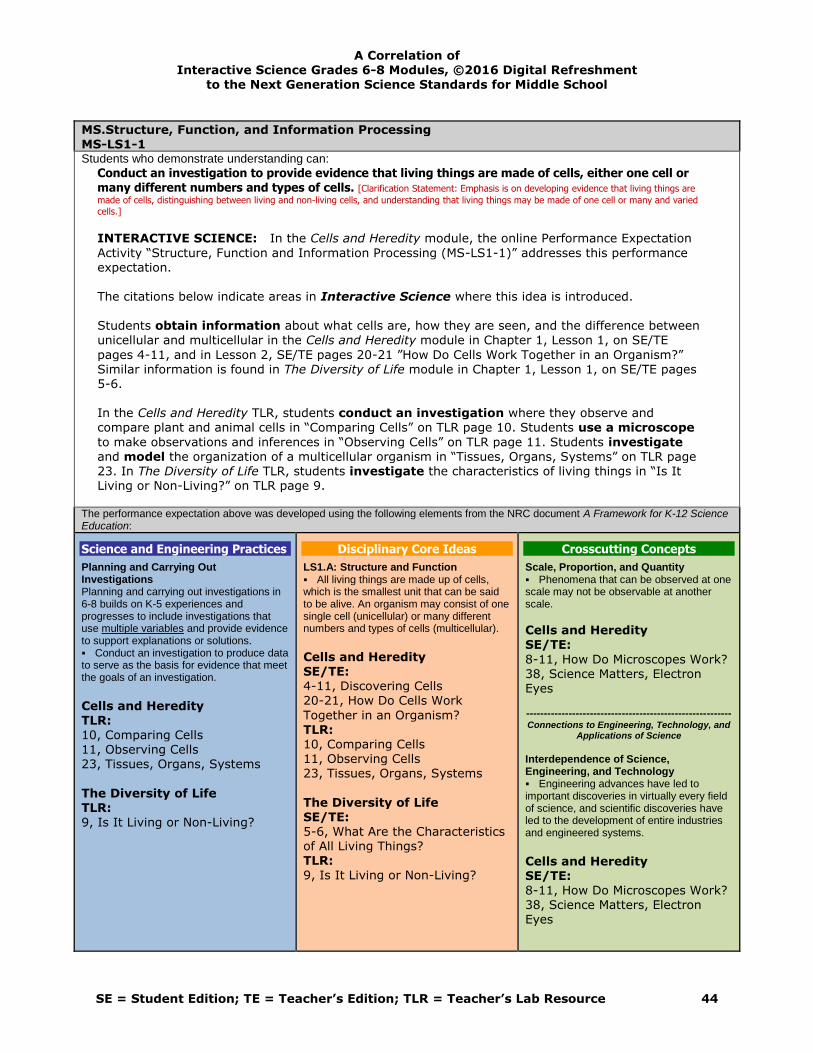
A Correlation of Interactive Science Grades 6-8 Modules, ©2016 Digital Refreshment
to the Next Generation Science Standards for Middle School
SE = Student Edition; TE = Teacher’s Edition; TLR = Teacher’s Lab Resource 44
MS.Structure, Function, and Information Processing MS-LS1-1 Students who demonstrate understanding can: Conduct an investigation to provide evidence that living things are made of cells, either one cell or
many different numbers and types of cells. [Clarification Statement: Emphasis is on developing evidence that living things are
made of cells, distinguishing between living and non-living cells, and understanding that living things may be made of one cell or many and varied
cells.]
INTERACTIVE SCIENCE: In the Cells and Heredity module, the online Performance Expectation
Activity “Structure, Function and Information Processing (MS-LS1-1)” addresses this performance expectation. The citations below indicate areas in Interactive Science where this idea is introduced. Students obtain information about what cells are, how they are seen, and the difference between
unicellular and multicellular in the Cells and Heredity module in Chapter 1, Lesson 1, on SE/TE
pages 4-11, and in Lesson 2, SE/TE pages 20-21 ”How Do Cells Work Together in an Organism?” Similar information is found in The Diversity of Life module in Chapter 1, Lesson 1, on SE/TE pages 5-6. In the Cells and Heredity TLR, students conduct an investigation where they observe and compare plant and animal cells in “Comparing Cells” on TLR page 10. Students use a microscope
to make observations and inferences in “Observing Cells” on TLR page 11. Students investigate and model the organization of a multicellular organism in “Tissues, Organs, Systems” on TLR page 23. In The Diversity of Life TLR, students investigate the characteristics of living things in “Is It Living or Non-Living?” on TLR page 9.
The performance expectation above was developed using the following elements from the NRC document A Framework for K-12 Science Education:
Science and Engineering Practices
Planning and Carrying Out Investigations Planning and carrying out investigations in 6-8 builds on K-5 experiences and progresses to include investigations that use multiple variables and provide evidence to support explanations or solutions. Conduct an investigation to produce data to serve as the basis for evidence that meet the goals of an investigation.
Cells and Heredity TLR: 10, Comparing Cells 11, Observing Cells 23, Tissues, Organs, Systems
The Diversity of Life TLR: 9, Is It Living or Non-Living?
Disciplinary Core Ideas
LS1.A: Structure and Function All living things are made up of cells, which is the smallest unit that can be said to be alive. An organism may consist of one single cell (unicellular) or many different numbers and types of cells (multicellular).
Cells and Heredity SE/TE: 4-11, Discovering Cells 20-21, How Do Cells Work
Together in an Organism? TLR: 10, Comparing Cells 11, Observing Cells 23, Tissues, Organs, Systems
The Diversity of Life SE/TE: 5-6, What Are the Characteristics of All Living Things? TLR: 9, Is It Living or Non-Living?
Crosscutting Concepts
Scale, Proportion, and Quantity Phenomena that can be observed at one scale may not be observable at another scale.
Cells and Heredity SE/TE:
8-11, How Do Microscopes Work? 38, Science Matters, Electron Eyes ---------------------------------------------------------- Connections to Engineering, Technology, and
Applications of Science
Interdependence of Science, Engineering, and Technology Engineering advances have led to important discoveries in virtually every field of science, and scientific discoveries have led to the development of entire industries and engineered systems.
Cells and Heredity SE/TE: 8-11, How Do Microscopes Work? 38, Science Matters, Electron Eyes
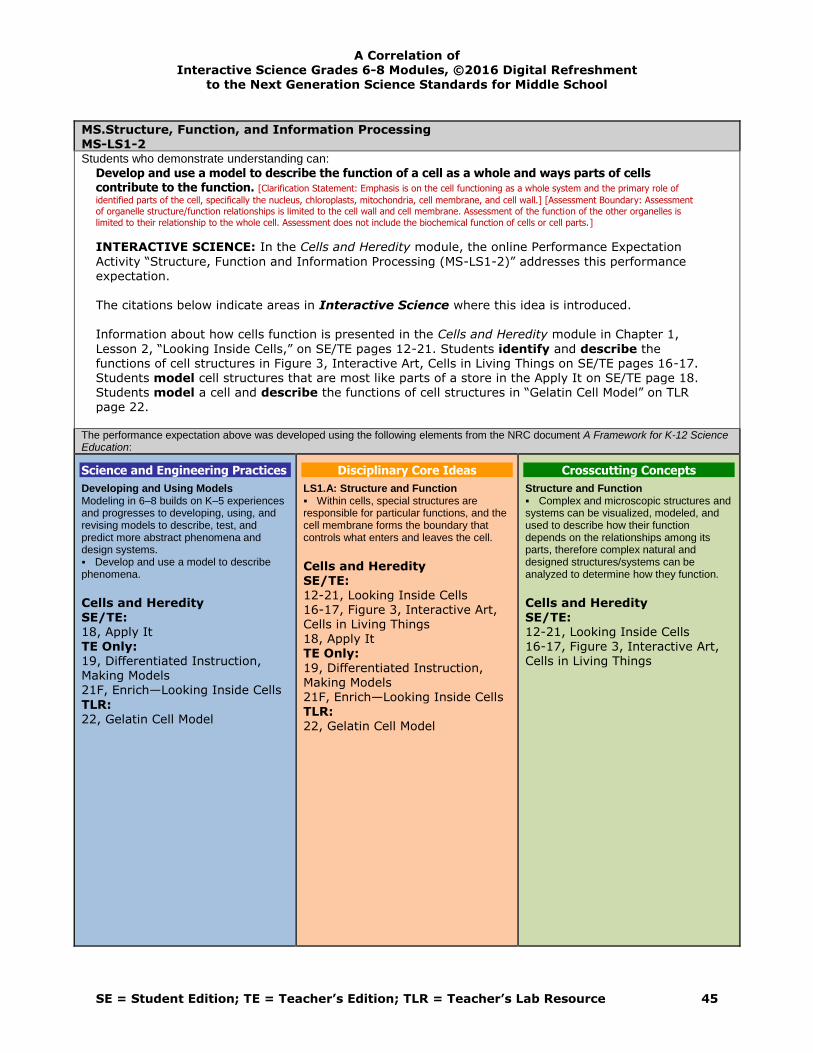
A Correlation of Interactive Science Grades 6-8 Modules, ©2016 Digital Refreshment
to the Next Generation Science Standards for Middle School
SE = Student Edition; TE = Teacher’s Edition; TLR = Teacher’s Lab Resource 45
MS.Structure, Function, and Information Processing MS-LS1-2 Students who demonstrate understanding can:
Develop and use a model to describe the function of a cell as a whole and ways parts of cells contribute to the function. [Clarification Statement: Emphasis is on the cell functioning as a whole system and the primary role of
identified parts of the cell, specifically the nucleus, chloroplasts, mitochondria, cell membrane, and cell wall.] [Assessment Boundary: Assessment of organelle structure/function relationships is limited to the cell wall and cell membrane. Assessment of the function of the other organelles is
limited to their relationship to the whole cell. Assessment does not include the biochemical function of cells or cell parts.]
INTERACTIVE SCIENCE: In the Cells and Heredity module, the online Performance Expectation
Activity “Structure, Function and Information Processing (MS-LS1-2)” addresses this performance expectation. The citations below indicate areas in Interactive Science where this idea is introduced.
Information about how cells function is presented in the Cells and Heredity module in Chapter 1,
Lesson 2, “Looking Inside Cells,” on SE/TE pages 12-21. Students identify and describe the functions of cell structures in Figure 3, Interactive Art, Cells in Living Things on SE/TE pages 16-17. Students model cell structures that are most like parts of a store in the Apply It on SE/TE page 18. Students model a cell and describe the functions of cell structures in “Gelatin Cell Model” on TLR page 22.
The performance expectation above was developed using the following elements from the NRC document A Framework for K-12 Science Education:
Science and Engineering Practices
Developing and Using Models Modeling in 6–8 builds on K–5 experiences and progresses to developing, using, and revising models to describe, test, and predict more abstract phenomena and design systems. Develop and use a model to describe phenomena.
Cells and Heredity SE/TE: 18, Apply It TE Only: 19, Differentiated Instruction, Making Models 21F, Enrich—Looking Inside Cells
TLR: 22, Gelatin Cell Model
Disciplinary Core Ideas
LS1.A: Structure and Function Within cells, special structures are responsible for particular functions, and the cell membrane forms the boundary that controls what enters and leaves the cell.
Cells and Heredity SE/TE: 12-21, Looking Inside Cells 16-17, Figure 3, Interactive Art, Cells in Living Things 18, Apply It TE Only:
19, Differentiated Instruction, Making Models 21F, Enrich—Looking Inside Cells TLR: 22, Gelatin Cell Model
Crosscutting Concepts
Structure and Function Complex and microscopic structures and systems can be visualized, modeled, and used to describe how their function depends on the relationships among its parts, therefore complex natural and designed structures/systems can be analyzed to determine how they function.
Cells and Heredity SE/TE: 12-21, Looking Inside Cells 16-17, Figure 3, Interactive Art, Cells in Living Things

A Correlation of Interactive Science Grades 6-8 Modules, ©2016 Digital Refreshment
to the Next Generation Science Standards for Middle School
SE = Student Edition; TE = Teacher’s Edition; TLR = Teacher’s Lab Resource 46
MS.Structure, Function, and Information Processing MS-LS1-3 Students who demonstrate understanding can:
Use argument supported by evidence for how the body is a system of interacting subsystems composed of groups of cells. [Clarification Statement: Emphasis is on the conceptual understanding that cells form tissues and tissues form organs specialized for
particular body functions. Examples could include the interaction of subsystems within a system and the normal functioning of those systems.] [Assessment Boundary: Assessment does not include the mechanism of one body system independent of others. Assessment is limited to the circulatory, excretory,
digestive, respiratory, muscular, and nervous systems.]
INTERACTIVE SCIENCE: In the Human Body Systems module, the online Performance Expectation
Activity “Structure, Function and Information Processing (MS-LS1-3)” addresses this performance expectation. The citations below indicate areas in Interactive Science where this idea is introduced.
Information pertaining to levels of organization in living things is presented in the Cells and Heredity module in Chapter 1, Lesson 2, “How Do Cells Work Together in an Organism?” on SE/TE pages 20-21. In
“Tissues, Organs, Systems” on TLR page 23, students model the organization of a multicellular organism and use that model as evidence to answer questions. Information regarding body organization can also be found in the Human Body Systems module in Chapter 1, Lesson 1, SE/TE pages 4-9. In “How Is Your Body Organized?” on TLR page 9, students examine a model and use their observations as evidence to answer questions. Information pertaining to how body systems interact is presented in the Human Body Systems module in
Chapter 1, Lesson 2, SE/TE pages 10-17. In “How Does Your Body Respond?” on TLR page 11, students identify parts of the body that work together to perform life functions and use their observations as evidence to answer questions. In “Working Together, Act I” on TLR page 21, students model the interaction among different body systems involved in delivering oxygen and removing carbon dioxide and other wastes. Students use their observations as evidence to answer questions. In “Working Together, Act II” on TLR page 22, students model the interaction of the nervous system with other body systems
and use their observations as evidence to answer questions.
The performance expectation above was developed using the following elements from the NRC document A Framework for K-12 Science Education:
Science and Engineering Practices
Engaging in Argument from Evidence Engaging in argument from evidence in 6–8 builds on K–5 experiences and progresses to constructing a convincing argument that supports or refutes claims for either explanations or solutions about the natural and designed world(s). Use an oral and written argument supported by evidence to support or refute an explanation or a model for a phenomenon.
Cells and Heredity
TE Only: 21, Differentiated Instruction, Cells in Tissues TLR: 23, Quick Lab, Tissues, Organs, Systems
Disciplinary Core Ideas
LS1.A: Structure and Function In multicellular organisms, the body is a system of multiple interacting subsystems. These subsystems are groups of cells that work together to form tissues and organs that are specialized for particular body functions.
Cells and Heredity SE/TE: 20-21, How Do Cells Work
Together in an Organism? TE Only: 21, Differentiated Instruction,
Cells in Tissues TLR: 23, Quick Lab, Tissues, Organs, Systems
Crosscutting Concepts
Systems and System Models Systems may interact with other systems; they may have sub-systems and be a part of larger complex systems.
Cells and Heredity SE/TE:
20-21, How Do Cells Work Together in an Organism? TLR: 23, Quick Lab, Tissues, Organs,
Systems Human Body Systems SE/TE:
4-9, How Is Your Body Organized? 11-12, How Do You Move? 13-15, Which Systems Move Materials in Your Body? 16-17, Which Systems Control Body Functions?

A Correlation of Interactive Science Grades 6-8 Modules, ©2016 Digital Refreshment
to the Next Generation Science Standards for Middle School
SE = Student Edition; TE = Teacher’s Edition; TLR = Teacher’s Lab Resource 47
Human Body Systems TE Only: 9A, After the Inquiry Warm-Up, Body Organization
15, Differentiated Instruction, All Systems Go 17A, After the Inquiry Warm-Up, System Interactions 17F, Enrich, System Interactions TLR: 9, Inquiry Warm-Up, How Is Your
Body Organized? 11, Inquiry Warm-Up, How Does Your Body Respond? 21, Quick Lab, Working Together,
Act I 22, Quick Lab, Working Together, Act II
Human Body Systems SE/TE: 4-9, How Is Your Body Organized? 11-12, How Do You Move?
13-15, Which Systems Move Materials in Your Body? 16-17, Which Systems Control Body Functions? TE Only: 9A, After the Inquiry Warm-Up, Body Organization
15, Differentiated Instruction, All Systems Go 17A, After the Inquiry Warm-Up, System Interactions
17F, Enrich, System Interactions TLR: 9, Inquiry Warm-Up, How Is Your
Body Organized? 11, Inquiry Warm-Up, How Does Your Body Respond? 21, Quick Lab, Working Together, Act I 22, Quick Lab, Working Together,
Act II Quest: Peak Performance Plan Training Systems Heart Beat, Health Beat Why Practice Makes Perfect Reflect on Peak Performance Plan
TE Only: 9A, After the Inquiry Warm-Up, Body Organization 15, Differentiated Instruction, All
Systems Go 17A, After the Inquiry Warm-Up, System Interactions 17F, Enrich, System Interactions TLR: 9, Inquiry Warm-Up, How Is Your Body Organized?
11, Inquiry Warm-Up, How Does Your Body Respond? 21, Quick Lab, Working Together, Act I
22, Quick Lab, Working Together, Act II Quest: Peak Performance Plan
Training Systems Heart Beat, Health Beat Why Practice Makes Perfect Reflect on Peak Performance Plan ---------------------------------------------------
Connections to Nature of Science Science is a Human Endeavor Scientists and engineers are guided by habits of mind such as intellectual honesty, tolerance of ambiguity, skepticism, and openness to new ideas.
Cells and Heredity TE Only: 9E, Enrich, Body Organization

A Correlation of Interactive Science Grades 6-8 Modules, ©2016 Digital Refreshment
to the Next Generation Science Standards for Middle School
SE = Student Edition; TE = Teacher’s Edition; TLR = Teacher’s Lab Resource 48
MS.Structure, Function, and Information Processing MS-LS1-8 Students who demonstrate understanding can: Gather and synthesize information that sensory receptors respond to stimuli by sending messages to
the brain for immediate behavior or storage as memories. [Assessment Boundary: Assessment does not include
mechanisms for the transmission of this information.]
INTERACTIVE SCIENCE: In the Human Body Systems module, the online Performance Expectation Activity “Structure, Function and Information Processing (MS-LS1-8)” addresses this
performance expectation.
Information pertaining to the nervous systems, stimuli, and response is introduced in the Human Body Systems module in Chapter 1, Lesson 2, pages 16-17. In Figure 4 on SE/TE page 16, students synthesize information regarding stimuli and response.
The nervous system is explored in the Human Body Systems module in Chapter 7, Lessons 1 and 2. Students obtain information about the nervous system’s response to stimuli and its role in maintaining homeostasis on SE/TE page 216. In the Apply It on SE/TE page 216, students
synthesize information to determine how a body responds to stimuli. The central nervous is explored in “What Is the Role of the Central Nervous System?” on SE/TE pages 221-223. Sense receptors are discussed in Lessons 3, “Sight and Hearing,” and 4, “Smell, Taste, and Touch. Students learn about sight receptors on SE/TE page 321. Sound receptors are discussed in “The Inner Ear” on SE/TE page 234. Students obtain information about smell and taste receptors in “How Do Smell and Taste Work Together?” on SE/TE page 237. They learn about touch receptors in “How Do You Sense Touch?” on SE/TE page 238.
Students identify the parts of the central nervous system, including the spinal cord and the brain
on SE/TE pages 221-224. They write about how sight receptors work on SE/TE page 231. Students write about the functions of the outer, middle, and inner ear in Figure 5, The Ear, on SE/TE page 234. Students sequence the steps involved in sensing taste in Figure 1, Taste Buds on SE/TE page 237. They write about different types of touch sensing in the Apply it! feature on SE/TE
page 238.
In “Ready or Not!” on TLR pages 187-195, students gather and synthesize information by conducting an experiment to determine if a person’s reaction time varies depending on the time of
day. In “Modeling a Neuron” on TLR page 196, students model the three different types of neurons to determine the role of each in responding to stimuli. They also model responses passing through neurons in “What Are the Parts of the Nervous System” in TLR page 198. Students model the brain and explain the function of the parts in “Making a Model of the Brain” in TLR page 199. Students gather information on how useful eyes and ears are in interpreting stimuli in “Eyes and Ears” in TLR page 202. Students gather and synthesize information on how touch sensors respond to different stimuli in “What’s in the Bag?” on TLR page 207.
The performance expectation above was developed using the following elements from the NRC document A Framework for K-12 Science Education:
Science and Engineering Practices
Obtaining, Evaluating, and Communicating Information Obtaining, evaluating, and communicating information in 6-8 builds on K-5 experiences and progresses to evaluating the merit and validity of ideas and methods. Gather, read, and synthesize information from multiple appropriate sources and assess the credibility, accuracy, and possible bias of each publication and methods used, and describe how they are supported or not supported by evidence. (MS-LS1-8)
Disciplinary Core Ideas
LS1.D: Information Processing Each sense receptor responds to different inputs (electromagnetic, mechanical, chemical), transmitting them as signals that travel along nerve cells to the brain. The signals are then processed in the brain, resulting in immediate behaviors or memories.
Human Body Systems SE/TE: 16-17 Which Systems Control Body Functions?
Crosscutting Concepts
Cause and Effect Cause and effect relationships may be used to predict phenomena in natural systems.
Human Body Systems SE/TE:
16-17 Which Systems Control Body Functions? 230, Apply It 234, Relate Cause and Effect

A Correlation of Interactive Science Grades 6-8 Modules, ©2016 Digital Refreshment
to the Next Generation Science Standards for Middle School
SE = Student Edition; TE = Teacher’s Edition; TLR = Teacher’s Lab Resource 49
Human Body Systems TLR: 196, Modeling a Neuron 198, What Are the Parts of the
Nervous System? 199, Making a Model of the Brain 202, Eyes and Ears 207, What’s in the Bag?
16, Figure 4, Stimulus and Response 214-219, How the Nervous System Works
220-227, Divisions of the Nervous System 228-235, Sight and Hearing 236-239, Smell, Taste, and Touch TE Only: 17F, Enrich, System Interactions 217, Differentiated Instruction
219, Differentiated Instruction 219F, Enrich, How the Nervous System Works TLR:
187-195, Ready or Not! 196, Modeling a Neuron 198, What Are the Parts of the
Nervous System? 199, Making a Model of the Brain 202, Eyes and Ears 207, What’s in the Bag?
TE Only: 15, Differentiated Instruction TLR: 187-195, Ready or Not!
207, What’s in the Bag?

A Correlation of Interactive Science Grades 6-8 Modules, ©2016 Digital Refreshment
to the Next Generation Science Standards for Middle School
SE = Student Edition; TE = Teacher’s Edition; TLR = Teacher’s Lab Resource 50
MS.Matter and Energy in Organisms and Ecosystems MS-LS1-6 Students who demonstrate understanding can: Construct a scientific explanation based on evidence for the role of photosynthesis in the cycling of
matter and flow of energy into and out of organisms. [Clarification Statement: Emphasis is on tracing movement of matter
and flow of energy.] [Assessment Boundary: Assessment does not include the biochemical mechanisms of photosynthesis.]
INTERACTIVE SCIENCE: In the Cells and Heredity module, the online Performance Expectation
Activity “Matter and Energy in Organisms and Ecosystems (MS-LS1-6)” addresses this performance expectation. Information on how living things get their energy is presented in the Cells and Heredity module in Chapter 2, Lesson 1 in “How do Living Things Get Energy From the Sun?,” SE/TE pages 45-46. In the Apply It! feature on SE/TE page 46, students sequence the flow of energy from the sun to a spider. Students explain how energy from the sun gets into their cells in “Assess Your
Understanding” feature, #1c, on SE/TE page 46. In “Figure 2 – First Stage of Photosynthesis” on page SE/TE page 47, students explain that photosynthesis starts the chain of energy. Additional information on the role of photosynthesis in the flow of energy can be found in the Ecology and the Environment module in Chapter 2, Lesson 1 in “What Are the Energy Roles in an Ecosystem?,” SE/TE pages 43-45. The role of photosynthesis in the cycling of matter is discussed in
Chapter 2, Lesson 2 “Cycles of Matter.”
The performance expectation above was developed using the following elements from the NRC document A Framework for K-12 Science Education:
Science and Engineering Practices
Constructing Explanations and Designing Solutions Constructing explanations and designing solutions in 6–8 builds on K–5 experiences and progresses to include constructing explanations and designing solutions supported by multiple sources of evidence consistent with scientific knowledge, principles, and theories. Construct a scientific explanation based on valid and reliable evidence obtained from sources (including the students’ own experiments) and the assumption that theories and laws that describe the natural world operate today as they did in the past and will continue to do so in the future.
Ecology and the Environment TLR: 54, Quick Lab, Carbon and Oxygen Blues
Cells and Heredity TLR: 38, Quick Lab, Energy From the Sun ---------------------------------------------------
Connections to Nature of Science Scientific Knowledge is Based on Empirical Evidence Science knowledge is based upon logical connections between evidence and explanations.
Disciplinary Core Ideas
LS1.C: Organization for Matter and Energy Flow in Organisms Plants, algae (including phytoplankton), and many microorganisms use the energy from light to make sugars (food) from carbon dioxide from the atmosphere and water through the process of photosynthesis, which also releases oxygen. These sugars can be used immediately or stored for growth or later use.
Ecology and the Environment
SE/TE: 43-45, What Are the Energy Roles in an Ecosystem? 50-51, What Processes Are Involved in the Water Cycle? 52-53, How Are the Carbon and Oxygen Cycles Related?
54-55, How Does Nitrogen Cycle Through Ecosystems? 52, Apply It! TE Only: 53, Differentiated Instruction 53, Build Inquiry
TLR: 54, Quick Lab, Carbon and Oxygen Blues
Crosscutting Concepts
Energy and Matter Within a natural system, the transfer of energy drives the motion and/or cycling of matter.
Ecology and the Environment SE/TE:
43-45, What Are the Energy Roles in an Ecosystem? 50-51, What Processes Are Involved in the Water Cycle? 52-53, How Are the Carbon and Oxygen Cycles Related? 54-55, How Does Nitrogen Cycle
Through Ecosystems?

A Correlation of Interactive Science Grades 6-8 Modules, ©2016 Digital Refreshment
to the Next Generation Science Standards for Middle School
SE = Student Edition; TE = Teacher’s Edition; TLR = Teacher’s Lab Resource 51
Ecology and the Environment SE/TE: 43-45, What Are the Energy Roles in an Ecosystem?
50-51, What Processes Are Involved in the Water Cycle? 52-53, How Are the Carbon and Oxygen Cycles Related? 54-55, How Does Nitrogen Cycle Through Ecosystems?
Cells and Heredity SE/TE: 45, How Do Living Things Get Energy From the Sun?
46, The Sun as an Energy Source 46, Apply it! 47, Figure 2 – First Stage of Photosynthesis 49, Figure 4 – From the Sun to You TLR:
38, Quick Lab, Energy From the Sun PS3.D: Energy in Chemical Processes and Everyday Life The chemical reaction by which plants produce complex food molecules (sugars) requires an energy input (i.e., from sunlight) to occur. In this reaction, carbon dioxide and water combine to form carbon-based organic molecules and release oxygen. (secondary to MS-LS1-6)
Cells and Heredity SE/TE: 47-49, What Happens During Photosynthesis?
47, Figure 2 – First Stage of Photosynthesis 48, Sequence 48, Figure 3 – Producing Food
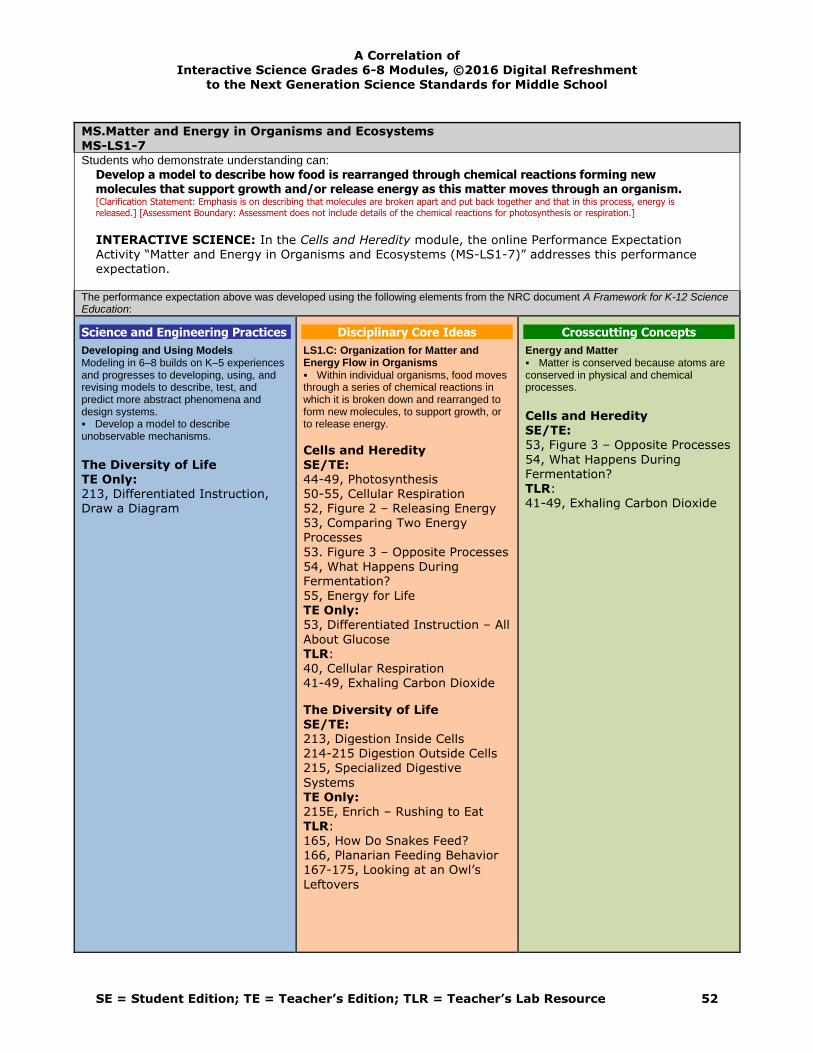
A Correlation of Interactive Science Grades 6-8 Modules, ©2016 Digital Refreshment
to the Next Generation Science Standards for Middle School
SE = Student Edition; TE = Teacher’s Edition; TLR = Teacher’s Lab Resource 52
MS.Matter and Energy in Organisms and Ecosystems MS-LS1-7 Students who demonstrate understanding can: Develop a model to describe how food is rearranged through chemical reactions forming new
molecules that support growth and/or release energy as this matter moves through an organism. [Clarification Statement: Emphasis is on describing that molecules are broken apart and put back together and that in this process, energy is released.] [Assessment Boundary: Assessment does not include details of the chemical reactions for photosynthesis or respiration.]
INTERACTIVE SCIENCE: In the Cells and Heredity module, the online Performance Expectation Activity “Matter and Energy in Organisms and Ecosystems (MS-LS1-7)” addresses this performance expectation.
The performance expectation above was developed using the following elements from the NRC document A Framework for K-12 Science Education:
Science and Engineering Practices
Developing and Using Models Modeling in 6–8 builds on K–5 experiences and progresses to developing, using, and revising models to describe, test, and predict more abstract phenomena and design systems. Develop a model to describe unobservable mechanisms.
The Diversity of Life TE Only: 213, Differentiated Instruction, Draw a Diagram
Disciplinary Core Ideas
LS1.C: Organization for Matter and Energy Flow in Organisms Within individual organisms, food moves through a series of chemical reactions in which it is broken down and rearranged to form new molecules, to support growth, or to release energy.
Cells and Heredity SE/TE: 44-49, Photosynthesis 50-55, Cellular Respiration 52, Figure 2 – Releasing Energy 53, Comparing Two Energy Processes
53. Figure 3 – Opposite Processes
54, What Happens During Fermentation? 55, Energy for Life TE Only: 53, Differentiated Instruction – All
About Glucose TLR: 40, Cellular Respiration 41-49, Exhaling Carbon Dioxide
The Diversity of Life SE/TE: 213, Digestion Inside Cells 214-215 Digestion Outside Cells 215, Specialized Digestive
Systems TE Only: 215E, Enrich – Rushing to Eat TLR: 165, How Do Snakes Feed? 166, Planarian Feeding Behavior 167-175, Looking at an Owl’s
Leftovers
Crosscutting Concepts
Energy and Matter Matter is conserved because atoms are conserved in physical and chemical processes.
Cells and Heredity SE/TE: 53, Figure 3 – Opposite Processes
54, What Happens During Fermentation? TLR: 41-49, Exhaling Carbon Dioxide

A Correlation of Interactive Science Grades 6-8 Modules, ©2016 Digital Refreshment
to the Next Generation Science Standards for Middle School
SE = Student Edition; TE = Teacher’s Edition; TLR = Teacher’s Lab Resource 53
Human Body Systems SE/TE: 66-73, Food and Energy 80-85, The Digestive Process
Begins 86-91, Final Digestion and Absorption PS3.D: Energy in Chemical Processes and Everyday Life Cellular respiration in plants and animals involve chemical reactions with oxygen that release stored energy. In these processes, complex molecules containing carbon react with oxygen to produce carbon dioxide and other materials. (secondary to MS-LS1-7)
Cells and Heredity SE/TE: 44-49, Photosynthesis 50-55, Cellular Respiration

A Correlation of Interactive Science Grades 6-8 Modules, ©2016 Digital Refreshment
to the Next Generation Science Standards for Middle School
SE = Student Edition; TE = Teacher’s Edition; TLR = Teacher’s Lab Resource 54
MS.Matter and Energy in Organisms and Ecosystems MS-LS2-1 Students who demonstrate understanding can: Analyze and interpret data to provide evidence for the effects of resource availability on organisms
and populations of organisms in an ecosystem. [Clarification Statement: Emphasis is on cause and effect relationships
between resources and growth of individual organisms and the numbers of organisms in ecosystems during periods of abundant and scarce resources.]
INTERACTIVE SCIENCE: In the Ecology and the Environment module, the online Performance Expectation Activity “Matter and Energy in Organisms and Ecosystems (MS-LS2-1)” addresses this performance expectation.
The concept of populations is explored in the Ecology and the Environment module in Chapter 1, Lesson 2, “Populations.” The limiting factors on population growth are defined in “What Factors Limit Population Growth?” on SE/TE pages 15-16.
Students graph the factors that could affect a population’s size “Growing and Shrinking” on TLR page 24. They make models about the limiting resources and the growth, and decrease of a population in “Elbow
Room” on TLR page 25. The performance expectation above was developed using the following elements from the NRC document A Framework for K-12 Science Education:
Science and Engineering Practices
Analyzing and Interpreting Data Analyzing data in 6–8 builds on K–5 experiences and progresses to extending quantitative analysis to investigations, distinguishing between correlation and causation, and basic statistical techniques of data and error analysis. Analyze and interpret data to provide evidence for phenomena.
Ecology and the Environment TLR: 13-21, Lab Investigation, World in a Bottle 24, Growing and Shrinking
Chapter Activities and Projects 50-56, What’s a Crowd?
Disciplinary Core Ideas
LS2.A: Interdependent Relationships in Ecosystems Organisms, and populations of organisms, are dependent on their environmental interactions both with other living things and with nonliving factors.
Ecology and the Environment SE/TE: 4-9, Living Things and the Environment TE Only: 9, Differentiated Instruction,
Compare Habitats 9A, After the Inquiry Warm-Up, What’s in the Scene? 9F, Enrich TLR: 11, Inquiry Warm-Up, What’s in the Scene?
13-21, Lab Investigation, World in a Bottle In any ecosystem, organisms and populations with similar requirements for food, water, oxygen, or other resources may compete with each other for limited resources, access to which consequently constrains their growth and reproduction.
Ecology and the Environment SE/TE:
15-17, What Factors Limit Population Growth?
Crosscutting Concepts
Cause and Effect Cause and effect relationships may be used to predict phenomena in natural or designed systems.
Ecology and the Environment SE/TE:
7, Apply It! 15, Relate Cause and Effect TE Only: 17, Differentiated Instruction, Classroom Density

A Correlation of Interactive Science Grades 6-8 Modules, ©2016 Digital Refreshment
to the Next Generation Science Standards for Middle School
SE = Student Edition; TE = Teacher’s Edition; TLR = Teacher’s Lab Resource 55
TE Only: 17, Differentiated Instruction, Classroom Density TLR:
25, Quick Lab, Elbow Room Chapter Activities and Projects 50-56, What’s a Crowd? Growth of organisms and population increases are limited by access to resources.
Ecology and the Environment SE/TE:
15-17, What Factors Limit
Population Growth? TE Only: 17, Differentiated Instruction, Classroom Density TLR: 25, Quick Lab, Elbow Room
Chapter Activities and Projects 50-56, What’s a Crowd?

A Correlation of Interactive Science Grades 6-8 Modules, ©2016 Digital Refreshment
to the Next Generation Science Standards for Middle School
SE = Student Edition; TE = Teacher’s Edition; TLR = Teacher’s Lab Resource 56
MS.Matter and Energy in Organisms and Ecosystems MS-LS2-3 Students who demonstrate understanding can:
Develop a model to describe the cycling of matter and flow of energy among living and nonliving parts of an ecosystem. [Clarification Statement: Emphasis is on describing the conservation of matter and flow of energy into and out of
various ecosystems, and on defining the boundaries of the system.] [Assessment Boundary: Assessment does not include the use of chemical reactions to describe the processes.]
INTERACTIVE SCIENCE: In the Ecology and the Environment module, the online Performance Expectation Activity “Matter and Energy in Organisms and Ecosystems (MS-LS2-3)” addresses this
performance expectation. Cycles of Matter are explored in the Ecology and the Environment module in Chapter 2, Lesson 2, “Cycles of Matter” on SE/TE pages 50-57. Students obtain information about the water cycle on SE/TE pages 50-51. They learn about the carbon cycle on SE/TE/ pages 52-53, and the nitrogen
cycle on SE/TE pages 54-55. In the Enrich activity on TE page 57F, students model the carbon and oxygen cycle. Students investigate carbon and oxygen cycling in “Build Inquiry – Predict Carbon
and Oxygen Cycling” on TE page 53. Students demonstrate the water cycle in “Are You Part of the Water Cycle” on TLR page 52. Students model the water cycle in “Following the Water” on TLR page 53. Students investigate the carbon and oxygen cycles in “Carbon and Oxygen Blues” on TLR page 54. Students model the nitrogen cycle in “Playing Nitrogen Cycle Roles” on TLR page 55.
The performance expectation above was developed using the following elements from the NRC document A Framework for K-12 Science Education:
Science and Engineering Practices
Developing and Using Models Modeling in 6–8 builds on K–5 experiences and progresses to developing, using, and revising models to describe, test, and predict more abstract phenomena and design systems. Develop a model to describe phenomena.
Ecology and the Environment TE Only: 57F, Enrich – Testing for Oxygen and Carbon Dioxide TLR: 43-51, Laboratory Investigation,
Ecosystem Food Chains 53, Quick Lab, Following Water 55, Quick Lab, Playing Nitrogen Cycle Roles
Disciplinary Core Ideas
LS2.B: Cycle of Matter and Energy Transfer in Ecosystems Food webs are models that demonstrate how matter and energy is transferred between producers, consumers, and decomposers as the three groups interact within an ecosystem. Transfers of matter into and out of the physical environment occur at every level. Decomposers recycle nutrients from dead plant or animal matter back to the soil in terrestrial environments or to the water in aquatic environments. The atoms that make up the organisms in an ecosystem are cycled repeatedly between the living and nonliving parts of the ecosystem.
Ecology and the Environment SE/TE: 42-49, Energy Flow in
Ecosystems
50-55, Cycles of Matter TE Only: 53, Differentiated Instruction 53, Build Inquiry – Predict Carbon and Oxygen Cycling 55, Differentiated Instruction, Nitrogen in the Soil
57F, Enrich – Testing for Oxygen and Carbon Dioxide
Crosscutting Concepts
Energy and Matter The transfer of energy can be tracked as energy flows through a natural system.
Ecology and the Environment SE/TE: 42-49, Energy Flow in Ecosystems
-------------------------------------------------- Connections to Nature of Science
Scientific Knowledge Assumes an Order and Consistency in Natural Systems Science assumes that objects and events in natural systems occur in consistent patterns that are understandable through measurement and observation.
Ecology and the Environment
TLR:
43-51, Laboratory Investigation, Ecosystem Food Chains 52, Inquiry Warm-Up, Are You Part of a Cycle? 53, Quick Lab, Following Water 54, Quick Lab, Carbon and Oxygen Blues
55, Quick Lab, Playing Nitrogen Cycle Roles

A Correlation of Interactive Science Grades 6-8 Modules, ©2016 Digital Refreshment
to the Next Generation Science Standards for Middle School
SE = Student Edition; TE = Teacher’s Edition; TLR = Teacher’s Lab Resource 57
TLR: 43-51, Laboratory Investigation, Ecosystem Food Chains 52, Inquiry Warm-Up, Are You
Part of a Cycle? 53, Quick Lab, Following Water 54, Quick Lab, Carbon and Oxygen Blues 55, Quick Lab, Playing Nitrogen Cycle Roles

A Correlation of Interactive Science Grades 6-8 Modules, ©2016 Digital Refreshment
to the Next Generation Science Standards for Middle School
SE = Student Edition; TE = Teacher’s Edition; TLR = Teacher’s Lab Resource 58
MS.Matter and Energy in Organisms and Ecosystems MS-LS2-4 Students who demonstrate understanding can: Construct an argument supported by empirical evidence that changes to physical or biological
components of an ecosystem affect populations. [Clarification Statement: Emphasis is on recognizing patterns in data and
making warranted inferences about changes in populations, and on evaluating empirical evidence supporting arguments about changes to ecosystems.]
INTERACTIVE SCIENCE: In the Ecology and the Environment module, the online Performance Expectation Activity “Matter and Energy in Organisms and Ecosystems (MS-LS2-4)” addresses this performance expectation.
The effect of a biological or physical component upon populations of species is presented in the Ecology and the Environment module in Chapter 3, Lesson 5, “Biodiversity.” On SE/TE pages 108-110, the importance of keystone species is highlighted with the example of effects of sea otter
decline and recovery. Students learn about the changes to populations caused by human activity, which change both physical and biological components of an ecosystem, in “How Do Humans Affect Biodiversity?” on SE/TE page 114. Students model the concept of keystone in “Modeling Keystones
Species” on TLR page 93.
The performance expectation above was developed using the following elements from the NRC document A Framework for K-12 Science Education:
Science and Engineering Practices
Engaging in Argument from Evidence Engaging in argument from evidence in 6–8 builds on K–5 experiences and progresses to constructing a convincing argument that supports or refutes claims for either explanations or solutions about the natural and designed world(s). Construct an oral and written argument supported by empirical evidence and scientific reasoning to support or refute an explanation or a model for a phenomenon or a solution to a problem.
Ecology and the Environment TLR: 93, Modeling Keystones Species 95, Humans and Biodiversity The Diversity of Life
Quest: Construction without Destruction Reflect on Your Basketball Court Plans ---------------------------------------------------
Connections to Nature of Science Scientific Knowledge is Based on Empirical Evidence Science disciplines share common rules of obtaining and evaluating empirical evidence.
Ecology and the Environment TLR: 93, Modeling Keystones Species 95, Humans and Biodiversity
Disciplinary Core Ideas
LS2.C: Ecosystem Dynamics, Functioning, and Resilience Ecosystems are dynamic in nature; their characteristics can vary over time. Disruptions to any physical or biological component of an ecosystem can lead to shifts in all its populations.
Ecology and the Environment SE/TE: 109, Ecological Value 110, Figure 2, Keystone Otters 114, Damaging Biodiversity
TE Only: 113, Differentiated Instruction 114, Make Analogies – Habitat Destruction 115, Differentiated Instruction TLR: 93, Modeling Keystones Species
95, Humans and Biodiversity The Diversity of Life
Quest: Construction without Destruction Protect the Plants The Mating Game
Make Your Construction Case Reflect on Your Basketball Court Plans
Crosscutting Concepts
Stability and Change Small changes in one part of a system might cause large changes in another part.
Ecology and the Environment SE/TE: 108, Ecological Value
109, Figure 2, Keystone Otters TLR: 93, Modeling Keystones Species 95, Humans and Biodiversity The Diversity of Life
Quest: Construction without Destruction Protect the Plants The Mating Game Make Your Construction Case Reflect on Your Basketball Court Plans

A Correlation of Interactive Science Grades 6-8 Modules, ©2016 Digital Refreshment
to the Next Generation Science Standards for Middle School
SE = Student Edition; TE = Teacher’s Edition; TLR = Teacher’s Lab Resource 59
MS.Interdependent Relationships in Ecosystems MS-LS2-2 Students who demonstrate understanding can: Construct an explanation that predicts patterns of interactions among organisms across multiple
ecosystems. [Clarification Statement: Emphasis is on predicting consistent patterns of interactions in different ecosystems in terms of the
relationships among and between organisms and abiotic components of ecosystems. Examples of types of interactions could include competitive, predatory, and mutually beneficial.]
INTERACTIVE SCIENCE: In the Ecology and the Environment module, the online Performance Expectation Activity “Matter and Energy in Organisms and Ecosystems (MS-LS2-2)” addresses this performance expectation.
Competition, predation, mutualism, and commensalism are introduced in the Ecology and the
Environment module in Chapter 1, Lesson 3, “Interactions Among Living Things.” Students obtain information about competition and predation in “What Are Competition and Predation?” on SE/TE pages 21-24. Students learn about symbiotic relationships in “What Are the Three Types of
Symbiosis?” on SE/TE pages 25-27. Mutualism is explored on SE/TE page 25. Students learn about commensalism and parasitism on SE/TE page 26.
Students write about competition in an ecosystem in Figure 2 – Niche and Competition on SE/TE page 21. They explain the predator-prey relationship between wolf and moose on Isle Royale in “Do the Math! – Predator-Prey Interactions” on SE/TE page 24. Students analyze data relating to predator prey
relationships in “Understanding Main Ideas” on TE page 27E and in “Analyzing Interactions Among Organisms” on TE page 27F. Students model and explain the relationship between competition and predation in the Quick Lab “Competition and Predation” on TLR page 28. They classify different types of symbiosis in “Type of Symbiosis” on TLR page 29.
The performance expectation above was developed using the following elements from the NRC document A Framework for K-12 Science Education:
Science and Engineering Practices
Constructing Explanations and Designing Solutions Constructing explanations and designing solutions in 6–8 builds on K–5 experiences and progresses to include constructing explanations and designing solutions supported by multiple sources of evidence consistent with scientific ideas, principles, and theories. Construct an explanation that includes qualitative or quantitative relationships between variables that predict phenomena.
Ecology and the Environment
SE/TE: 24, Do the Math! TE Only: 27E, Understanding Main Ideas 27F, Enrich - Analyzing Interactions Among Organisms
TLR: 28, Completion and Predation 29, Type of Symbiosis
Disciplinary Core Ideas
LS2.A: Interdependent Relationships in Ecosystems Similarly, predatory interactions may reduce the number of organisms or eliminate whole populations of organisms. Mutually beneficial interactions, in contrast, may become so interdependent that each organism requires the other for survival. Although the species involved in these competitive, predatory, and mutually beneficial interactions vary across ecosystems, the patterns of interactions of organisms with their environments, both living and nonliving, are shared.
Ecology and the Environment SE/TE:
21-23, What are Competition and Predation? 24, Do the Math!
25, Mutualism 26, Commensalism 34, Review and Assessment #15 TE Only:
23, Differentiated Instruction 25, Differentiated Instruction 27E, Understanding Main Ideas 27F, Enrich - Analyzing Interactions Among Organisms TLR:
28, Completion and Predation 29, Type of Symbiosis
Crosscutting Concepts
Patterns Patterns can be used to identify cause and effect relationships.
Ecology and the Environment SE/TE: 24, Do the Math! TE Only:
27E, Understanding Main Ideas 27F, Enrich - Analyzing Interactions Among Organisms

A Correlation of Interactive Science Grades 6-8 Modules, ©2016 Digital Refreshment
to the Next Generation Science Standards for Middle School
SE = Student Edition; TE = Teacher’s Edition; TLR = Teacher’s Lab Resource 60
MS.Interdependent Relationships in Ecosystems MS-LS2-5 Students who demonstrate understanding can: Evaluate competing design solutions for maintaining biodiversity and ecosystem services.* [Clarification
Statement: Examples of ecosystem services could include water purification, nutrient recycling, and prevention of soil erosion. Examples of design
solution constraints could include scientific, economic, and social considerations.]
INTERACTIVE SCIENCE: In the Ecology and the Environment module, the online Performance Expectation Activity “Matter and Energy in Organisms and Ecosystems (MS-LS2-5)” addresses this performance expectation.
The performance expectation above was developed using the following elements from the NRC document A Framework for K-12 Science Education:
Science and Engineering Practices
Engaging in Argument from Evidence Engaging in argument from evidence in 6–8 builds on K–5 experiences and progresses to constructing a convincing argument that supports or refutes claims for either explanations or solutions about the natural and designed world(s). Evaluate competing design solutions based on jointly developed and agreed-upon design criteria.
Ecology and the Environment STEM Activity Book 17-20, It’s All Water Under the Dam STEMQuest: To Cross or Not to Cross
Research the Effects of Highways and Crossings The Community Speaks Design an Animal Crossing Reflect on Your Animal Crossing
Disciplinary Core Ideas
LS2.C: Ecosystem Dynamics, Functioning, and Resilience Biodiversity describes the variety of species found in Earth’s terrestrial and oceanic ecosystems. The completeness or integrity of an ecosystem’s biodiversity is often used as a measure of its health.
Ecology and the Environment SE/TE: 108-117, Biodiversity
116-117, Figure 6 LS4.D: Biodiversity and Humans Changes in biodiversity can influence humans’ resources, such as food, energy, and medicines, as well as ecosystem services that humans rely on—for example, water purification and recycling.
Ecology and the Environment SE/TE: 92-97, Introduction to Natural Resources
108-117, Biodiversity 128-133, Conserving Land and Soil 142-151, Air Pollution and Solutions 152-159, Water Pollution and
Solutions TE Only: 133E, Enrich, The Copper Basin
TLR: 95, Quick Lab, Humans and Biodiversity
Crosscutting Concepts
Stability and Change Small changes in one part of a system might cause large changes in another part.
Ecology and the Environment SE/TE 89, Relate Cause and Effect 93, Relate Text and Visuals 115, Compare and Contrast TE Only 115, Differentiated Instruction,
Compare and Contrast --------------------------------------------------
Connections to Engineering, Technology, and Applications of
Science Influence of Science, Engineering, and Technology on Society and the Natural World The use of technologies and any limitations on their use are driven by individual or societal needs, desires, and values; by the findings of scientific research; and by differences in such factors as climate, natural resources, and economic conditions. Thus technology use varies from region to region and over time.
Ecology and the Environment SE/TE 86-91, Introduction to Environmental Issues
156-157, How Can Water
Pollution Be Reduced? 157, Apply It! TLR 74, Quick Lab, Comparing Costs and Benefits STEMQuest: To Cross or Not to
Cross Research the Effects of Highways and Crossings The Community Speaks Design an Animal Crossing Reflect on Your Animal Crossing

A Correlation of Interactive Science Grades 6-8 Modules, ©2016 Digital Refreshment
to the Next Generation Science Standards for Middle School
SE = Student Edition; TE = Teacher’s Edition; TLR = Teacher’s Lab Resource 61
ETS1.B: Developing Possible Solutions There are systematic processes for evaluating solutions with respect to how well they meet the criteria and constraints of a problem.
Ecology and the Environment SE/TE 86-91, Introduction to Environmental Issues 157, Apply It!
STEMQuest: To Cross or Not to Cross Research the Effects of Highways and Crossings The Community Speaks
Design an Animal Crossing
Reflect on Your Animal Crossing
------------------------------------------------Connections to Nature of Science
Science Addresses Questions About the Natural and Material World Scientific knowledge can describe consequence of actions but does not make the decisions that society takes.
Ecology and the Environment SE/TE 86-91, Introduction to Environmental Issues 108-117, Biodiversity
TE Only: 91E, Enrich, Congestion Pricing TLR
74, Quick Lab, Comparing Costs and Benefits STEMQuest: To Cross or Not to
Cross Research the Effects of Highways and Crossings The Community Speaks Design an Animal Crossing Reflect on Your Animal Crossing
*The performance expectations marked with an asterisk integrate traditional science content with engineering through a Practice or Disciplinary Core
Idea.

A Correlation of Interactive Science Grades 6-8 Modules, ©2016 Digital Refreshment
to the Next Generation Science Standards for Middle School
SE = Student Edition; TE = Teacher’s Edition; TLR = Teacher’s Lab Resource 62
MS.Growth, Development, and Reproduction of Organisms MS-LS1-4 Students who demonstrate understanding can: Use argument based on empirical evidence and scientific reasoning to support an explanation for
how characteristic animal behaviors and specialized plant structures affect the probability of successful reproduction of animals and plants respectively. [Clarification Statement: Examples of behaviors that affect
the probability of animal reproduction could include nest building to protect young from cold, herding of animals to protect young from predators, and vocalization of animals and colorful plumage to attract mates for breeding. Examples of animal behaviors that affect the probability of plant
reproduction could include transferring pollen or seeds, and creating conditions for seed germination and growth. Examples of plant structures could include bright flowers attracting butterflies that transfer pollen, flower nectar and odors that attract insects that transfer pollen, and hard shells on nuts that squirrels bury.]
INTERACTIVE SCIENCE: In the Diversity of Life module, the online Performance Expectation Activity “Growth, Development, and Reproductions of Organisms (MS-LS1-4)” addresses this performance expectation.
The performance expectation above was developed using the following elements from the NRC document A Framework for K-12 Science Education:
Science and Engineering Practices
Engaging in Argument from Evidence Engaging in argument from evidence in 6–8 builds on K–5 experiences and progresses to constructing a convincing argument that supports or refutes claims for either explanations or solutions about the natural and designed world(s). Use an oral and written argument supported by empirical evidence and scientific reasoning to support or refute an explanation or a model for a phenomenon or a solution to a problem.
The Diversity of Life TE Only: 107, Build Inquiry – Modeling Seed Dispersal
117, 21st Century Learning, Critical Thinking 251E, Enrich- Animal Reproduction and Fertilization 279, Differentiated Instruction – Make Analogies TLR:
200, To Care or Not To Care
Disciplinary Core Ideas
LS1.B: Growth and Development of Organisms Animals engage in characteristic behaviors that increase the odds of reproduction.
The Diversity of Life SE/TE:
245-251, How Do Animals Reproduce? 259-261, How Do Animals Care for Their Young?
261, Do the Math! 262-269, What Is Behavior?
270-279, Patterns of Behavior 278-279, Birds of a Feather… TE Only: 251E, Enrich- Animal Reproduction and Fertilization 259, Differentiated Instruction – Crocodile Mothers
260, Support the Big Q 266, Support the Big Q 273, Teacher Demo, Competition and Aggression 274, Build Inquiry – Group Safety 275, Differentiated Instruction –
Drones
279, Differentiated Instruction – Make Analogies TLR: 194, Making More 200, To Care or Not To Care 201, What Behaviors Can You
Observe? 202, Animal Behavior 204, Communicating Without Words
Crosscutting Concepts
Cause and Effect Phenomena may have more than one cause, and some cause and effect relationships in systems can only be described using probability.
The Diversity of Life SE/TE: 107, Target Skill: Related Cause and Effect 274-275, Cooperative Behavior
278-279, Birds of a Feather…
TE Only: 117, 21st Century Learning, Critical Thinking 274, Build Inquiry – Group Safety

A Correlation of Interactive Science Grades 6-8 Modules, ©2016 Digital Refreshment
to the Next Generation Science Standards for Middle School
SE = Student Edition; TE = Teacher’s Edition; TLR = Teacher’s Lab Resource 63
Plants reproduce in a variety of ways, sometimes depending on animal behavior and specialized features for reproduction.
The Diversity of Life SE/TE:
100-109, Plant Structures 106, Figure 6: Story of a Seed 107, Target Skill: Related Cause and Effect 108, Figure 7: Pollinator Matchup 110-117, Plant Reproduction
117, Figure 5, Flower to Fruit TE Only: 105, Differentiated Instruction, Specialized Leaves
106, Lead a Discussion, Seed Dispersal and Germination 107, Build Inquiry – Modeling
Seed Dispersal 108, Explain: Teach With Visuals 109, Build Inquiry – Observing the Structure of a Flower 115, Differentiated Instruction, Fire Pines 117, 21st Century Learning,
Critical Thinking TLR: 92, Quick Lab, The In-Seed Story 93, Quick Lab: Modeling Flowers Inquiry Warm-Up
94, Inquiry Warm-Up, Make the
Pollen Stick 96, Where Are the Seeds?

A Correlation of Interactive Science Grades 6-8 Modules, ©2016 Digital Refreshment
to the Next Generation Science Standards for Middle School
SE = Student Edition; TE = Teacher’s Edition; TLR = Teacher’s Lab Resource 64
MS.Growth, Development, and Reproduction of Organisms MS-LS1-5 Students who demonstrate understanding can: Construct a scientific explanation based on evidence for how environmental and genetic factors
influence the growth of organisms. [Clarification Statement: Examples of local environmental conditions could include availability of
food, light, space, and water. Examples of genetic factors could include large breed cattle and species of grass affecting growth of organisms. Examples of evidence could include drought decreasing plant growth, fertilizer increasing plant growth, different varieties of plant seeds growing at
different rates in different conditions, and fish growing larger in large ponds than they do in small ponds.] [Assessment Boundary: Assessment does not include genetic mechanisms, gene regulation, or biochemical processes.]
INTERACTIVE SCIENCE: In the Cells and Heredity module, the online Performance Expectation Activity “Growth, Development, and Reproductions of Organisms (MS-LS1-5)” addresses this performance expectation.
The performance expectation above was developed using the following elements from the NRC document A Framework for K-12 Science Education:
Science and Engineering Practices
Constructing Explanations and Designing Solutions Constructing explanations and designing solutions in 6–8 builds on K–5 experiences and progresses to include constructing explanations and designing solutions supported by multiple sources of evidence consistent with scientific knowledge, principles, and theories. Construct a scientific explanation based on valid and reliable evidence obtained from sources (including the students’ own experiments) and the assumption that theories and laws that describe the natural world operate today as they did in the past and will continue to do so in the future.
Cells and Heredity TE Only:
91, Differentiated Instruction, Sex Determination in Reptiles TLR:
81, Is It All in the Genes?
Disciplinary Core Ideas
LS1.B: Growth and Development of Organisms Genetic factors as well as local conditions affect the growth of the adult plant.
Cells and Heredity SE/TE: 86-91, Patterns of Inheritance 86, My Planet Diary
87, Figure 1- Other Patterns of Inheritance 91, Assess Your Understanding TE Only:
90, Lead a Discussion 91, Differentiated Instruction, Sex
Determination in Reptiles 91A, After the Inquiry Warm-Up 91B, Assess Your Understanding TLR: 81, Is It All in the Genes?
Crosscutting Concepts
Cause and Effect Phenomena may have more than one cause, and some cause and effect relationships in systems can only be described using probability.
Cells and Heredity SE/TE: 86, Unlock the Big Question- How Do Genes and the Environment
Interact? 88, Apply it! 90, Explore the Big Question- Patterns of Inheritance
TE Only: 91D, Review and Reinforce
91E, Enrich TLR: 81, Is It All in the Genes?

A Correlation of Interactive Science Grades 6-8 Modules, ©2016 Digital Refreshment
to the Next Generation Science Standards for Middle School
SE = Student Edition; TE = Teacher’s Edition; TLR = Teacher’s Lab Resource 65
MS.Growth, Development, and Reproduction of Organisms MS-LS3-1 Students who demonstrate understanding can: Develop and use a model to describe why structural changes to genes (mutations) located on
chromosomes may affect proteins and may result in harmful, beneficial, or neutral effects to the structure and function of the organism. [Clarification Statement: Emphasis is on conceptual understanding that changes in
genetic material may result in making different proteins.] [Assessment Boundary: Assessment does not include specific changes at the molecular level, mechanisms for protein synthesis, or specific types of mutations.]
INTERACTIVE SCIENCE: In the Cells and Heredity module, the online Performance Expectation Activity “Growth, Development, and Reproductions of Organisms (MS-LS3-1)” addresses this performance expectation.
Harmful, beneficial, and neutral mutations are addressed in the Cells and Heredity module, Chapter 4, Lesson 3, SE/TE pages 118-123. In the Assess Your Knowledge feature on SE/TE page 120,
students explain why mutations are harmful or beneficial. Students model what happens when errors occur in DNA sequences in “Oops!” on TLR page 105. Students model the effects of a mutation and explain why a mutation is beneficial or harmful in “Effects of Mutations” on TLR page 106.
The performance expectation above was developed using the following elements from the NRC document A Framework for K-12 Science Education:
Science and Engineering Practices
Developing and Using Models Modeling in 6–8 builds on K–5 experiences and progresses to developing, using, and revising models to describe, test, and predict more abstract phenomena and design systems. Develop and use a model to describe phenomena.
Cells and Heredity TE Only:
119, ELL Support 119, Support the Big Q TLR: 105, Inquiry Warm-Up, Oops! 106, Quick Lab, Effects of Mutations
Disciplinary Core Ideas
LS3.A: Inheritance of Traits Genes are located in the chromosomes of cells, with each chromosome pair containing two variants of each of many distinct genes. Each distinct gene chiefly controls the production of specific proteins, which in turn affects the traits of the individual. Changes (mutations) to genes can result in changes to proteins, which can affect the structures and functions of the organism and thereby change traits.
Cells and Heredity SE/TE:
93-95, How Are Chromosomes, Genes, and Inheritance Related? 109-111, What Forms the Genetic Code? 118-123, Mutations LS3.B: Variation of Traits In addition to variations that arise from sexual reproduction, genetic information can be altered because of mutations. Though rare, mutations may result in changes to the structure and function of proteins. Some changes are beneficial, others harmful, and some neutral to the organism.
Cells and Heredity SE/TE: 118-123, Mutations TE Only: 119, ELL Support 119, Support the Big Q
Crosscutting Concepts
Structure and Function Complex and microscopic structures and systems can be visualized, modeled, and used to describe how their function depends on the shapes, composition, and relationships among its parts, therefore complex natural and designed structures/systems can be analyzed to determine how they function.
Cells and Heredity TLR: 105, Inquiry Warm-Up, Oops! 106, Quick Lab, Effects of
Mutations

A Correlation of Interactive Science Grades 6-8 Modules, ©2016 Digital Refreshment
to the Next Generation Science Standards for Middle School
SE = Student Edition; TE = Teacher’s Edition; TLR = Teacher’s Lab Resource 66
TLR: 105, Inquiry Warm-Up, Oops! 106, Quick Lab, Effects of Mutations

A Correlation of Interactive Science Grades 6-8 Modules, ©2016 Digital Refreshment
to the Next Generation Science Standards for Middle School
SE = Student Edition; TE = Teacher’s Edition; TLR = Teacher’s Lab Resource 67
MS.Growth, Development, and Reproduction of Organisms MS-LS3-2 Students who demonstrate understanding can: Develop and use a model to describe why asexual reproduction results in offspring with identical
genetic information and sexual reproduction results in offspring with genetic variation. [Clarification
Statement: Emphasis is on using models such as Punnett squares, diagrams, and simulations to describe the cause and effect relationship of gene transmission from parent(s) to offspring and resulting genetic variation.]
INTERACTIVE SCIENCE: In the Cells and Heredity module, the online Performance Expectation Activity “Growth, Development, and Reproductions of Organisms (MS-LS3-2)” addresses this performance expectation.
Students obtain information about sexual and asexual reproduction in the Diversity of Life module in Chapter 7, Lesson 1, “How Do Animals Reproduce?” on SE/TE page 245-247.
The performance expectation above was developed using the following elements from the NRC document A Framework for K-12 Science Education:
Science and Engineering Practices
Developing and Using Models Modeling in 6–8 builds on K–5 experiences and progresses to developing, using, and revising models to describe, test, and predict more abstract phenomena and design systems. Develop and use a model to describe phenomena.
Cells and Heredity 71-78, Lab Investigation, Make the Right Call! Quest: Funky Fruit All in the Numbers
The Diversity of Life TLR: 194, Inquiry Warm-Up, Making More
Chapter Activities and Projects 99-105, All in the Family
Disciplinary Core Ideas
LS1.B: Growth and Development of Organisms Organisms reproduce, either sexually or asexually, and transfer their genetic information to their offspring. (secondary to MS-LS3-2)
Cells and Heredity Quest: Funky Fruit An Apple Lesson All in the Numbers
The Diversity of Life SE/TE:
245, Asexual Reproduction 246, Sexual Reproduction 247, Comparing Asexual and
Sexual Reproduction 247, Figure 3, Asexual and Sexual Reproduction TLR: 194, Inquiry Warm-Up, Making More
LS3.A: Inheritance of Traits Variations of inherited traits between parent and offspring arise from genetic differences that result from the subset of chromosomes (and therefore genes) inherited.
Cells and Heredity SE/TE: 74-79, What Is Heredity? 80-85, Probability and Heredity 86-91, Patterns of Inheritance 92-97 Chromosomes and
Inheritance TLR: 67, Quick Lab, Inferring the Parent Generation
Crosscutting Concepts
Cause and Effect Cause and effect relationships may be used to predict phenomena in natural systems.
Cells and Heredity TLR:
67, Quick Lab, Inferring the Parent Generation 71-78, Lab Investigation, Make the Right Call!
The Diversity of Life SE/TE: 247, Comparing Asexual and Sexual Reproduction

A Correlation of Interactive Science Grades 6-8 Modules, ©2016 Digital Refreshment
to the Next Generation Science Standards for Middle School
SE = Student Edition; TE = Teacher’s Edition; TLR = Teacher’s Lab Resource 68
Quest: Funky Fruit About Those Chromosomes LS3.B: Variation of Traits In sexually reproducing organisms, each parent contributes half of the genes acquired (at random) by the offspring. Individuals have two of each chromosome and hence two alleles of each gene, one acquired from each parent. These versions may be identical or may differ from each other.
Cells and Heredity SE/TE: 86-91, Patterns of Inheritance 92-97 Chromosomes and
Inheritance TLR: 67, Quick Lab, Inferring the Parent Generation
71-78, Lab Investigation, Make the Right Call! Chapter Activities and Projects 99-105, All in the Family

A Correlation of Interactive Science Grades 6-8 Modules, ©2016 Digital Refreshment
to the Next Generation Science Standards for Middle School
SE = Student Edition; TE = Teacher’s Edition; TLR = Teacher’s Lab Resource 69
MS.Growth, Development, and Reproduction of Organisms MS-LS4-5 Students who demonstrate understanding can: Gather and synthesize information about the technologies that have changed the way humans
influence the inheritance of desired traits in organisms. [Clarification Statement: Emphasis is on synthesizing information
from reliable sources about the influence of humans on genetic outcomes in artificial selection (such as genetic modification, animal husbandry, gene therapy); and, on the impacts these technologies have on society as well as the technologies leading to these scientific discoveries.]
INTERACTIVE SCIENCE: In the Cells and Heredity module, the online Performance Expectation Activity “Growth, Development, and Reproductions of Organisms (MS-LS4-5)” addresses this performance expectation.
Analysis of the production of desired traits is presented in the Cells and Heredity module in Chapter 5, Lesson 3, “How Can Organisms Be Produced With Desired Traits?” on SE/TE pages 146-151.
Students model selective breeding in “Selective Breeding” on TLR page 132 in Lesson 3. They create an outline to organize information about methods of developing organisms with desirable traits in the Ask Questions feature on SE/TE page 147. Students graph and analyze data about
production of rice influenced by genetic factors in the Do the Math! feature on SE/TE page 149.
The performance expectation above was developed using the following elements from the NRC document A Framework for K-12 Science Education:
Science and Engineering Practices
Obtaining, Evaluating, and Communicating Information Obtaining, evaluating, and communicating information in 6–8 builds on K–5 experiences and progresses to evaluating the merit and validity of ideas and methods. Gather, read, and synthesize information from multiple appropriate sources and assess the credibility, accuracy, and possible bias of each publication and methods used, and describe how they are supported or not supported by evidence.
Cells and Heredity SE/TE: 160, Science Matters, Mini But
Mighty TE Only: 150, 21st Century Learning, Information Literacy 151, Differentiated Instruction, Genetically Engineered Medicine
Disciplinary Core Ideas
LS4.B: Natural Selection In artificial selection, humans have the capacity to influence certain characteristics of organisms by selective breeding. One can choose desired parental traits determined by genes, which are then passed on to offspring.
Cells and Heredity SE/TE:
146-151, How Can Organisms Be Produced With Desired Traits? TE Only: 147, Lead a Discussion – Breeding Pets 149, Differentiated Instruction 149, Make Analogies - Cloning
150, 21st Century Learning 151E, Enrich, A Closer Look at Gene Therapy for Cystic Fibrosis TLR: 132, Quick Lab, Selective Breeding
Crosscutting Concepts
Cause and Effect Phenomena may have more than one cause, and some cause and effect relationships in systems can only be described using probability.
Cells and Heredity
SE/TE: 148, Apply It!
------------------------------------------------- Connections to Engineering,
Technology, and Applications of Science
Interdependence of Science, Engineering, and Technology Engineering advances have led to important discoveries in virtually every field of science, and scientific discoveries have led to the development of entire industries and engineered systems.
Cells and Heredity SE/TE: 146-151, How Can Organisms Be
Produced With Desired Traits? 160, Science Matters, Mini But Mighty TE Only:
150, 21st Century Learning, Information Literacy 151, Differentiated Instruction, Genetically Engineered Medicine

A Correlation of Interactive Science Grades 6-8 Modules, ©2016 Digital Refreshment
to the Next Generation Science Standards for Middle School
SE = Student Edition; TE = Teacher’s Edition; TLR = Teacher’s Lab Resource 70
---------------------------------------------------------- Connections to Nature of Science
Science Addresses Questions About the Natural and Material World Science knowledge can describe consequences of actions but does not make the decisions that society takes.
Cells and Heredity
SE/TE: 160, Science Matters, Mini But Mighty TE Only: 149, Differentiated Instruction 150, 21st Century Learning, Information Literacy

A Correlation of Interactive Science Grades 6-8 Modules, ©2016 Digital Refreshment
to the Next Generation Science Standards for Middle School
SE = Student Edition; TE = Teacher’s Edition; TLR = Teacher’s Lab Resource 71
MS.Natural Selection and Adaptations MS-LS4-1 Students who demonstrate understanding can: Analyze and interpret data for patterns in the fossil record that document the existence, diversity,
extinction, and change of life forms throughout the history of life on Earth under the assumption that natural laws operate today as in the past. [Clarification Statement: Emphasis is on finding patterns of changes in the
level of complexity of anatomical structures in organisms and the chronological order of fossil appearance in the rock layers.] [Assessment Boundary: Assessment does not include the names of individual species or geological eras in the fossil record.]
INTERACTIVE SCIENCE: In the Cells and Heredity module, the online Performance Expectation Activity “Natural Selection and Adaptations (MS-LS4-1)” addresses this performance expectation. Patterns of change in fossils are explored in the Earth’s Surface module in Chapter 4, Lesson 1, “What Do Fossils Show?” on SE/TE pages 108-109. Students analyze information about the relationship of an extinct horse-like species to modern horses in the Challenge question on SE/TE
page 108. In Assess Your Understanding on SE/TE page 109, students write to explain what the
fossil record shows. In Review and Assessment, question 23 on SE/TE page 142, students analyze an image of a fossil, make inferences about the organism and its environment, and provide evidence for their inferences. On TE page 109D, Key Concept Summaries, students explain how fossils help scientists make discoveries about lives of organisms. On TLR page 102, students will infer what trace fossils tell you about an organism in “Modeling Trace Fossils.” Students infer and model what fossils can tell you about Earth’s past in “Modeling the Fossil Record” on TLR page 103.
Patterns of change in fossils content is also presented in the Cells and Heredity module in Chapter 6, Lesson 2. The relationship between homologous structures in modern and extinct animals is presented on SE/TE page 178. In Chapter 6, Lesson 3, information on how the fossil record provides evidence for the rate of evolution can be found on SE/TE pages 182-183. Students analyze and interpret fossils relating to horse evolution in Figure 2 on SE/TE page 182. Students analyze and interpret a hypothetical case of punctuated equilibrium in “Rate of Change” on TE
page 183E. In “Walking Whales,” SE/TE page 189, students trace the fossil history of the ancestor
species to whales.
The performance expectation above was developed using the following elements from the NRC document A Framework for K-12 Science Education:
Science and Engineering Practices
Analyzing and Interpreting Data Analyzing data in 6–8 builds on K–5 experiences and progresses to extending quantitative analysis to investigations, distinguishing between correlation and causation, and basic statistical techniques of data and error analysis. Analyze and interpret data to determine similarities and differences in findings.
Earth’s Surface
TLR: 102, Modeling Trace Fossils 103, Modeling the Fossil Record
Cells and Heredity TE Only: 178, Build Inquiry, Observe Similar Species ----------------------------------------------------------
Connections to Nature of Science Scientific Knowledge is Based on Empirical Evidence
Disciplinary Core Ideas
LS4.A: Evidence of Common Ancestry and Diversity The collection of fossils and their placement in chronological order (e.g., through the location of the sedimentary layers in which they are found or through radioactive dating) is known as the fossil record. It documents the existence, diversity, extinction, and change of many life forms throughout the history of life on Earth.
Earth’s Surface SE/TE: 108-109, What Do Fossils Show?
142, Review and Assessment, Q# 23 TE Only: 109D, Key Concept Summaries TLR: 102, Modeling Trace Fossils 103, Modeling the Fossil Record
Crosscutting Concepts
Patterns Graphs, charts, and images can be used to identify patterns in data.
Cells and Heredity SE/TE:
178, Similarities in Body Structure 183, Apply It ----------------------------------------------------------
Connections to Nature of Science
Scientific Knowledge Assumes an Order and Consistency in Natural Systems Science assumes that objects and events in natural systems occur in consistent patterns that are understandable through measurement and observation.
Cells and Heredity SE/TE: 178, Similarities in Body Structure

A Correlation of Interactive Science Grades 6-8 Modules, ©2016 Digital Refreshment
to the Next Generation Science Standards for Middle School
SE = Student Edition; TE = Teacher’s Edition; TLR = Teacher’s Lab Resource 72
Science knowledge is based upon logical and conceptual connections between evidence and explanations.
Cells and Heredity SE/TE: 178, Similarities in Body
Structure 182-183, What Patterns Describe the Rate of Evolution? 189, Walking Whales TE Only: 183E, Rate of Change
Cells and Heredity SE/TE: 178, Similarities in Body Structure
182-183, What Patterns Describe the Rate of Evolution? 189, Walking Whales TE Only: 183E, Rate of Change
182-183, What Patterns Describe the Rate of Evolution? 183, Apply It 189, Walking Whales

A Correlation of Interactive Science Grades 6-8 Modules, ©2016 Digital Refreshment
to the Next Generation Science Standards for Middle School
SE = Student Edition; TE = Teacher’s Edition; TLR = Teacher’s Lab Resource 73
MS.Natural Selection and Adaptations MS-LS4-2 Students who demonstrate understanding can: Apply scientific ideas to construct an explanation for the anatomical similarities and differences
among modern organisms and between modern and fossil organisms to infer evolutionary relationships. [Clarification Statement: Emphasis is on explanations of the evolutionary relationships among organisms in terms of similarity
or differences of the gross appearance of anatomical structures.]
INTERACTIVE SCIENCE: In the Cells and Heredity module, the online Performance Expectation Activity “Natural Selection and Adaptations (MS-LS4-2)” addresses this performance expectation.
Information on patterns of change in fossils is explored in the Earth’s Surface module in Chapter 4, Lesson 1, “What Do Fossils Show?” on SE/TE pages 108-109. Students analyze information about the Hyracotherium to explain its relationship to modern horses in the Challenge question on SE/TE page 108.
Information is also found in the Cells and Heredity module in Chapter 6, Lesson 2. Similarities in
early development anatomical structures of modern organisms are discussed on SE/TE page 177. How fossils allow scientists to infer the structures of ancient organisms is described on SE/TE page 177. The relationship between homologous structures in modern and extinct animals is discussed on SE/TE page 178. Students examine horse evolution and explain how the evolution of the shape of the leg and number of toes would have benefited Equus on SE/TE page 182. Students analyze and interpret a hypothetical case of punctuated equilibrium in “Rate of Change” on TE only page 183E. In “Walking Whales,” SE/TE page 189, students research the evolutionary history of the ancestor
species to whales.
The performance expectation above was developed using the following elements from the NRC document A Framework for K-12 Science Education:
Science and Engineering Practices
Constructing Explanations and Designing Solutions Constructing explanations and designing solutions in 6–8 builds on K–5 experiences and progresses to include constructing explanations and designing solutions supported by multiple sources of evidence consistent with scientific ideas, principles, and theories. Apply scientific ideas to construct an explanation for real-world phenomena, examples, or events.
Earth’s Surface SE/TE: 108-109, What Do Fossils Show?
Cells and Heredity SE/TE:
178, Similarities in Body Structure 182-183, What Patterns Describe the Rate of Evolution? 189, Walking Whales
Disciplinary Core Ideas
LS4.A: Evidence of Common Ancestry and Diversity Anatomical similarities and differences between various organisms living today and between them and organisms in the fossil record, enable the reconstruction of evolutionary history and the inference of lines of evolutionary descent.
Earth’s Surface SE/TE: 108-109, What Do Fossils Show? TE Only:
109D, Key Concept Summaries Cells and Heredity SE/TE:
108-109, What Do Fossils Show? 178, Similarities in Body Structure
182-183, What Patterns Describe the Rate of Evolution? 185, Review and Assessment, Q#9 189, Walking Whales TE Only:
183E, Rate of Change
Crosscutting Concepts
Patterns Patterns can be used to identify cause and effect relationships.
Cells and Heredity SE/TE: 178, Similarities in Body
Structure 182-183, What Patterns Describe the Rate of Evolution?
---------------------------------------------- Connections to Nature of Science
Scientific Knowledge Assumes an Order and Consistency in Natural Systems Science assumes that objects and events in natural systems occur in consistent patterns that are understandable through measurement and observation.
Cells and Heredity SE/TE: 108-109, What Do Fossils Show? 178, Similarities in Body Structure
182-183, What Patterns Describe the Rate of Evolution?

A Correlation of Interactive Science Grades 6-8 Modules, ©2016 Digital Refreshment
to the Next Generation Science Standards for Middle School
SE = Student Edition; TE = Teacher’s Edition; TLR = Teacher’s Lab Resource 74
MS.Natural Selection and Adaptations MS-LS4-3 Students who demonstrate understanding can: Analyze displays of pictorial data to compare patterns of similarities in the embryological development
across multiple species to identify relationships not evident in the fully formed anatomy. [Clarification
Statement: Emphasis is on inferring general patterns of relatedness among embryos of different organisms by comparing the macroscopic appearance of diagrams or pictures.] [Assessment Boundary: Assessment of comparisons is limited to gross appearance of anatomical structures in embryological
development.]
INTERACTIVE SCIENCE: In the Cells and Heredity module, the online Performance Expectation
Activity “Natural Selection and Adaptations (MS-LS4-3)” addresses this performance expectation. The similarities in early development of different organisms are discussed in the Cells and Heredity module in Chapter 6, Lesson 2, “What Evidence Supports Evolution?” on SE/TE page 177. Students analyze visual representations to compare the anatomical differences between four organisms in
Figure 1, “Similarities in Development” on page 177. In the TE, Teach with Visuals supports students in this effort.
The performance expectation above was developed using the following elements from the NRC document A Framework for K-12 Science Education:
Science and Engineering Practices
Analyzing and Interpreting Data Analyzing data in 6–8 builds on K–5 experiences and progresses to extending quantitative analysis to investigations, distinguishing between correlation and causation, and basic statistical techniques of data and error analysis. Analyze displays of data to identify linear and nonlinear relationships.
Cells and Heredity SE/TE: 177, What Evidence Supports
Evolution? 177, Figure 1, Similarities in Development TE Only: 177, Teach with Visuals
Disciplinary Core Ideas
LS4.A: Evidence of Common Ancestry and Diversity Comparison of the embryological development of different species also reveals similarities that show relationships not evident in the fully-formed anatomy.
Cells and Heredity SE/TE: 177, What Evidence Supports
Evolution? 177, Figure 1, Similarities in Development
TE Only: 177, Teach with Visuals
Crosscutting Concepts
Patterns Graphs, charts, and images can be used to identify patterns in data.
Cells and Heredity SE/TE: 177, What Evidence Supports Evolution? 177, Figure 1, Similarities in
Development
TE Only: 177, Teach with Visuals

A Correlation of Interactive Science Grades 6-8 Modules, ©2016 Digital Refreshment
to the Next Generation Science Standards for Middle School
SE = Student Edition; TE = Teacher’s Edition; TLR = Teacher’s Lab Resource 75
MS.Natural Selection and Adaptations MS-LS4-4 Students who demonstrate understanding can: Construct an explanation based on evidence that describes how genetic variations of traits in a
population increase some individuals’ probability of surviving and reproducing in a specific environment. [Clarification Statement: Emphasis is on using simple probability statements and proportional reasoning to construct
explanations
INTERACTIVE SCIENCE: In the Cells and Heredity module, the online Performance Expectation Activity “Natural Selection and Adaptations (MS-LS4-4)” addresses this performance expectation.
Natural selection is explained in the Cells and Heredity module in Chapter 6, Lesson 1, “What Is Natural Selection?” on SE/TE pages 172-176. Students write about the factors that affect natural selection in Figure 5 – Factors That Affect Natural Selection” on SE/TE pages 172-173. In Do the Math!, SE page 174, students speculate on loggerhead turtle nesting sites in the Challenge
question. Students draw a conclusion about genetic variation and natural selection in “Figure 6 – Environmental Change’ on SE/TE page 175. In Assess Your Understanding, students answer the
big question, #2b, and relate cause and effect, #2c. In Enrich, Darwin’s Theory, TE page 175F, students communicate evolution theories of long-necked giraffes to Darwin’s theory of evolution. Students model natural selection in “Nature at Work” on TLR pages 148-156. In Review and Assessment, p. 186, #15, students predict what changes would be observed as a result of environmental change. In Standardized Test Prep, #6, students describe a situation in which natural selection would favor flies with small wings.
The performance expectation above was developed using the following elements from the NRC document A Framework for K-12 Science Education:
Science and Engineering Practices
Constructing Explanations and Designing Solutions Constructing explanations and designing solutions in 6–8 builds on K–5 experiences and progresses to include constructing explanations and designing solutions supported by multiple sources of evidence consistent with scientific ideas, principles, and theories. Construct an explanation that includes qualitative or quantitative relationships between variables that describe phenomena.
Cells and Heredity SE/TE: 175, Assess Your Understanding,
#2b, 2c, Got it? 186, Review and Assessment, Apply the Big Q, #15.
187, Standardized Test Prep, Constructed Response, #6 TE Only: 175F, Enrich, Darwin’s Theory
TLR: 148-156, Nature at Work
Disciplinary Core Ideas
LS4.B: Natural Selection Natural selection leads to the predominance of certain traits in a population, and the suppression of others.
Cells and Heredity SE/TE: 172, Factors That Affect Natural
Selection, Figure 5- Factors That Affect Natural Selection 175, Figure 6- Environmental Change, Assess Your Understanding, #2b, 2c, Got it? 186, Review and Assessment, Apply the Big Q, #15.
187, Standardized Test Prep, Constructed Response, #6 TE Only:
175F, Enrich, Darwin’s Theory TLR: 148-156, Nature at Work
Crosscutting Concepts
Cause and Effect Phenomena may have more than one cause, and some cause and effect relationships in systems can only be described using probability.
Cells and Heredity SE/TE: 173, Relate Cause and Effect 174, Do the Math! 175, Figure 6- Environmental
Change 175, Assess Your Understanding, #2c

A Correlation of Interactive Science Grades 6-8 Modules, ©2016 Digital Refreshment
to the Next Generation Science Standards for Middle School
SE = Student Edition; TE = Teacher’s Edition; TLR = Teacher’s Lab Resource 76
MS.Natural Selection and Adaptations MS-LS4-6 Students who demonstrate understanding can: Use mathematical representations to support explanations of how natural selection may lead to
increases and decreases of specific traits in populations over time. [Clarification Statement: Emphasis is on using
mathematical models, probability statements, and proportional reasoning to support explanations of trends in changes to populations over time.] [Assessment Boundary: Assessment does not include Hardy Weinberg calculations.]
INTERACTIVE SCIENCE: In the Cells and Heredity module, the online Performance Expectation
Activity “Natural Selection and Adaptations (MS-LS4-6)” addresses this performance expectation. Natural selection is explained in the Cells and Heredity module in Chapter 6, Lesson 1, “What Is Natural Selection?” on SE/TE pages 172-176. Students use a mathematical model of natural selection in “Nature at Work” on TLR pages 148-156.
The performance expectation above was developed using the following elements from the NRC document A Framework for K-12 Science Education:
Science and Engineering Practices
Using Mathematics and Computational Thinking Mathematical and computational thinking in 6–8 builds on K–5 experiences and progresses to identifying patterns in large data sets and using mathematical concepts to support explanations and arguments. Use mathematical representations to support scientific conclusions and design solutions.
Cells and Heredity
SE/TE: 174, Do the Math! TLR: 148-156, Nature at Work
Disciplinary Core Ideas
LS4.C: Adaptation Adaptation by natural selection acting over generations is one important process by which species change over time in response to changes in environmental conditions. Traits that support successful survival and reproduction in the new environment become more common; those that do not become less common. Thus, the distribution of traits in a population changes.
Cells and Heredity SE/TE: 172-176, What Is Natural Selection? 172, Factors That Affect Natural Selection
174, Do the Math! TLR: 148-156, Nature at Work
Crosscutting Concepts
Cause and Effect Phenomena may have more than one cause, and some cause and effect relationships in systems can only be described using probability.
Cells and Heredity SE/TE: 174, Do the Math! TLR: 148-156, Nature at Work

A Correlation of Interactive Science Grades 6-8 Modules, ©2016 Digital Refreshment
to the Next Generation Science Standards for Middle School
SE = Student Edition; TE = Teacher’s Edition; TLR = Teacher’s Lab Resource 77
MS.Space Systems MS-ESS1-1 Students who demonstrate understanding can: Develop and use a model of the Earth-sun-moon system to describe the cyclic patterns of lunar
phases, eclipses of the sun and moon, and seasons. [Clarification Statement: Examples of models can be physical, graphical,
or conceptual.]
INTERACTIVE SCIENCE: In the Astronomy and Space Science module, the online Performance
Expectation Activity “Space Systems (MS-ESS1-1)” addresses this performance expectation. The concept of patterns of motion of celestial bodies, including the motions of Earth, the moon, and the sun, is introduced at the start of the Astronomy and Space Science module with the photograph on SE/TE page 1. From that point on, every section relates occurrences such as the occurrence of day and night, eclipses, and lunar phases to the patterns of the observed motions of celestial
bodies. Rotation and day/night cycles are shown on SE/TE page 11, and seasons are shown on
pages 14-15. Students learn about lunar phases on SE/TE pages 22-24 and eclipses on pages 25-26.
Students analyze various figures, mark the pictures, and complete illustrations that reinforce the concept of how objects change position in the sky on SE/TE pages 8-12. Students calculate hours of sunlight on SE/TE page 17. On SE/TE page 20, students interpret data from a graph about the moon’s orbit. Students make a model of the Earth-sun-moon system to describe lunar phases in the Apply It! on SE/TE page 24. They use a model of the Earth-sun-moon system to describe lunar
phases in Figure 2 on page SE/TE page 24. They use a model of the Earth-sun-moon system to describe eclipses in Figure 3 on SE/TE page 25 and Figure 4 on SE/TE page 26. They use a model of the Earth-sun-moon system to represent eclipses in the Teacher to Teacher activity on TE page 26. They also use a model of the Earth-sun-moon system to describe seasons, lunar phases, and eclipses in Figure 5 on SE/TE page 27. They develop and use a model of the Earth-sun-moon system to represent eclipses in the Differentiated Instruction on TE page 27. They use a model of
the Earth-sun-moon system to describe tides on SE/TE page 30. Students demonstrate their
content knowledge in Assess Your Understanding, SE/TE: 27, 1a, 1b and Got it? On TE page 27C, students construct explanations of how the interaction of the moon, Earth, and sun cause phases of the moon and eclipses.
Students make models of how Earth’s rotation causes day and night on TLR page 16. They model how tilting of Earth’s axis causes the seasons, on TLR page 19. Students model the Earth-sun-moon system to describe lunar phases on TLR page 31. They model the Earth-sun-moon system to describe eclipses on TLR page 32.
The performance expectation above was developed using the following elements from the NRC document A Framework for K-12 Science Education:
Science and Engineering Practices
Developing and Using Models Modeling in 6–8 builds on K–5 experiences and progresses to developing, using, and revising
models to describe, test, and predict more abstract phenomena and design systems.
Develop and use a model to describe phenomena.
Astronomy and Space Science SE/TE: 15, Figure 4: Seasons 23, Figure 1: The Moon’s Motion 24, Apply It! 25, Figure 3: Solar Eclipse 26, Figure 4: Lunar Eclipse
27, Figure 5 Seasons and Shadows
Disciplinary Core Ideas
ESS1.A: The Universe and Its Stars Patterns of the apparent motion of the sun,
the moon, and stars in the sky can be observed, described, predicted, and explained with models.
Astronomy and Space Science SE/TE: 11, How Does Earth Move? 15, What Causes Seasons? 24, Phases of the Moon
25, What Are Eclipses? 29, What Are Tides? TE Only: 27C, Key Concept Summaries
Crosscutting Concepts
Patterns Patterns can be used to identify cause and
effect relationships.
Astronomy and Space Science SE/TE: 11, How Does Earth Move?
14, What Causes Seasons 15, Figure 4: Seasons 22, What Causes the Moon’s Phases? 23, Figure 1: The Moon’s Motions 24, Figure 2: Moon Phases

A Correlation of Interactive Science Grades 6-8 Modules, ©2016 Digital Refreshment
to the Next Generation Science Standards for Middle School
SE = Student Edition; TE = Teacher’s Edition; TLR = Teacher’s Lab Resource 78
TE Only: 15, Build Inquiry: Compare and Contrast Angles of Sunlight 15: Differentiated Instruction:
Model 27, Differentiated Instruction: Model Eclipses TLR: 16, What Causes Day and Night? 17, Sun Shadows 18-26, Reasons for the Seasons
31, Moon Phases 32, Eclipses
TLR: 15, Watching the Skies 16, What Causes Day and Night? 17, Sun Shadows
18-26, Reasons for the Seasons 29, Around and Around We Go 30, How Does the Moon Move? 31, Moon Phases 32, Eclipses
ESS1.B: Earth and the Solar System This model of the solar system can explain
eclipses of the sun and the moon. Earth’s spin axis is fixed in direction over the short-term but
tilted relative to its orbit around the sun. The seasons are a result of that tilt and are caused by
the differential intensity of sunlight on different areas of Earth across the year.
Astronomy and Space Science SE/TE: 11-12, How Does Earth Move? 14-17 What Causes Seasons?
22-24, What Causes the Moon’s Phases? 23, Figure 1: The Moon’s Motions 24, Figure 2: Moon Phases 25-26, What Are Eclipses? 25, Figure 3: Solar Eclipse
26, Figure 4: Lunar Eclipse TE Only: 17D, Understanding Main Ideas
27C, Key Concept Summaries 27D, Understanding Main Ideas TLR: 18-26, Reasons for the Seasons
30, How Does the Moon Move? 31, Moon Phases 32, Eclipses
TE Only: 17E, Enrich – Build a Simple Sundial 27C, Key Concept Summaries
----------------------------------------
Connections to Nature of Science
Scientific Knowledge Assumes an Order and Consistency in Natural Systems Science assumes that objects and events in
natural systems occur in consistent patterns that are understandable through measurement and
observation.
Astronomy and Space Science
SE/TE: 8-9, How Do Objects in the Sky Appear to Move? 10-17, Earth in Space 22-27, Phases and Eclipses 28-31, Tides 79-81, What Was the Geocentric
Model? TE Only: 9E, Enrich – The Phases of Venus 17E, Enrich – Build a Simple Sundial 31E, Enrich – What Affects the Heights of Tides?
81E, Enrich – The Phases of Venus
TLR: 16, What Causes Day and Night? 17, Sun Shadows 18-26, Reasons for the Seasons
31, Moon Phases 32, Eclipses 83-91, Speeding Around the Sun
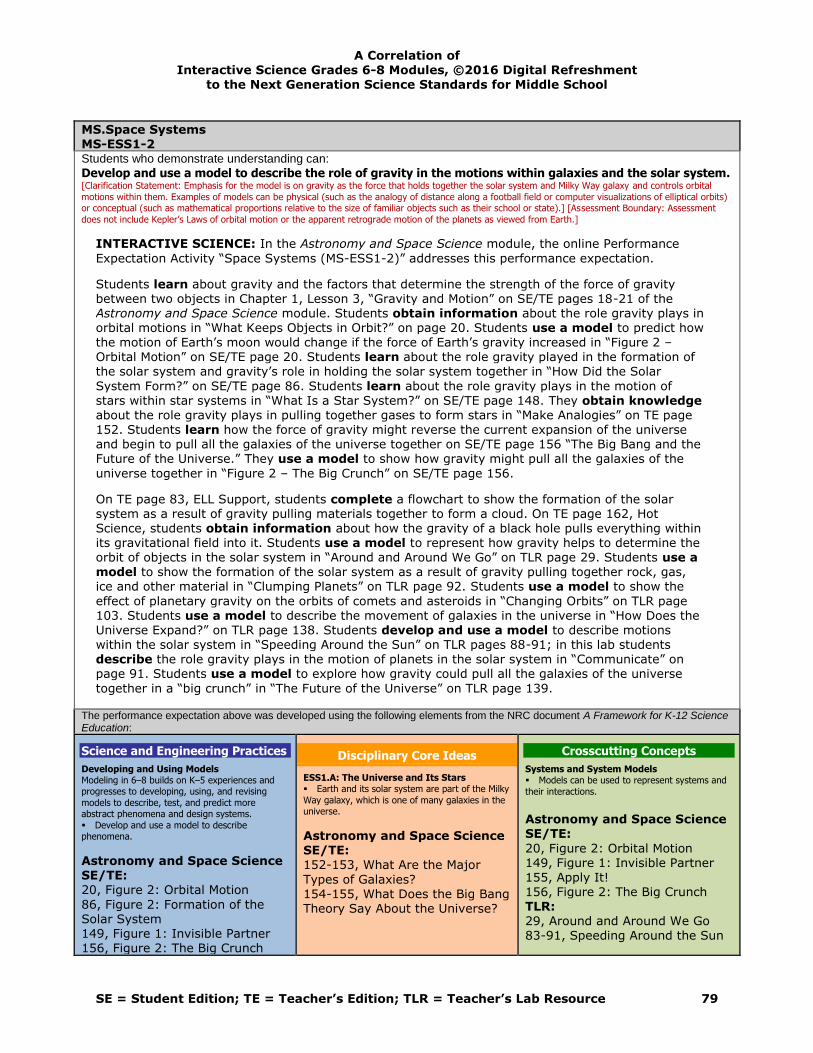
A Correlation of Interactive Science Grades 6-8 Modules, ©2016 Digital Refreshment
to the Next Generation Science Standards for Middle School
SE = Student Edition; TE = Teacher’s Edition; TLR = Teacher’s Lab Resource 79
MS.Space Systems MS-ESS1-2 Students who demonstrate understanding can:
Develop and use a model to describe the role of gravity in the motions within galaxies and the solar system. [Clarification Statement: Emphasis for the model is on gravity as the force that holds together the solar system and Milky Way galaxy and controls orbital
motions within them. Examples of models can be physical (such as the analogy of distance along a football field or computer visualizations of elliptical orbits) or conceptual (such as mathematical proportions relative to the size of familiar objects such as their school or state).] [Assessment Boundary: Assessment
does not include Kepler’s Laws of orbital motion or the apparent retrograde motion of the planets as viewed from Earth.]
INTERACTIVE SCIENCE: In the Astronomy and Space Science module, the online Performance
Expectation Activity “Space Systems (MS-ESS1-2)” addresses this performance expectation.
Students learn about gravity and the factors that determine the strength of the force of gravity between two objects in Chapter 1, Lesson 3, “Gravity and Motion” on SE/TE pages 18-21 of the Astronomy and Space Science module. Students obtain information about the role gravity plays in orbital motions in “What Keeps Objects in Orbit?” on page 20. Students use a model to predict how
the motion of Earth’s moon would change if the force of Earth’s gravity increased in “Figure 2 – Orbital Motion” on SE/TE page 20. Students learn about the role gravity played in the formation of the solar system and gravity’s role in holding the solar system together in “How Did the Solar
System Form?” on SE/TE page 86. Students learn about the role gravity plays in the motion of stars within star systems in “What Is a Star System?” on SE/TE page 148. They obtain knowledge about the role gravity plays in pulling together gases to form stars in “Make Analogies” on TE page 152. Students learn how the force of gravity might reverse the current expansion of the universe and begin to pull all the galaxies of the universe together on SE/TE page 156 “The Big Bang and the Future of the Universe.” They use a model to show how gravity might pull all the galaxies of the
universe together in “Figure 2 – The Big Crunch” on SE/TE page 156.
On TE page 83, ELL Support, students complete a flowchart to show the formation of the solar system as a result of gravity pulling materials together to form a cloud. On TE page 162, Hot Science, students obtain information about how the gravity of a black hole pulls everything within its gravitational field into it. Students use a model to represent how gravity helps to determine the
orbit of objects in the solar system in “Around and Around We Go” on TLR page 29. Students use a model to show the formation of the solar system as a result of gravity pulling together rock, gas, ice and other material in “Clumping Planets” on TLR page 92. Students use a model to show the
effect of planetary gravity on the orbits of comets and asteroids in “Changing Orbits” on TLR page 103. Students use a model to describe the movement of galaxies in the universe in “How Does the Universe Expand?” on TLR page 138. Students develop and use a model to describe motions within the solar system in “Speeding Around the Sun” on TLR pages 88-91; in this lab students describe the role gravity plays in the motion of planets in the solar system in “Communicate” on page 91. Students use a model to explore how gravity could pull all the galaxies of the universe
together in a “big crunch” in “The Future of the Universe” on TLR page 139.
The performance expectation above was developed using the following elements from the NRC document A Framework for K-12 Science Education:
Science and Engineering Practices
Developing and Using Models Modeling in 6–8 builds on K–5 experiences and progresses to developing, using, and revising
models to describe, test, and predict more abstract phenomena and design systems.
Develop and use a model to describe phenomena.
Astronomy and Space Science SE/TE: 20, Figure 2: Orbital Motion
86, Figure 2: Formation of the Solar System 149, Figure 1: Invisible Partner 156, Figure 2: The Big Crunch
Disciplinary Core Ideas
ESS1.A: The Universe and Its Stars Earth and its solar system are part of the Milky
Way galaxy, which is one of many galaxies in the universe.
Astronomy and Space Science SE/TE: 152-153, What Are the Major
Types of Galaxies? 154-155, What Does the Big Bang Theory Say About the Universe?
Crosscutting Concepts
Systems and System Models Models can be used to represent systems and
their interactions.
Astronomy and Space Science SE/TE:
20, Figure 2: Orbital Motion 149, Figure 1: Invisible Partner 155, Apply It! 156, Figure 2: The Big Crunch TLR: 29, Around and Around We Go 83-91, Speeding Around the Sun

A Correlation of Interactive Science Grades 6-8 Modules, ©2016 Digital Refreshment
to the Next Generation Science Standards for Middle School
SE = Student Edition; TE = Teacher’s Edition; TLR = Teacher’s Lab Resource 80
TLR: 29, Around and Around We Go 92, Clumping Planets 83-91, Speeding Around the Sun
103, Changing Orbits 138, How Does the Universe Expand 139, The Future of the Universe Quest: Searching for a Star Searching for the Unseen
TE Only: 153, Differentiated Instruction – L1 Where in the Milky Way Are We?
153E, Enrich – Star Systems and Galaxies TLR: 135, Why Does the Milky Way Look Hazy? 138, How Does the Universe Expand?
139, The Future of the Universe ESS1.B: Earth and the Solar System The solar system consists of the sun and a
collection of objects, including planets, their moons, and asteroids that are held in orbit around
the sun by its gravitational pull on them.
Astronomy and Space Science
SE/TE: 82-87, Introducing the Solar System 88-93, The Sun 94-101, The Inner Planets 102-109, The Outer Planets
110-115, Small Solar System Objects TE Only: 83, Teach Key Concepts, Lead a Discussion
84, Teacher to Teacher 85, Differentiated Instruction – L1
Make Flashcards 91, Differentiated Instruction – L1 Interpret Diagrams 101, Differentiated Instruction – L1 Oral Review 101D, Review and Reinforce 105, 21st Century Learning
107, Teacher Demo – Compare and Contrast Planets 113, Differentiated Instruction – L1 Make Flashcards 115, Differentiated Instruction – L3 Multimedia Presentation
TLR:
83-91, Speeding Around the Planets 97, Characteristics of the Inner Planets 99, How Big Are the Planets? 100, Density Mystery
102, Collecting Micrometeorites
92, Clumping Planets 103, Changing Orbits 138, How Does the Universe Expand?
139, The Future of the Universe Quest: Searching for a Star Searching for the Unseen
----------------------------------------
Connections to Nature of Science
Scientific Knowledge Assumes an
Order and Consistency in Natural
Systems
Science assumes that objects and events in natural systems occur in consistent patterns that
are understandable through measurement and observation.
Astronomy and Space Science SE/TE: 18, What Determines Gravity? 20, What Keeps Objects in Orbit? 148, What Is a Star System?
TLR: 83-91, Speeding Around the Sun 103, Changing Orbits 138, How Does the Universe Expand? 139, The Future of the Universe Quest:
Searching for a Star Searching for the Unseen

A Correlation of Interactive Science Grades 6-8 Modules, ©2016 Digital Refreshment
to the Next Generation Science Standards for Middle School
SE = Student Edition; TE = Teacher’s Edition; TLR = Teacher’s Lab Resource 81
ESS1.B: Earth and the Solar System The solar system appears to have formed from
a disk of dust and gas, drawn together by gravity.
Astronomy and Space Science SE/TE: 86-87, How Did the Solar System Form? TE Only:
83, ELL Support TLR: 92, Clumping Planets

A Correlation of Interactive Science Grades 6-8 Modules, ©2016 Digital Refreshment
to the Next Generation Science Standards for Middle School
SE = Student Edition; TE = Teacher’s Edition; TLR = Teacher’s Lab Resource 82
MS.Space Systems MS-ESS1-3 Students who demonstrate understanding can: Analyze and interpret data to determine scale properties of objects in the solar system. [Clarification
Statement: Emphasis is on the analysis of data from Earth-based instruments, space-based telescopes, and spacecraft to determine similarities and
differences among solar system objects. Examples of scale properties include the sizes of an object’s layers (such as crust and atmosphere), surface features (such as volcanoes), and orbital radius. Examples of data include statistical information, drawings and photographs, and models.]
[Assessment boundary: Assessment does not include recalling facts about properties of the planets and other solar system bodies.]
INTERACTIVE SCIENCE: In the Astronomy and Space Science module, the online Performance Expectation Activity “Space Systems (MS-ESS1-3)” addresses this performance expectation. Data and other information about properties of objects in the solar system, including planets, dwarf
planets, comets, asteroids, and meteors, are detailed in the Astronomy and Space Science module, Chapter 3, Lessons 1-6. The concept of scale and distance in the solar system is discussed in Lesson
2, “Introducing the Solar System,” page 83. The relative sizes of the planets and data related to their orbital radii and orbital periods are presented in “Figure 1 - The Solar System” on pages 84-85. The use of the telescopes to obtain data related to objects in in the solar system and in the universe is discussed in “My Planet Diary: Galileo Galilei” on SE/TE page 32, “Galileo’s Evidence” on SE/TE page 81, “My Planet Diary: Predicting a Planet” on SE/TE page 102, “Figure 3: The Hubble
Space Telescope” on SE/TE page 129, and “Black Holes” on SE/TE page 162. The use of spacecraft, including rockets, lunar landers, probes, and space stations, to obtain data is discussed in “After Apollo: Exploring the Moon” on SE/TE page 41, “Figure 2: Major Events in Moon Exploration” on SE/TE pages 54–55, “The History of Space Exploration” on SE/TE pages, “Space Stations” on SE/TE page 58, and the Apply It! activity on SE/TE pages 60–61. Individual spacecraft used to explore specific planets in the solar system is detailed in “What Are the Characteristics of the Inner
Planets?” on pages 96–101 and “What Are the Characteristics of the Outer Planets?” on SE/TE pages 104–109. Students interpret data and draw the scale distance of each planet from the sun in “Figure 1 – The Solar System” on SE/TE pages 84-85 in the Astronomy and Space Science module. Students
learn about scale properties of the inner planets in Chapter 3, Lesson 4, pages 94-101. Students analyze and interpret data related to scale properties of objects in the universe in “Figure 1 –
The Inner Planets,” page 95. Students compare the size and mass of Earth with the size and mass of Venus in the Teacher Demo activity on TE page 97. Students interpret data related to the atmospheres of Earth and Venus in “Enrich: Atmosphere of Earth and Venus” on TE page 101E. Students analyze and interpret data related to scale properties of objects in the universe in “Figure 1 – The Outer Planets,” page 103. Students calculate the size of Jupiter’s Great Red Spot relative to the size of storms on Earth in “Figure 2 – The Great Red Spot,” page 104. Students test each other’s knowledge of properties of the planets, including relative size, in Differentiated
Instruction” on TE page 85. Students interpret photographs to compare sizes of Jupiter’s moons in “Differentiated Instruction: Photo Research” on TE page 105. Students compare the orbital radii of Neptune and Pluto in “The Outer Planets” on TE page 109E. Students make a model of the solar system to show relative distances from the sun to each planet in “Alternate Assessment” on TE page 117. Students compare the size of Earth to the size of the sun in “How Big Is Earth?” on TLR page 82. Students investigate the relationship between a planet’s period of rotation and its distance
from the sun in “Speeding Around the Sun” on TLR pages 83-91. Students make a model of the sun’s layers in “Layers of the Sun” on TLR page 94. Students compare the sizes of the planets in “How Big Are the Planets?” on TLR page 99.
The performance expectation above was developed using the following elements from the NRC document A Framework for K-12 Science Education:

A Correlation of Interactive Science Grades 6-8 Modules, ©2016 Digital Refreshment
to the Next Generation Science Standards for Middle School
SE = Student Edition; TE = Teacher’s Edition; TLR = Teacher’s Lab Resource 83
Science and Engineering Practices
Analyzing and Interpreting Data Analyzing data in 6–8 builds on K–5 experiences
and progresses to extending quantitative analysis to investigations, distinguishing between correlation and causation, and basic statistical
techniques of data and error analysis. Analyze and interpret data to determine
similarities and differences in findings.
Astronomy and Space Science
SE/TE: 79, Apply It! 80-81, Figure 1: Changing Models 102, My Planet Diary: Predicting a Planet
TLR:
79, What Is at the Center? Quest: Searching for a Star Space Invaders
Disciplinary Core Ideas
ESS1.B: Earth and the Solar System The solar system consists of the sun and a
collection of objects, including planets, their moons, and asteroids that are held in orbit around
the sun by its gravitational pull on them.
Astronomy and Space Science SE/TE: 18-21, Gravity and Motion 82-87, Introducing the Solar System 88-93, The Sun 94-101, The Inner Planets
102-109, The Outer Planets 110-115, Small Solar System
Objects TE Only: 21E, Enrich – Your Weight in the Solar System 83, ELL Support
87E, Enrich – Planets for Human Settlement 91, Differentiated Instruction 93E, Enrich – Sunspot Clues 97, Differentiated Instruction – L1 Compare and Contrast Inner
Planets 97, Teacher Demo – Venus’s Rotation 99, Build Inquiry – Interpret the
Greenhouse Effect 101E, Enrich – Atmospheres of Earth and Venus
105, 21st Century Learning 105 – Differentiated Instruction – L3 Photo Research 107, Teacher Demo – Compare and Contrast Planets 109E, Enrich – The Orbits of Neptune and Pluto
115E, Enrich – Evidence of a Large Meteorite TLR: 27, What Factors Affect Gravity? 29, Around and Around We Go 36, Moonwatching
83, Speeding Around the Sun 93, How Can You Safely Observe the Sun? 95, Viewing Sunspots 99, How Big Are the Planets? 101, Make a Model of Saturn 102, Collecting Micrometeorites
Quest: Searching for a Star Space Invaders
Crosscutting Concepts
Scale, Proportion, and Quantity Time, space, and energy phenomena can be
observed at various scales using models to study systems that are too large or too small.
Astronomy and Space Science
SE/TE: 24, Apply It! 27, Figure 5, Seasons and Shadows 78-81, Models of the Solar System 80-81, Figure 1: Changing Models
84-85, Figure 1: The Solar
System TE Only: 27, Differentiated Instruction 81, Build Inquiry – Model the Movements of the Inner Planets 84, Teacher to Teacher
104, Teacher Demo – Model the Great Red Spot TLR: 16, What Causes Day and Night? 16-26, Reasons for the Seasons 28, What’s Doing the Pulling? 32, Eclipses
34, Modeling the Moon’s Pull of Gravity 79, What Is at the Center?
80, Going Around in Circles 82, How Big Is Earth? 83-91, Speeding Around the Sun
92, Clumping Planets 96, Ring Around the Sun 98, Greenhouse Effect 99, How Big Are the Planets? 101, Make a Model of Saturn 103, Changing Orbits Quest: Searching for a Star
Space Invaders
----------------------------------------
Connections to Engineering,
Technology, and Applications of
Science
Interdependence of Science,
Engineering, and Technology
• Engineering advances have led to
important discoveries in virtually every field
of science and scientific discoveries have
led to the development of entire industries
and engineered systems.
Astronomy and Space Science SE/TE: 46-51, The Science of Rockets 52-61, The History of Space Exploration

A Correlation of Interactive Science Grades 6-8 Modules, ©2016 Digital Refreshment
to the Next Generation Science Standards for Middle School
SE = Student Edition; TE = Teacher’s Edition; TLR = Teacher’s Lab Resource 84
62-67, Using Space Science on Earth 72, One Ticket to Space, Please 73, Living in Space: The
Expedition 18 Crew 82, Planet Diary – Extreme Conditions 128-131, What Are Telescopes and How Do They Work? TE Only: 46A, Content Refresher – Atlas
Rockets 48, Build Inquiry – Draw Conclusions About Rocket Propulsion Technologies
50, 21st Century Learning 51 Differentiated Instruction 51F, Enrich – The Science of
Rockets 52A, Content Refresher – History of NASA 55, Build Inquiry – Apply the Concept of Moon Exploration 64, 21st Century Learning
67, Differentiated Instruction – L1 Make a Concept Map 67F, Enrich – Geostationary Orbits and Polar Orbits 129, Differentiated Instruction – L3 History of the Telescope 131, Teacher Demo – Locating
Radio Waves TLR: 49, Modeling Multistage Rockets 51, Humans in Space 54, Using Space Science 56-64, Space Spinoffs 65, Useful Satellites
11-125, Design and Build a Telescope

A Correlation of Interactive Science Grades 6-8 Modules, ©2016 Digital Refreshment
to the Next Generation Science Standards for Middle School
SE = Student Edition; TE = Teacher’s Edition; TLR = Teacher’s Lab Resource 85
MS.History of Earth MS-ESS1-4 Students who demonstrate understanding can: Construct a scientific explanation based on evidence from rock strata for how the geologic time scale
is used to organize Earth’s 4.6-billion-year-old history. [Clarification Statement: Emphasis is on how analyses of rock
formations and the fossils they contain are used to establish relative ages of major events in Earth’s history. Examples of Earth’s major events could range from being very recent (such as the last Ice Age or the earliest fossils of homo sapiens) to very old (such as the formation of Earth or the
earliest evidence of life). Examples can include the formation of mountain chains and ocean basins, the evolution or extinction of particular living organisms, or significant volcanic eruptions.] [Assessment Boundary: Assessment does not include recalling the names of specific periods or epochs and events within them.]
INTERACTIVE SCIENCE: In the Earth’s Surface module, the online Performance Expectation Activity “History of Earth (MS-ESS1-4)” addresses this performance expectation.
The concept that fossils preserved in rock are a source of evidence about past life and environments on Earth is presented in the Earth’s Surface module in Chapter 4, Lesson 1, on SE/TE pages 104-
109. How scientists use rock strata and fossil records to determine the relative ages of rocks is explored in “The Relative Age of Rocks” on SE/TE pages 110-115. How scientists use rock strata and the fossil record to develop the geologic time scale is described in Chapter 4, Lesson 4, on SE/TE pages 120-123. How scientists use radioactive dating of rocks to determine major events in Earth’s past, such as the formation of Earth and the formation of the continents, is discussed in “Early Earth” on SE/TE pages 124-127. The organization of the geologic time scale and the evolution of living organisms (including humans) is described in “Eras of Earth’s History” on SE/TE pages 128-139.
Students obtain information about the concepts of relative and absolute age of rock, along with
the law of superposition for sedimentary layering, on SE/TE page 111. Students learn how igneous intrusion and faulting in rock strata can be used to determine the relative age of rock on SE/TE page 112. Gaps in the geologic record caused by erosion, deposition, and folding of rock strata are covered on SE/TE page 114-115. Students interpret diagrams of index fossils in rock strata in SE/TE “Figure 4 – Index Fossils” on SE/TE page 113. Students identify which organisms lived during specific geologic eras and geologic periods in “Figure 2 – The Geologic Time Scale” on SE/TE page
122 and in “Figure 6 – Geologic Periods” on SE/TE pages 136-139. Students interpret a diagram of rock layers in the Grand Canyon in “Enrich – A Young Canyon Made of Old Layers” on TE page 123E. Students describe the extinction of the dinosaurs in “Figure 4 – The End of the Dinosaurs” on SE/TE page 134. Students sequence events related to the formation of Earth’s oceans on SE/TE page 126. Students model layering and deformed rock sequences in “Which Layer Is the Oldest” on TLR page 104 and “How Did It Form?” on TLR page 114. Students model core samples of rock as evidence used to organize geologic time in “Exploring Geologic Time Through Core Samples” on TLR
page 105-113.
The performance expectation above was developed using the following elements from the NRC document A Framework for K-12 Science Education:
Science and Engineering Practices
Constructing Explanations and Designing Solutions Constructing explanations and designing solutions
in 6–8 builds on K–5 experiences and progresses to include constructing explanations and
designing solutions supported by multiple sources of evidence consistent with scientific ideas,
principles, and theories. • Construct a scientific explanation based on valid and reliable evidence obtained from sources
(including the students’ own experiments) and the assumption that theories and laws that describe
the natural world operate today as they did in the past and will continue to do so in the future.
Earth’s Surface SE/TE 110, How Old Are Rock Layers?
Disciplinary Core Ideas
ESS1.C: The History of Planet Earth • The geologic time scale interpreted from rock strata provides a way to organize Earth’s history.
Analyses of rock strata and the fossil record provide only relative dates, not an absolute scale.
Earth’s Surface SE/TE: 108, What Do Fossils Show?
110, How Old Are Rock Layers? 111, Figure 1: Rock Layers in the Grand Canyon 112, Figures 2 & 3: Intrusion, Fault 112, Apply It! 113, Index Fossils
Crosscutting Concepts
Scale Proportion and Quantity • Time, space, and energy phenomena can be observed at various scales using models to study
systems that are too large or too small.
Earth’s Surface SE/TE: 111, Figure 1: Rock Layers in the
Grand Canyon 113, Figure 4: Index Fossils 114, Figure 5: Unconformities and Folding 120, My Planet Diary – Earth’s History in a Day
136, How Do Scientists Study Earth’s past?

A Correlation of Interactive Science Grades 6-8 Modules, ©2016 Digital Refreshment
to the Next Generation Science Standards for Middle School
SE = Student Edition; TE = Teacher’s Edition; TLR = Teacher’s Lab Resource 86
112, Apply It! 113, Figure 4: Index Fossils 114, How Can Rock Layers Change?
115, Apply It! 125, How Did Earth Form? 126, Sequence and Apply It! 134, Figure 4: The End of the Dinosaurs TE Only:
115E, Enrich – The Grandest
Canyon of All 127E, Enrich – Life and Earth’s Atmosphere 129, 21st Century Learning
139F, Enrich – The End of an Era TLR
100, What’s In a Rock?
105-113, Exploring Geologic Time Through Core Samples 114, How Did It Form? 120, How Could Planet Earth Form in Space? 124, Modeling an Asteroid Impact
Quest: The Big Fossil Hunt Clues in the Rock Layers Fossils Around the World A Matter of Time Time to Choose the Dig Site Reflect on the Big Fossil Hunt
114, How Can Rock Layers Change? 114, Figure 5: Unconformities and Folding
114, Target Skill: Relate Text and Visuals 115, Apply It! 116, What is Radioactive Dating? 117, Half-Life 118, What Is Radioactive Dating? 118, Do the Math
119, Using Carbon-14 Dating 120, My Planet Diary 121, The Geologic Time Scale 145, Frozen Evidence
TE Only: 113, Build Inquiry, Compare Rock Samples
115, Differentiated Instruction 115, Make Analogies – Folding Layers Under 115E, Enrich – The Grandest Canyon of All 119, Build Inquiry – Model
Radioactive Dating 119E, Enrich – Radioactive Dating 123, Differentiated Instruction 123, Build Inquiry – Compare and Contrast Visuals 123E, Enrich – The Geologic Time Scale
127E, Enrich – Life and Earth’s Atmosphere 129, 21st Century Learning 139F, Enrich – The End of an Era TLR: 100, What’s In a Rock? 104, Which Layer Is the Oldest?
105–113, Exploring Geologic Time Through Core Samples 114, How Did It Form? 116, The Dating Game 117, How Old Is It? 123, Graphing the Fossil Record
Quest: The Big Fossil Hunt Clues in the Rock Layers
Fossils Around the World A Matter of Time Time to Choose the Dig Site Reflect on the Big Fossil Hunt
139, Answer the Big Question TE only: 119, Build Inquiry – Model Radioactive Dating
TLR: 101, Fossils 102, Modeling Trace Fossils 103, Modeling the Fossil Record 105, Exploring Geologic Time Through Core Samples 115, How Long Till It’s Gone?
Quest: The Big Fossil Hunt Clues in the Rock Layers Fossils Around the World A Matter of Time
Time to Choose the Dig Site Reflect on the Big Fossil Hunt
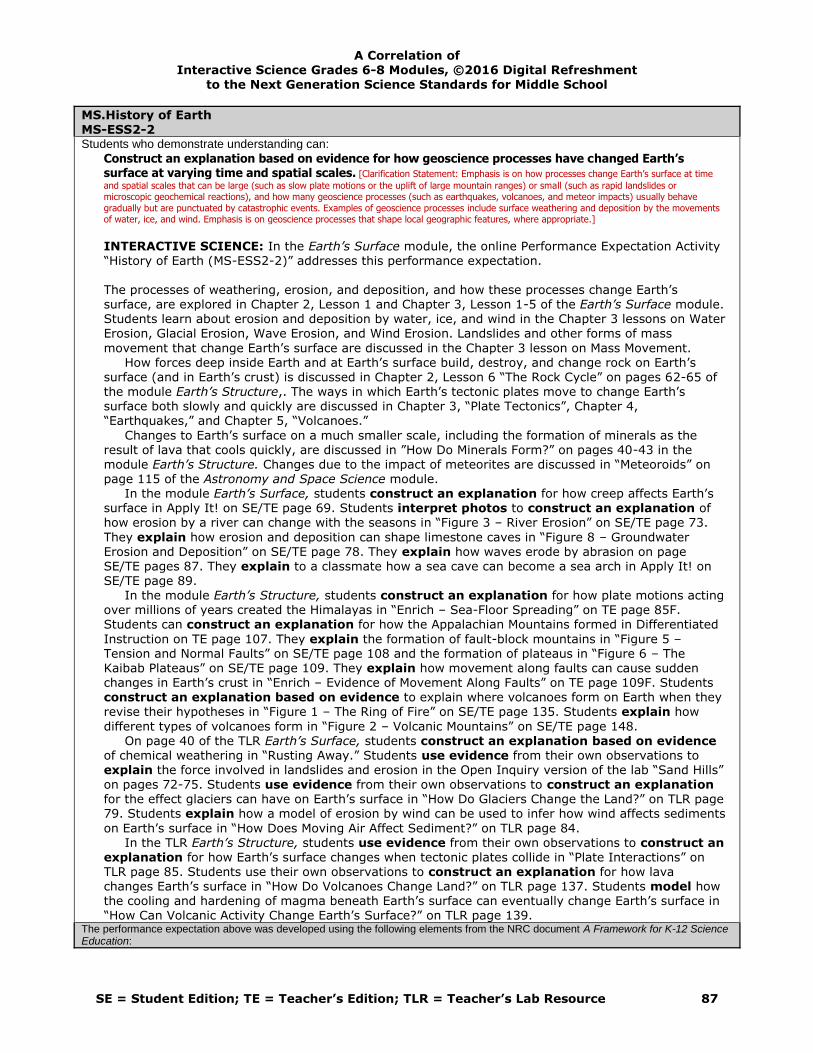
A Correlation of Interactive Science Grades 6-8 Modules, ©2016 Digital Refreshment
to the Next Generation Science Standards for Middle School
SE = Student Edition; TE = Teacher’s Edition; TLR = Teacher’s Lab Resource 87
MS.History of Earth MS-ESS2-2 Students who demonstrate understanding can: Construct an explanation based on evidence for how geoscience processes have changed Earth’s
surface at varying time and spatial scales. [Clarification Statement: Emphasis is on how processes change Earth’s surface at time
and spatial scales that can be large (such as slow plate motions or the uplift of large mountain ranges) or small (such as rapid landslides or microscopic geochemical reactions), and how many geoscience processes (such as earthquakes, volcanoes, and meteor impacts) usually behave
gradually but are punctuated by catastrophic events. Examples of geoscience processes include surface weathering and deposition by the movements of water, ice, and wind. Emphasis is on geoscience processes that shape local geographic features, where appropriate.]
INTERACTIVE SCIENCE: In the Earth’s Surface module, the online Performance Expectation Activity “History of Earth (MS-ESS2-2)” addresses this performance expectation. The processes of weathering, erosion, and deposition, and how these processes change Earth’s surface, are explored in Chapter 2, Lesson 1 and Chapter 3, Lesson 1-5 of the Earth’s Surface module. Students learn about erosion and deposition by water, ice, and wind in the Chapter 3 lessons on Water
Erosion, Glacial Erosion, Wave Erosion, and Wind Erosion. Landslides and other forms of mass
movement that change Earth’s surface are discussed in the Chapter 3 lesson on Mass Movement. How forces deep inside Earth and at Earth’s surface build, destroy, and change rock on Earth’s surface (and in Earth’s crust) is discussed in Chapter 2, Lesson 6 “The Rock Cycle” on pages 62-65 of the module Earth’s Structure,. The ways in which Earth’s tectonic plates move to change Earth’s surface both slowly and quickly are discussed in Chapter 3, “Plate Tectonics”, Chapter 4, “Earthquakes,” and Chapter 5, “Volcanoes.”
Changes to Earth’s surface on a much smaller scale, including the formation of minerals as the result of lava that cools quickly, are discussed in ”How Do Minerals Form?” on pages 40-43 in the module Earth’s Structure. Changes due to the impact of meteorites are discussed in “Meteoroids” on page 115 of the Astronomy and Space Science module. In the module Earth’s Surface, students construct an explanation for how creep affects Earth’s surface in Apply It! on SE/TE page 69. Students interpret photos to construct an explanation of how erosion by a river can change with the seasons in “Figure 3 – River Erosion” on SE/TE page 73.
They explain how erosion and deposition can shape limestone caves in “Figure 8 – Groundwater Erosion and Deposition” on SE/TE page 78. They explain how waves erode by abrasion on page
SE/TE pages 87. They explain to a classmate how a sea cave can become a sea arch in Apply It! on SE/TE page 89. In the module Earth’s Structure, students construct an explanation for how plate motions acting over millions of years created the Himalayas in “Enrich – Sea-Floor Spreading” on TE page 85F. Students can construct an explanation for how the Appalachian Mountains formed in Differentiated
Instruction on TE page 107. They explain the formation of fault-block mountains in “Figure 5 – Tension and Normal Faults” on SE/TE page 108 and the formation of plateaus in “Figure 6 – The Kaibab Plateaus” on SE/TE page 109. They explain how movement along faults can cause sudden changes in Earth’s crust in “Enrich – Evidence of Movement Along Faults” on TE page 109F. Students construct an explanation based on evidence to explain where volcanoes form on Earth when they revise their hypotheses in “Figure 1 – The Ring of Fire” on SE/TE page 135. Students explain how
different types of volcanoes form in “Figure 2 – Volcanic Mountains” on SE/TE page 148. On page 40 of the TLR Earth’s Surface, students construct an explanation based on evidence of chemical weathering in “Rusting Away.” Students use evidence from their own observations to explain the force involved in landslides and erosion in the Open Inquiry version of the lab “Sand Hills”
on pages 72-75. Students use evidence from their own observations to construct an explanation for the effect glaciers can have on Earth’s surface in “How Do Glaciers Change the Land?” on TLR page 79. Students explain how a model of erosion by wind can be used to infer how wind affects sediments
on Earth’s surface in “How Does Moving Air Affect Sediment?” on TLR page 84. In the TLR Earth’s Structure, students use evidence from their own observations to construct an explanation for how Earth’s surface changes when tectonic plates collide in “Plate Interactions” on TLR page 85. Students use their own observations to construct an explanation for how lava changes Earth’s surface in “How Do Volcanoes Change Land?” on TLR page 137. Students model how the cooling and hardening of magma beneath Earth’s surface can eventually change Earth’s surface in “How Can Volcanic Activity Change Earth’s Surface?” on TLR page 139.
The performance expectation above was developed using the following elements from the NRC document A Framework for K-12 Science Education:

A Correlation of Interactive Science Grades 6-8 Modules, ©2016 Digital Refreshment
to the Next Generation Science Standards for Middle School
SE = Student Edition; TE = Teacher’s Edition; TLR = Teacher’s Lab Resource 88
Science and Engineering Practices
Constructing Explanations and Designing Solutions
Constructing explanations and designing solutions in 6–8 builds on K–5 experiences and progresses to include constructing explanations and
designing solutions supported by multiple sources of evidence consistent with scientific knowledge,
principles, and theories. • Construct a scientific explanation based on valid and reliable evidence obtained from sources
(including the students’ own experiments) and the assumption that theories and laws that describe
the natural world operate today as they did in the past and will continue to do so in the future.
Earth’s Structure SE/TE
8, Figure 3: From Sea to Mountain 65, Apply It! 94, Apply the Big Question
105, Apply It! 108, Figure 5: Tension and Normal Faults 109, Figure 6: The Kaibab Plateau 135, Figure 1: The Ring of Fire TE Only: 109F, Enrich – Evidence of
Movement Along Faults 137D, Review and Reinforce – Understanding Main Ideas TLR:
40, How Does the Rate of Cooling Affect Crystals?
85, Plate Interactions 137, How Do Volcanoes Change Land? STEMQuest: To Hike or Not to Hike Patterns in the Cascade Range Mount Rainier's Threat
Monitoring a Volcano Signs of Eruption? Earth’s Surface SE/TE 38-39, What Breaks Down Rock?
69, Apply It!
TLR: 40, Rusting Away 67-75, Sand Hills 79, How Do Glaciers Change the Land? 84, How Does Moving Air Affect
Sediment
Disciplinary Core Ideas
ESS2.A: Earth’s Materials and Systems • The planet’s systems interact over scales that range from microscopic to global in size, and they operate over fractions of a second to billions of years. These interactions have shaped Earth’s history and will determine its future.
Earth’s Structure SE/TE: 4-9, The Earth System 18-21, Convection and the Mantle
40-43, How Do Minerals Form? 47, Origin 47, Figure 2: Rock Origins 62-65, The Rock Cycle
76-79, Drifting Continents 80-85, Sea-Floor Spreading 86-91, The Theory of Plate
Tectonics 97, An Ocean Is Born 134-137, Volcanoes and Plate Tectonics TE Only: 7, Elaborate – Modeling the Earth
System 93, Enrich – Yellowstone’s 1988 Forest Fire 21E, Enrich – What’s Happening During Convection? 57F, Enrich – The Formation of
Coal
61E, Enrich – The Metamorphic Rocks 63, 21st Century Learning 65E, Enrich – Alternate Pathways 77, 21st Century Learning 79, Differentiated Instruction – L1 Continental Drift Flip Book
85, Differentiated Instruction – L1 Ocean Floor Drawing 85F, Enrich – The Birth of the Himalayas TLR: 9, What Is a System?
10, Parts of Earth’s System 17-25, Modeling Mantle
Convections Currents 51, What Causes Layers? 64, Which Rock Came First? 76-84, Modeling Sea-Floor Spreading
85, Plate Interactions 124, Moving Volcanoes 137, How Do Volcanoes Change Land?
Crosscutting Concepts
Scale, Proportion, and Quantity Time, space, and energy phenomena can be
observed at various scales using models to study systems that are too large or too small.
Earth’s Structure SE/TE: 106, Figure 1: Folded Rock TE Only: 89, Teacher Demo – Make a
Model of Plates 107, Teacher Demo – Modeling Synclines and Anticlines 149, Build Inquiry – Make Models
of Composite Volcanoes TLR: 11, What Forces Shape Earth?
63, Recycling Rocks 72, Moving the Continents 76-84, Modeling Sea-Floor Spreading 85, Plate Interactions 100, Modeling Faults
101, Modeling Stress 124, Moving Volcanoes 137, How Do Volcanoes Change Land? 139, How Can Volcanic Activity Change Earth’s Surface? STEMQuest: To Hike or Not to
Hike Patterns in the Cascade Range Mount Rainier's Threat Monitoring a Volcano Signs of Eruption? Earth’s Surface
SE/TE: 75, Figure 5: Oxbow Lakes TE Only: 45, Differentiated Instruction – L3 Use Maps 69, Teacher Demo – Modeling
Mass Movement 69, Differentiated Instruction –
Make Dioramas 89, Teacher Demo – Model Wave Refraction TLR: 55, Soil Conservation
67-75, Sand Hills 76, How Does Moving Water Wear Away Rock? 79, How Do Glaciers Change the Land?

A Correlation of Interactive Science Grades 6-8 Modules, ©2016 Digital Refreshment
to the Next Generation Science Standards for Middle School
SE = Student Edition; TE = Teacher’s Edition; TLR = Teacher’s Lab Resource 89
Chapter Activities and Projects 234–237, Plates Move!
Earth’s Surface SE/TE: 38–45, Rocks and Weathering 49, The Process of Soil Formation
51, Figure 4– From Rock to Soil 66-69, Mass Movement 71-79, Water Erosion 80-85, Glacial Erosion 86-89, Wave Erosion 90-93, Wind Erosion 114–115, How Can Rock Layers
Change? 124-127, Early Earth TE Only: 43, Teacher Demo – Chemical
Weathering 69E, Enrich – It’s Creepy! 77, Build Inquiry – Illustrate River
Environments 89D, Review and Reinforce – Understanding Main Ideas 89E, Enrich – My Beach Is Shrinking! 93E, Enrich – Kinds of Sand
Dunes TLR: 39, Freezing and Thawing 40, Rusting Away 52, The Contents of Soil 66, Weathering and Erosion 76, How Does Moving Water Wear
Away Rock? 77, Raindrops Falling 79, How Do Glaciers Change the Land? 81, Modeling Valleys 83, Shaping a Coastline 84, How Does Moving Air Affect
Sediment? 100, What’s In a Rock? 120, How Could Planet Earth Form in Space? Water and the Atmosphere
SE/TE: 52-53, How Do Waves Affect the
Shore? TE Only: 9F, Enrich – Evaporation, Precipitation, and Runoff 53, Build Inquiry
53E, Enrich – How Far From Shore Do Waves Break? 59E, Enrich – The Sargasso Sea 187, Differentiated Instruction – L1 Pangaea TLR: 122, Floods and Droughts
81, Modeling Valleys 83, Shaping a Coastline 84, How Does Moving Air Affect Sediment?

A Correlation of Interactive Science Grades 6-8 Modules, ©2016 Digital Refreshment
to the Next Generation Science Standards for Middle School
SE = Student Edition; TE = Teacher’s Edition; TLR = Teacher’s Lab Resource 90
ESS2.C: The Roles of Water in Earth’s Surface Processes • Water’s movements—both on the land and underground—cause weathering and erosion, which change the land’s surface features and create underground formations.
Earth’s Structure SE/TE:
52-53, How Do Sedimentary Rocks Form? TLR: 51, What Causes Layers STEMQuest: To Hike or Not to Hike
Patterns in the Cascade Range
Mount Rainier's Threat Monitoring a Volcano Signs of Eruption? Earth’s Surface SE/TE: 40-43, What Causes Weathering?
44-45, How Fast Does Weathering Occur? 52-55, Soil Conservation 66-67, What Processes Wear Down and Build Up Earth’s Surface?
70-79, Water Erosion
80-85, Glacial Erosion 86-89, Wave Erosion 98, Floodwater Fallout TE Only: 42, 21st Century Learning 43, Teacher Demo – Chemical
Weathering 55, 21st Century Learning 69E, Enrich – It’s Creepy! 71, Lead a Discussion 74, 21st Century Learning 75, Differentiated Instruction – L3 Locate River Features
76, Build Inquiry – Compare and Contrast Deltas 77, Differentiated Instruction – L1
Describe River Features 79, Address Misconceptions 89, Differentiated Instruction – L3
Investigate Beach Erosion 89E, Enrich – My Beach is Shrinking! TLR: 39, Freezing and Thawing 53, How Can You Keep Soil From
Washing Away? 55, Soil Conservation

A Correlation of Interactive Science Grades 6-8 Modules, ©2016 Digital Refreshment
to the Next Generation Science Standards for Middle School
SE = Student Edition; TE = Teacher’s Edition; TLR = Teacher’s Lab Resource 91
66, Weathering and Erosion 76, How Does Moving Water Wear Away Rocks? 77, Raindrops Falling
78, Erosion Cube 79, How Do Glaciers Change the Land? 81, Modeling Valleys 83, Shaping a Coastline Water and the Atmosphere
SE/TE: 8-9. What Is the Water Cycle? 18-23, Water Underground 52-53, How Do Waves Affect the
Shore? TE Only: 23E, Enrich – Evaporation,
Precipitation, and Runoff 53, Build Inquiry – Model Barrier Beaches 53E, Enrich – How Far From Shore Do Waves Break?

A Correlation of Interactive Science Grades 6-8 Modules, ©2016 Digital Refreshment
to the Next Generation Science Standards for Middle School
SE = Student Edition; TE = Teacher’s Edition; TLR = Teacher’s Lab Resource 92
MS.History of Earth MS-ESS2-3 Students who demonstrate understanding can: Analyze and interpret data on the distribution of fossils and rocks, continental shapes, and seafloor
structures to provide evidence of the past plate motions. [Clarification Statement: Examples of data include similarities
of rock and fossil types on different continents, the shapes of the continents (including continental shelves), and the locations of ocean structures (such as ridges, fracture zones, and trenches).] [Assessment Boundary: Paleomagnetic anomalies in oceanic and continental crust are not
assessed.]
INTERACTIVE SCIENCE: In the Earth’s Structure module, the online Performance Expectation Activity “History of Earth (MS-ESS2-3)” addresses this performance expectation.
The theory of plate tectonics is explored in Chapter 3, Lesson 1 of the Earth’s Structure module. The chapter opens with Alfred Wegener’s ideas on continental drift and presents the evidence for his hypothesis based on fossils, land features, and climate on SE/TE pages 77-79. Students obtain
information about seafloor structures that evidence plate motions on SE/TE 81-85. Plate motions are presented in Lesson 3 on SE/TE pages 86-91.
Students interpret maps to indicate how the shapes of continents fit together in “Figure 1: Piecing It All Together” on SE/TE page 77. Students analyze and interpret data for continental drift, including distribution of fossils and rocks, on SE/TE pages 78 and 79. On TE page 79, students use knowledge available in the 1900s to debate the theory of continental drift. In Elaborate, TE page 78, students make models of continents and recreate the drift. On SE/TE page 79, Differentiated Instruction, students create models of the continents motion through a flip book. On TE page 79, students interpret locations where fossils of Mesosaurus have been
found to support the theory of continental drift. Students research a major change in Earth’s surface caused by plate movement in “An Ocean Is Born” on SE/TE page 97.
The performance expectation above was developed using the following elements from the NRC document A Framework for K-12 Science Education:
Science and Engineering Practices
Analyzing and Interpreting Data Analyzing data in 6–8 builds on K–5 and
progresses to extending quantitative analysis to investigations, distinguishing between correlation and causation, and basic statistical techniques of
data and error analysis. • Analyze and interpret data to provide evidence
for phenomena.
Earth’s Structure SE/TE:
78, Figure 2: Pangaea and Continental Drift 79, Apply It! 122–123, Figure 3: Earthquakes Around the World
135, Figure 1: The Ring of Fire TE Only:
79, Differentiated Instruction – Debate Continental Drift 83, Differentiated Instruction – Cause and Effect Table 91E, Enrich – Magnetic Reversals Through the Ages
123E, Enrich – Earthquake Probability
Disciplinary Core Ideas
ESS1.C: The History of Planet Earth • Tectonic processes continually generate new ocean sea floor at ridges and destroy old sea floor at trenches. (secondary to MS-ESS2-3)
Earth’s Structure SE/TE: 80-85, Sea-Floor Spreading 82-83, Figure 2: Sea-Floor Spreading
84, Figure 3: Subduction 86-91 What is the Theory of Plate Tectonics? 87, Figure 1: Earth’s Plates 88, Figure 2: Plate Motion
89, Figure 3: Breaking Up Is Hard
to Do 90, Figure 4: The Andes 90-91, Figure 6: Earth’s Changing Crust 91, Figure 5: Fault Line 97, An Ocean Is Born 134-137, Where Are Volcanoes
Found on Earth’s Surface? 135, Figure 1: The Ring of Fire 136, Figure 2: Volcanoes and Converging Boundaries
Crosscutting Concepts
Patterns Patterns in rates of change and other
numerical relationships can provide information about natural systems.
Earth’s Structure
SE/TE: 88, Plate Motions Over Time 88, Figure 2: Plate Motion 89, Do the Math! 121, Apply It! 122-123, Figure 3: Earthquakes and Plate Tectonics
144, Figure 5: Cascade Volcanoes TE Only:
83, Build Inquiry – Infer 85F, Enrich – The Birth of the Himalayas 91E, Enrich – Magnetic Reversals
Through the Ages 123E, Enrich – Earthquake Probability

A Correlation of Interactive Science Grades 6-8 Modules, ©2016 Digital Refreshment
to the Next Generation Science Standards for Middle School
SE = Student Edition; TE = Teacher’s Edition; TLR = Teacher’s Lab Resource 93
----------------------------------- Connections to Nature of Science
Scientific Knowledge is Open to Revision in Light of New Evidence
• Science findings are frequently revised and/or reinterpreted based on new evidence.
Earth’s Structure
SE/TE: 79, Wegener’s Hypothesis Rejected 135, Figure 2: The Ring of Fire 157, An Explosive Secret TE Only: 76A, Content Refresher
77, Support the Big Question
77, 21st Century Learning TLR: 72, Moving the Continents
TE Only: 84, Make Analogies – Ocean Conveyor Belt 85, Differentiated Instruction –
Ocean Floor Drawing 85E, Understanding Main Ideas 89, Differentiated Instruction – L3 Rift Valleys TLR: 74, Mid-Ocean Ridges 76-84, Modeling Sea-Floor
Spreading 85, Plate Interactions 125, Where Are Volcanoes Found on Earth’s Surface?
ESS2.B: Plate Tectonics and Large-Scale System Interactions • Maps of ancient land and water patterns, based on investigations of rocks and fossils, make clear how Earth’s plates have moved great distances,
collided, and spread apart.
Earth’s Structure
SE/TE: 78, Figure 2: Pangaea and Continental Drift 88, Figure 2: Plate Motion TE Only: 77, ELL Support: Comprehensible Input
85F, Enrich – The Birth of the Himalayas 91, Differentiated Instruction – L3 Create a Timeline

A Correlation of Interactive Science Grades 6-8 Modules, ©2016 Digital Refreshment
to the Next Generation Science Standards for Middle School
SE = Student Edition; TE = Teacher’s Edition; TLR = Teacher’s Lab Resource 94
MS.Earth’s Systems MS-ESS2-1 Students who demonstrate understanding can: Develop a model to describe the cycling of Earth’s materials and the flow of energy that drives this
process. [Clarification Statement: Emphasis is on the processes of melting, crystallization, weathering, deformation, and sedimentation, which
act together to form minerals and rocks through the cycling of Earth’s materials.] [Assessment Boundary: Assessment does not include the identification and naming of minerals.]
INTERACTIVE SCIENCE: In the Earth’s Structure module, the online Performance Expectation Activity “Earth Systems (MS-ESS2-1)” addresses this performance expectation. An overview of how Earth’s materials cycle through the Earth system is given in the Earth’s
Structure module, Chapter 1, Lesson 1, SE/TE page 5. The role constructive and destructive forces play in cycling Earth’s materials by creating and destroying Earth’s surface is presented on SE/TE pages 8-9. Information on the chemical and physical processes (including crystallization) that form
minerals is given in the section “How Do Minerals Form?” in Chapter 2, Lesson 1 on SE/TE pages 40-42. An overview of how igneous, sedimentary, and metamorphic rocks form is given in the “Origin” section of Chapter 2, Lesson 2 on SE/TE page 47. Students learn further information about igneous rocks, on SE/TE pages 48-50. Sedimentary rocks, including the roles weathering
and sedimentation play in their formation, are discussed on SE/TE pages 52-56. Metamorphic rocks and their formation via deformation are presented on SE/TE pages 58-60. A discussion of the processes of the rock cycle, including melting, weathering, erosion, deposition, and metamorphism, is included in Chapter 2, Lesson 6 “The Rock Cycle” on SE/TE pages 62-65 A discussion of the cycling of materials as the result of weathering of rocks is included in Chapter 2, Lesson 1 “Rocks and Weathering” of the Earth’s Surface module, on SE/TE pages 38-45. Erosion
and deposition are further discussed in Chapter 3, Lesson 1 (Mass Movement), Lesson 2 (Water Erosion), Lesson 3 (Glacial Erosion), Lesson 4, (Wave Erosion), and Lesson 5 (Wind Erosion), on SE/TE pages 62-93.
The flow of heat energy inside Earth is discussed in the Earth’s Structure module, Lesson 3, “Convection and the Mantle.” On SE/TE pages 20-21, students learn how heating and cooling of a
fluid, changes in the fluid’s density, and the force of gravity combine to set convection currents in motion, driving the movement of Earth’s plates. This concept is further explained in “Support the Big Question” on TE page 20. Students interpret diagrams to explain how convection in Earth’s mantle might drive motion in Earth’s crust in “Enrich – What’s Happening During Convection?” on TE page 21E. Structures and processes driven by this flow of energy, including the formation of mid-ocean ridges, sea-floor spreading, subduction, and the formation of deep-ocean trenches, are explored in Chapter 3, Lesson 2 “Sea-Floor Spreading” on SE/TE pages 80-85. Students make and
develop a model of the flow of heat energy within Earth’s mantle in “Modeling Mantle Convection Currents” on TLR pages 17-24. Students make a model showing how the rock cycle can break rock into sediment that later can cycle back to form new rock in “Recycling Rocks” on page 63 of the Earth’s Structure TLR. Students make and develop a model describing sea-floor spreading and explore how sea-floor spreading and subduction work together in a cycle that creates and destroys rock in “Modeling Sea-Floor Spreading” on TLR pages 76-84.
The performance expectation above was developed using the following elements from the NRC document A Framework for K-12 Science Education:
Science and Engineering Practices
Developing and Using Models Modeling in 6–8 builds on K–5 experiences and
progresses to developing, using, and revising models to describe, test, and predict more
abstract phenomena and design systems. Develop and use a model to describe
phenomena.
Disciplinary Core Ideas
ESS2.A: Earth’s Materials and Systems • All Earth processes are the result of energy flowing and matter cycling within and among the planet’s systems. This energy is derived from the
sun and Earth’s hot interior. The energy that flows and matter that cycles produce chemical
and physical changes in Earth’s materials and living organisms.
Crosscutting Concepts
Stability and Change Explanations of stability and change in natural
or designed systems can be constructed by examining the changes over time and processes
at different scales, including the atomic scale.

A Correlation of Interactive Science Grades 6-8 Modules, ©2016 Digital Refreshment
to the Next Generation Science Standards for Middle School
SE = Student Edition; TE = Teacher’s Edition; TLR = Teacher’s Lab Resource 95
Earth’s Structure SE/TE: 20, Convection Currents 212, Figure 3 – Mantle Convection
64, Figure 2 – The Rock Cycle 65, Apply It! TE Only: 21, Differentiated Instruction – L1 Model Convection Currents 57, Differentiated Instruction – Model Rock Formation
61E, Enrich – The Metamorphic Rocks 64, Teacher to Teacher – Describe the Rock Cycle
65, Differentiated Instruction – L3 Make Sequence Drawings 83, Build Inquiry – Model of the
Ocean Floor TLR: 11, What Forces Shape Earth? 17, Modeling Mantle Convection Currents 40, How Does the Rate of Cooling
Affect Crystals? 46, Liquid to Solid 50, How Does Pressure Affect Particles of Rock? 63, Recycling Rocks 76-84, Modeling Sea-Floor Spreading
101, Modeling Stress Earth’s Surface SE/TE: 67, Relate Text and Visuals 72, Figure 2 – Stream Formation 75, Figure 5 – Oxbow Lakes
77, Figure 7 – Rolling Through the Hills 82, Apply It! 83, Figure 2 – Glacial Erosion 84, Figure 3 – Glacial Landforms 87, Figure 1 – Wave Erosion
88, Figure 2 – The Changing Coast
TE Only: 43, Differentiated Instruction – Model Surface Area 69, Teacher Demo – Modeling Mass Movement
85, Differentiated Instruction – Model Glacial Landforms 89, Teacher Demo – Model Wave Refraction 93E, Enrich – Kinds of Sand Dunes
Earth’s Structure SE/TE 4-9, The Earth System 18-21, Convection and the Mantle
40-42, How Do Minerals Form? 47, Origin 47, Figure 2: Rock Origins 48-50, How Do Geologists Classify Igneous Rocks? 49, Figure 1: Igneous Rock Origins and Textures
52-53, How Do Sedimentary Rocks Form? 53, Figure 1: How Sedimentary Rock Forms
54-56, What Are the Three Major Types of Sedimentary Rocks? 58-60, What Are Metamorphic
Rocks 62-65, What Is the Rock Cycle? 63, Figure 1: Stone Mountain 64, Figure 2: Be a Rock Star! 80-85, Sea-Floor Spreading 83, Figure 2: Sea-Floor Spreading
84, Figure 3: Subduction 84, Apply it! TE Only: 21E. Enrich – Convection and the Mantle 51E, Enrich – The Same, But Different
57F, Enrich – The Formation of Coal 61, Teacher Demo – Model Foliated Rock 61E, Enrich – The Metamorphic Rocks 65E, Enrich – Alternate Pathways
83, Build Inquiry – Model of the Ocean Floor TLR: 11, What Forces Shape Earth? 17, Modeling Mantle Convection Currents
40, How Does the Rate of Cooling Affect Crystals?
44, How Do Rocks Compare? 45, Classify These Rocks 46, Liquid to Solid 47, How Do Igneous Rock Form? 49, Acid Test for Rocks
50, How Does Pressure Affect Particles of Rock? 51, What Causes Layers 62, How Do Grain Patterns Compare? 63, Recycling Rocks 64, Which Rock Came First?
Earth’s Structure SE/TE: 4-9, The Earth System 5, Figure 1: All Systems Go!
65, The Rock Cycle and Plate Tectonics TE Only: 61E, Enrich – The Metamorphic Rocks TLR: 17-24, Modeling Mantle
Convection Currents 51, What Causes Layers? 61, A Sequined Rock
Earth’s Surface SE/TE: 68-69, What Are the Different
Types of Mass Movement? 68, Figure 1: Mass Movement 69, Apply It! TE Only: 69, Teacher Demo – Modeling Mass Movement
89, Teacher Demo – Model Wave Refraction 89E, Enrich – My Beach Is Shrinking! TLR: 65, How Does Gravity Affect Materials on a Slope?
67-74, Sand Hills 83, Shaping a Coastline Ecology and the Environment SE/TE: 29, Figure 1 – Primary Succession 30, Apply It!
TLR: 42, Observing Decomposition 55, Playing Nitrogen Cycle Roles

A Correlation of Interactive Science Grades 6-8 Modules, ©2016 Digital Refreshment
to the Next Generation Science Standards for Middle School
SE = Student Edition; TE = Teacher’s Edition; TLR = Teacher’s Lab Resource 96
TLR: 76, How Does Moving Water Wear Away Rocks? 79, How Do Glaciers Change the
Land? 81, Modeling Valleys 84, How Does Moving Air Affect Sediment? 85, Desert Pavement
66, Weathering and Erosion 74, Mid-Ocean Ridges 76, Modeling Sea-Floor Spreading
Earth’s Surface SE/TE: 38, Rocks and Weathering 42, Figure 3 – Weathering and Surface Area 46–51, How Soil Forms 51, Figure 4: From Rock to Soil
66-69, Mass Movement 70-79, Water Erosion 73, Figure 3: River Erosion 76, Figure 6: Deposits by Rivers
78, Figure 8: Groundwater Erosion and Deposition 80-85, Glacial Erosion
82, Apply It! 86-89, Wave Erosion 87, Figure 1 – Wave Erosion 88-89, Figure 2 – The Changing Coast 89, Apply It!
90-93, Wind Erosion TE Only: 41, Teacher Demo – Mechanical Weathering 43, Teacher Demo – Chemical Weathering 69E, Enrich – It’s Creepy
and Distributary Channels 79, Differentiated Instruction – L1 Compare and Contrast Table 87, Make Analogies – Wave Abrasion 89, Teacher Demo – Model Wave Refraction
89E, Enrich – My Beach Is Shrinking 93E, Enrich – Kinds of Sand Dunes TLR: 39, Freezing and Thawing
41, It’s All on the Surface 42, What Is Soil?
52, The Contents of Soil 66, Weathering and Erosion 76, How Does Moving Water Wear Away Rocks? 79, How Do Glaciers Change the
Land? 81, Modeling Valleys 83, Shaping a Coastline 84, How Does Moving Air Affect Sediment? 85, Desert Pavement

A Correlation of Interactive Science Grades 6-8 Modules, ©2016 Digital Refreshment
to the Next Generation Science Standards for Middle School
SE = Student Edition; TE = Teacher’s Edition; TLR = Teacher’s Lab Resource 97
Ecology and the Environment SE/TE: 29, Primary Succession 30–31, Secondary Succession
42–49, Energy Flow in Ecosystems 46, Figure 3 – Food Chain 47, Figure 4 – Food Web 48, Figure 5 – Energy Pyramid 50–51, What Processes Are Involved in the Water Cycle?
52–53, How Are the Carbon Cycle and Oxygen Cycle Related? 53, Figure 2 – Carbon and Oxygen Cycles
54–55, How Does Nitrogen Cycle Through Ecosystems? Figure 4, Nitrogen Cycle
56–57, Figure 5 – Cycles of Matter 130, Figure 2: Structure of Fertile Soil TE Only: 45, Differentiated Instruction – L1
Concept Map 49E, Enrich – Energy Flow in Ecosystems 53, Differentiated Instruction – L3 Research Effects of Carbon Dioxide in the Atmosphere TLR:
42, Observing Decomposition 53, Following Water 55, Playing Nitrogen Cycle Roles

A Correlation of Interactive Science Grades 6-8 Modules, ©2016 Digital Refreshment
to the Next Generation Science Standards for Middle School
SE = Student Edition; TE = Teacher’s Edition; TLR = Teacher’s Lab Resource 98
MS.Earth’s Systems MS-ESS2-4 Students who demonstrate understanding can: Develop a model to describe the cycling of water through Earth’s systems by energy from the sun
and the force of gravity. [Clarification Statement: Emphasis is on the ways water changes its state as it moves through the multiple
pathways of the hydrologic cycle. Examples of models can be conceptual or physical.] [Assessment Boundary: A quantitative understanding of the latent heats of vaporization and fusion is not assessed.]
INTERACTIVE SCIENCE: In the Water and Atmosphere module, the online Performance Expectation Activity “Earth’s Systems (MS-ESS2-4)” addresses this performance expectation.
The water cycle is presented in the Water and the Atmosphere module in Chapter 1, Lesson 1, “Water on Earth” on SE/TE pages 8-9. Students learn how the sun’s energy is the driving force for
the water cycle in Chapter 4, Lesson 1, “Water in the Atmosphere” on SE/TE pages 118-119. They obtain knowledge about how water changes state during the process that forms clouds in Chapter
4, Lesson 2 “Clouds” on SE/TE pages 122-125. They learn how water changes state during the formation of rain, freezing rain, snow, hail, and sleet in Chapter 4, Lesson 3 “Precipitation” on SE/TE pages 126-129.
Students model the water cycle by completing a diagram in “Figure 3 – The Water Cycle” on SE/TE pages 8-9. In the Differentiated Instruction activity, TE page 9, students describe the roles gravity
and the sun’s energy play in the water cycle. In the RTI activity, TE page 9, students model the water cycle pathway by drawing a diagram. Students model the water cycle by drawing a cycle diagram in “Figure 6 – An Endless Cycle” on SE/TE page 17. On SE/TE page 119, students label the water cycle pathway in Figure 1, Summarize. They interpret diagrams to model how clouds form in “Figure 1 – How Clouds Form” on SE/TE page 123. They review how cold the air temperature needs to be in order for specific types of precipitation to fall in “Figure 3 – Freezing and Precipitation” on SE/TE page 128. They investigate the distribution of water on Earth on TLR page
14. They investigate the role of trees in the water cycle in “Water From Trees” on TLR, pages 15-23. Students model evaporation of liquid water by heat energy in “Where Did the Water Go?” on TLR page 114. They observe how water vapor changes into liquid water in “Water in the Air” on
TLR page 115. Students model the formation of a cloud in “How Clouds Form” on TLR page 118. They model the formation of hail in “How Can You Make Hail?” on TLR page 120. They observe how liquid water crystallizes into ice on TLR page 120. They model the water cycle in “Following Water” on page 53 of the TLR Ecology and the Environment.
The performance expectation above was developed using the following elements from the NRC document A Framework for K-12 Science Education:
Science and Engineering Practices
Developing and Using Models Modeling in 6–8 builds on K–5 experiences and progresses to developing, using, and revising
models to describe, test, and predict more abstract phenomena and design systems.
• Develop a model to describe unobservable mechanisms.
Water and the Atmosphere SE/TE: 8-9, Figure 3: The Water Cycle 17, Figure 6: An Endless Cycle 119, Figure 1: The Water Cycle 123, How Clouds Form
TLR: 12, Where Does the Water Come From? 15, Water From Trees
114, Where Did the Water Go?
Disciplinary Core Ideas
ESS2.C: The Roles of Water in Earth’s Surface Processes • Water continually cycles among land, ocean, and atmosphere via transpiration, evaporation,
condensation and crystallization, and precipitation, as well as downhill flows on land.
Water and the Atmosphere
SE/TE: 8-9, What Is the Water Cycle? 8-9, Figure 3: The Water Cycle 17, Figure 6: An Endless Cycle 118-119, How Does Water Move Through the Atmosphere?
119, Figure 1: The Water Cycle 122-125, Clouds 123, Figure 3: How Clouds Form 126-131, Precipitation 128-129, Figure 3: Freezing Precipitation
Crosscutting Concepts
Energy and Matter Within a natural or designed system, the
transfer of energy drives the motion and/or cycling of matter
Water and the Atmosphere SE/TE: 8–9, What Is the Water Cycle?
118–199, How Does Water Move
Through the Atmosphere? TE Only: 9, Differentiated Instruction

A Correlation of Interactive Science Grades 6-8 Modules, ©2016 Digital Refreshment
to the Next Generation Science Standards for Middle School
SE = Student Edition; TE = Teacher’s Edition; TLR = Teacher’s Lab Resource 99
115, Water in the Air 120, How Can You Make Hail? Ecology and the Environment
TLR: 53, Following Water
TE Only: 9, Differentiated Instruction 9, RTI 93, Enrich – Understanding Main
Ideas 9F, Enrich – Evaporation, Precipitation, and Runoff 131E, Enrich – Snow Crystals TLR: 12, Where Does the Water Come From?
15-22, Water From Trees 114, Where Did the Water Go? 115, Water in the Air 120, How Can You Make Hail?
ESS2.C: The Roles of Water in Earth’s Surface Processes • Global movements of water and its changes in form are propelled by sunlight and gravity.
Water and the Atmosphere 8-9, What Is the Water Cycle? 8-9, Figure 3: The Water Cycle 54-59, Currents and Climate
118-119, How Does Water Move Through the Atmosphere? 119, Figure 1: The Water Cycle 122-125, Clouds 123, Figure 3: How Clouds Form 126-131, Precipitation
128-129, Figure 3: Freezing Precipitation TE Only: 9, Differentiated Instruction 9, RTI 57, Differentiated Instruction 93, Enrich – Understanding Main
Ideas 9F, Enrich – Evaporation, Precipitation, and Runoff 59E, Enrich – The Sargasso Sea 131E, Enrich – Snow Crystals TLR: 15-22, Water From Trees
49-57, Modeling Ocean Currents
58, Deep Currents 114, Where Did the Water Go? 115, Water in the Air 120, How Can You Make Hail?

A Correlation of Interactive Science Grades 6-8 Modules, ©2016 Digital Refreshment
to the Next Generation Science Standards for Middle School
SE = Student Edition; TE = Teacher’s Edition; TLR = Teacher’s Lab Resource 100
MS.Earth’s Systems MS-ESS3-1 Students who demonstrate understanding can: Construct a scientific explanation based on evidence for how the uneven distributions of Earth’s
mineral, energy, and groundwater resources are the result of past and current geoscience processes. [Clarification Statement: Emphasis is on how these resources are limited and typically non-renewable, and how their distributions are significantly changing as a result of removal by humans. Examples of uneven distributions of resources as a result of past processes include but are not limited
to petroleum (locations of the burial of organic marine sediments and subsequent geologic traps), metal ores (locations of past volcanic and hydrothermal activity associated with subduction zones), and soil (locations of active weathering and/or deposition of rock).]
INTERACTIVE SCIENCE: In the Earth’s Surface module, the online Performance Expectation Activity “Earth Systems (MS-ESS3-1)” addresses this performance expectation. The various processes that lead to the formation and distribution of minerals are described in the Earth’s Structure module, Chapter 2, Lesson 1, “Properties of Minerals,” on SE/TE pages 40-43.
Students construct a scientific explanation for the process by which minerals form in geodes in
“Figure 10: Geodes” on SE/TE page 40. Students can discuss the types of minerals that form in Death Valley in “Differentiated Instruction: Death Valley Minerals” on TE page 41. Students research the distribution of evaporative mineral deposits in the United States in “Differentiated Instruction: Mineral Map” on TE page 41. A world map showing the distribution of mineral resources appears on SE/TE page 43. Students match minerals to the variety of geologic processes responsible for their formation on SE/TE page 42. Students model the effects of mining on landscapes in “How Does Mining Affect the Land?” in the Ecology and the Environment TLR on page
107. Students analyze costs of mining ores in “Enrich: The Copper Basin” on TE page 133E. Students learn about the distribution of methane hydrates, their possible importance as a new energy resource, and the geoscience processes by which they are formed in the Lead a Discussion activity on TE page 164 in the Ecology and the Environment module. The formation of traditional energy resources, including coal, oil, and natural gas, is described in Chapter 5, Lesson 1 “Fossil Fuels” on SE/TE pages 178-184. The uneven distribution of fossil fuels is described on SE/TE page
185. The reason fossil fuels are considered nonrenewable is described on SE/TE page 185. The
formation of coal is also described in the Earth’s Surface module, Chapter 4, Lesson 6, “Eras of Earth’s History.” In this module, 21st Century Learning, SE/TE page 131, students locate the coal deposits in North America that formed during the Carboniferous. Soil resources are described in the Earth’s Surface module in “The Process of Soil Formation” on
SE/TE page 49. Students construct a scientific explanation for the distribution of soil resources in “Figure 2: Soil Layers” on SE/TE page 49. The relationship between volcanic activity and soil fertility is described in the “Apply It!” activity in the Earth’s Structure module on SE/TE page 149. The distribution of soil as a function of climate is described in “Enrich – Different Soils for Different Climates” on TE page 51E. Soil damage, loss, and conservation as a result of human impacts is discussed in Chapter 2, Lesson 4 “Soil Conservation” on SE/TE page 52-55.
The distribution of water on Earth is described in the Water and the Atmosphere module, SE/TE pages 6-7 “Where Is Water Found?” Students construct a scientific explanation for the distribution of water into zones in “Figure 2: Groundwater Formation” on SE/TE page 20. A
discussion of the distribution of water into aquifers is provided SE/TE pages 21–23. Students interpret data related to how humans use water in “Do the Math!” on SE/TE page 21. Students draw on a diagram to indicate where they would put a regular well and an artesian well in order to obtain fresh water in “Figure 3 – Springs and Wells” on SE/TE pages 22-23. The ways in which
humans are affecting water resources, including water shortages and water pollution, is discussed in the Ecology and the Environment module in Chapter 4, Lesson 4 “Water Pollution and Solution” on SE/TE pages 152-159. A discussion of renewable versus nonrenewable resources and the impact of humans on these resources can be found in the Ecology and the Environment module, Chapter 3, Lesson 1
“Introduction to Natural Resources” on SE/TE pages 92-97.

A Correlation of Interactive Science Grades 6-8 Modules, ©2016 Digital Refreshment
to the Next Generation Science Standards for Middle School
SE = Student Edition; TE = Teacher’s Edition; TLR = Teacher’s Lab Resource 101
The performance expectation above was developed using the following elements from the NRC document A Framework for K-12 Science Education:
Science and Engineering Practices
Constructing Explanations and Designing Solutions Constructing explanations and designing solutions
in 6–8 builds on K–5 experiences and progresses to include constructing explanations and designing solutions supported by multiple sources
of evidence consistent with scientific ideas, principles, and theories.
Construct a scientific explanation based on valid and reliable evidence obtained from sources
(including the students’ own experiments) and the assumption that theories and laws that describe
the natural world operate today as they did in the past and will continue to do so in the future.
Earth’s Structure SE/TE: 40, How Do Minerals Form? 40, Figure 10: Geodes TE Only:
57F, Enrich – The Formation of Coal 65E, Enrich – Alternate Pathways Water and the Atmosphere TE Only: 9F, Enrich – Evaporation,
Precipitation, and Runoff Ecology and the Environment
SE/TE: 181, Figure 3: Coal Formation 182, Figure 4: Oil Formation
Disciplinary Core Ideas
ESS3.A: Natural Resources • Humans depend on Earth’s land, ocean, atmosphere, and biosphere for many different
resources. Minerals, fresh water, and biosphere resources are limited, and many are not renewable or replaceable over human lifetimes.
These resources are distributed unevenly around the planet as a result of past geologic processes.
Earth’s Structure SE/TE: 40 Figure 10: Geodes 43, Where Mineral Resources Are
Found
43, Figure 13: Ores 51, How Are Igneous Rocks Used? 51, Figure 2: Building Blocks 57, How Are Sedimentary Rocks Used?
57, Figure 4: Building With Limestone 61, How Metamorphic Rocks Are Used 61, Apply It! 70, Struggling to Survive 149, Apply It!
TE Only: 41, Differentiated Instruction: L1 Death Valley Minerals
41, Differentiated Instruction: L3 Mineral Map 43, Differentiated Instruction: L3 Debate
57F, Enrich – The Formation of Coal 65E, Enrich – Alternate Pathways TLR: 48, The Rocks Around Us 52-60, Testing Rock Flooring
Earth’s Surface SE/TE: 34–55, Weathering and Soil 131, The Carboniferous Period
TE Only: 55, Differentiated Instruction: L3
Soil Fertility 55E, Enrich – Does Contour Plowing Work? TLR: 43-51, Investigating Soils and Drainage 54, Using it Up
55, Soil Conservation
Crosscutting Concepts
Cause and Effect
• Cause and effect relationships may be used to predict phenomena in natural or designed
systems.
Earth’s Structure SE/TE:
40, Figure 10: Geodes 40-43, How Do Minerals Form? 4, Figure 12: Where Minerals Form 55, Organic Rocks 55, Figure 3: Organic Rocks
TLR: 51, What Causes Layers? Earth’s Surface SE/TE: 49, The Process of Soil Formation 51, Figure 4: From Rock to Soil
55, How Can Soil Be Conserved? TE Only: 55E, Enrich – Does Contour Plowing Work? TLR: 53, How Can You Keep Soil From Washing Away?
54, Using It Up
55, Soil Conservation Water and the Atmosphere SE/TE: 23, Relate Cause and Effect
TLR: 30, An Artesian Well
Ecology and the Environment SE/TE:
29, Figure 1 – Primary Succession 30, Apply It! 156, Figure 3: Wastewater Treatment
-------------------------------------------
Connections to Engineering, Technology, and Applications of
Science Influence of Science, Engineering, and Technology on Society and the Natural World • All human activity draws on natural resources
and has both short and long-term consequences, positive as well as negative, for the health of people and the natural environment.

A Correlation of Interactive Science Grades 6-8 Modules, ©2016 Digital Refreshment
to the Next Generation Science Standards for Middle School
SE = Student Edition; TE = Teacher’s Edition; TLR = Teacher’s Lab Resource 102
Water and the Atmosphere SE/TE: 5, Why is Water Important? 6-7, Where Is Water Found?
18-23, Water Underground 201, Bacterial Rainmakers TE Only: 7, Differentiated Instruction: L3 Your Community’s Water Source 21, Differentiated Instruction: L3 Groundwater Contaminants
23E, Enrich – Water Underground TLR: 13, Water, Water, Everywhere 24, Mapping Surface Waters
30, An Artesian Well Ecology and the Environment
SE/TE: 92–97, Introduction to Natural Resources 128–133, Conserving Land and Soil 152–159, Water Pollution and
Solutions 160–167, Ocean Resources 162, Figure 1: Ocean Resources 178–185, Fossil Fuels 196–201, Energy Use and Conservation TE Only:
164, Lead a Discussion – Future Energy Source 164, Lead a Discussion – Nutrients for Algae 165, Differentiated Instruction – L1 Explaining Upwelling TLR:
75, Using Resources 76, Natural Resources 107, How Does Mining Affect the Land? 109, Modeling Soil Conservation 126, How Does the Water
Change? 127, Where’s the Water?
128, Cleaning Up Oil Spills 129, Getting Clean 140, What’s In a Piece of Coal? 142, Fossil Fuels 155, Human Energy Use
Earth’s Structure SE/TE: 51, How Are Igneous Rocks Used? 56, Apply It!
57, How Are Sedimentary Rocks Used? 61, How Metamorphic Rocks are Used 70, Struggling to Survive 149, Apply It! TE Only:
43, Differentiated Instruction – L3 Debate 57F, Enrich – The Formation of Coal
TLR: 52–60, Testing Rock Flooring
Earth’s Surface SE/TE: 52-55, Soil Conservation TLR: 55, Soil Conservation
Water and the Atmosphere SE/TE: 21, How Do People Use Groundwater? 21, Do the Math! TE Only: 21, Differentiated Instruction – LE
Groundwater Contaminants Ecology and the Environment SE/TE: 128–133, Conserving Land and Soil 129, Figure 1: Land Use
131, Figure 3: Terracing 133, Figure 4: Land Reclamation 136, Figure 1: Sanitary Landfill Design 152–159, Water Pollution and Solutions
172, Old MacDonald Had a Satellite
TE Only: 131, Differentiated Instruction – L3 Researching Organic Fertilizers 133E, Enrich – The Copper Basin 155, Differentiated Instruction –
L3 Thermal Pollution 159F, Enrich – Sewage Treatment

A Correlation of Interactive Science Grades 6-8 Modules, ©2016 Digital Refreshment
to the Next Generation Science Standards for Middle School
SE = Student Edition; TE = Teacher’s Edition; TLR = Teacher’s Lab Resource 103
MS.Weather and Climate MS-ESS2-5 Students who demonstrate understanding can: Collect data to provide evidence for how the motions and complex interactions of air masses results
in changes in weather conditions. [Clarification Statement: Emphasis is on how air masses flow from regions of high pressure to low
pressure, causing weather (defined by temperature, pressure, humidity, precipitation, and wind) at a fixed location to change over time, and how sudden changes in weather can result when different air masses collide. Emphasis is on how weather can be predicted within probabilistic ranges.
Examples of data can be provided to students (such as weather maps, diagrams, and visualizations) or obtained through laboratory experiments (such as with condensation).] [Assessment Boundary: Assessment does not include recalling the names of cloud types or weather symbols used on weather maps or the reported diagrams from weather stations.]
INTERACTIVE SCIENCE: In the Water and Atmosphere module, the online Performance Expectation Activity “Weather and Climate (MS-ESS2-5)” addresses this performance expectation.
The four major types of air masses that influence weather in North America are described in the Water and the Atmosphere module, Chapter 4, Lesson 4 “Air Masses” on SE/TE pages 132–135.
Movement of air masses is discussed in “How Air Masses Move” on SE/TE page 135. Changes in weather caused by colliding air masses are described in “What Are the Main Types of Fronts?” on SE/TE pages 136-137 and in “What Weather Do Cyclones and Anticyclones Bring?” on SE/TE pages
138-139. A discussion of the complex interactions that produce various types of storms is provided in Chapter 4, Lesson 5 “Storms” on SE/TE pages 140-147. Forecasting weather is discussed in Chapter 4, Lesson 6, “Predicting the Weather” on SE/TE pages 150–155. Students collect data to provide evidence for the interactions of air masses in “Weather Fronts” on TLR page 125. They collect data on complex interactions of air masses on TLR page 126.
The performance expectation above was developed using the following elements from the NRC document A Framework for K-12 Science Education:
Science and Engineering Practices
Planning and Carrying Out Investigations Planning and carrying out investigations in 6-8
builds on K-5 experiences and progresses to include investigations that use multiple variables and provide evidence to support explanations or
solutions. Collect data to produce data to serve as the
basis for evidence to answer scientific questions or test design solutions under a range of
conditions.
Water and the Atmosphere
TLR: 49-57, Modeling Ocean Currents 58, Deep Currents 115, Water in the Air 116, Measuring to Find the Dew Point
118, How Clouds Form
123, How Do Fluids of Different Densities Move? 125, Weather Fronts 126, Cyclones and Anticyclones 128, Where Do Hurricanes Come From?
130, Predicting Weather
Disciplinary Core Ideas
ESS2.C: The Roles of Water in Earth’s Surface Processes The complex patterns of the changes and the
movement of water in the atmosphere, determined by winds, landforms, and ocean
temperatures and currents, are major determinants of local weather patterns.
Water and the Atmosphere SE/TE: 54-59, Currents and Climate 100–107, Winds 118–121, Water in the
Atmosphere 122–125, Clouds 126–131, Precipitation 132–139, Air Masses 140–147, Storms 150–155, Predicting the Weather
170, Distance From Large Bodies
of Water 171, Ocean Currents 172-173, What Factors Affect Precipitation? TE Only: 103, Differentiated Instruction –
L1 Compare and Contrast Local Winds 128, Differentiated Instruction – L3 Create a Weather Display
Crosscutting Concepts
Cause and Effect Cause and effect relationships may be used to predict phenomena in natural or designed
systems.
Water and the Atmosphere SE/TE:
54-59, Currents and Climate 101, What Causes Winds? 103, Figure 3: Local Winds 104, Global Winds 104, Figure 4: Heating Earth’s Surface 105, The Coriolis Effect
105, Apply It! 107, Figure 6: Parts of the Atmosphere 122, How Do Clouds Form? 123, Figure 1: How Clouds Form
128–129, Figure 3: Freezing
Precipitation 133, What Are the Major Air Masses 134, Figure 2: North American Air Masses 136–137, Figure 4: Types of Fronts
138, What Weather Do Cyclones and Anticyclones Bring? 140–147, Storms

A Correlation of Interactive Science Grades 6-8 Modules, ©2016 Digital Refreshment
to the Next Generation Science Standards for Middle School
SE = Student Edition; TE = Teacher’s Edition; TLR = Teacher’s Lab Resource 104
137, Differentiated Instruction – L3 Weather Forecasts 137, Teacher Demo – Modeling Front Formation
139, Differentiated Instruction – L3 Modeling Cyclones 139F, Enrich – Occluded Fronts 143, Differentiated Instruction – L3 Rocky Mountain Thunderstorms 145, Differentiated Instruction –
L1 Hurricane Movement 147, Differentiated Instruction – L1 Sequencing Tornado Formation 155, Differentiated Instruction –
Generalizations about Fronts 155E, Enrich – Wind and Air Pressure
173, Differentiated Instruction – L1 Illustrate Winds Crossing a Mountain Range TLR: 49-57, Modeling Ocean Currents 58, Deep Currents
115, Water in the Air 116, Measuring to Find the Dew Point 117, How Does Fog Form? 118, How Clouds Form 120, How Can You Make Hail? 123, How Do Fluids of Different
Densities Move? 125, Weather Fronts 126, Cyclones and Anticyclones 127, Can You Make a Tornado? 130, Predicting Weather 132-140, Reading a Weather Map
Because these patterns are so complex,
weather can only be predicted probabilistically.
Water and the Atmosphere
SE/TE Only: 150–155, Predicting the Weather 154, Limits of Weather Forecasts 161, Tracking Hurricanes with Latitudes and Longitudes
TE Only:
155, Differentiated Instruction – L3 Accuracy of Local Weather Forecasts TLR: 130, Predicting Weather
142, Figure 2: How Thunderstorms Form 144, Figure 4: Hurricane TE Only:
57, Differentiate Instruction – L3 News Article 103, 21st Century Learning 105, Differentiated Instruction – L3 Winds and Airplanes 121E, Enrich – Hair Hygrometers 125E, Enrich – Contrails
128, 21st Century Learning 143, Differentiated Instruction – L3 Rocky Mountain Thunderstorms
TLR: 115, Water in the Air 116, Measuring to Find the Dew
Point 117, How Does Fog Form? 118, How Clouds Form 120, How Can You Make Hail? 123, How Do Fluids of Different Densities Move?
125, Weather Fronts 126, Cyclones and Anticyclones 128, Where Do Hurricanes Come From?

A Correlation of Interactive Science Grades 6-8 Modules, ©2016 Digital Refreshment
to the Next Generation Science Standards for Middle School
SE = Student Edition; TE = Teacher’s Edition; TLR = Teacher’s Lab Resource 105
MS.Weather and Climate MS-ESS2-6 Students who demonstrate understanding can: Develop and use a model to describe how unequal heating and rotation of the Earth causes patterns
of atmospheric and oceanic circulation that determine regional climates. [Clarification Statement: Emphasis is on
how patterns vary by latitude, altitude, and geographic land distribution. Emphasis of atmospheric circulation is on the sunlight-driven latitudinal banding, the Coriolis effect, and resulting prevailing winds; emphasis of ocean circulation is on the transfer of heat by the global ocean convection
cycle, which is constrained by the Coriolis effect and the outlines of continents. Examples of models can be diagrams, maps and globes, or digital representations.] [Assessment Boundary: Assessment does not include the dynamics of the Coriolis effect.]
INTERACTIVE SCIENCE: In the Water and Atmosphere module, the online Performance Expectation Activity “Weather and Climate (MS-ESS2-6)” addresses this performance expectation.
The Water and the Atmosphere module explores ocean currents in Chapter 2, Lesson 3, “Currents and Climate” on SE/TE pages 54–59. The effect of Earth’s rotation on ocean currents is described in “Coriolis Effect” on SE/TE page 55. Students learn how winds drive surface currents in “What
Causes Surface Currents?” on SE/TE pages 55-57. Students learn how ocean currents affect climate in “Effects on Climate” on SE/TE page 56. Students obtain knowledge about how ocean
temperatures and winds can combine to influence weather patterns in “El Niño” and “La Niña” on SE/TE page 57. They learn how cold ocean currents and warm ocean currents circulate water in “Figure 3: Global Conveyor” on SE/TE pages 58-59. Circulation of heat within the troposphere is covered in “Figure 3: Heating the Troposphere” on SE/TE page 99. Unequal heating of the air is identified as the cause of wind in “What Causes Winds?” on SE/TE page 101. Local wind and global wind are described in “How Do Local Winds and Global Winds Differ?” on SE/TE page 103. Students develop a model of land breezes by drawing on a diagram in “Figure 3: Local Winds” on SE/TE
page 103. Students model the effects of latitude in “Figure 4 – Heating of Earth’s Surface” on SE/TE page 104 and in “Figure 5 – Global Wind Belts” on SE/TE page 106. The effect of Earth’s rotation is modeled in the Apply It! feature on SE/TE page 105. Students model the cause and effect relationship between unequal heating and winds in “Differentiated Instruction: Model Wind” on TE page 107. Students develop a model to illustrate how the sun’s radiation drives the formation of global winds in “Figure 6: Parts of the Atmosphere” on SE/TE page 107. Students
learn how latitude, altitude, distances from oceans, and mountain ranges affect temperature and
precipitation patterns in Chapter 5, Lesson 1, “What Causes Climate.” Students obtain knowledge about latitudinal banding on SE/TE page 168. Students interpret photos to describe how temperature conditions at the top of a mountain differ from conditions at the bottom of the same mountain in “Figure 3: Altitude and Temperature” on SE/TE page 169. Students predict how ocean currents affect the climate of western Europe in “Figure 4: Currents and Temperature” on SE/TE page 171. Students model the effect a mountain range can have on precipitation in “Figure 5: Rain
Shadow” on SE/TE pages 172–173. Students learn how oceans, heating from the sun, altitude, and ice caps affect the six main climate regions in “What Are the Six Main Climate Regions?” on SE/TE pages 176–182. Students tell how winds, oceans, and topography affect climate in “Enrich: Factors That Affect Climate Regions” on TE page 183E.
Students model the effect of wind on surface and deep currents in “Bottom to Top” on TLR page 48. Students develop and use a model of currents in the North Atlantic in “Modeling Ocean Currents” on TLR pages 49-57, They model the effects of temperature on currents in “Deep Currents” on TLR page 58. They model global wind systems in “Does the Wind Turn?” on TLR page
98. They model global wind belts in “Global Wind Belts” on TLR page 100. They model the effect of latitude on temperature in “How Does Latitude Affect Climate?” on TLR page 151. They develop and use a model of how the unequal heating of Earth’s surface affects temperature in “Sunny Rays and Angles” on TLR pages 152-160.
The performance expectation above was developed using the following elements from the NRC document A Framework for K-12 Science Education:
Science and Engineering Practices
Developing and Using Models Modeling in 6–8 builds on K–5 experiences and
progresses to developing, using, and revising models to describe, test, and predict more
abstract phenomena and design systems.
Disciplinary Core Ideas
ESS2.C: The Roles of Water in Earth’s Surface ProcessesVariations in density due to variations in temperature and salinity drive a global pattern of
interconnected ocean currents.
Crosscutting Concepts
Systems and System Models Models can be used to represent systems and
their interactions—such as inputs, processes and outputs—and energy, matter, and information
flows within systems.

A Correlation of Interactive Science Grades 6-8 Modules, ©2016 Digital Refreshment
to the Next Generation Science Standards for Middle School
SE = Student Edition; TE = Teacher’s Edition; TLR = Teacher’s Lab Resource 106
Develop and use a model to describe
phenomena. (MS-ESS2-6)
Water and the Atmosphere
SE/TE: 55, Figure 1: Surface Currents 57, Figure 2: Warming Sea Temperature 58, Figure 3: Global Ocean Conveyor 104, Figure 4: Heating of Earth’s
Surface 105, Apply It! 106, Figure 5: Global Wind Belts 107, Figure 6: Parts of the Atmosphere
172, Figure 5: Rain Shadow
173, Figure 6: Monsoons TE Only: 107, Differentiated Instruction – L1 Model Wind 171, Make Analogies TLR: 47, Modeling Currents
48, Bottom to Top 49-57, Modeling Ocean Currents 58, Deep Currents 98, Does the Wind Turn? 100, Global Wind Belts 151, How Does Latitude Affect Climate?
152–160, Sunny Rays and Angles
Water and the Atmosphere SE/TE: 58–59, What Causes Deep
Currents? 58–59, Global Ocean Conveyor TE Only: 59, Differentiated Instruction – L3 Surface and Deep Currents ESS2.D: Weather and Climate Weather and climate are influenced by interactions involving sunlight, the ocean, the
atmosphere, ice, landforms, and living things. These interactions vary with latitude, altitude, and
local and regional geography, all of which can affect oceanic and atmospheric flow patterns.
Water and the Atmosphere SE/TE: 54–59, Currents and Climate 100–107, Winds 104, Figure 4 – Heating of Earth’s Surface
112, The Aura Mission 118–121, Water in the Atmosphere 122–125, Clouds 126–131, Precipitation 132–139, Air Masses 134, Figure 2 – North American
Air Masses 139, Apply It 140–147, Storms 141, Figure 1: Lake-Effect Snow 142, Figure 2: How Thunderstorms Form
144, Figure 4: Hurricanes 150–155, Predicting the Weather 166–173, What Causes Climate? 168, Figure 2 – Latitude and Temperature 169, Figure 3 – Altitude and Temperature
170, Apply It! 171, Figure 4 – Currents and Temperature
172–173, Figure 5 – Rain Shadow 173, Figure 6 – Monsoons 174–183, Climate Regions 187–189, What Natural Factors
Can Cause Climate Change? 190–195, Human Activities and Climate Change 191, Figure 1: Greenhouse Effect 192, Figure 2: Carbon Dioxide Levels
201, Bacterial Rainmakers
Water and the Atmosphere SE/TE: 55, Figure 1: Surface Currents
57, Figure 2: Warming Sea Temperature 58, Figure 3: Global Ocean Conveyor 104, Figure 4: Heating of Earth’s Surface 105, Apply It!
106, Figure 5: Global Wind Belts 160, The S’Cool Project 172, Figure 5: Rain Shadow 173, Figure 6: Monsoons
TE Only: 107, Differentiated Instruction, L1-Model Wind
171, Make Analogies TLR: 47, Modeling Currents 48, Bottom to Top 49-57, Modeling Ocean Currents 58, Deep Currents
98, Does the Wind Turn? 100, Global Wind Belts 131, Modeling Weather Satellites 151, How Does Latitude Affect Climate? 152–160, Sunny Rays and Angles
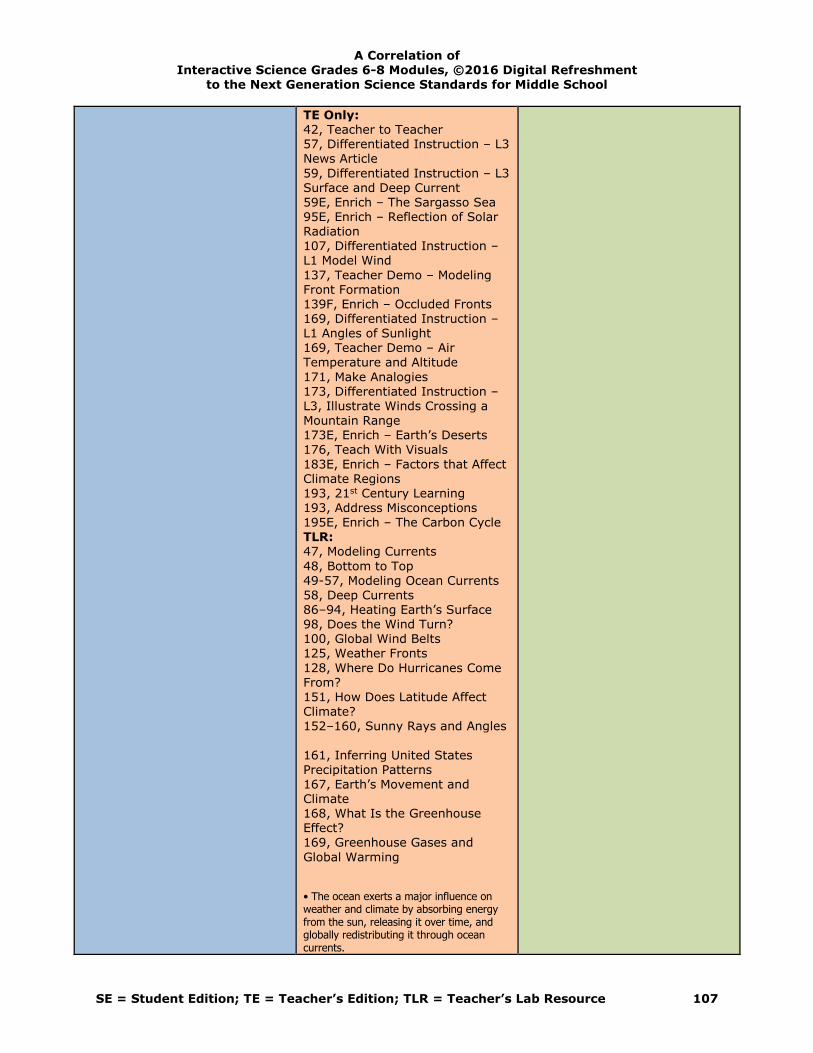
A Correlation of Interactive Science Grades 6-8 Modules, ©2016 Digital Refreshment
to the Next Generation Science Standards for Middle School
SE = Student Edition; TE = Teacher’s Edition; TLR = Teacher’s Lab Resource 107
TE Only: 42, Teacher to Teacher 57, Differentiated Instruction – L3 News Article
59, Differentiated Instruction – L3 Surface and Deep Current 59E, Enrich – The Sargasso Sea 95E, Enrich – Reflection of Solar Radiation 107, Differentiated Instruction – L1 Model Wind
137, Teacher Demo – Modeling Front Formation 139F, Enrich – Occluded Fronts 169, Differentiated Instruction –
L1 Angles of Sunlight 169, Teacher Demo – Air Temperature and Altitude
171, Make Analogies 173, Differentiated Instruction – L3, Illustrate Winds Crossing a Mountain Range 173E, Enrich – Earth’s Deserts 176, Teach With Visuals
183E, Enrich – Factors that Affect Climate Regions 193, 21st Century Learning 193, Address Misconceptions 195E, Enrich – The Carbon Cycle TLR: 47, Modeling Currents
48, Bottom to Top 49-57, Modeling Ocean Currents 58, Deep Currents 86–94, Heating Earth’s Surface 98, Does the Wind Turn? 100, Global Wind Belts 125, Weather Fronts
128, Where Do Hurricanes Come From? 151, How Does Latitude Affect Climate? 152–160, Sunny Rays and Angles
161, Inferring United States Precipitation Patterns
167, Earth’s Movement and Climate 168, What Is the Greenhouse Effect? 169, Greenhouse Gases and
Global Warming
• The ocean exerts a major influence on weather and climate by absorbing energy from the sun, releasing it over time, and globally redistributing it through ocean currents.
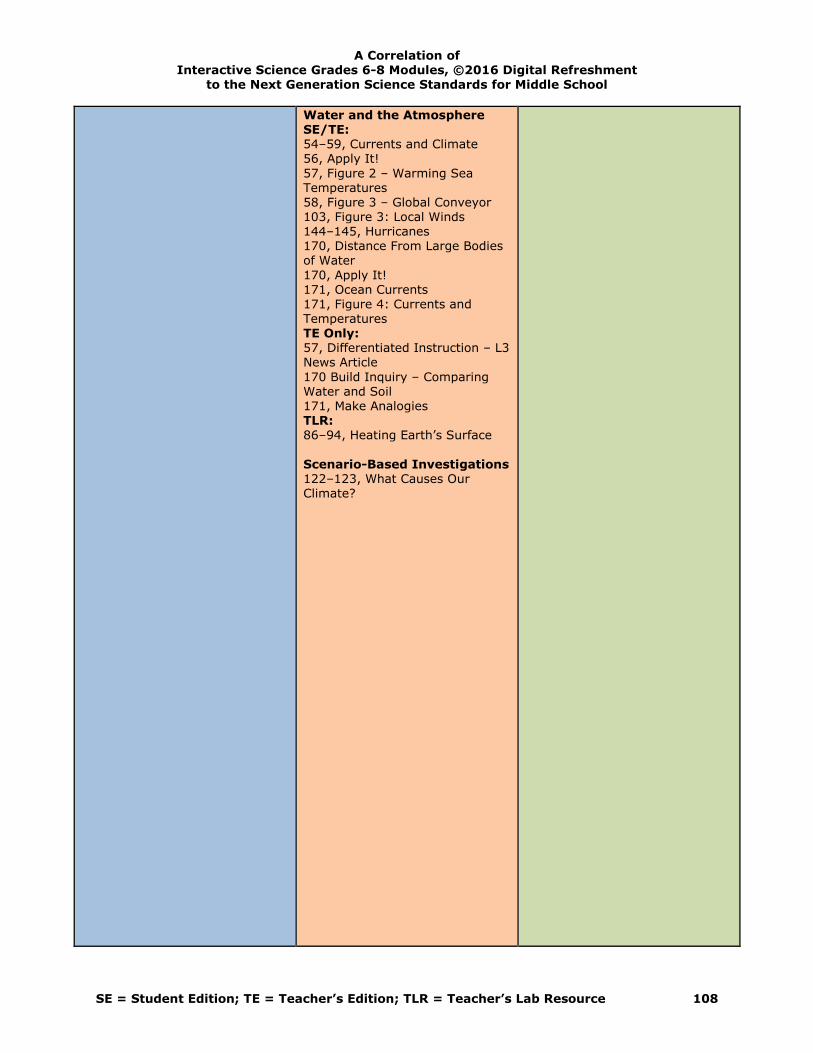
A Correlation of Interactive Science Grades 6-8 Modules, ©2016 Digital Refreshment
to the Next Generation Science Standards for Middle School
SE = Student Edition; TE = Teacher’s Edition; TLR = Teacher’s Lab Resource 108
Water and the Atmosphere SE/TE: 54–59, Currents and Climate 56, Apply It!
57, Figure 2 – Warming Sea Temperatures 58, Figure 3 – Global Conveyor 103, Figure 3: Local Winds 144–145, Hurricanes 170, Distance From Large Bodies of Water
170, Apply It! 171, Ocean Currents 171, Figure 4: Currents and Temperatures
TE Only: 57, Differentiated Instruction – L3 News Article
170 Build Inquiry – Comparing Water and Soil 171, Make Analogies TLR: 86–94, Heating Earth’s Surface
Scenario-Based Investigations 122–123, What Causes Our Climate?

A Correlation of Interactive Science Grades 6-8 Modules, ©2016 Digital Refreshment
to the Next Generation Science Standards for Middle School
SE = Student Edition; TE = Teacher’s Edition; TLR = Teacher’s Lab Resource 109
MS.Weather and Climate MS-ESS3-5 Students who demonstrate understanding can: Ask questions to clarify evidence of the factors that have caused the rise in global temperatures
over the past century. [Clarification Statement: Examples of factors include human activities (such as fossil fuel combustion, cement
production, and agricultural activity) and natural processes (such as changes in incoming solar radiation or volcanic activity). Examples of evidence can include tables, graphs, and maps of global and regional temperatures, atmospheric levels of gases such as carbon dioxide and
methane, and the rates of human activities. Emphasis is on the major role that human activities play in causing the rise in global temperatures.]
INTERACTIVE SCIENCE: In the Water and Atmosphere module, the online Performance Expectation Activity “Weather and Climate (MS-ESS3-5)” addresses this performance expectation.
Natural causes of climate change are discussed in the Water and the Atmosphere module in Chapter 5, Lesson 3 “Changes in Climate” on SE/TE pages 184–189. Students interpret data of a
graph showing average global temperatures over time in “Do the Math!” on SE/TE page 188. Global warming is discussed in Chapter 5, Lesson 4 “Human Activities and Climate Change” on
SE/TE pages 190–195. Students obtain knowledge related to evidence of global warming and the role human activities play in the rise in global temperatures in “Figure 2: Carbon Dioxide Levels” on SE/TE page 192. Students learn the effects of global warming in “Figure 3: Sea Level Rise” on SE/TE page 193. They learn about solutions to global warming in “Limiting Global
Warming” on SE/TE page 194.
Students ask questions about the greenhouse effect in the Targeted Reading Skill on SE/TE page 190. Students use a graph to analyze carbon dioxide levels over time in “Figure 2: Carbon Dioxide Levels” on SE/TE page 192. Students interpret maps showing the vulnerability of the eastern part of the United States to rising sea levels in “Figure 3: Sea Level Rise” on SE/TE page 193. They make models of a particular technology that will reduce greenhouse gas emissions on SE/TE page 194. They evaluate evidence, reliability, and bias of media coverage of global warming in “Figure 4: Climate in the Media” on SE/TE page 195. They interpret photographs
showing evidence of how melting glaciers have changed particular landscapes over the past several decades in “Differentiated Instructions: Photographic Evidence” on TE page 195. They
make observations about a block of ice to understand how scientists use evidence from ice cores to learn about conditions in the atmosphere thousands of years ago in “Greenhouse Gases and Global Warming” on TLR page 169.
The performance expectation above was developed using the following elements from the NRC document A Framework for K-12 Science Education:
Science and Engineering Practices
Asking Questions and Defining Problems Asking questions and defining problems in 6–8 builds on K–5 experiences and progresses to
specifying relationships between variables, clarify arguments and models.
Ask questions to identify and clarify evidence of an argument.
Water and the Atmosphere
SE/TE:
191, Ask Questions 195, Figure 4 – Climate in the Media 200, Tracking Earth’s Gases From Space TE Only: 195, Differentiated Instruction –
L3 Photographic Evidence STEMQuest: Shrinking Your Carbon Footprint Energy Savings at School
Disciplinary Core Ideas
ESS3.D: Global Climate Change Human activities, such as the release of greenhouse gases from burning fossil fuels, are
major factors in the current rise in Earth’s mean surface temperature (global warming). Reducing the level of climate change and reducing human
vulnerability to whatever climate changes do occur depend on the understanding of climate
science, engineering capabilities, and other kinds of knowledge, such as understanding of human behavior and on applying that knowledge wisely
in decisions and activities.
Ecology and the Environment SE/TE: 52, Human Impact Water and the Atmosphere
SE/TE: 190–195, Human Activities and Climate Change 192, Figure 2: Carbon Dioxide Levels
Crosscutting Concepts
Stability and Change Stability might be disturbed either by sudden events or gradual changes that accumulate over
time.
Water and the Atmosphere SE/TE: 188, Do the Math! 189, Figure 5 – Volcanic Activity
and Climate
192, Figure 2 – Carbon Dioxide Levels 193, Figure 3 – Sea Level Rise TE Only: 184A, Content Refresher – Earth’s Changing Orbit
189, Differentiated Instruction – L3 Year Without Summer TLR: 168, What Is the Greenhouse Effect? 195E, Enrich – The Carbon Cycle

A Correlation of Interactive Science Grades 6-8 Modules, ©2016 Digital Refreshment
to the Next Generation Science Standards for Middle School
SE = Student Edition; TE = Teacher’s Edition; TLR = Teacher’s Lab Resource 110
193, Figure 3: Sea Level Rise 194, Apply It! 195, Figure 4: Climate in the Media
200, Tracking Earth’s Gases From Space TE Only: 192, Teach With Visuals 193, 21st Century Learning 195, Differentiated Instruction – L1 Efficiency
TLR: 169, Greenhouse Gases and Global Warming
STEMQuest: Shrinking Your
Carbon Footprint Footprint Steps Energy Savings at School
Make a Difference Reflect on Shrinking Your Carbon Footprint
Ecology and the Environment SE/TE: 99, Do the Math! 148, The Ozone Hole
148, Figure 6: Ozone Hole

A Correlation of Interactive Science Grades 6-8 Modules, ©2016 Digital Refreshment
to the Next Generation Science Standards for Middle School
SE = Student Edition; TE = Teacher’s Edition; TLR = Teacher’s Lab Resource 111
MS.Human Impacts MS-ESS3-2 Students who demonstrate understanding can: Analyze and interpret data on natural hazards to forecast future catastrophic events and inform the
development of technologies to mitigate their effects. [Clarification Statement: Emphasis is on how some natural hazards,
such as volcanic eruptions and severe weather, are preceded by phenomena that allow for reliable predictions, but others, such as earthquakes, occur suddenly and with no notice, and thus are not yet predictable. Examples of natural hazards can be taken from interior processes (such as
earthquakes and volcanic eruptions), surface processes (such as mass wasting and tsunamis), or severe weather events (such as hurricanes, tornadoes, and floods). Examples of data can include the locations, magnitudes, and frequencies of the natural hazards. Examples of technologies can be global (such as satellite systems to monitor hurricanes or forest fires) or local (such as building basements in tornado-prone regions or
reservoirs to mitigate droughts).]
INTERACTIVE SCIENCE: In the Earth’s Structure module, the online Performance Expectation Activity “Human Impacts (MS-ESS3-2)” addresses this performance expectation. A discussion of earthquakes and their potential to cause sudden damage appears in Chapter 4,
Lesson 2 of the Earth’s Structure module on SE/TE pages 110–117. How scientists use seismographic data to create maps showing where earthquakes have occurred in the past (and
thus, where they are likely to occur in the future) is described in “What Patterns Do Seismographic Data Reveal?” on SE/TE pages 121–123. Students learn about earthquake risk in “Earthquake Risk in North America” SE/TE page 121 and “Earthquake Risk Around the World” on SE/TE page 122. Students interpret data to forecast earthquake risk in the Apply It! on SE/TE page 121. T Students discuss the importance of predicting earthquakes and how to mitigate their effects in the “Lead a Discussion” activity on TE page 121.They analyze data on the locations of past
earthquakes to indicate where buildings should be built to withstand future earthquakes in “Figure 3: Earthquakes Around the World” on SE/TE page 122. They analyze data on the probability of an earthquake occurring along the San Andreas fault on TE page 123E. They obtain knowledge of how buildings can be engineered to mitigate the effects of earthquakes in “Seismic-Safe Buildings” on SE/TE page 128. A discussion of volcanoes and plate tectonics appears in the Earth’s Structure module on SE/TE
pages 134–137. Students analyze data related to the location of volcanoes around the world in “Figure 1: The Ring of Fire” on SE/TE page 135. Students learn that volcanoes can erupt quietly or explosively in “Two Types of Volcanic Eruptions” on SE/TE pages 140–142. They obtain knowledge of phenomena that allow for reliable predictions of volcanic eruptions in “What Are the Stages of Volcanic Activity?” on SE/TE page 144. They interpret data related to the location and frequency of eruptions in the Cascade range in “Figure 5: Cascade Volcanoes” on SE/TE page 144.
A discussion of tsunamis appears in the Water and the Atmosphere module on SE/TE page 51. Students learn how the occurrence of tsunamis in the Pacific Ocean led to the development of a tsunami warning system on SE/TE page 51. A discussion of flood plains appears in the Earth’s Surface module on SE page 74. Students research flood plains and ways to mitigate the effects of floods in “Floodwater Fallout” on SE/TE page 98. They learn further details about mitigating floods in “Science and Society” on TE page 98. A discussion of floods and droughts appears in the Water
and the Atmosphere module on SE/TE pages 130–131 “What Are the Causes of Floods and Droughts?” Students learn about flood prevention in “Lead a Discussion” on TE page 130. They learn about flood control projects in “Differentiated Instruction: Flood Control” on TE page 131.
A discussion of hurricanes appears in the Water and the Atmosphere module on SE/TE pages 144–145. Students interpret data related to the paths of hurricanes in “Differentiated Instruction: Hurricane Movement” on TE page 145. Students obtain knowledge about how scientists predict
hurricanes in “Support the Big Question” on TE page 148 and “Think Like a Scientist” on TE page 161. Students can map hurricane paths in the Teacher To Teacher activity on TE page 148. A discussion of tornadoes appears on SE/TE pages 146–147. Students interpret maps related to tornado alley in “Figure 6: Tornado Formation” on SE/TE page 146. Students interpret photographs showing the magnitude of damage due to a hurricane in “Figure 7: Tornado Damage” on SE/TE page 147.

A Correlation of Interactive Science Grades 6-8 Modules, ©2016 Digital Refreshment
to the Next Generation Science Standards for Middle School
SE = Student Edition; TE = Teacher’s Edition; TLR = Teacher’s Lab Resource 112
The performance expectation above was developed using the following elements from the NRC document A Framework for K-12 Science Education:
Science and Engineering Practices
Analyzing and Interpreting Data Analyzing data in 6–8 builds on K–5 experiences and progresses to extending quantitative analysis
to investigations, distinguishing between correlation and causation, and basic statistical techniques of data and error analysis.
Analyze and interpret data to determine similarities and differences in findings.
Earth’s Structure SE/TE: 129, Forensic Seismology
135, Figure 1 – The Ring of Fire
157, An Explosive Secret TE Only: 117F, Enrich – Comparing the Richter and Moment Magnitude Scales 129, Technology and Society
137, Teacher Demo – Interpreting Maps 137E, Enrich – Volcanoes and Plates STEMQuest: To Hike or Not to Hike
Patterns in the Cascade Range Mount Rainier's Threat Monitoring a Volcano Signs of Eruption?
Earth’s Surface TLR:
66, Weathering and Erosion 67–75, Sand Hills Water and the Atmosphere TE Only: 145, Differentiated Instruction – L1 Hurricane Movement
Scenario-Based Investigations 95–97, High-Priority Earthquake Zones
Disciplinary Core Ideas
ESS3.B: Natural Hazards Mapping the history of natural hazards in a region, combined with an understanding of
related geologic forces can help forecast the locations and likelihoods of future events
Earth’s Structure SE/TE: 86–91, The Theory of Plate Tectonics 90–91, Figure 6: Earth’s
Changing Crust 97, An Ocean Is Born
121–123, What Patterns Do Seismographic Data Reveal? 121, Apply It! 122–123, Figure 3 – Earthquakes
Around the World 134–137, Volcanoes and Plate Tectonics 135, Figure 1 – The Ring of Fire 137, Apply It! 144, What are the Stages of Volcanic Activity?
TE Only: 83, Differentiated Instruction – L1 Cause-and-Effect Table 88, Teacher to Teacher
98, From the Author 121, Lead a Discussion – Earthquake Predictions
121, Differentiated Instruction – L3 New Madrid Fault 123E, Enrich – Earthquake Probability 128, Technology and Society 137, Teacher Demo – Interpreting
Maps 145, Differentiated Instruction – L3 Predict Eruptions TLR: 115, Earthquake Patterns 125, Where Are Volcanoes Found on Earth’s Surface?
STEMQuest: To Hike or Not to Hike Patterns in the Cascade Range Mount Rainier's Threat Monitoring a Volcano Signs of Eruption?
Crosscutting Concepts
Patterns Graphs, charts, and images can be used to identify patterns in data.
Earth’s Structure SE/TE:
121, Apply It! 122–123, Figure 3 – Earthquakes Around the World 135, Figure 1 – The Ring of Fire 140, Do the Math! 144, Figure 5 – Cascade
Volcanoes
146, Figure 6: Tornado Formation TE Only: 123E, Enrich – Earthquake Probability 131, Differentiated Instruction – L1 Droughts and Floods STEMQuest: To Hike or Not to
Hike Patterns in the Cascade Range Mount Rainier's Threat Monitoring a Volcano Signs of Eruption?
Earth’s Surface SE/TE:
79, Apply It! Scenario-Based Investigations 95–97, High-Priority Earthquake Zones
103–105, Jane Versus the Volcano ------------------------------------
Connections to Engineering,
Technology, and Applications of
Science
Influence of Science, Engineering, and Technology on Society and the Natural World
The uses of technologies and limitations on
their use are driven by people’s needs, desires, and values; by the findings of scientific research; and by differences in such factors as climate,
natural resources, and economic conditions. Thus technology use varies from region to region and
over time.
Earth’s Structure SE/TE: 119, How Do Seismographs Work? 122–123, Figure 3: Earthquakes
Around the World (“Make Judgments”)
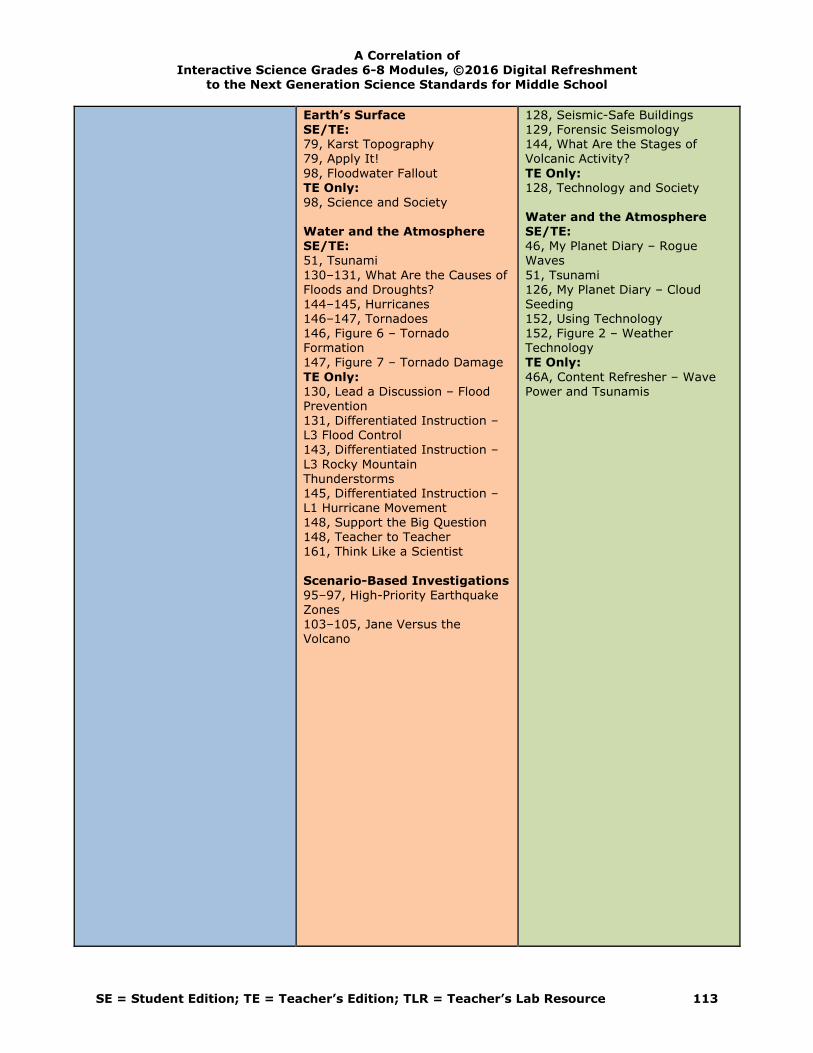
A Correlation of Interactive Science Grades 6-8 Modules, ©2016 Digital Refreshment
to the Next Generation Science Standards for Middle School
SE = Student Edition; TE = Teacher’s Edition; TLR = Teacher’s Lab Resource 113
Earth’s Surface SE/TE: 79, Karst Topography 79, Apply It!
98, Floodwater Fallout TE Only: 98, Science and Society Water and the Atmosphere SE/TE: 51, Tsunami
130–131, What Are the Causes of Floods and Droughts? 144–145, Hurricanes 146–147, Tornadoes
146, Figure 6 – Tornado Formation 147, Figure 7 – Tornado Damage
TE Only: 130, Lead a Discussion – Flood Prevention 131, Differentiated Instruction – L3 Flood Control 143, Differentiated Instruction –
L3 Rocky Mountain Thunderstorms 145, Differentiated Instruction – L1 Hurricane Movement 148, Support the Big Question 148, Teacher to Teacher 161, Think Like a Scientist
Scenario-Based Investigations 95–97, High-Priority Earthquake Zones 103–105, Jane Versus the Volcano
128, Seismic-Safe Buildings 129, Forensic Seismology 144, What Are the Stages of Volcanic Activity?
TE Only: 128, Technology and Society Water and the Atmosphere SE/TE: 46, My Planet Diary – Rogue Waves
51, Tsunami 126, My Planet Diary – Cloud Seeding 152, Using Technology
152, Figure 2 – Weather Technology TE Only:
46A, Content Refresher – Wave Power and Tsunamis

A Correlation of Interactive Science Grades 6-8 Modules, ©2016 Digital Refreshment
to the Next Generation Science Standards for Middle School
SE = Student Edition; TE = Teacher’s Edition; TLR = Teacher’s Lab Resource 114
MS.Human Impacts MS-ESS3-3 Students who demonstrate understanding can: Apply scientific principles to design a method for monitoring and minimizing a human impact on the
environment.* [Clarification Statement: Examples of the design process include examining human environmental impacts, assessing the
kinds of solutions that are feasible, and designing and evaluating solutions that could reduce that impact. Examples of human impacts can include water usage (such as the withdrawal of water from streams and aquifers or the construction of dams and levees), land usage (such as urban
development, agriculture, or the removal of wetlands), and pollution (such as of the air, water, or land).]
INTERACTIVE SCIENCE: In the Ecology and the Environment module, the online Performance Expectation Activity “Human Impacts (MS-ESS3-3)” addresses this performance expectation. Students design a solution to minimize the impact of stormwater runoff at their middle school in “The Problem With Runoff” on pages 20–21 of the Scenario-Based Investigations book. They design a solution for monitoring and reducing energy use in their school in “Energy Audit” on pages 38–42 of the Chapter Activities and Projects book. They design a water filtration system to clean dirty water in “A Precious Resource” on pages 45–49 of the Chapter Activities and Projects book. They design a solution for monitoring water use in “Every Drop Counts” on pages 290–294 of the Chapter Activities and Projects book. They design a landfill to minimize the human impact of wastes in “Waste Away!” on TLR pages 111–119 of the Ecology and the Environment module. They design a solar cooker to minimize the impact of humans’ use of energy resources in “Design and Build a Solar Cooker” on TLR pages 144-152. They design a dam and evaluate how it effects the land upstream and downstream in “It’s All Water Under the Dam” on pages 17–20 of the STEM Activity Book. A discussion of the human impacts on soil fertility is included in Chapter 2, Lesson 3 “Soil Conservation” on SE/TE pages 52–55 of the Earth’s Surface module. A discussion of how to minimize the impacts on soil due to agriculture, mining, and development appears in Chapter 4, Lesson 1 “Conserving Land and Soil” on SE/TE pages 128–133. Students research methods farmers use to minimize loss of soil fertility in “Differentiated Instruction: Soil Fertility” in the Earth’s Surface module on TE page 55. Students learn about George Washington Carver and the importance of farming techniques such as crop rotation in “The Plant Doctor” on SE/TE page 61. A discussion of the impact humans have on the supply of natural resources appears in Chapter 3, Lesson 2 “Introduction to Natural Resources” on SE/TE pages 92–97 of the Ecology and the Environment module. A discussion of how human population growth impacts natural resources appears in “What Factors Allow the Human Population to Grow?” on SE/TE pages 100–101. A discussion of how humans impact forests and fish populations is presented in Chapter 3, Lesson 4 “Forests and Fisheries” on pages 102–107. A discussion of ways to protect biodiversity is included in “How Do Humans Affect Biodiversity?” on SE/TE pages 114–117. A discussion of how to dispose of waste to minimize pollution appears in Chapter 4, Lesson 2 “Waste Disposal and Recycling” on SE/TE pages 134–141. A discussion of ways to reduce air pollution appears in Chapter 4, Lesson 3 “Air Pollution and Solutions” on pages SE/TE 142–151 of the Ecology and the Environment module. A discussion of ways to reduce water pollution appears in Chapter 4, Lesson 4 “Water Pollution and Solution” on SE/TE pages 152–159. A discussion of ocean resources and ocean pollution appears in Chapter 4, Lesson 5 “Ocean Resources” on SE/TE pages 160–167. A discussion of human use of energy resources appears in Chapter 5, Lesson 1, “Fossil Fuels” on SE/TE pages 178–185. A discussion of alternative energy sources appears in Chapter 5, Lesson 2 “Renewable Energy Sources” on SE/TE pages 195. A discussion of how humans can minimize the impact of energy use appears in Chapter 5, Lesson 3 “Energy Use and Conservation” on SE/TE pages 196–201. Students map the Chesapeake Bay watershed to show how fertilizers enter the bay in “A Pearl of a Solution” on SE/TE page 34 of the Water and the Atmosphere module. Students design a plan to help minimize global warming in the Apply It! on SE/TE page 194 of the Water and the Atmosphere module. Students devise a method to increase fish harvests in the “Apply It!” activity on SE/TE page 161 of the Ecology and the Environment module. Students solve problems by identifying a method to reduce oil pollution in “Do the Math” on SE/TE page 166. Students research the use of satellites to help protect water supplies from agricultural contamination in “Old MacDonald Had a Satellite” on SE/TE page 172. Using scientific principles, they evaluate how energy technologies minimize human impact in “How Low Is Low Impact?” on SE/TE page 206.
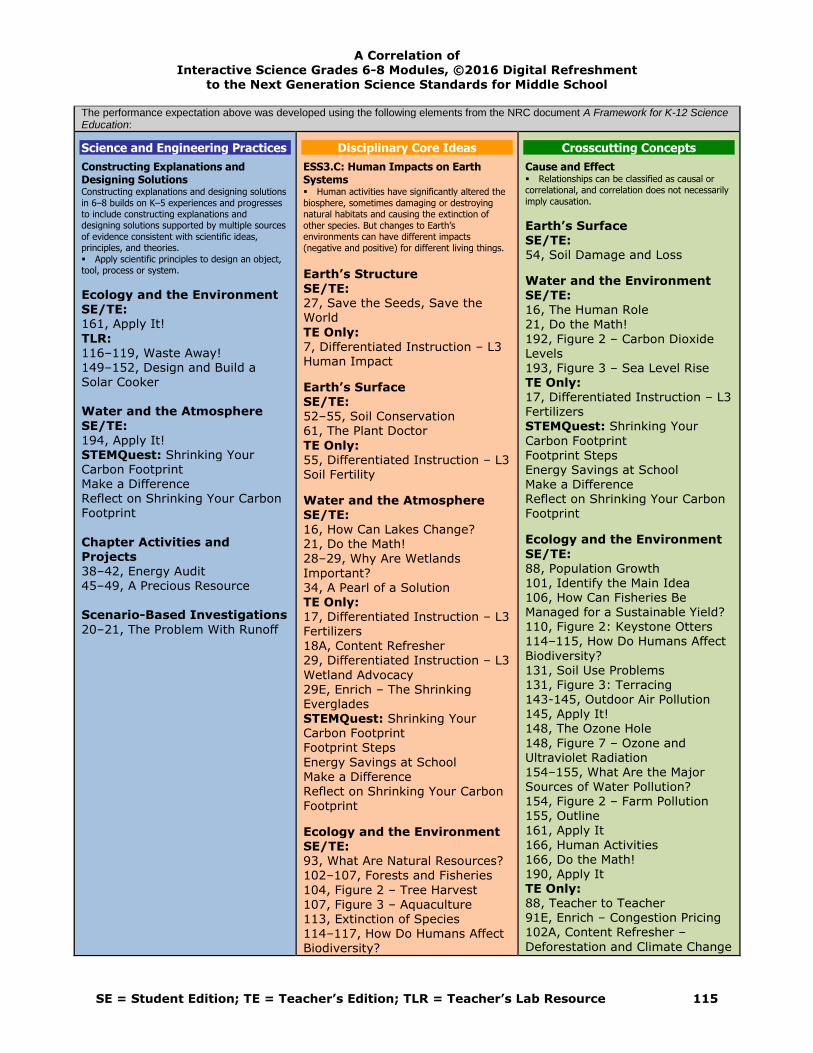
A Correlation of Interactive Science Grades 6-8 Modules, ©2016 Digital Refreshment
to the Next Generation Science Standards for Middle School
SE = Student Edition; TE = Teacher’s Edition; TLR = Teacher’s Lab Resource 115
The performance expectation above was developed using the following elements from the NRC document A Framework for K-12 Science Education:
Science and Engineering Practices
Constructing Explanations and Designing Solutions Constructing explanations and designing solutions
in 6–8 builds on K–5 experiences and progresses to include constructing explanations and designing solutions supported by multiple sources
of evidence consistent with scientific ideas, principles, and theories.
Apply scientific principles to design an object, tool, process or system.
Ecology and the Environment SE/TE: 161, Apply It!
TLR: 116–119, Waste Away! 149–152, Design and Build a Solar Cooker Water and the Atmosphere
SE/TE: 194, Apply It! STEMQuest: Shrinking Your Carbon Footprint Make a Difference Reflect on Shrinking Your Carbon Footprint
Chapter Activities and
Projects 38–42, Energy Audit 45–49, A Precious Resource Scenario-Based Investigations
20–21, The Problem With Runoff
Disciplinary Core Ideas
ESS3.C: Human Impacts on Earth Systems Human activities have significantly altered the
biosphere, sometimes damaging or destroying natural habitats and causing the extinction of
other species. But changes to Earth’s environments can have different impacts
(negative and positive) for different living things.
Earth’s Structure SE/TE: 27, Save the Seeds, Save the World
TE Only: 7, Differentiated Instruction – L3 Human Impact
Earth’s Surface SE/TE: 52–55, Soil Conservation 61, The Plant Doctor
TE Only: 55, Differentiated Instruction – L3 Soil Fertility
Water and the Atmosphere SE/TE: 16, How Can Lakes Change? 21, Do the Math!
28–29, Why Are Wetlands
Important? 34, A Pearl of a Solution TE Only: 17, Differentiated Instruction – L3 Fertilizers 18A, Content Refresher 29, Differentiated Instruction – L3
Wetland Advocacy 29E, Enrich – The Shrinking Everglades STEMQuest: Shrinking Your Carbon Footprint Footprint Steps
Energy Savings at School Make a Difference
Reflect on Shrinking Your Carbon Footprint
Ecology and the Environment SE/TE: 93, What Are Natural Resources? 102–107, Forests and Fisheries
104, Figure 2 – Tree Harvest 107, Figure 3 – Aquaculture 113, Extinction of Species 114–117, How Do Humans Affect Biodiversity?
Crosscutting Concepts
Cause and Effect Relationships can be classified as causal or correlational, and correlation does not necessarily
imply causation.
Earth’s Surface SE/TE: 54, Soil Damage and Loss
Water and the Environment SE/TE: 16, The Human Role 21, Do the Math!
192, Figure 2 – Carbon Dioxide Levels 193, Figure 3 – Sea Level Rise TE Only: 17, Differentiated Instruction – L3 Fertilizers STEMQuest: Shrinking Your
Carbon Footprint Footprint Steps Energy Savings at School Make a Difference Reflect on Shrinking Your Carbon Footprint
Ecology and the Environment
SE/TE:
88, Population Growth 101, Identify the Main Idea 106, How Can Fisheries Be Managed for a Sustainable Yield? 110, Figure 2: Keystone Otters 114–115, How Do Humans Affect
Biodiversity? 131, Soil Use Problems 131, Figure 3: Terracing 143-145, Outdoor Air Pollution 145, Apply It! 148, The Ozone Hole
148, Figure 7 – Ozone and Ultraviolet Radiation 154–155, What Are the Major
Sources of Water Pollution? 154, Figure 2 – Farm Pollution 155, Outline 161, Apply It
166, Human Activities 166, Do the Math! 190, Apply It TE Only: 88, Teacher to Teacher 91E, Enrich – Congestion Pricing 102A, Content Refresher –
Deforestation and Climate Change

A Correlation of Interactive Science Grades 6-8 Modules, ©2016 Digital Refreshment
to the Next Generation Science Standards for Middle School
SE = Student Edition; TE = Teacher’s Edition; TLR = Teacher’s Lab Resource 116
ESS3.C: Human Impacts on Earth Systems Typically as human populations and per-capita consumption of natural resources increase, so do
the negative impacts on Earth unless the activities and technologies involved are engineered
otherwise.
Water and the Atmosphere SE/TE:
4, Planet Diary – How Much Water Do You Use? TE Only: 29E, Enrich – The Shrinking Everglades
STEMQuest: Shrinking Your Carbon Footprint
Footprint Steps Energy Savings at School Make a Difference Reflect on Shrinking Your Carbon Footprint
Ecology and the Environment SE/TE: 101, Medical Care and Technology 101, Identify the Main Idea 128–131, Conserving Land and Soil 129, Figure 1 – Land Use
149, What’s Being Done? 150–151, How Can Air Pollution Be Reduced? 156–157, How Can Water Pollution Be Reduced? 156, Figure 3 – Wastewater Treatment
158–159, Figure 4 – Pollution and Solutions 186–193, Renewable Sources of Energy 188, Figure 2 – Solar-Powered House
189, Figure 3 – Hydroelectric and Wind Power 191, Figure 5 – Geothermal
Power in Iceland 192-193, Figure 6 – The Energy Around Us 192, Electric Cars and Hydrogen
Fuel Cells 194, Figure 7: Nuclear Power Plants 198–201, How Can We Ensure There Will Be Enough Energy for the Future?
133E, Enrich – The Copper Basin 149, Differentiated Instruction – LE Researching Ozone Depletion Potential
167E, Enrich – Fishing on Georges Bank 195, Differentiated Instruction – L1 Relate Cause and Effect TLR: 87, Human Population Growth 89, What Happened to the Tuna?
91, Managing Fisheries 93, Modeling Keystone Species 107, How Does Mining Affect the Land?
129, Getting Clean 155, Human Energy Use
----------------------------------------
Connections to Engineering,
Technology, and Applications of
Science
Influence of Science, Engineering, and
Technology on Society and the Natural World The uses of technologies and limitations on
their use are driven by people’s needs, desires, and values; by the findings of scientific research;
and by differences in such factors as climate, natural resources, and economic conditions. Thus
technology use varies from region to region and over time.
Water and the Atmosphere SE/TE: 35, What Was Fort Miami? 126, My Planet Diary – Cloud Seeding STEMQuest: Shrinking Your
Carbon Footprint Footprint Steps Energy Savings at School Make a Difference Reflect on Shrinking Your Carbon Footprint
Ecology and the Environment SE/TE:
136, Landfills 136, Figure 1 – Sanitary Landfill Design 163, Figure 2 – Desalination Process
191, Tapping Earth’s Energy 191, Figure 5 – Geothermal Power in Iceland 192, Electric Cars and Hydrogen Fuel Cells 194–195, How Does a Nuclear
Power Plant Produce Electricity?

A Correlation of Interactive Science Grades 6-8 Modules, ©2016 Digital Refreshment
to the Next Generation Science Standards for Middle School
SE = Student Edition; TE = Teacher’s Edition; TLR = Teacher’s Lab Resource 117
TE Only: 88, 21st Century Learning 96, Teach With Visuals 97, Differentiated Instruction – L1
Calculate Your Ecological Footprint 101, 21st Century Learning 101, Differentiated Instruction – L1 Medical Care and Human Survival 124, From the Author
TLR: 25, Elbow Room 75, Using Resources 76, Natural Resources
86, Doubling Time 87, Human Population Growth 108, Land Use
194, Figure 7 – Nuclear Power Plants 206, How Low Is Low Impact? 207, Hydrokinetic Energy
TE Only: 107E, Enrich – Modern Fishing Equipment 134A, Content Refresher – Municipal Solid Waste Disposal 193, Differentiated Instruction – L3 Hydrogen Power Plants
198, Teacher to Teacher 201, Differentiated Instruction – L3 Timeline of Automotive Efficiency
206, Quick Facts TLR: 155, Human Energy Use
*The performance expectations marked with an asterisk integrate traditional science content with engineering through a Practice or
Disciplinary Core Idea.

A Correlation of Interactive Science Grades 6-8 Modules, ©2016 Digital Refreshment
to the Next Generation Science Standards for Middle School
SE = Student Edition; TE = Teacher’s Edition; TLR = Teacher’s Lab Resource 118
MS.Human Impacts MS-ESS3-4 Students who demonstrate understanding can: Construct an argument supported by evidence for how increases in human population and per-capita
consumption of natural resources impact Earth’s systems. [Clarification Statement: Examples of evidence include grade-
appropriate databases on human populations and the rates of consumption of food and natural resources (such as freshwater, mineral, and energy). Examples of impacts can include changes to the appearance, composition, and structure of Earth’s systems as well as the rates at which
they change. The consequences of increases in human populations and consumption of natural resources are described by science, but science does not make the decisions for the actions society takes.]
INTERACTIVE SCIENCE: In the Ecology and the Environment module, the online Performance Expectation Activity “Human Impacts (MS-ESS3-4)” addresses this performance expectation. A discussion of how population growth of all living organisms is affected by the availability of food and water, the amount of available space, and climate appears in “What Factors Limit Population
Growth?” on SE/TE pages 15–17 in the Ecology and the Environment module. Water shortages as a
result of population growth are discussed in “Population Growth” on SE/TE page 88. Factors affecting human population growth are discussed in Chapter 3, Lesson 3 “Human Population Growth” on SE/TE pages 98–101. Consumption of natural resources as it relates to population growth is discussed in “Population Growth and Natural Resources” on SE/TE page 101. Students model how space can be a limiting factor for population growth in “Differentiated Instruction: Classroom Density” on TE page 17.
The performance expectation above was developed using the following elements from the NRC document A Framework for K-12 Science Education:
Science and Engineering Practices
Engaging in Argument from Evidence Engaging in argument from evidence in 6–8 builds on K–5 experiences and progresses to
constructing a convincing argument that supports or refutes claims for either explanations or
solutions about the natural and designed world(s). Construct an oral and written argument
supported by empirical evidence and scientific reasoning to support or refute an explanation or a
model for a phenomenon or a solution to a problem.
Water and the Atmosphere SE/TE: 192, Figure 2 – Carbon Dioxide
Levels TLR: 168, What Is the Greenhouse Effect?
Ecology and the Environment
SE/TE: 145, Apply It 148, The Ozone Hole TLR: 25, Elbow Room
Scenario-Based Investigations 20–21, The Problem With Runoff
Disciplinary Core Ideas
ESS3.C: Human Impacts on Earth Systems Typically as human populations and per-capita
consumption of natural resources increase, so do the negative impacts on Earth unless the activities
and technologies involved are engineered otherwise.
Water and the Atmosphere SE/TE: 4, Planet Diary – How Much Water Do You Use? TE Only:
29E, Enrich – The Shrinking Everglades
Ecology and the Environment SE/TE:
15–17, What Factors Limit Population Growth 88, Population Growth
95, Why Are Natural Resources Important? 96, Apply It!
98–101, Human Population Growth 101, Population Growth and Natural Resources 101, Identify the Main Idea 110, Figure 2 – Keystone Otters 129, Development
129, Figure 1 – Land Use
Crosscutting Concepts
Cause and Effect Cause and effect relationships may be used to
predict phenomena in natural or designed systems.
Water and the Atmosphere SE/TE: 191, Greenhouse Effect 191, Figure 1 – Greenhouse Effect 192, Effects of Global Warming
192, Figure 3 – Sea Level Rise
Ecology and the Environment SE/TE: 101, Identify the Main Idea
110, Figure 2 – Keystone Otters 122, Sustainable Seafood 131, Soil Use Problems 148–149, Figure 6 – The Ozone Hole 149, What’s Being Done
143–146, What Causes Outdoor
and Indoor Air Pollution? 154–155, What Are the Major Sources of Water Pollution? 161, Apply It! TE Only: 97E, Enrich – Keeping Water
Clean 133E, Enrich – The Copper Basin 167E, Enrich – Fishing on Georges Bank

A Correlation of Interactive Science Grades 6-8 Modules, ©2016 Digital Refreshment
to the Next Generation Science Standards for Middle School
SE = Student Edition; TE = Teacher’s Edition; TLR = Teacher’s Lab Resource 119
TE Only: 17, Differentiated Instruction – L1 Classroom Density 88, 21st Century Learning
96, Teach With Visuals 97, Differentiated Instruction – L1 Calculate Your Ecological Footprint 98A, Content Refresher – Human Population Studies 101, 21st Century Learning
101, Differentiated Instruction – L1 Medical Care and Human Survival 124, From the Author
TLR: 25, Elbow Room 75, Using Resources
76, Natural Resources 86, Doubling Time 87, Human Population Growth 108, Land Use
TLR: 25, Elbow Room 89, What Happened to the Tuna? 91, Managing Fisheries
93, Modeling Keystone Species 107, How Does Mining Affect the Land? 109, Modeling Soil Conservation
--------------------------------------------------- Connections to Engineering, Technology,
and Applications of Science
Influence of Science, Engineering, and Technology on Society and the Natural
World All human activity draws on natural resources
and has both short and long-term consequences, positive as well as negative, for the health of people and the natural environment. (MS-ESS3-4)
Water and the Atmosphere SE/TE:
126, My Planet Diary – Cloud Seeding 192, Figure 2 – Carbon Dioxide Levels 194, Limiting Global Warming 194, Apply It!
TLR: What Is the Greenhouse Effect?
Ecology and the Environment SE/TE:
104, Figure 2 – The Harvest 107, Figure 3 – Aquaculture 107E, Enrich – Modern Fishing Equipment 114, Figure 5 – Habitat Fragmentation 122, Sustainable Seafood
128–129, How Do People Use Land? 131, Figure 3 – Terracing 133, Figure 4 – Land Reclamation 148–149, Figure 6 – The Ozone Hole 149, What’s Being Done
150, How Can Air Pollution Be
Reduced? 156–157, How Can Water Pollution Be Reduced? 156, Figure 3 – Wastewater Treatment
157, Apply It! 163, Figure 2 – Desalination Process 172, Old MacDonald Had a Satellite 206, How Low Is Low Impact? 207, Hydrokinetic Energy

A Correlation of Interactive Science Grades 6-8 Modules, ©2016 Digital Refreshment
to the Next Generation Science Standards for Middle School
SE = Student Edition; TE = Teacher’s Edition; TLR = Teacher’s Lab Resource 120
TE Only: 97, Differentiated Instruction – L1 Ecological Footprints and Food Choices
133E, Enrich – The Copper Basin 159F, Enrich – Sewage Treatment TLR: 153, Producing Electricity --------------------------------------------
Connections to Nature of Science Science Addresses Questions About the
Natural and Material World Science knowledge can describe consequences
of actions but does not make the decisions that society takes. (MS-ESS3-4)
Water and the Atmosphere SE/TE: 192, Levels of Greenhouse Gases
192, Figure 2 – Carbon Dioxide Levels
Ecology and the Environment SE/TE:
101, Identify the Main Idea 104, Logging Methods 107, Fishing Methods 110, Figure 2 – Keystone Otters 122, Sustainable Seafood 131, Soil Use Problems 135–139, What Are Three Solid
Waste Disposal Methods?
148–149, Figure 6 – Ozone Hole 148–149, Figure 6 – Ozone Hole 149, What’s Being Done 143–146, What Causes Outdoor and Indoor Air Pollution?
154–155, What Are the Major Sources of Water Pollution? 161, Apply It! 198–201, How Can We Ensure There Will Be Enough Energy for the Future?
TE Only:
97, Differentiated Instruction – L1 Ecological Footprints,Food Choices 97E, Enrich-Keeping Water Clean
133E, Enrich – The Copper Basin 167E, Enrich – Fishing on Georges Bank TLR:
89, What Happened to the Tuna? 91, Managing Fisheries 93, Modeling Keystone Species 107, How Does Mining Affect the Land? 109, Modeling Soil Conservation

A Correlation of Interactive Science Grades 6-8 Modules, ©2016 Digital Refreshment
to the Next Generation Science Standards for Middle School
SE = Student Edition; TE = Teacher’s Edition; TLR = Teacher’s Lab Resource 121
MS.Engineering Design MS-ETS1-1 Students who demonstrate understanding can:
Define the criteria and constraints of a design problem with sufficient precision to ensure a successful solution, taking into account relevant scientific principles and potential impacts on people and the natural environment that may limit possible solutions.
INTERACTIVE SCIENCE: Chapter 4, Lesson 2 of the Science and Technology module explores the steps for designing technology. On SE/TE page 128, students obtain information about evaluating constraints of a design. In Apply It!, students model stages of the design process. On SE/TE page 138, Values and Trade-offs, students learn the process of evaluating technology’s risks and benefits, taking long and short term consequences into consideration. On TLR page 118, students
brainstorm possible solutions to a problem and evaluate ideas. In the Ecology and the Environment module, students learn about costs and benefits of making environmental decisions, SE/TE pages 90-91. In Differentiated Instruction, TE page 91, students
present two proposals to solve issues for evaluation. Students compare and contrast the pros and cons of three methods of solid waste disposal on SE/TE pages 135-137.
The performance expectation above was developed using the following elements from the NRC document A Framework for K-12 Science Education:
Science and Engineering Practices
Asking Questions and Defining Problems Asking questions and defining problems in grades 6–8 builds on grades K–5 experiences and progresses to specifying relationships between variables, clarify arguments and models. Define a design problem that can be solved through the development of an object, tool, process or system and includes multiple criteria and constraints, including scientific knowledge that may limit possible solutions.
Science and Technology SE/TE: 128, Apply It!
TE Only: 127, 21st Century Learning, Critical Thinking TLR: 117, Inquiry Warm-Up-Why Redesign? STEM Activity Book
17-20, It’s All Water Under the Dam
Introduction to Chemistry STEMQuest: Hot and Cool Chemistry Design Your Pack
Reflect on Your Pack
Disciplinary Core Ideas
ETS1.A: Defining and Delimiting an Engineering Problem The more precisely a design task’s criteria and constraints can be defined, the more likely it is that the designed solution will be successful. Specification of constraints includes consideration of scientific principles and other relevant knowledge that are likely to limit possible solutions.
Science and Technology SE/TE: 127, Design a Solution 128, Apply it 128, Evaluate Constraints, Apply it!
131, Assess Your Understanding TE Only: 131A, After the Inquiry Warm-Up: Technological Design 131B, Assess Your Understanding 131C, Key Concept Summary TLR:
117, Inquiry Warm-Up-Why
Redesign? 118, Quick Lab-Watch Ideas take Off Ecology and the Environment SE/TE:
135-137, What Are Three Solid Waste Disposal Methods? TE Only: 137, Differentiated Instruction
Crosscutting Concepts
Influence of Science, Engineering, and Technology on Society and the Natural World All human activity draws on natural resources and has both short and long-term consequences, positive as well as negative, for the health of people and the natural environment.
Ecology and the Environment
SE/TE: 86-91, Introduction to Environmental Issues
90, Apply It! 91, Figure 3, Weighing Costs and Benefits TE Only: 91, Differentiated Instruction, Multimedia Presentation
TLR: 74, Quick Lab, Comparing Costs and Benefits
The uses of technologies and limitations on their use are driven by individual or societal needs, desires, and values; by the findings of scientific research; and by differences in such factors as climate, natural resources, and economic conditions.
Science and Technology SE/TE: 132-133, How Has Technology
Impacted Society? 134-136, What Are the Consequences of Technology?

A Correlation of Interactive Science Grades 6-8 Modules, ©2016 Digital Refreshment
to the Next Generation Science Standards for Middle School
SE = Student Edition; TE = Teacher’s Edition; TLR = Teacher’s Lab Resource 122
Forces and Energy STEMQuest: Keep Hot Liquids Hot Contain the Heat
Reflect on Your Insulating Container Sound and Light STEMQuest: Design to Stop a Thief An Optimal Optical Solution
Reflect on Your Demonstration Chapter Activities and Projects
15-21, Design and Build a Chair
Introduction to Chemistry STEMQuest: Hot and Cool Chemistry Design Your Pack
Reflect on Your Pack Forces and Energy STEMQuest: Keep Hot Liquids Hot Contain the Heat Reflect on Your Insulating
Container Sound and Light STEMQuest: Design to Stop a
Thief An Optimal Optical Solution Reflect on Your Demonstration
137-139, How Do You Decide Whether to Use a Technology? TE Only: 137, Differentiated Instruction,
Choose Technology 138, 21st Century Learning, Information Literacy TLR: 119, Inquiry-Technology Hunt 120, Quick Lab-Time-Saving Technology
121, Quick Lab-How Does Technology Affect Your Life? 122, Quick Lab-Considering Impacts

A Correlation of Interactive Science Grades 6-8 Modules, ©2016 Digital Refreshment
to the Next Generation Science Standards for Middle School
SE = Student Edition; TE = Teacher’s Edition; TLR = Teacher’s Lab Resource 123
MS.Engineering Design MS-ETS1-2 Students who demonstrate understanding can: Evaluate competing design solutions using a systematic process to determine how well they meet
the criteria and constraints of the problem.
INTERACTIVE SCIENCE: In the Science and Technology module, Chapter 4, Lesson 2, SE/TE pages 124-131, students learn how to design a solution to a problem.
The performance expectation above was developed using the following elements from the NRC document A Framework for K-12 Science Education:
Science and Engineering Practices
Engaging in Argument from Evidence Engaging in argument from evidence in 6–8 builds on K–5 experiences and progresses to constructing a convincing argument that supports or refutes claims for either explanations or solutions about the natural and designed world. Evaluate competing design solutions based on jointly developed and agreed-upon design criteria.
Forces and Energy STEMQuest: Keep Hot Liquids Hot Keep the Heat In Keep the Cold Out Reflect on Your Insulating Container
Sound and Light STEMQuest: Design to Stop a Thief An Optimal Optical Solution Reflect on Your Demonstration
STEM Activity Book 1-4, Shake, Rattle, and Roll
17-20, It’s All Water Under the Dam 37-40, Sail Away Chapter Activities and Projects
218-224, Design and Build an Earthquake Safe-House Scenario-Based Investigations 7-9, This Isn’t Science
Disciplinary Core Ideas
ETS1.B: Developing Possible Solutions There are systematic processes for evaluating solutions with respect to how well they meet the criteria and constraints of a problem.
Science and Technology SE/TE:
127-128, Design a Solution 129, Build a Prototype 130, Troubleshoot and Redesign 131, Communicate the Solution TLR: 117, Inquiry Warm-Up, Why Redesign?
Introduction to Chemistry STEMQuest: Hot and Cool
Chemistry Reflect on Your Pack Forces and Energy STEMQuest: Keep Hot Liquids Hot Keep the Heat In
Keep the Cold Out Reflect on Your Insulating Container Sound and Light STEMQuest: Design to Stop a
Thief An Optimal Optical Solution
Reflect on Your Demonstration STEM Activity Book 1-4, Shake, Rattle, and Roll 17-20, It’s All Water Under the
Dam 37-40, Sail Away Scenario-Based Investigations 7-9, This Isn’t Science

A Correlation of Interactive Science Grades 6-8 Modules, ©2016 Digital Refreshment
to the Next Generation Science Standards for Middle School
SE = Student Edition; TE = Teacher’s Edition; TLR = Teacher’s Lab Resource 124
MS.Engineering Design MS-ETS1-3 Students who demonstrate understanding can: Analyze data from tests to determine similarities and differences among several design solutions to
identify the best characteristics of each that can be combined into a new solution to better meet the criteria for success.
INTERACTIVE SCIENCE: In the Science and Technology module, Chapter 4, Lesson 2, SE/TE pages 124-131, students learn how to design a solution to a problem and redesign if necessary.
In “Why Redesign?” on TLR page 117, students design a boat and then redesign the boat based on observations of the first design.
The performance expectation above was developed using the following elements from the NRC document A Framework for K-12 Science Education:
Science and Engineering Practices
Analyzing and Interpreting Data Analyzing data in 6–8 builds on K–5 experiences and progresses to extending quantitative analysis to investigations, distinguishing between correlation and causation, and basic statistical techniques of data and error analysis. Analyze and interpret data to determine similarities and differences in findings.
STEM Activity Book
9-12, I Wouldn’t Drink That 21-24, Energy Boosters 45-48, Optical Security
Disciplinary Core Ideas
ETS1.B: Developing Possible Solutions There are systematic processes for evaluating solutions with respect to how well they meet the criteria and constraints of a problem.
Science and Technology SE/TE: 127-128, Design a Solution 129, Build a Prototype 130, Troubleshoot and Redesign 131, Communicate the Solution TLR:
117, Inquiry Warm-Up, Why Redesign?
Introduction to Chemistry
STEMQuest: Hot and Cool
Chemistry Reflect on Your Pack
Forces and Energy STEMQuest: Keep Hot Liquids Hot Keep the Cold Out
Reflect on Your Insulating Container Sound and Light STEMQuest: Design to Stop a Thief An Optimal Optical Solution
Reflect on Your Demonstration
Sometimes parts of different solutions can be combined to create a solution that is better than any of its predecessors.
Science and Technology SE/TE: 130, Troubleshoot and Redesign TLR: 117, Inquiry Warm-Up, Why Redesign?

A Correlation of Interactive Science Grades 6-8 Modules, ©2016 Digital Refreshment
to the Next Generation Science Standards for Middle School
SE = Student Edition; TE = Teacher’s Edition; TLR = Teacher’s Lab Resource 125
Introduction to Chemistry STEMQuest: Hot and Cool Chemistry Reflect on Your Pack
Forces and Energy STEMQuest: Keep Hot Liquids Hot Keep the Cold Out Reflect on Your Insulating Container
Sound and Light STEMQuest: Design to Stop a Thief
An Optimal Optical Solution Reflect on Your Demonstration ETS1.C: Optimizing the Design Solution Although one design may not perform the best across all tests, identifying the characteristics of the design that performed the best in each test can provide useful information for the redesign process—that is, some of those characteristics may be incorporated into the new design.
Science and Technology
SE/TE: 130, Troubleshoot and Redesign 130, Figure 6-Troubleshooting
and Redesigning TE Only: 130, Lead a Discussion, Identifying Problems and
Redesigning 131A, After the Inquiry Warm-Up: Technological Design 131E, Enrich, A Redesigned Mouse TLR: 117, Inquiry Warm-Up, Why
Redesign?
Introduction to Chemistry
STEMQuest: Hot and Cool Chemistry
Pack Building Reflect on Your Pack Forces and Energy STEMQuest: Keep Hot Liquids
Hot Keep the Cold Out Reflect on Your Insulating Container

A Correlation of Interactive Science Grades 6-8 Modules, ©2016 Digital Refreshment
to the Next Generation Science Standards for Middle School
SE = Student Edition; TE = Teacher’s Edition; TLR = Teacher’s Lab Resource 126
Sound and Light STEMQuest: Design to Stop a Thief An Optimal Optical Solution
Reflect on Your Demonstration

A Correlation of Interactive Science Grades 6-8 Modules, ©2016 Digital Refreshment
to the Next Generation Science Standards for Middle School
SE = Student Edition; TE = Teacher’s Edition; TLR = Teacher’s Lab Resource 127
MS.Engineering Design MS-ETS1-4 Students who demonstrate understanding can: Develop a model to generate data for iterative testing and modification of a proposed object, tool, or
process such that an optimal design can be achieved.
INTERACTIVE SCIENCE: In the Science and Technology module, Chapter 3, Lesson 4, SE/TE pages 92-99, students learn how to use models and systems.
The performance expectation above was developed using the following elements from the NRC document A Framework for K-12 Science Education:
Science and Engineering Practices
Developing and Using Models Modeling in 6–8 builds on K–5 experiences and progresses to developing, using, and revising models to describe, test, and predict more abstract phenomena and design systems. Develop a model to generate data to test ideas about designed systems, including those representing inputs and outputs.
Science and Technology SE/TE: 98, Figure 5, How Arctic Sea Ice Melts TE Only: 97, 21st Century Learning, Creativity
99, Build Inquiry, Earth Systems
Model TLR: 89, Quick Lab, Systems 108-116, Lab Investigation, Investigating a Technological System
STEM Activity Book 1-4, Shake, Rattle, and Roll Chapter Activities and Projects
295-301, Design and Build an Erosion-Proof Beach 435-441, Design and Build an Optical Instrument
Disciplinary Core Ideas
ETS1.B: Developing Possible Solutions A solution needs to be tested, and then modified on the basis of the test results, in order to improve it.
Science and Technology SE/TE: 130, Troubleshoot and Redesign
Introduction to Chemistry STEMQuest: Hot and Cool Chemistry Pack Building Reflect on Your Pack
Forces and Energy STEMQuest: Keep Hot Liquids
Hot Keep the Cold Out Reflect on Your Insulating Container
Sound and Light STEMQuest: Design to Stop a Thief An Optimal Optical Solution Reflect on Your Demonstration
STEM Activity Book 13-16, Life on Mars 21-24, Energy Boosters 33-36, Crystal Clear
45-48, Optical Security
Chapter Activities and Projects 435-441, Design and Build an Optical Instrument

A Correlation of Interactive Science Grades 6-8 Modules, ©2016 Digital Refreshment
to the Next Generation Science Standards for Middle School
SE = Student Edition; TE = Teacher’s Edition; TLR = Teacher’s Lab Resource 128
Models of all kinds are important for testing solutions.
Science and Technology SE/TE: 92-99, Models as Tools in Science TE Only: 98, Lead a Discussion, Model Storms
99, Differentiated Instruction, Telephone Model 99F, Enrich, A Scientific Model TLR: 89, Quick Lab, Systems 90, Quick Lab, Models in Nature ETS1.C: Optimizing the Design Solution The iterative process of testing the most promising solutions and modifying what is proposed on the basis of the test results leads to greater refinement and ultimately to an optimal solution.
Introduction to Chemistry STEMQuest: Hot and Cool Chemistry Pack Building Reflect on Your Pack
Forces and Energy STEMQuest: Keep Hot Liquids Hot
Keep the Cold Out Reflect on Your Insulating
Container Sound and Light STEMQuest: Design to Stop a Thief An Optimal Optical Solution Reflect on Your Demonstration
STEM Activity Book 21-24, Energy Boosters
37-40, Sail Away
Chapter Activities and
Projects 15-21, Design and Build a Chair


