Interagency Transportation, Land Use, and Climate Change Initiative Central New Mexico Climate Change Scenario Planning Project The National Transportation Systems Center Advancing transportation innovation for the public good U.S. Department of Transportation Office of the Secretary of Transportation John A. Volpe National Transportation Systems Center Ben Rasmussen (Volpe) and Aaron Sussman (MRCOG) August 12, 2015
Transcript
Interagency Transportation, Land Use, and Climate Change Initiative
Central New Mexico Climate Change Scenario Planning Project
The National Transportation Systems Center
Advancing transportation innovation for the public good
U.S. Department of Transportation Office of the Secretary of Transportation John A. Volpe National Transportation Systems Center
Ben Rasmussen (Volpe) and Aaron Sussman (MRCOG) August 12, 2015
2
Purpose/History Purpose
Focus: 50% adaptation and 50% mitigation Uses scenario planning as a framework Integrates into LRTP Involves multiple agencies with different priorities; not just transportation
Two locations
Coast: pilot project on Cape Cod, Massachusetts (2010-11) Non-coastal: Central New Mexico (2013-15)
Key differences
Additional modeling software v. existing modeling software State of the practice
3
Partnerships Federal funding sponsors
Supporting federal agencies
Regional and local agencies / governments
Private and academic entities
4
Central New Mexico
5
Climate Change Adaptation Process Identify:
Regional climate change impacts The effect of these impacts on transportation, land use, and natural resources The effect of transportation and land use policy choices on climate change
impacts
Example adaptation strategies: Mixed use/density Buffers
How will these strategies be affected by climate change impacts? How will these strategies improve or reduce resiliency?
6
Climate Change Mitigation Process Estimate (for each development scenario):
Vehicle miles traveled GHG emissions
Example mitigation strategies: Mixed use/density Alternative fuels Transit Nonmotorized investments
7
Research Context FHWA Adaptation Framework
& Climate Resilience Pilots FHWA Scenario Planning
Guidebook & Peer Exchanges Cape Cod Pilot Project
Guidebook NPS Climate Change Scenario
Planning Handbook BoR Climate Change Report Volpe Climate Futures Tool Studies on GHG Emission
Reduction Strategies
8
Research Context
Research on Climate Change
Mitigation
Research on Climate Change
Adaptation
Research on Scenario Planning
This Project
9
Successful Methodologies Integrated land use and travel demand models Off-model GHG analysis Analysis of the effect of different land use patterns on water consumption
using data from the local water utility Integrated climate analysis into the transportation plan Leveraged partnerships and existing studies
10
Recommendations for Future Research Plan for climate change beyond traditional planning time frames Conduct early exploratory analysis well before formal plans need to be
developed Develop a complete picture of climate change impacts specific to the
region before developing conceptual land use and transportation scenarios
Mid-Region Council of Governments
Integrating Climate Change Analysis into the
Metropolitan Transportation Planning Process
Aaron Sussman, AICP Senior Planner
Albuquerque and Central NM
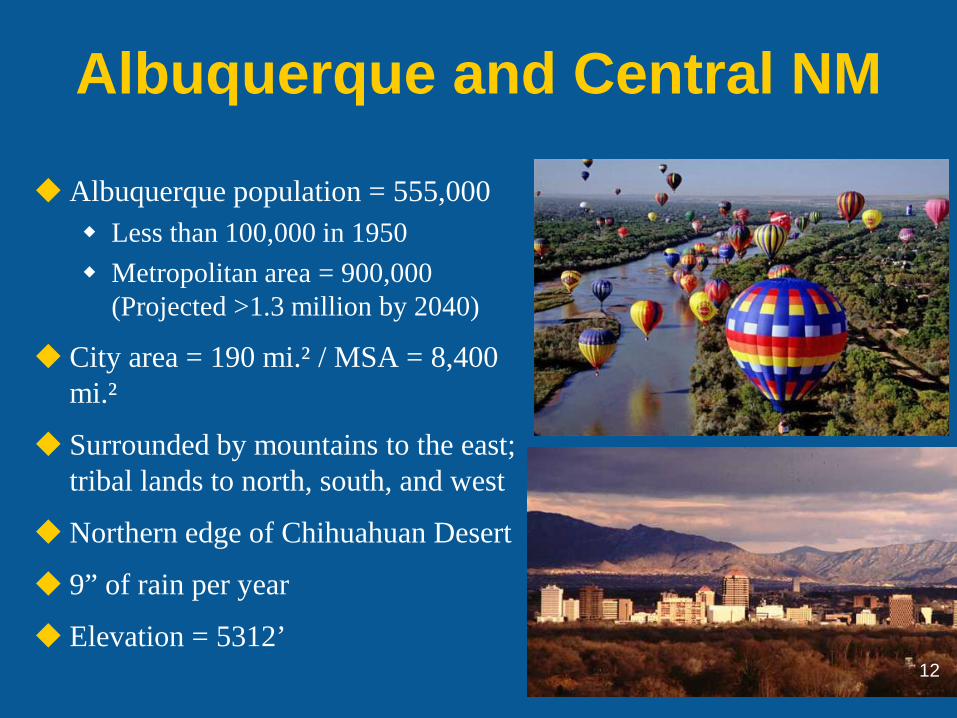
Albuquerque population = 555,000 Less than 100,000 in 1950 Metropolitan area = 900,000
(Projected >1.3 million by 2040)
City area = 190 mi.² / MSA = 8,400 mi.²
Surrounded by mountains to the east; tribal lands to north, south, and west
Infrastructure differences: Same roadway network Built-out transit network
Same levels of population and employment growth as the Trend Scenario 26
Mid-Region Council of Governments
Scenario Planning Modeling Process
UrbanSim – market-based land use forecasting tool
Cube – four-step travel demand model
Integrated models with feedback loop
2012 base year, 2025 iteration, 2040 forecast
27
Mid-Region Council of Governments
Scenario Planning Modeling Process
Carrots rather than sticks approach to future development Apply “shifters” to incentivize development in certain locations Growth was not forced or allocated manually
Key question: Does emphasizing growth in activity centers and near transit reduce development in at-risk locations?
Evaluate distribution of growth and resulting transportation conditions
28
Mid-Region Council of Governments
Volume: Trend vs. Preferred Congestion: 2040 Preferred
29
Mid-Region Council of Governments
Differences: Trend vs. Preferred
Average speeds ↑ 15%
Commute time ↓ 18%
Hours traveled ↓ 17%
Miles traveled ↓ 4%
30
Mid-Region Council of Governments
Development Footprint
5% reduction in overall number of acres consumed in 2040 in the Preferred Scenario compared to the Trend Scenario
12,600 fewer acres of residential development
21%
15%
0%
5%
10%
15%
20%
25%
Trend Preferred
New Land Developed
31
Mid-Region Council of Governments
Climate Change-Related Evaluation Measures
Wildland-Urban Interface (wildfire risk area)
FEMA-designated 100-year floodplains
Crucial Habitat Assessment Tool
Water consumption
CO₂ emissions
32
Mid-Region Council of Governments
Wildland-Urban Interface
84%
63%
40%
45%
50%
55%
60%
65%
70%
75%
80%
85%
90%
Trend Preferred
Housing + Employment Growth – Intermix Area Only
33
Mid-Region Council of Governments
100-Year Floodplains What we hoped to do: Quantify potential increase in
flood risks
Identify areas that will be at risk as climate conditions change
Measure current and future development on new high-risk areas
34
Mid-Region Council of Governments
100-Year Floodplains
What we ended up doing: Case study: potential
changes to 100-year 24-hour design storm on Calabacillas Arroyo
10% increase in precip. 25% increase in flow
25% increase in precip. 75% increase in flow
35
Mid-Region Council of Governments
High Flood Risk Area
56%
52%
40%
45%
50%
55%
60%
Trend Preferred
Housing + Employment in 100-Year Floodplains
What we ended up doing: Measure current and future
development on existing flood plains only
Reduce zoning capacity in floodplains by 20% (minimal impact)
36
Mid-Region Council of Governments
Crucial Habitat Areas Western Governors Association
tool – ranking for 1-mi² hexagons
Overlay land use with crucial habitat scores
Challenges: Most critical locations are in the
urban core - Lowest risk areas also those subject to potential sprawl
Not much difference between scenarios
Conclusion: Better to develop more intensively in areas where development already exists
37
Mid-Region Council of Governments
Water Consumption How we grow impacts how
much water we consume
Analyze consumption patterns by land use type and housing mix: Single-family vs multi-family Large-lot vs small-lot
Daily residential consumption dropping locally and nationally 1994: 250 gallons per capita Today: ~135 gallons per capita
Source: Albuquerque Bernalillo County Water Utility Authority
0
50
100
150
200
1960 1970 1980 1990 2000 2010 2020
Res
iden
tial W
ater
C
onsu
mpt
ion
(uni
ts)
Year Housing Unit Was Built
Single Family Multi Family
Daily Gallons per Capita. 1995-2024
38
Mid-Region Council of Governments
Water Consumption Multi-family housing units consume
less water on a per-capita basis
Correlation between lot size and consumption for single-family homes
Determine water consumption per acre for different land uses
5.5 billion fewer gallons consumed annually for residential purposes in Preferred Scenario
45%
36%
0%
5%
10%
15%
20%
25%
30%
35%
40%
45%
50%
Trend Preferred
Residential Water Consumption
39
Mid-Region Council of Governments
Emissions Reduction Strategies
Preferred Scenario Components: Expanded transit service
Transit-oriented development
Land use / increased density Zoning Infill Development incentives
Many other strategies are discussed in the 2040 MTP but could not be included in modeling environment
Additional analysis conducted by project team
40
Mid-Region Council of Governments
GHG Emissions Preferred Scenario:
Reduction in VMT, VHT, VHD
Reduction in river crossing trips
Increase in systemwide speed
Increase in proximity to jobs, activity centers
Increase in transit usage
42%
30%
0%
5%
10%
15%
20%
25%
30%
35%
40%
45%
Trend Preferred
Mobile-Source CO₂ Emissions
41
Mid-Region Council of Governments
Changes in Preferred Scenario Compared to
Trend Scenario New Land Developed -5% Vehicle Miles Traveled -4% CO₂ Emissions -8% Residential Water Consumption -6% Growth in Flood Risk Areas -2% Growth in Fire Risk Areas -10% Development in Crucial Habitat Areas -1%
42
Mid-Region Council of Governments
Lessons Learned Tying scenario planning to metropolitan transportation planning process has its pros and cons
Pros Structure of MTP (built-in
forecasting) ensures scenario planning is linked to policy decisions
Market-based modeling tools generated realistic scenarios that were immediately respected
Cons MTP development process
is constrained by member agency policies and investment decisions
Market-based modeling approach not utilized to diagnose necessary changes in region
43
Mid-Region Council of Governments
Lessons Learned / Discussion Land use and transportation scenarios lend themselves to
creative spatial analysis
Analysis requires understanding of changing conditions and impacts to natural features (e.g. floodplains, fire risk areas)
Creating an inventory of vulnerable infrastructure and at-risk locations is a challenging but critical first step
Few agencies are linking climate change impacts with development policies and transportation decision-making, so the MPO has a role to play
Should we talk about climate change directly, or co-benefits?
44
Mid-Region Council of Governments
Project Benefits Climate change as framing device for scenario planning and a
way to introduce new measures
Connection between transportation, land use, and water
Create a sense of urgency
Agency connections Project intended to integrate federal-land management areas into MPO planning New partnerships:
Bureau of Reclamation Army Corps of Engineers Water Utility Authority
University of New Mexico Sandia National Labs
45
46
Downscaled Climate Data Processing Tool
Variables
Precipitation (mm/day)
Maximum daily temperature (°C)
Minimum daily temperature (°C)
Average daily temperature (°C)—derived by averaging max & min
Average daily wind speed
Projections Range
1950-2099
Downscaled (fine spatial resolution translations) of CMIP3 climate projections Based on 112 model runs: 9 models, 3 emissions scenarios Supplied by Bureau of Reclamation Technical Services Center Updated CMIP5 projections recently became available (July 2014)
47
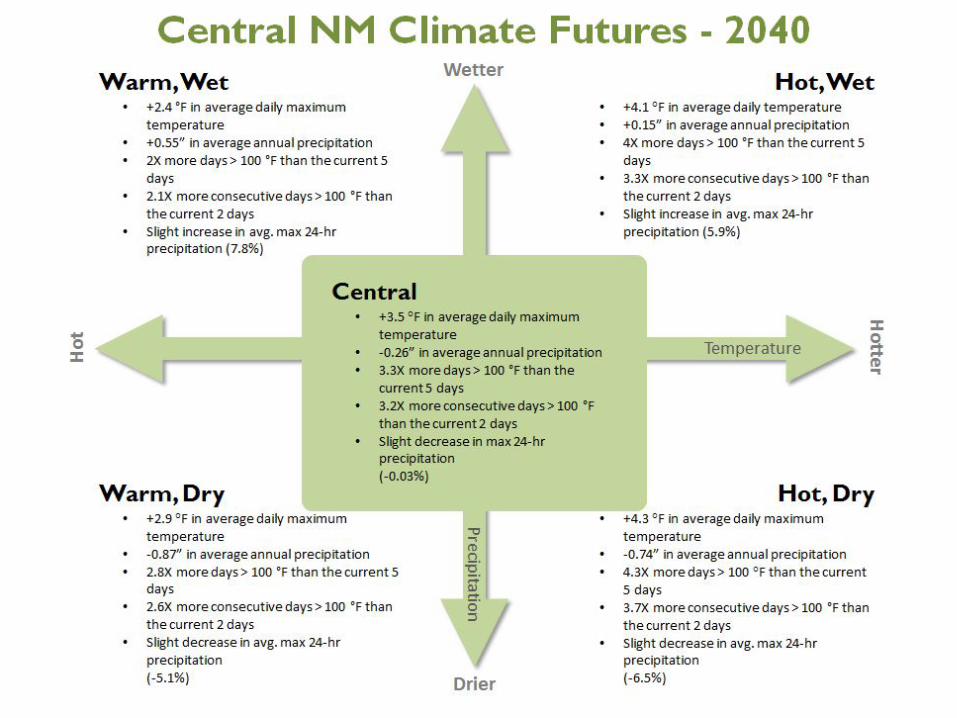
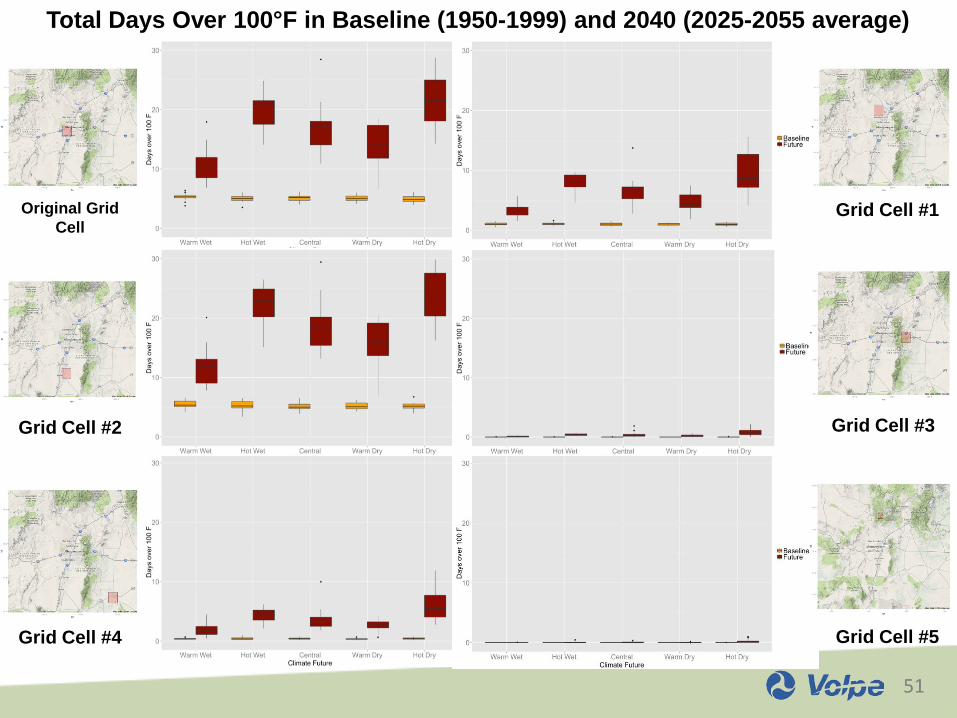
Future 2 Hot Wet
Future 1 Warm Wet
Future 4 Warm Dry
Future 5 Hot Dry
Future 3 Central
48
MRCOG-Identified Grid Cells of Interest
Original Grid Cell SW quadrant of
Albuquerque (35.0625, -106.6875) Elevation: 4,940 ft.
49
50
MRCOG-Identified Grid Cells of Interest
Original Grid Cell SW quadrant of
Albuquerque (35.0625, -106.6875) Elevation: 4,940 ft.
Grid Cell #1 Rio Rancho area, N of
Albuquerque (35.3125, -106.6875) Elevation: 5,615 ft.
Grid Cell #2 Los Lunas area, S of
Albuquerque (34.6875, -106.6875) Elevation: 5,005 ft.
Grid Cell #5 Santa Fe National Forest,
N of Albuquerque (35.8125, -106.6875) Elevation: 7,435 ft.
Grid Cell #4 General desert area, SE
of Albuquerque (34.5625, -106.0625) Elevation: 6,155 ft.
Grid Cell #3 Cibola National Forest, E
of Albuquerque (35.0625, -106.3125) Elevation: 7,025 ft.
51
Original Grid Cell
Grid Cell #1
Grid Cell #2
Grid Cell #4
Grid Cell #3
Grid Cell #5
Total Days Over 100°F in Baseline (1950-1999) and 2040 (2025-2055 average)
52
Mitigation Component Greenhouse Gas Mitigation Strategies
Analysis Completed During Scenario Planning Workshop Phase Higher Priority Strategies Evaluated Post-Workshop Strategies to be Discussed in Final Report
Summary of Work by Department of Civil Engineering at the University of New Mexico Dr. Gregory Rowangould Mohammad Tayarani Amir Poorafakhraei
Travel demand model estimates bike trips based solely on household characteristics and trip distance; it does not factor in presence of bicycle or pedestrian facilities
Analysis of full build out of City of Albuquerque’s Bicycle Plan Comparison to Preferred Scenario:
Additional 0.4 percent decrease in VMT and GHG emissions Cost of providing bike lanes and paths is small
59
Incident Management
Incident management programs should reduce GHG emissions if they reduce delays and increase speed
No studies exist that quantify GHG emissions reduction from incident management programs
0
250
500
750
1,000
1,250
1,500
1,750
2,000
2,250
2,500
0 10 20 30 40 50 60 70 8020
40 C
arbo
n D
ioxi
de E
mis
sion
s (gr
ams/
mile
)
Average Speed (Miles per Hour)
60
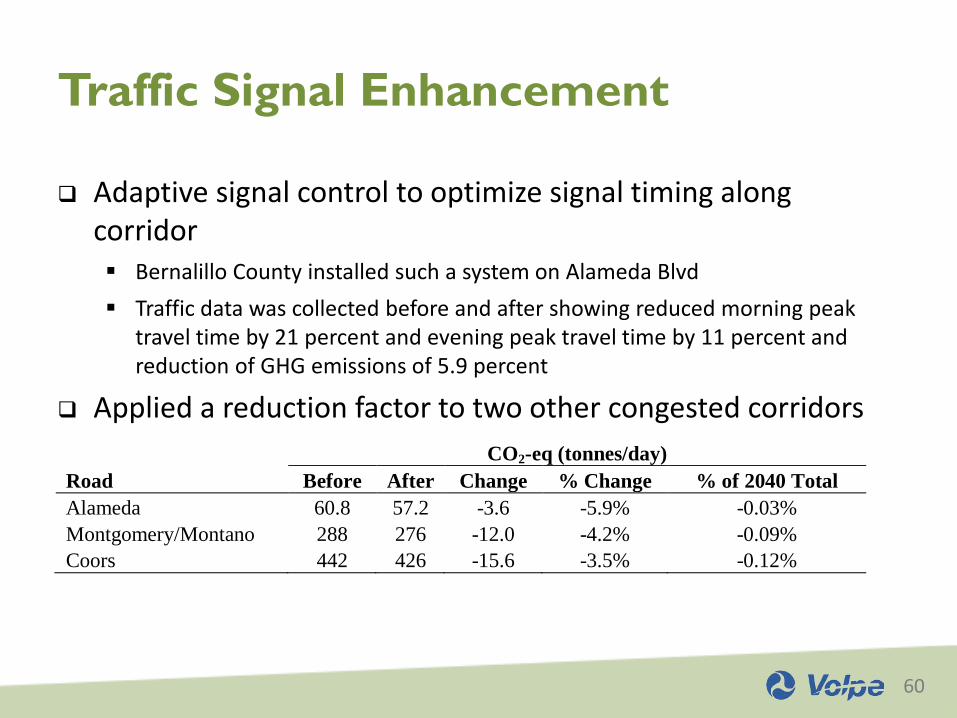
Traffic Signal Enhancement
Adaptive signal control to optimize signal timing along corridor Bernalillo County installed such a system on Alameda Blvd Traffic data was collected before and after showing reduced morning peak
travel time by 21 percent and evening peak travel time by 11 percent and reduction of GHG emissions of 5.9 percent
Applied a reduction factor to two other congested corridors
CO2-eq (tonnes/day)
Road Before After Change % Change % of 2040 Total Alameda 60.8 57.2 -3.6 -5.9% -0.03% Montgomery/Montano 288 276 -12.0 -4.2% -0.09% Coors 442 426 -15.6 -3.5% -0.12%
61
Roadway Connectivity
Street grids provide shorter path options for travel than less connected networks with cul-de-sacs and dead ends and provide better bicycle/walk/transit conditions
Prior studies indicate a VMT elasticity of -0.12 for both: Intersection density Proportion of four-way intersections
Four districts of the metropolitan area were evaluated
Neighborhood Area (km2) Intersections Intersection