Page 1
Interannual Climate Variability over the Tropical Pacific Ocean Induced by the IndianOcean Dipole through the Indonesian Throughflow
DONGLIANG YUAN, HUI ZHOU, AND XIA ZHAO
Key Laboratory of Ocean Circulation and Waves, and Institute of Oceanology, Chinese Academy of Sciences, Qingdao, China
(Manuscript received 17 February 2012, in final form 29 October 2012)
ABSTRACT
The authors’ previous dynamical study has suggested a link between the Indian and Pacific Ocean in-
terannual climate variations through the transport variations of the Indonesian Throughflow. In this study, the
consistency of this oceanic channel link with observations is investigated using correlation analyses of ob-
served ocean temperature, sea surface height, and surface wind data. The analyses show significant lag cor-
relations between the sea surface temperature anomalies (SSTA) in the southeastern tropical IndianOcean in
fall and those in the eastern Pacific cold tongue in the following summer through fall seasons, suggesting
potential predictability of ENSO events beyond the period of 1 yr. The dynamics of this teleconnection seem
not through the atmospheric bridge, because the wind anomalies in the far western equatorial Pacific in fall
have insignificant correlations with the cold tongue anomalies at time lags beyond one season. Correlation
analyses between the sea surface height anomalies (SSHA) in the southeastern tropical Indian Ocean and
those over the Indo-Pacific basin suggest eastward propagation of the upwelling anomalies from the Indian
Ocean into the equatorial Pacific Ocean through the Indonesian Seas. Correlations in the subsurface tem-
perature in the equatorial vertical section of the Pacific Ocean confirm the propagation. In spite of the lim-
itation of the short time series of observations available, the study seems to suggest that the ocean channel
connection between the two basins is important for the evolution and predictability of ENSO.
1. Introduction
Recently, Yuan et al. (2011) used numerical experi-
ments to demonstrate that tropical Indian Ocean in-
terannual variations force significant coupled variability
in the tropical Pacific Ocean through the heat transport
variability of the Indonesian Throughflow (ITF). In this
study, we use observational data to examine the con-
sistency of the dynamics with observations.
The El Nino–South Oscillation (ENSO) phenomenon
refers to the interannual irregular episodes of anoma-
lous warming and cooling in the eastern equatorial Pa-
cific, which are called El Nino and La Nina events,
respectively, and the associated atmosphere surface
pressure differences between the western and the east-
ern equatorial Pacific Ocean. Indian Ocean dipole (IOD)
events are the interannual out-of-phase variability be-
tween the western and eastern equatorial Indian Ocean
sea surface temperature anomalies (SSTA) (Webster
et al. 1999; Saji et al. 1999). It is widely recognized that
SSTA over the tropical Indian Ocean and over the
tropical Pacific Ocean influence each other through the
atmospheric Walker circulation (Wu and Meng 1998;
Lau and Nath 2000, 2003; Alexander et al. 2002; Lau
et al. 2005;Wu andKirtman 2004, Annamalai et al. 2005;
Behera et al. 2006). The role of the oceanic dynamics
associated with the variability of the ITF, however, has
been largely overlooked in the published literature in
the past.
Existing studies have suggested a significant influence
of Indian Ocean variations on ENSO predictability
(Yamagata and Masumoto 1989; Clarke and Van
Gorder 2003; Behera and Yamagata 2003; Kug et al.
2006). Recent studies have shown that ENSO can be
predicted beyond the spring predictability barrier if
IOD is used as a precursor or a driving force (e.g., Luo
et al. 2010; Izumo et al. 2010). The dynamics of the en-
hanced predictability have been attributed to the at-
mospheric bridge in the past. The hypothesis suggests
that increased convection in the eastern tropical Indian
Ocean during a negative IOD event speeds up the
Corresponding author address: Dongliang Yuan, Institute of
Oceanology, Chinese Academy of Sciences CASKey Lab of Ocean
Circulation and Waves, 7 Nanhai Road, Qingdao 266071, China.
E-mail: [email protected]
1 MAY 2013 YUAN ET AL . 2845
DOI: 10.1175/JCLI-D-12-00117.1
� 2013 American Meteorological Society
Page 2
Walker circulation (easterly anomalies over the equa-
torial Pacific and westerly anomaly over the Indian
Ocean) in fall, which generates anomalous warming in
the eastern Pacific 1 yr later through the advective–
reflective mechanism of Picaut et al. (1997) and vice
versa during a positive IOD event. Lately, based on
numerical experiments, Yuan et al. (2011) have sug-
gested that the ITF variability plays an important role in
the forcing of the interannual variations of the tropical
Pacific Ocean by IOD.
Using a hierarchy of numerical models, Yuan et al.
(2011) have demonstrated that the upwelling anomalies
in the tropical eastern Indian Ocean during IOD events
are able to penetrate into the equatorial Pacific Ocean
through the Indonesian Seas. Numerical experiments
using a 1.5-layer, reduced-gravity model with very high
resolution in the Indonesian Seas area to resolve all the
channels of the Maritime Continent have indicated
clearly that the Indian Ocean’s equatorial Kelvin waves
can reach the equatorial Pacific through the Indonesian
Seas’ channels. Similar penetrations of the IndianOcean
interannual circulation signals into the Pacific Ocean
through the Indonesian Seas have also been verified
using an ocean general circulation model in that study.
Experiments using a coupled general circulation model
have shown that the ITF variabilities driven by both
ENSO and IOD force thermocline depth anomalies
in the western Pacific warm pool, which influence the
SSTA in the eastern Pacific cold tongue in the next
summer through fall following the IOD event.
The ITF refers to the oceanic transport from the
western Pacific Ocean to the southeastern Indian Ocean
through the porous and irregular Indonesian Seas. The
estimated total and partial ITF transports from channel
measurements and from repeated expendable bathy-
thermograph (XBT) measurements along a line between
western Australia and the Java island (the so-called IX1
line) range from below 0 (from the IndianOcean toward
the Pacific) to over 20 Sv (1 Sv [ 106 m3 s21) into
the Indian Ocean, with a mean ITF transport of about
10 Sv (MacDonald 1998; Wijffels et al. 2008). The
heat transport of the ITF is estimated between 0.5 PW
FIG. 1. Lag correlations between SSTA in the southeastern tropical Indian Ocean in fall
and tropical SSTA in different seasons over the period of 1990–2009: (a) winter (December–
February of the following year), (b) spring (March–May), (c) summer (June–August), and
(d) fall (September–November) of the following year. The contour interval is 0.3. Shading
indicates positive and negative correlations above the 95% significance level.
2846 JOURNAL OF CL IMATE VOLUME 26
Page 3
(1 PW 5 1015 W) (Vranes et al. 2002) and 1.4 PW
(Ganachaud and Wunsch 2000), which is comparable to
the total surface net heat flux over the northern Indian
Ocean and into the western Pacific warm pool (Webster
et al. 1998). These large transports and variability sug-
gest the important role of the ITF in the heat budget of
the western Pacific warm pool.
Wyrtki (1987) proposed that the ITF is driven by the
pressure gradient between the western Pacific and the
eastern Indian Ocean across the Indonesian Seas. Nof
(1996) presented an analytic solution showing that the
ITF is driven by the pressure head in the western Pacific
Ocean generated by the nonlinear collision of the
western boundary currents. The ITF transport is ob-
served to decreases during El Nino and increases during
La Nina (Meyers 1996; Gordon et al. 1999; Fieux et al.
1996), the dynamics of which are believed to be related
to the leaky reflection of the equatorial Rossby waves at
the Pacific western boundary (Clarke and Liu 1994;
Wijffels and Meyers 2004). There are also studies sug-
gesting significant non-ENSO signals in the ITF transport
originating from the tropical Indian Ocean (Murtugudde
et al. 1998; Qiu et al. 1999; Sprintall et al. 2000; Molcard
et al. 2001).
So far, most of the flow measurements made in the
major channels of the Indonesian Seas for ITF to enter
the eastern Indian Ocean are of short duration (Gordon
et al. 1999, 2008; Cresswell and Luick 2001; Luick and
Cresswell 2001; Molcard et al. 1994, 1996, 2001). Re-
peated XBT measurements along the IX1 line made
since 1987, however, have provided long time series of
the variations of the ITF transport on the eastern Indian
Ocean side based on the geostrophic balance (Meyer
1996; Wijffels et al. 2008). These time series, together
with the long time series of the sea level, wind, and
surface and subsurface temperature observations over
the Indo-Pacific basin, will be used to investigate the role
of the ITF in connecting IOD with ENSO in this study.
The importance of the oceanic dynamics linking IOD to
the Pacific Ocean climate variations is underlined by the
significant enhancement of the ENSO predictability
beyond the leading time of 1 yr as the Indian Ocean
variability is included in the coupled climate model
forecast.
FIG. 2. Lag correlations between SSTA in the southeastern tropical Indian Ocean in fall and
Indo-Pacific non-ENSO SSTA in different seasons over the period of 1990–2009: (a) winter,
(b) spring, (c) summer, and (d) fall. Shading indicates positive and negative correlations above
the 95% significance level.
1 MAY 2013 YUAN ET AL . 2847
Page 4
The next section describes the data used in this study.
Section 3 presents the results of the lag correlation
analyses based on the observational and reanalysis data.
Section 4 contains the discussion and summary of this
study.
2. Data
The sea surface temperature (SST) data used in this
study are the Hadley Centre Sea Ice and Sea Surface
Temperature (HADISST; Rayner et al. 2003) dataset
compiled on a 18 latitude 3 18 longitude grid for the
period of 1990–2009 based on in situ and satellite ob-
servations. The subsurface temperature data are obtained
from the Joint Environmental Data Analysis Center of
the Scripps Institution of Oceanography, which cover
the period of 1990–2003 (White 1995). This archive
contains temperature at 11 levels (0, 20, 40, 60, 80, 120,
160, 200, 240, 300, and 400 m) on a 28 latitude 3 58longitude grid. The sea level observations are the merged
sea surface height anomalies (SSHA) measured by the
satellite altimeter onboard of the Ocean Topography
Experiment (TOPEX)/Poseidon satellite, European
Remote Sensing Satellite (ERS), and Jason-1 since
1993 and are calibrated, merged, and archived by the
Archiving, Validation, and Interpretation of Satellite
Oceanographic data (AVISO) project (ftp://ftp.aviso.
oceanobs.com). For consistency, we will focus on the
data during the period of 1993–2010, when all of the
satellite SST, sea level, and measurements of the sub-
surface temperature of the equatorial Pacific Ocean by
the Tropical Atmosphere Ocean array are available.
The XBT data along the IX1 section have been com-
bined with a statistical temperature/salinity relation
based on historical hydrographic data to estimate the
geostrophic transport of the ITF (Meyers 1996; Wijffels
et al. 2008). The XBT data cover the domain from 358 to58S, from 1008 to 1178E, and from 1987 to 2008. In-
terannual monthly anomalies of the geostrophic trans-
port in reference to the 700-m level of no motion across
the IX1 section are calculated based on the monthly
climatology for the period of 1987–2008. The basic
characteristics of the interannual anomalies and the
climatology remain the same, even if the strong 1997/
98 El Nino and the 1994 IOD are excluded in the
calculation of the climatology. The South Java Current
FIG. 3. Lag correlations between warm pool SSTA in fall and Indo-Pacific SSTA in different
seasons over the period of 1990–2009: (a) winter, (b) spring, (c) summer, and (d) fall. Shading
indicates positive and negative correlations above the 95% significance level.
2848 JOURNAL OF CL IMATE VOLUME 26
Page 5
refers to the transport through the IX1 section north
of 108S.In addition, atmosphere reanalysis data are used to
examine the atmospheric bridge process. The surface
zonal wind data is obtained from the National Centers
for Environmental Prediction–National Center for At-
mospheric Research (NCEP–NCAR) reanalysis data
(Kalnay et al. 1996) for the period of 1990–2009 on
a 2.58 3 2.58 grid. The European Centre for Medium-
Range Weather Forecasts (ECMWF) Re-Analysis for
the period of 1990–2001 (Uppala et al. 2005) is also
used to examine the results.
The IOD mode index (DMI) is calculated as the dif-
ference of SSTA between the western (108S–108N,
508–708E) and eastern (108S–08, 908–1108E) equatorialIndian Ocean defined by Saji et al. (1999). The Nino-
3.4 index is calculated as the average SSTA in the area
of (58S–58N, 1708–1208W). The warm pool SSTA is
averaged over (1308E–1208W and (SST above 28.58C).The surface zonal wind anomalies (SZWA) over the
western Pacific are averaged in the area of (58S–58N,
1308–1508E). The boreal spring is defined as being from
March to May, summer is defined as being from June
to August, fall is defined as being from September to
November, and winter is defined as being from De-
cember to the next February. Boreal seasons are used
throughout the text of this paper.
The interannual anomalies of the subsurface tem-
perature are calculated with their seasonal cycle of
1990–2003 removed. The SSTA and SZWA are in-
terannual anomalies with the monthly climatologies
of 1990–2009 removed. The SSHA are interannual
anomalies with the monthly climatology of 1993–2009
removed. The use of common period time series of
1993–2003, with only 10 yr of data, results in essentially
the same lag correlations, except that the SSTA corre-
lations are not as high above the levels of significance
because of the short time series (figures not shown).
The lag correlation is calculated as the correlation
between the interannual anomalies of fall and the in-
terannual anomalies of other seasons (the following
winter, spring, summer, and fall). The significance
levels are computed based on the Student’s t test. The
signal associated with ENSO is calculated based on
FIG. 4. Lag correlations between SSHA in the southeastern tropical Indian Ocean in fall
and tropical SSHA in different seasons over the period of 1993–2009: (a) winter, (b) spring,
(c) summer, and (d) fall of the following year. The contour interval is 0.2. Shading indicates
positive and negative correlations above the 95% significance level.
1 MAY 2013 YUAN ET AL . 2849
Page 6
a regression against the Nino-3.4 index. A Gaussian fil-
ter with a cutoff period of 13 months was used to smooth
the monthly transport anomalies of ITF, South Java
Current, the surface Ekman flow, theDMI, andNino-3.4
index if necessary.
3. Results
a. Lag correlation of SSTA
The correlations between the area-averaged SSTA
in boreal fall (September through November) in the
southeastern tropical Indian Ocean (08–108S, 908–1108E)and the SSTA over the Indo-Pacific basin in the fol-
lowing winter through fall seasons are calculated
based on the Hadley Center SST data for the period of
1990–2009. The fall SSTA in the southeastern tropical
Indian Ocean are used to represent the eastern pole of
the IOD at its peak. A significant ENSO-type tele-
connection above the 95% significance level is in-
dicated by the negative correlation in the eastern
Pacific cold tongue and by the positive correlation in
the western Pacific warm pool and in the subtropical
northern and southern Pacific in winter (Fig. 1a). In
addition, in the western and central Indian Ocean, the
correlation is negative and above the 95% significance
level, reflecting the influence of the peak IOD phase
in the late fall season.
The significant teleconnection in winter, however,
does not persist beyond the coming spring season. The
correlation between the SSTA in the southeastern
tropical Indian Ocean in fall and the SSTA over the
Pacific basin in the next spring is weak (Fig. 1b), except
for a belt of positive correlation in the central subtrop-
ical southern Pacific Ocean, which diminishes quickly
within the next month or so. The weak correlation in
spring suggests that the atmospheric bridge process be-
tween IOD and ENSO in winter is short lived.
Nevertheless, significant correlation between the SSTA
in the southeastern tropical Indian Ocean in fall and the
cold tongue SSTA reappears in the following summer
and fall seasons (Figs. 1c,d), which is above the 95%
significance level and is very similar to the structure of
the ENSO–IOD teleconnection in winter, except for an
FIG. 5. Lag correlations between SSHA in the southeastern tropical Indian Ocean in fall
and Indo-Pacific non-ENSO SSHA in different seasons over the period of 1993–2009: (a) winter,
(b) spring, (c) summer, and (d) fall. Shading indicates positive and negative correlations above
the 95% significance level.
2850 JOURNAL OF CL IMATE VOLUME 26
Page 7
opposite sign. The significant correlation suggests that
subsurface oceanic processes carry the IOD signals into
the equatorial Pacific Ocean.
Lag correlations between the SSTA in the south-
eastern tropical Indian Ocean in fall and those in the
Indo-Pacific basin beyond the time lag of 1 yr are gen-
erally weak and insignificant everywhere, suggesting
that the memory of the IOD event in the tropical Pacific
and Indian Oceans are generally no more than 1 yr.
Those correlation results are not discussed further here
(figure not shown). Whether this indicates some kind of
damped biennial oscillations is an open question beyond
the scope of this paper.
Analyses suggest that the lag correlation between the
SSTA in the southeastern tropical Indian Ocean in fall
and the cold tongue SSTA at the 1-yr time lag is still
significant even if the ENSO signal is removed (Fig. 2),
suggesting that the teleconnection between the eastern
equatorial Indian and Pacific Oceans is not dependent
on ENSO. Here, the ENSO signal is defined as a re-
gression of the anomaly time series on the Nino-3.4
index. The lag correlation with the ENSO signal re-
moved is a rigorous test of the teleconnection mecha-
nism, because IOD and ENSO are highly correlated so
that the removal of the ENSO signal has inevitably re-
moved some of the IOD signal. Yet, the teleconnection
is still significant in the non-ENSO SSTA fields.
The lag correlation between the warm pool (1308E–1208W; SST above 28.58C) SSTA in fall and the SSTA in
the cold tongue in the summer and fall of the next year is
found insignificant (Fig. 3). This suggests that the SSTA
in the cold tongue in the following year are not started
from the warm pool in the previous fall season. In fact,
the warm pool SSTA at any season are found not in
strong correlation with the cold tongue SSTA beyond
the time lag of a season or two (not shown). These re-
sults suggest that the Walker circulation over the trop-
ical Pacific Ocean is probably of short memory.
b. Lag correlation of sea level anomalies
The results of the above correlation analyses of the
SSTA are confirmed by the correlations of the satellite
FIG. 6. Lag correlations between SSTA in the southeastern
tropical Indian Ocean in fall and temperature anomalies in the
Pacific equatorial vertical section in different seasons over the
period of 1990–2003: (a) winter, (b) spring, (c) summer, and (d) fall
of the following year. The contour interval is 0.2. The dark (light)
shading indicates positive and negative correlations above the 95%
(90%) significance level.
FIG. 7. Lag correlations between SSTA in the southeastern
tropical Indian Ocean in fall and non-ENSO temperature anom-
alies in the Pacific equatorial vertical section in different seasons
over the period of 1990–2003: (a) winter, (b) spring, (c) summer,
and (d) fall of the following year. The contour interval is 0.2. The
dark (light) shading indicates positive and negative correlations
above the 95% (90%) significance level.
1 MAY 2013 YUAN ET AL . 2851
Page 8
altimeter data of sea level. The lag correlations between
the SSHA in the southeastern tropical Indian Ocean in
fall and the SSHA over the Indo-Pacific basin are rem-
iniscent of the SSTA correlations (Fig. 4). The lag cor-
relation with the Indo-Pacific SSHA in the immediate
following winter shows the typical ENSO–IOD tele-
connection patterns, with the SSHA over the western
Pacific and eastern Indian Ocean in opposite sign with
those in the eastern Pacific cold tongue and in the
western Indian Ocean (Fig. 4a). The high correlation
with the cold tongue SSHA disappears in the spring of
the next year, while the high correlation in the western
Indian Ocean persists, consistent with the westward
propagation of the equatorial and off-equatorial Rossby
waves (Masumoto and Meyers 1998; Jury and Huang
2004; Yuan andLiu 2009). The significant lag correlation
in the narrow equatorial zone in the western equatorial
Pacific Ocean and the Indonesian Seas suggests the in-
fluence from the Indian Ocean (Fig. 4b). Some influence
from the off-equatorial Rossby waves in the Pacific
Ocean is also indicated by the lag correlation. The
significant lag correlation in the equatorial western Pa-
cific and the Indonesian Seas in spring eventually leads to
the significant lag correlation in the eastern Pacific cold
tongue in the following summer and fall seasons (Figs. 4c,d),
which is in agreement with the SSTA analyses. The lag
correlations thus suggest strongly that the oceanic
channel (i.e., the ITF) plays an important role in con-
necting the IOD forcing with the Pacific ENSO events.
It is worth mentioning that the delayed oscillator
theory of ENSO dynamics suggests that western bound-
ary reflections of negative feedback play an important
role in the cycling of ENSO (Schopf and Suarez 1988;
Battisti 1988). McPhaden and Yu (1999), Delcroix et al.
(2000), and Yuan et al. (2004) have shown that upwell-
ing Rossby wave anomalies dominated the western Pa-
cific Ocean in the summer through winter seasons of
1997 andwere reflected into the equatorial Kelvin waves
to terminate the 1997/98 El Nino in the coming spring.
However, these Rossby waves are generally not linked
to the oceanic anomalies in the eastern equatorial In-
dian Ocean, because the waveguide from the western
FIG. 8. Lag correlations between SSTA in the southeastern
tropical Indian Ocean in fall and temperature anomalies in the
vertical section along 68N in different seasons over the period of
1990–2003: (a) winter, (b) spring, (c) summer, and (d) fall of the
following year. The contour interval is 0.2. The dark (light) shading
indicates positive and negative correlations above the 95% (90%)
significance level.
FIG. 9. Lag correlations between SSTA in the southeastern
tropical Indian Ocean in fall and non-ENSO temperature anom-
alies in the vertical section along 68N in different seasons over the
period of 1990–2003: (a) winter, (b) spring, (c) summer, and (d) fall
of the following year. The contour interval is 0.2. The dark (light)
shading indicates positive and negative correlations above the 95%
(90%) significance level.
2852 JOURNAL OF CL IMATE VOLUME 26
Page 9
Pacific Ocean to the eastern IndianOcean is through the
Indonesian Seas and along the western coasts of New
Guinea andAustralia (Clarke and Liu 1994;Wijffels and
Meyers 2004; McClean et al. 2005) and the ocean
thermocline anomalies are generally not in strong cou-
pling with the atmosphere over the western Pacific
Ocean (Lukas and Lindstrom 1991;Wang andMcPhaden
2001; Yuan 2009). Therefore, the SSHA in the south-
eastern tropical Indian Ocean in fall are generally not
in strong correlation with the western Pacific reflection
anomalies in the off-equatorial areas.
The lag correlation between the SSHA in the south-
eastern tropical Indian Ocean in fall and the SSHA over
the equatorial Pacific throughout the following year is
still significant, even if the signal associated with ENSO
is removed from the Indo-Pacific SSHA fields. Figure 5
shows the lag correlation with the non-ENSO SSHA
over the Indo-Pacific basin in different seasons over
the period of 1993–2009. The non-ENSO SSHA are
obtained by subtracting the anomalies regressed on the
Nino-3.4 SSTA index from the total anomalies. The
significant lag correlation in the cold tongue in the central
and eastern equatorial Pacific Ocean throughout the
following year suggests the origin of equatorial Kelvin
waves from the eastern equatorial Indian Ocean to the
eastern equatorial Pacific Ocean. This process is in-
dependent of ENSO.
c. Subsurface correlation
The forcing of IOD on ENSO through the ITF vari-
ability is also suggested by the subsurface temperature
FIG. 10. ITF transport anomalies and the IOD, Nino-3.4 indices.
(top) Low-pass-filtered time series of the monthly geostrophic
transport anomalies of the ITF (black, solid) and of the South Java
Current (black, dashed) across the IX1 section in the eastern In-
dian Ocean. The Ekman transport anomalies (grey, dotted) are
drawn for comparison. The cutoff period of the filter is 13 months.
(bottom) The Nino-3.4 SSTA (black, dashed) and DMI (black,
solid) indices are shown.
FIG. 11. Lag correlations between ITF transport anomalies at the IX1 section and the Nino-3.4
index over the period of 1990–2008. Positive months indicate that ITF lags the Nino-3.4 index.
Solid and dashed horizontal lines stand for the 95% and 99% significance levels, respectively.
1 MAY 2013 YUAN ET AL . 2853
Page 10
anomalies. The correlation between the SSTA in the
southeastern tropical Indian Ocean in fall and the sub-
surface temperature anomalies in the equatorial Pacific
vertical section shows significant positive subsurface
correlation in the warm pool in winter, juxtaposing with
significant negative correlation in the cold tongue in the
east (Fig. 6). The correlation is above the 95% signifi-
cant level and is consistent with the SSTA and SSHA lag
correlation of IOD and ENSO teleconnection in winter
shown in Figs. 1 and 4. The significant lag correlation
in the subsurface in the western Pacific warm pool in-
dicates eastward propagation into the central and east-
ern equatorial Pacific Ocean in the following spring
and summer. The subsurface signal explains the ENSO
predictability beyond the spring barrier. By fall, the lag
correlation indicates that the subsurface temperature
anomalies have surfaced in the area east of the date line
along the equator, which explains the significant corre-
lation between the SSTA in the southeastern tropical
Indian Ocean in fall and the cold tongue SSTA at the
1-yr time lag in Fig. 1d. The propagation is also consis-
tent with the lag correlation between the SSHA in the
southeastern tropical Indian Ocean and those in the
cold tongue at the 1-yr lag. The subsurface temperature
data are based primarily on the Tropical Atmosphere
Ocean array observations, which do not cover the ocean
deeper than 250 m in the central and eastern equatorial
Pacific. The downward propagation of the equatorial
Kelvin waves is indicated but not fully resolved by the
observations.
The subsurface correlation in spring following an IOD
event is not dependent on ENSO. In fact, the subsurface
correlation is significant even if the ENSO signal in the
subsurface temperature is removed (Fig. 7), which is
consistent with the significant lag correlation between
the SSHA in the southeastern tropical IndianOcean and
those in the cold tongue with the ENSO signals removed
in the altimeter data (Fig. 5). In comparison, the lag
correlations between the SSTA in the southeastern
tropical Indian Ocean and the temperature anomalies
in the vertical section along 68N of the Pacific Ocean
generally show weak propagation of oceanic signals
associated with the IOD events in the off-equatorial
Pacific Ocean (Fig. 8). Significant lag correlation is
present in the western and eastern Pacific in the winters
following the IOD events because ENSO and IOD are
frequently coincident. This significant lag correlation
disappears if the temperature anomalies associated with
the Nino-3.4 SST index are removed (Fig. 9). The situ-
ation is about the same along 68S (not shown). The lack
of significant propagating signals in the off-equatorial
Pacific Ocean associated with IOD suggests that the
FIG. 12. Lag correlations between ITF transport anomalies at the IX1 section and DMI over
the period of 1990–2008. Positive months indicate that ITF lags DMI. Solid and dashed hori-
zontal lines stand for the 95% and 99% significance levels, respectively.
2854 JOURNAL OF CL IMATE VOLUME 26
Page 11
eastward-propagating subsurface non-ENSO signals in
the equatorial vertical section are not associated with
the Rossby wave reflection at the Pacific’s western
boundary. Rather, the teleconnection between the east-
ern equatorial Indian and Pacific Oceans at the 1-yr time
lag is most likely induced by the ITF variability.
d. Variability of the ITF
The interannual anomalies of the ITF volume trans-
port is calculated from the geostrophic currents in ref-
erence to the 700-m level of nomotion in the IX1 section
based on the XBT data (Fig. 10). In addition, the
transport anomalies of the South Java Current flow-
ing along the Sumatra–Java coast north of 108S through
the IX1 section and the surface Ekman transport based
on the NCEP–NCAR reanalysis wind are calculated for
comparison. The time series have been filtered by a
Gaussian filter with a cutoff period at 13 months. The
filtered time series of DMI and the Nino-3.4 index are
shown in the bottom panel for reference.
The ITF transport anomalies show major signals as-
sociated with the ENSO and IOD events. The effects of
the IOD forcing on ITF variability are clearly evident in
the time series. The correlation between the filtered
DMI and the filtered monthly transport anomalies of
the ITF is20.35, above the 99% significance level. The
correlation between the filtered Nino-3.4 SST index
and the filtered monthly transport anomalies of the
ITF is, however, only 20.05, below the 95% signifi-
cance level.
Further calculations indicate that the correlations
between ITF and Nino-3.4 index are positive above the
99% significance level if the former lags the latter by
3–11 months (Fig. 11). The maximum correlation be-
tween the filtered Nino-3.4 SST index and ITF anoma-
lies occurs at 0.33, with the former leading the latter by
7 months. This phenomenon can be explained by the
propagation of the equatorial Rossby waves from the
central–eastern equatorial Pacific to the western equa-
torial Pacific Ocean. The correlations between ITF and
Nino-3.4 index are negative above the 99% significance
level if the former leads the latter by 3–6 months, which
can be explained by the fact that the IOD anomalies
peak in fall before the ENSO anomalies over the Pacific
FIG. 13. Lag correlations between western Pacific SZWA in fall and Indo-Pacific SZWA in
different seasons over the period of 1990–2009: (a) winter, (b) spring, (c) summer, and (d) fall.
Shading indicates positive and negative correlations above the 95% significance level.
1 MAY 2013 YUAN ET AL . 2855
Page 12
Ocean peak in the coming winter through spring
seasons.
In comparison, the correlations between the ITF
transport anomalies and the DMI are negative above
the 99% significance level if the former leads the latter
by 21 through 25 months (Fig. 12). The maximum
correlation between the DMI and the ITF occurs at a
near-zero time lag and is above the 99% significance
level. The lead time of a few months is trivial and can
be explained by the fact that the IX1 section is located
very close to the eastern pole of the DMI calculation.
The correlations between the ITF transport anomalies
and the DMI are positive above the 99% significance
level if the former lags the latter by 6 through 11
months. This lag can be explained by the fact that the
IOD and ENSO are closely correlated and the latter
impact the ITF through the propagation of the equa-
torial Rossby waves to the western equatorial Pacific
Ocean and into the Indonesian Seas. These analyses
suggest strongly that the ITF variability is subject to the
influence of both IOD and ENSO. The IOD-forced ITF
variability implies warm pool heat content variability
associated with IOD.
A significant part of the ITF transport variability is
associated with the transport anomalies of the South
Java Current flowing along the Sumatra–Java coast north
of 108S through the IX1 section (Fig. 10). The surface
Ekman transport of the winds has a smaller amplitude
on average, suggesting the dominance of oceanic ther-
mocline processes in the ITF transport variations. The
correlation between the DMI and the transport anom-
alies of the South Java Current is20.19, above the 98%
significant level. In comparison, the correlation between
the Nino-3.4 SST index and the transport anomalies of
the South Java Current is 0.02, way below the 95% sig-
nificance level.
e. Effects of the atmospheric bridge
The atmospheric bridge process of IOD forcing on
ENSO suggests that variations of theWalker circulation
over the equatorial Pacific Ocean are forced by the In-
dian Ocean SSTA through the western Pacific wind
anomalies, which in turn drive the ENSO variability in
the equatorial Pacific Ocean (Izumo et al. 2010). How-
ever, the SZWA in the western equatorial Pacific (58S–58N, 1308–1508E) in fall are in poor correlation with the
FIG. 14. Lag correlations between western Pacific SZWA in fall and Indo-Pacific SSTA in
different seasons over the period of 1990–2009: (a) winter, (b) spring, (c) summer, and (d) fall.
Shading indicates positive and negative correlations above the 95% significance level.
2856 JOURNAL OF CL IMATE VOLUME 26
Page 13
SZWA over the equatorial Pacific Ocean beyond one
season (Fig. 13). The weak correlation suggests that the
previous hypothesis of the Walker cell interaction is
not supported by the NCEP–NCAR reanalysis wind
product. Additional analyses using the 40-yr European
Centre for Medium-Range Weather Forecasts (ECMWF)
Re-Analysis (ERA-40) winds show essentially the same
weak correlations between the far western equatorial
Pacific SZWA in fall and the SZWAover the central and
eastern equatorial Pacific at time lags beyond a season
(not shown). These results seriously challenge the role
of the atmospheric bridge process.
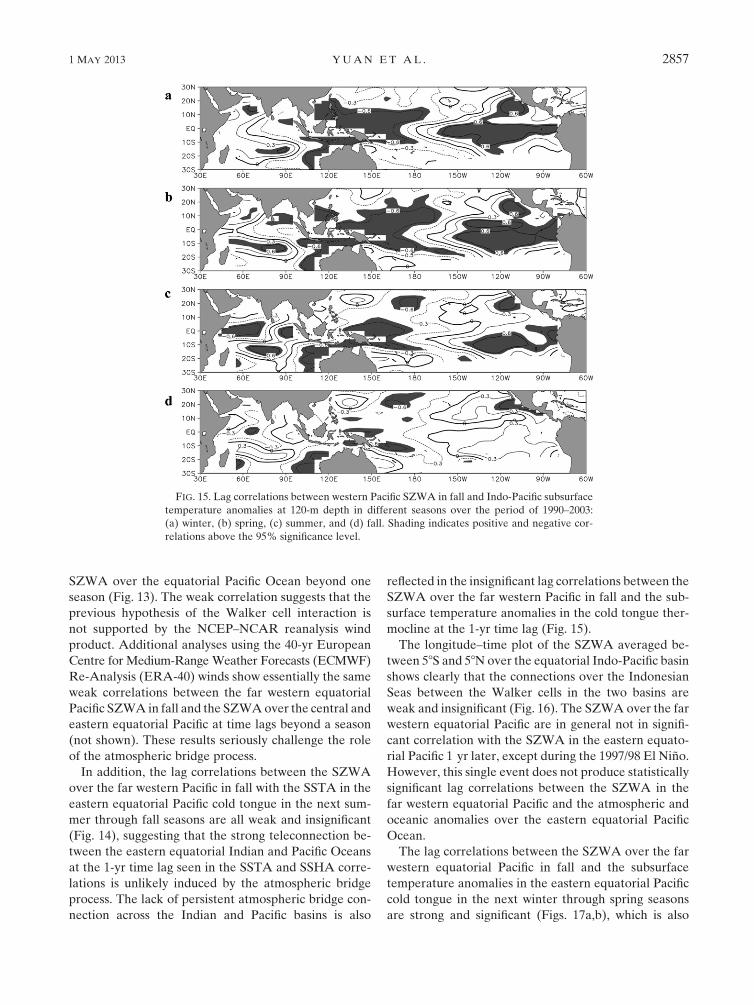
In addition, the lag correlations between the SZWA
over the far western Pacific in fall with the SSTA in the
eastern equatorial Pacific cold tongue in the next sum-
mer through fall seasons are all weak and insignificant
(Fig. 14), suggesting that the strong teleconnection be-
tween the eastern equatorial Indian and Pacific Oceans
at the 1-yr time lag seen in the SSTA and SSHA corre-
lations is unlikely induced by the atmospheric bridge
process. The lack of persistent atmospheric bridge con-
nection across the Indian and Pacific basins is also
reflected in the insignificant lag correlations between the
SZWA over the far western Pacific in fall and the sub-
surface temperature anomalies in the cold tongue ther-
mocline at the 1-yr time lag (Fig. 15).
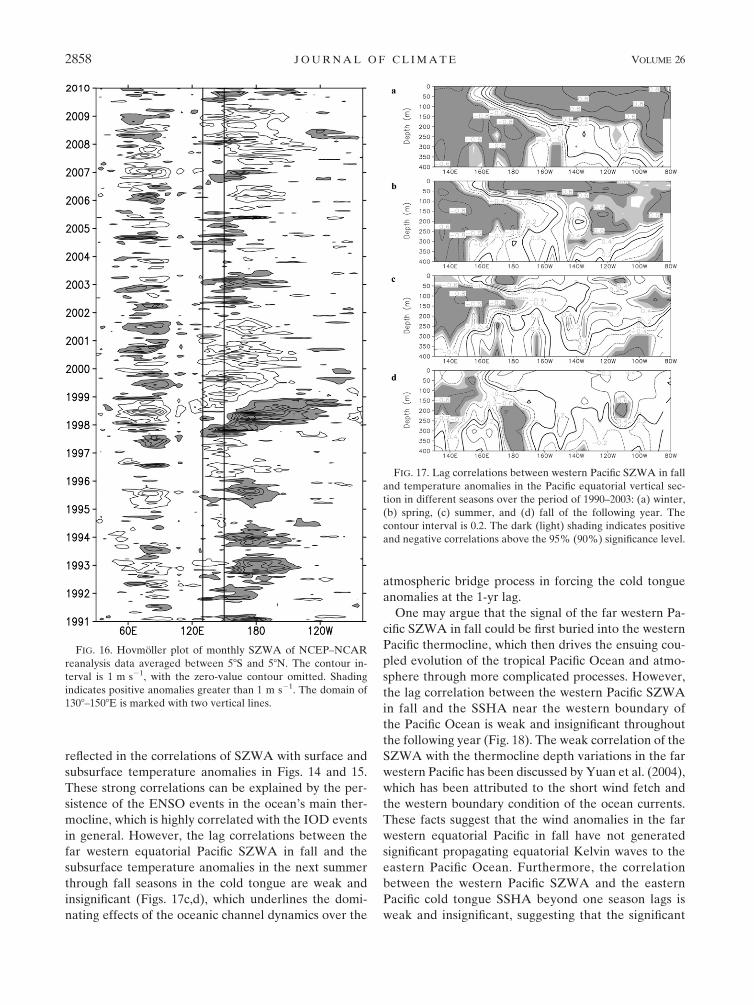
The longitude–time plot of the SZWA averaged be-
tween 58S and 58Nover the equatorial Indo-Pacific basin
shows clearly that the connections over the Indonesian
Seas between the Walker cells in the two basins are
weak and insignificant (Fig. 16). The SZWA over the far
western equatorial Pacific are in general not in signifi-
cant correlation with the SZWA in the eastern equato-
rial Pacific 1 yr later, except during the 1997/98 El Nino.
However, this single event does not produce statistically
significant lag correlations between the SZWA in the
far western equatorial Pacific and the atmospheric and
oceanic anomalies over the eastern equatorial Pacific
Ocean.
The lag correlations between the SZWA over the far
western equatorial Pacific in fall and the subsurface
temperature anomalies in the eastern equatorial Pacific
cold tongue in the next winter through spring seasons
are strong and significant (Figs. 17a,b), which is also
FIG. 15. Lag correlations between western Pacific SZWA in fall and Indo-Pacific subsurface
temperature anomalies at 120-m depth in different seasons over the period of 1990–2003:
(a) winter, (b) spring, (c) summer, and (d) fall. Shading indicates positive and negative cor-
relations above the 95% significance level.
1 MAY 2013 YUAN ET AL . 2857
Page 14
reflected in the correlations of SZWA with surface and
subsurface temperature anomalies in Figs. 14 and 15.
These strong correlations can be explained by the per-
sistence of the ENSO events in the ocean’s main ther-
mocline, which is highly correlated with the IOD events
in general. However, the lag correlations between the
far western equatorial Pacific SZWA in fall and the
subsurface temperature anomalies in the next summer
through fall seasons in the cold tongue are weak and
insignificant (Figs. 17c,d), which underlines the domi-
nating effects of the oceanic channel dynamics over the
atmospheric bridge process in forcing the cold tongue
anomalies at the 1-yr lag.
One may argue that the signal of the far western Pa-
cific SZWA in fall could be first buried into the western
Pacific thermocline, which then drives the ensuing cou-
pled evolution of the tropical Pacific Ocean and atmo-
sphere through more complicated processes. However,
the lag correlation between the western Pacific SZWA
in fall and the SSHA near the western boundary of
the Pacific Ocean is weak and insignificant throughout
the following year (Fig. 18). The weak correlation of the
SZWA with the thermocline depth variations in the far
western Pacific has been discussed by Yuan et al. (2004),
which has been attributed to the short wind fetch and
the western boundary condition of the ocean currents.
These facts suggest that the wind anomalies in the far
western equatorial Pacific in fall have not generated
significant propagating equatorial Kelvin waves to the
eastern Pacific Ocean. Furthermore, the correlation
between the western Pacific SZWA and the eastern
Pacific cold tongue SSHA beyond one season lags is
weak and insignificant, suggesting that the significant
FIG. 16. Hovmoller plot of monthly SZWA of NCEP–NCAR
reanalysis data averaged between 58S and 58N. The contour in-
terval is 1 m s21, with the zero-value contour omitted. Shading
indicates positive anomalies greater than 1 m s21. The domain of
1308–1508E is marked with two vertical lines.
FIG. 17. Lag correlations between western Pacific SZWA in fall
and temperature anomalies in the Pacific equatorial vertical sec-
tion in different seasons over the period of 1990–2003: (a) winter,
(b) spring, (c) summer, and (d) fall of the following year. The
contour interval is 0.2. The dark (light) shading indicates positive
and negative correlations above the 95% (90%) significance level.
2858 JOURNAL OF CL IMATE VOLUME 26
Page 15
correlation between the SSHA in the southeastern trop-
ical Indian Ocean in fall and those in the cold tongue at
the 1-yr time lag is unlikely induced by the atmospheric
bridge process.
4. Discussion and summary
Stimulated by the dynamics study ofYuan et al. (2011)
using a hierarchy of numerical models to demonstrate
that tropical Indian Ocean interannual variations force
significant coupled variability in the tropical Pacific
Ocean through the heat transport variability of the ITF
observational data are used in this study to detect the
dynamics in the real ocean uncovered by that study and
to examine the consistency of the model simulations
with observations. Significant lag correlations between
the anomalies of SST or sea surface height in an area in
the southeastern tropical Indian Ocean in fall and the
anomalies in the cold tongue in the eastern equatorial
Pacific Ocean at a 1-yr time lag are identified based on
the Hadley Center SST and the satellite altimeter data.
The teleconnection is further shown to propagate from
the eastern Indian Ocean to the western and farther to
the eastern equatorial Pacific Ocean through the Indo-
nesian Seas in the main ocean thermocline (Figs. 4–7),
consistent with the model experiment results. It is
therefore suggested that the oceanic channel dynamics
(i.e., the ITF) play an important role in the forcing of
the IOD on the interannual climate variations over
the tropical Pacific Ocean 1 yr later (Fig. 19).
In comparison, the lag correlations between the
surface zonal wind anomalies over the far western
equatorial Pacific in fall and the oceanic anomalies in the
western equatorial Pacific in the next year and in the
cold tongue in the eastern equatorial Pacific Ocean 1 yr
later are all small and insignificant, which are in con-
trast to the significant teleconnection in the ocean be-
tween the eastern Indian and Pacific Ocean. The results
FIG. 18. Lag correlations between western Pacific SZWA in fall and Indo-Pacific SSHA in
different seasons over the period of 1993–2009: (a) winter, (b) spring, (c) summer, and (d) fall.
Shading indicates positive and negative correlations above the 95% significance level.
1 MAY 2013 YUAN ET AL . 2859
Page 16
suggest that the atmospheric bridge processes are not the
main reason of the teleconnection at the 1-yr time lag.
The propagation of the Indian Ocean equatorial
Kelvin waves along the Sumatra–Java island chain and
into the Indonesian Seas is in agreement with the latest
observations at the Lombok and Ombai Straits at in-
traseasonal time scales (Sprintall et al. 2000; Molcard
et al. 2001; Wijffels and Meyers 2004; Kandaga et al.
2009; Drushka et al. 2010). The propagation of the in-
terannual Kelvin waves into the western Pacific Ocean
has not been observed so far because of the short time
series of the strait measurements. However, the simple
model experiments of Yuan et al. (2011) have shown
that the penetration of Kelvin waves into the western
Pacific at the interannual time scales is much stronger
than that at the intraseasonal time scales (cf. Qiu et al.
1999). Thus, it is possible that the ITF play a role in the
forcing of IOD on the interannual climate variability
over the tropical Pacific. Upon reaching the western
Pacific Ocean, the anomalies are organized into the
equatorial Kelvin waves to propagate to the eastern
equatorial Pacific and influence the cold tongue SSTA
through upwelling anomalies.
It is worth mentioning that existing studies of the at-
mospheric bridge process are based primarily on cor-
relations of the atmospheric anomalies with DMI. Since
the calculation of DMI uses the SSTA in the eastern
equatorial Indian Ocean, the effects of the ocean chan-
nel dynamics have been incorporated into the correla-
tion analyses. In comparison, the examination of the
correlations based on the wind anomalies in the far
western equatorial Pacific in this study is a rigorous test
of the atmospheric bridge dynamics connecting the cli-
mate variations over the two basins. The results of this
study suggest that the effects of the atmospheric bridge
are weak since the 1990s compared with the ocean
channel dynamics at time lags beyond a season.
In summary, the analyses of the surface and sub-
surface correlations, although limited by the short time
series of the observations available, suggest that the ITF
play an important role in connecting the IOD with the
Pacific interannual climate variations at the time lag of
1 yr. This oceanic channel mechanism is important for
enhanced predictability of ENSO beyond the spring bar-
rier. The disclosed dynamics and structure of the corre-
lations suggest that models of the Indo-Pacific basin are of
better prediction skills than those of the Pacific basin only.
Acknowledgments. We thank Gary Meyers for shar-
ing the XBT data along the IX1 section. Discussions
with B. Qiu and W. Cai were valuable. Support from
the China 973 Project 2012CB956000, NSF grants
(41176019, 40888001, 40806010, and 41005042) of China,
SFC grant (ZR2010DM007) of Shandong Province, and
an open fund ofLTO (1101), are gratefully acknowledged.
H. Zhou was supported by a Fund of GCMAC, SOA
(1102).
REFERENCES
Alexander,M.A., I. Blade,M. Newman, J. R. Lanzante, N.-C. Lau,
and J. D. Scot, 2002: The atmospheric bridge: The influence of
ENSO teleconnections on air–sea interaction over the global
oceans. J. Climate, 15, 2205–2231.
Annamalai, H., S. P. Xie, J. P. McCreary, and R. Murtugudde,
2005: Impact of Indian Ocean sea surface temperature on
developing El Nino. J. Climate, 18, 302–319.
Battisti, D., 1988: Dynamics and thermodynamics of a warming
event in a coupled tropical atmosphere-ocean model. J. At-
mos. Sci., 45, 2889–2919.Behera, S. K., and T. Yamagata, 2003: Influence of the Indian
Ocean dipole on the Southern Oscillation. J. Meteor. Soc.
Japan, 81, 169–177.——, J. J. Luo, S.Masson, S. A. Rao, H. Sakuma, and T. Yamagata,
2006: A CGCM study on the interaction between IOD and
ENSO. J. Climate, 19, 1688–1705.
Clarke, A. J., and X. Liu, 1994: Interannual sea level in the
northern and eastern Indian Ocean. J. Phys. Oceanogr., 24,
1224–1235.
——, and S. VanGorder, 2003: Improving El Nino prediction using
a space-time integration of Indo-Pacific winds and equatorial
Pacific upper ocean heat content.Geophys. Res. Lett., 30, 1399,
doi:10.1029/2002GL016673.
Cresswell, G. R., and J. R. Luick, 2001: Current measurements in
the Maluku Sea. J. Geophys. Res., 106, 13 953–13 958.
Delcroix, T., B. Dewitte, Y. duPenhoat, F. Masia, and J. Picaut,
2000: Equatorial waves and warm pool displacements during
the 1992–1998 El Nino South Oscillation events: Observation
and modeling. J. Geophys. Res., 105, 26 045–26 062.
Drushka, K., J. Sprintall, S. T. Gille, and I. Brodjonegoro, 2010:
Vertical structure of Kelvin waves in the Indonesian Through-
flow exit passages. J. Phys. Oceanogr., 40, 1965–1987.Fieux, M., R. Molcard, and A. G. Ilahude, 1996: Geostrophic
transport of the Pacific-Indian oceans throughflow. J. Geo-
phys. Res., 101, 12 421–12 432.
Ganachaud, A., and C. Wunsch, 2000: Improved estimates of
global ocean circulation, heat transport and mixing from hy-
drographic data. Nature, 408, 453–456.
Gordon, A. L., R. D. Susanto, and A. Ffield, 1999: Throughflow
within Makassar Strait. Geophys. Res. Lett., 26, 3325–3328.
——, ——, ——, B. A. Huber, W. Pranowo, and S. Wirasantosa,
2008: Makassar Strait throughflow, 2004 to 2006. Geophys.
Res. Lett., 35, L24605, doi:10.1029/2008GL036372.
FIG. 19. Schematic pathway of the Indo-Pacific sea level anomaly
propagation.
2860 JOURNAL OF CL IMATE VOLUME 26
Page 17
Izumo, T., and Coauthors, 2010: Influence of the state of the Indian
Ocean dipole on the following year’s El Nino. Nat. Geosci., 3,
168–172.
Jury, M. R., and B. Huang, 2004: The Rossby wave as a key
mechanism of IndianOcean climate variability.Deep-Sea Res.
I, 41, 2123–2136.
Kalnay, E., and Coauthors, 1996: The NCEP/NCAR 40-Year Re-
analysis Project. Bull. Amer. Meteor. Soc., 77, 437–471.Kandaga, P., A. L. Gordon, J. Sprintall, and R. D. Susanto, 2009:
Intraseasonal variability in the Makassar Strait thermocline.
J. Mar. Res., 67, 757–777.
Kug, J.-S., T. Li, S.-I. An, I.-S. Kang, J.-J. Luo, S. Masson, and
T. Yamagata, 2006: Role of the ENSO–IndianOcean coupling
on ENSO variability in a coupled GCM. Geophys. Res. Lett.,
33, L09710, doi:10.1029/2005GL024916.
Lau, N. C., andM. J. Nath, 2000: Impact of ENSOon the variability
of the Asian–Australian monsoons as simulated in GCM ex-
periments. J. Climate, 13, 4287–4309.
——, and ——, 2003: Atmosphere–ocean variations in the Indo-
Pacific sector during ENSO episodes. J. Climate, 16, 3–20.
——, A. Leetmaa, M. J. Nath, and H. L. Wang, 2005: Influence of
ENSO-induced Indo-western Pacific SST anomalies on ex-
tratropical atmospheric variability during the boreal summer.
J. Climate, 18, 2922–2942.
Luick, J. L., and G. R. Cresswell, 2001: Current measurements in
the Maluku Sea. J. Geophys. Res., 106, 13 953–13 958.
Lukas, R., and E. Lindstrom, 1991: The mixed layer of the western
equatorial PacificOcean. J.Geophys. Res., 96 (Suppl.), 3343–3357.
Luo, J.-J., R. Zhang, S. K. Behera, Y. Masumoto, F.-F. Jin,
R. Lukas, and T. Yamagata, 2010: Interaction between El Nino
and extreme Indian Ocean dipole. J. Climate, 23, 726–742.
MacDonald,A.M., 1998:The global ocean circulation:Ahydrographic
estimate and regional analysis. Prog. Oceanogr., 41, 281–382.
Masumoto, Y., and G. Meyers, 1998: Forced Rossby waves in the
southern tropical IndianOcean. J. Geophys. Res., 103, 27 589–
27 602.
McClean, J. L., D. P. Ivanova, and J. Sprintall, 2005: Remote ori-
gins of interannual variability in the Indonesian Throughflow
region from data and a global Parallel Ocean Program simu-
lation. J. Geophys. Res., 110,C10013, doi:10.1029/2004JC002477.
McPhaden, M. J., and X. Yu, 1999: Equatorial waves and the 1997–
1998 El Nino. Geophys. Res. Lett., 26, 2961–2964.
Meyers, G., 1996: Variation of Indonesian Throughflow and the El
Nino-Southern Oscillation. J. Geophys. Res., 101, 12 255–12 263.
Molcard, R., A. G. Ilahude, M. Fieux, J. C. Swallow, and
J. Banjarnahor, 1994: Low frequency variability of the
currents in Indonesian channels (Savu-Roti M1 and Roti-
Ashmore Reef M2). Deep-Sea Res., 41, 1643–1662.
——, M. Fieux, and A. G. Ilahude, 1996: The Indo-Pacific through-
flow in the Timor Passage. J. Geophys. Res., 101, 12 411–12 420.
——,——, and F. Syamsudin, 2001: The throughflowwithinOmbai
Strait. Deep-Sea Res., 48, 1237–1253.Murtugudde, R., A. J. Busalacchi, and J. Beauchamp, 1998: Seasonal-
to-interannual effects of the Indonesian Throughflow on the
tropical Indo-Pacific basin. J. Geophys. Res., 103, 21 425–21 441.
Nof, D., 1996: What controls the origin of the Indonesian
throughflow? J. Geophys. Res., 101, 12 301–12 314.
Picaut, J., F. Masia, and Y. du Penhoat, 1997: An advective-
reflective conceptual model for the oscillatory nature of the
ENSO. Science, 277, 663–666.Qiu, B., M. Mao, and Y. Kashino, 1999: Intraseasonal variability in
the Indo-Pacific Throughflow and the regions surrounding the
Indonesian seas. J. Phys. Oceanogr., 29, 1599–1618.
Rayner, N. A., D. E. Parker, E. B. Horton, C. K. Folland, L. V.
Alexander, D. P. Rowell, E. C. Kent, and A. Kaplan, 2003:
Global analyses of sea surface temperature, sea ice, and night
marine air temperature since the late nineteenth century.
J. Geophys. Res., 108, 4407, doi:10.1029/2002JD002670.
Saji, N.H., B.N.Goswami, P.N.Vinayachandran, andT.Yamagata,
1999: A dipole mode in the tropical Indian Ocean.Nature, 401,
360–363.
Schopf, P. S., and M. J. Suarez, 1988: Vacillations in a coupled
ocean-atmosphere model. J. Atmos. Sci., 45, 549–566.
Sprintall, J., A. L. Gordon, R. Murtugudde, and R. D. Susanto,
2000: A semiannual IndianOcean forcedKelvinwave observed
in the Indonesian seas in May 1997. J. Geophys. Res., 105,
17 217–17 230.
Uppala, S. M., and Coauthors, 2005: The ERA-40 Re-Analysis.
Quart. J. Roy. Meteor. Soc., 131, 2961–3012.
Vranes, K., A. L. Gordon, and A. Field, 2002: The heat transport
of the Indonesian Throughflow and implications for Indian
Ocean heat budget. Deep-Sea Res. II, 49, 1391–1410.Wang, W., and M. J. McPhaden, 2001: Surface layer temperature
balance in the equatorial Pacific during the 1997–98 El Nino
and 1998–99 La Nina. J. Climate, 14, 3393–3407.
Webster, P. J., V. O.Magana, T. N. Palmer, J. Shukla, R.A. Tomas,
M. Yanai, and T. Yasunari, 1998: Monsoons: Processes, pre-
dictability, and the prospects for prediction. J. Geophys. Res.,
103 (C7), 14 451–14 510.
——,A.Moore, J. Loschnigg, andM. Leban, 1999: Coupled ocean–
atmosphere dynamics in the Indian Ocean during 1997–98.
Nature, 401, 356–360.
White, W. B., 1995: Design of a global observing system for gyre-
scale upper ocean temperature variability. Prog. Oceanogr.,
36, 169–217.
Wijffels, S. E., and G. Meyers, 2004: An intersection of oceanic
waveguides: Variability in the Indonesian Throughflow re-
gion. J. Phys. Oceanogr., 34, 1232–1253.
——, ——, and J. S. Godfrey, 2008: A 20-yr average of the Indo-
nesian Throughflow: Regional currents and the interbasin
exchange. J. Phys. Oceanogr., 38, 1965–1978.
Wu, G., and W. Meng, 1998: Gearing between the Indo-monsoon
circulation and the Pacific-Walker circulation and the ENSO,
Part 1. Data analyses (in Chinese). Chin. J. Atmos. Sci., 22, 470.Wu, R., and B. Kirtman, 2004: Understanding the impacts of
the Indian Ocean on ENSO variability in a coupled GCM.
J. Climate, 17, 3037–3054.
Wyrtki, K., 1987: Indonesian Throughflow and the associated
pressure gradient. J. Geophys. Res., 92, 12 941–12 946.
Yamagata, T., and Y.Masumoto, 1989: A simple ocean-atmosphere
coupled model for the origin of a warm El Nino Southern Os-
cillation event. Philos. Trans. Roy. Soc. London, 329A, 225–236.Yuan, D., 2009: Interannual horizontal heat advection in the sur-
face mixed layer over the equatorial Pacific Ocean: Assimi-
lation versus TAO analyses. Theor. Appl. Climatol., 97, 3–15,doi:10.1007/s00704-008-0068-7.
——, and H. Liu, 2009: Long-wave dynamics of sea level variations
during Indian Ocean dipole events. J. Phys. Oceanogr., 39,
1115–1132.
——, M. M. Rienecker, and P. S. Schopf, 2004: Long wave dy-
namics of the interannual variability in a numerical hindcast
of the equatorial Pacific Ocean circulation during the 1990s.
J. Geophys. Res., 109, C05019, doi:10.1029/2003JC001936.——, and Coauthors, 2011: Forcing of the Indian Ocean dipole on
the interannual variations of the tropical Pacific Ocean: Roles
of the Indonesian Throughflow. J. Climate, 15, 3597–3608.
1 MAY 2013 YUAN ET AL . 2861