Abstract We present the INTERASPECT instrumentation framework for GCC, a widelyused compiler infrastructure. The addition of plug-in support in the latest release of GCCmakes it an attractive platform for runtime instrumentation, as GCC plug-ins can directlyadd instrumentation by transforming the compiler’s intermediate representation. Such trans-formations, however, require expert knowledge of GCC internals. INTERASPECT addressesthis situation by allowing instrumentation plug-ins to be developed using the familiar vo-cabulary of Aspect-Oriented Programming: pointcuts, join points, and advice functions.Moreover, INTERASPECT uses specific information about each join point in a pointcut,possibly including results of static analysis, to support powerful customized instrumenta-tion. We describe the INTERASPECT API and present several examples that illustrate itspractical utility as a runtime-verification platform. We also introduce a tracecut system thatuses INTERASPECT to construct program monitors that are formally specified as regularexpressions.
GCC is a widely used compiler infrastructure that supports a variety of input languages,e.g., C, C++, Fortran, Java, and Ada, and over 30 different target machine architectures.GCC translates each of its front-end languages into a language-independent intermediaterepresentation called GIMPLE, which then gets translated to machine code for one of GCC’smany target architectures. GCC is a large software system with more than 100 developers
J. Seyster (�) · K. Dixit · X. Huang · R. Grosu · S.A. Smolka · S.D. Stoller · E. ZadokDepartment of Computer Science, Stony Brook University, Stony Brook, USAe-mail: [email protected]
K. HavelundJet Propulsion Laboratory, California Institute of Technology, Pasadena, USA
contributing over the years and a steering committee consisting of 13 experts who strive tomaintain its architectural integrity.
In earlier work [10], we extended GCC to support plug-ins, allowing users to add theirown custom passes to GCC in a modular way without patching and recompiling the GCCsource code. Released in April 2010, GCC 4.5 [1] includes plug-in support that is largelybased on our design.
GCC’s support for plug-ins presents an exciting opportunity for the development of prac-tical, widely-applicable program transformation tools, including program-instrumentationtools for runtime verification. Because plug-ins operate at the level of GIMPLE, a plug-in isapplicable to all of GCC’s front-end languages. Transformation systems that manipulate ma-chine code may also work for multiple programming languages, but low-level machine codeis harder to analyze and lacks the detailed type information that is available in GIMPLE.
Implementing instrumentation tools as GCC plug-ins provides significant benefits butalso presents a significant challenge: despite the fact that it is an intermediate representa-tion, GIMPLE is in fact a low-level language, requiring the writing of low-level GIMPLEAbstract Syntax Tree (AST) traversal functions in order to transform one GIMPLE expres-sion into another. Therefore, as GCC is currently configured, the writing of plug-ins is nottrivial but for those intimately familiar with GIMPLE’s peculiarities.
To address this challenge, we developed the INTERASPECT program-instrumentationframework, which allows instrumentation plug-ins to be developed using the familiar vo-cabulary of Aspect-Oriented Programming (AOP). INTERASPECT is itself implemented us-ing the GCC plug-in API for manipulating GIMPLE, but it hides the complexity of this APIfrom its users, presenting instead an aspect-oriented API in which instrumentation is accom-plished by defining pointcuts. A pointcut denotes a set of program points, called join points,where calls to advice functions can be inserted by a process called weaving.
INTERASPECT’s API allows users to customize the weaving process by defining call-back functions that get invoked for each join point. Callback functions have access to spe-cific information about each join point; the callbacks can use this to customize the insertedinstrumentation, and to leverage static-analysis results for their customization.
We also present the INTERASPECT Tracecut extension to generate program monitorsdirectly from formally specified tracecuts. A tracecut [32] matches sequences of pointcutsspecified as a regular expression. Given a tracecut specification T , INTERASPECT Tracecutinstruments a target program so that it communicates program events and event parametersdirectly to a monitoring engine for T . The tracecut extension adds the necessary monitoringinstrumentation exclusively with the INTERASPECT API presented here.
In summary, INTERASPECT offers the following novel combination of features:
– INTERASPECT builds on top of GCC, a widely used compiler infrastructure.– INTERASPECT exposes an API that encourages and simplifies open-source collaboration.– INTERASPECT is versatile enough to provide instrumentation for many purposes, includ-
ing monitoring a tracecut specification.– INTERASPECT has access to GCC internals, which allows one to exploit static analysis
and meta-programming during the weaving process.
The full source of the INTERASPECT framework is available from the INTERASPECT web-site under the GPLv3 license [20].
To illustrate INTERASPECT’s practical utility, we have developed a number of program-instrumentation plug-ins that use INTERASPECT for custom instrumentation. These includea heap visualization plug-in designed for the analysis of JPL Mars Science Laboratory soft-ware; an integer range analysis plug-in that finds bugs by tracking the range of values for
Form Methods Syst Des
Fig. 1 A simplified view of the GCC compilation process
each integer variable; and a code coverage plug-in that, given a pointcut and test suite, mea-sures the percentage of join points in the pointcut that are executed by the test suite.
The rest of the article is structured as follows. Section 2 provides an overview of GCCand the INTERASPECT framework. Section 3 introduces the INTERASPECT API. Section 4presents the three case studies: heap visualization, integer range analysis, and code cover-age. Section 5 describes how we extended INTERASPECT with a tracecut system. Section 6summarizes related work, and Sect. 7 concludes the article. A preliminary version of thisarticle, which did not consider the tracecut extension, appeared last year [29].
2 Overview of GCC and the INTERASPECT Architecture
Overview of GCC As Fig. 1 illustrates, GCC translates all of its front-end languages intothe GIMPLE intermediate representation for analysis and optimization. Each transforma-tion on GIMPLE code is split into its own pass. These passes, some of which may beimplemented as plug-ins, make up GCC’s middle-end. Moreover, a plug-in pass may beINTERASPECT-based, enabling the plug-in to add instrumentation directly into the GIM-PLE code. The final middle-end passes convert the optimized and instrumented GIMPLE tothe Register Transfer Language (RTL), which the back-end translates to assembly.
GIMPLE is a C-like three-address (3A) code. Complex expressions (possibly with sideeffects) are broken into simple 3A statements by introducing new, temporary variables.Similarly, complex control statements are broken into simple 3A (conditional) gotos byintroducing new labels. Type information is preserved for every operand in each GIMPLEstatement.
Figure 2 shows a C program and its corresponding GIMPLE code, which preservessource-level information such as data types and procedure calls. Although not shown inthe example, GIMPLE types also include pointers and structures.
A disadvantage of working purely at the GIMPLE level is that some language-specificconstructs are not visible in GIMPLE code. For example, targeting a specific kind of loopas a pointcut is not currently possible because all loops look the same in GIMPLE. IN-TERASPECT can be extended with language-specific pointcuts, whose implementation couldhook into one of the language-specific front-end modules instead of the middle-end.
INTERASPECT architecture INTERASPECT works by inserting a pass that first traversesthe GIMPLE code to identify program points that are join points in a specified pointcut.For each such join point, it then calls a user-provided weaving callback function, whichcan insert calls to advice functions. Advice functions can be written in any language that
Form Methods Syst Des
int main() { 1. int main {int a, b, c; 2. int a, b, c;a = 5; 3. int T1, T2, T3, T4;b = a + 10; 4. a = 5;c = b + foo(a, b); => 5. b = a + 10;if (a > b + c) 6. T1 = foo(a, b);
c = b++ / a + (b ∗ a); 7. c = b + T1;bar(a, b, c); 8. T2 = b + c;
} 9. if (a <= T2) goto fi;10. T3 = b / a;11. T4 = b ∗ a;12. c = T3 + T4;13. b = b + 1;14. fi:15. bar (a, b, c);16. }
Fig. 2 Sample C program (left) and corresponding GIMPLE representation (right)
Fig. 3 Architecture of the INTERASPECT instrumentation framework with its tracecut extension. The trace-cut specification is a simple C program. The tracecut extension translates events in the specification to point-cuts, and the INTERASPECT framework directly instruments the pointcuts using GCC’s GIMPLE API. Theinstrumented binary sends events to the tracecut monitoring engine, and monitors signal matches by callingadvice functions, which are compiled alongside the target program. It is also possible to specify just pointcuts,in which case the tracecut extension and monitoring engine are not necessary
will link with the target program, and they can access or modify the target program’s state,including its global variables. Advice that needs to maintain additional state can declarestatic variables and global variables.
Unlike traditional AOP systems which implement a special AOP language to definepointcuts, INTERASPECT provides a C API for this purpose. We believe that this approachis well suited to open collaboration. Extending INTERASPECT with new features, such asnew kinds of pointcuts, does not require agreement on new language syntax or modificationto parser code. Most of the time, collaborators will only need to add new API functions.
The INTERASPECT Tracecut extension API uses INTERASPECT to generate programmonitors from formally specified tracecuts. Tracecuts match sequences of pointcuts, speci-
Form Methods Syst Des
struct aop_pointcut ∗aop_match_function_entry(void);Creates pointcut denoting every function entry point.
struct aop_pointcut ∗aop_match_function_exit(void);Creates pointcut denoting every function return point.
struct aop_pointcut ∗aop_match_function_call(void);Creates pointcut denoting every function call.
struct aop_pointcut ∗aop_match_assignment_by_type(struct aop_type ∗type);Creates pointcut denoting every assignment to a variable or memory location that matches a type.
Fig. 4 Match functions for creating pointcuts
fied as regular expressions. The instrumentation component of the extension, which is im-plemented in C, benefits from INTERASPECT’s design as an API: it need only call APIfunctions to define and instrument the pointcuts that are necessary to monitor the tracecut.
Figure 3 shows the architecture of a monitor implemented with INTERASPECT Tracecut.The tracecut itself is defined in a short C program that calls the INTERASPECT Tracecut APIto specify tracecut properties. Linking the compiled tracecut program with INTERASPECT
and the tracecut extension produces a plug-in that instruments events relevant to the trace-cut. A target program compiled with this plug-in will send events and event parameters tothe tracecut monitoring engine, which then determines if any sequence of events matchesthe tracecut rule. The target program can include tracecut-handling functions so that themonitoring engine can report matches directly back to the program.
3 The INTERASPECT API
This section describes the functions in the INTERASPECT API, most of which fall naturallyinto one of two categories: (1) functions for creating and filtering pointcuts, and (2) functionsfor examining and instrumenting join points. Note that users of our framework can writeplug-ins solely with calls to these API functions; it is not necessary to include any GCCheader files or manipulate any GCC data structures directly.
Creating and filtering pointcuts The first step for adding instrumentation in INTERASPECT
is to create a pointcut using a match function. Our current implementation supports the fourmatch functions given in Fig. 4, allowing one to create four kinds of pointcuts.
Using a function entry or exit pointcut makes it possible to add instrumentation thatruns with every execution of a function. These pointcuts provide a natural way to insertinstrumentation at the beginning and end of a function the way one would with before-execution and an after-returning advices in a traditional AOP language. A call pointcut caninstead target calls to a function. Call pointcuts can instrument calls to library functionswithout recompiling them. For example, in Sect. 4.1, a call pointcut is used to intercept allcalls to malloc.
The assignment pointcut is useful for monitoring changes to program values. For exam-ple, we use it in Sect. 4.1 to track pointer values so that we can construct the heap graph. Weplan to add several new pointcut types, including pointcuts for conditionals and loops. Thesenew pointcuts will make it possible to trace the complete path of execution as a programruns, which is potentially useful for coverage analysis, profiling, and symbolic execution.
Form Methods Syst Des
void aop_filter_call_pc_by_name(struct aop_pointcut ∗pc, const char ∗name);Filter function calls with a given name.
void aop_filter_call_pc_by_param_type (struct aop_pointcut ∗pc, int n,
struct aop_type ∗type);Filter function calls that have an nth parameter that matches a type.
void ∗callback_param);Call callback on each join point in the pointcut pc, passing callback_param each time.
Fig. 6 Join function for iterating over a pointcut
const char ∗aop_capture_function_name(aop_joinpoint ∗jp);Captures the name of the function called in the given join point.
struct aop_dynval ∗aop_capture_param(aop_joinpoint ∗jp, int n);
Captures the value of the nth parameter passed in the given function join point.
struct aop_dynval ∗aop_capture_return_value(aop_joinpoint ∗jp);Captures the value returned by the function in a given call join point.
Fig. 7 Capture functions for function-call join points
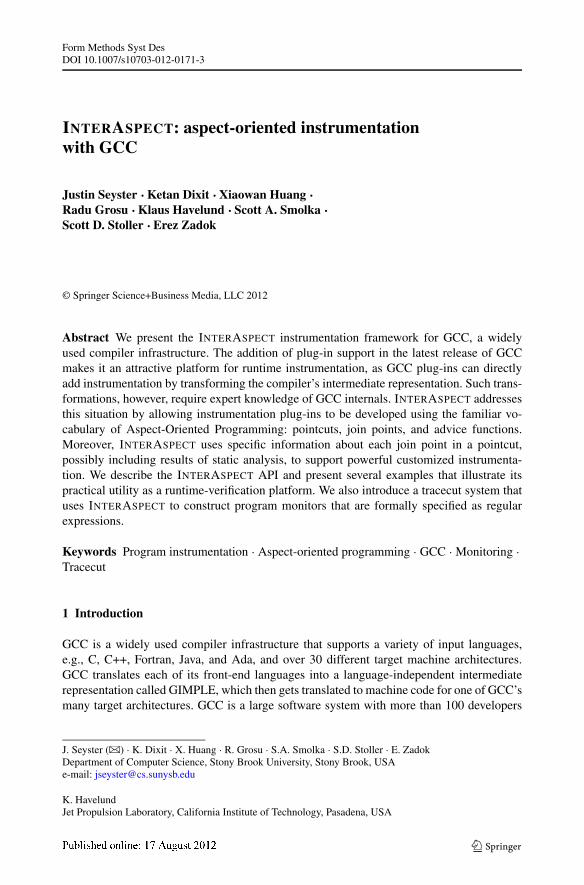
After creating a match function, a plug-in can refine it using filter functions. Filter func-tions add additional constraints to a pointcut, removing join points that do not satisfy thoseconstraints. For example, it is possible to filter a call pointcut to include only calls that returna specific type or only calls to a certain function. Figure 5 summarizes filter functions forcall pointcuts.
Instrumenting join points INTERASPECT plug-ins iterate over the join points of a pointcutby providing an iterator callback to the join function, shown in Fig. 6. For an INTERASPECT
plug-in to instrument some or all of the join points in a pointcut, it should join on the point-cut, providing an iterator callback that inserts a call to an advice function. INTERASPECT
then invokes that callback for each join point.Callback functions use capture functions to examine values associated with a join point.
For example, given an assignment join point, a callback can examine the name of the variablebeing assigned. This type of information is available statically, during the weaving process,so the callback can read it directly with a capture function like aop_capture_lhs_name.Callbacks can also capture dynamic values, such as the value on the right-hand side of theassignment, but dynamic values are not available at weave time. Instead, when the call-back calls aop_capture_assigned_value, it gets an aop_dynval, which serves asa weave-time placeholder for the runtime value. The callback cannot read a value from theplaceholder, but it can specify it as a parameter to an inserted advice function. When thejoin point executes (at runtime), the value assigned also gets passed to the advice function.Sections 4.1 and 4.2 give more examples of capturing values from assignment join points.
Form Methods Syst Des
const char ∗aop_capture_lhs_name(aop_joinpoint ∗jp);Captures the name of a variable assigned to in a given assignment join point, or returns NULL if the join point does
not assign to a named variable.
enum aop_scope aop_capture_lhs_var_scope(aop_joinpoint ∗jp);Captures the scope of a variable assigned to in a given assignment join point. Variables can have global,
file-local, and function-local scope. If the join point does not assign to a variable, this function returns
AOP_MEMORY_SCOPE.
struct aop_dynval ∗aop_capture_lhs_addr(aop_joinpoint ∗jp);Captures the memory address assigned to in a given assignment join point.
struct aop_dynval ∗aop_capture_assigned_value(aop_joinpoint ∗jp);Captures the assigned value in a given assignment join point.
Fig. 8 Capture functions for assignment join points
Insert an advice call, before or after a join point (depending on the value of location), passing any number of
parameters. A plug-in obtains a join point by iterating over a pointcut with aop_join_on.
Fig. 9 Insert function for instrumenting a join point with a call to an advice function
Capture functions are specific to the kinds of join points they operate on. Figures 7 and 8summarize the capture functions for function-call join points and assignment join points,respectively.
AOP systems like AspectJ [21] provide Boolean operators such as and and or to re-fine pointcuts. The INTERASPECT API could be extended with corresponding operators.Even in their absence, a similar result can be achieved in INTERASPECT by including theappropriate logic in the callback. For example, a plug-in can instrument calls to mal-loc and calls to free by joining on a pointcut with all function calls and using theaop_capture_function_name facility to add advice calls only to malloc and free.Simple cases like this can furthermore be handled by using regular expressions to matchfunction names, which would be a straightforward addition to the framework.
After capturing, a callback can add an advice-function call before or after the join pointusing the insert function of Fig. 9. The aop_insert_advice function takes any numberof parameters to be passed to the advice function at runtime, including values captured fromthe join point and values computed during instrumentation by the plug-in itself.
Using a callback to iterate over individual join points makes it possible to customize in-strumentation at each instrumentation site. A plug-in can capture values about the join pointto decide which advice function to call, which parameters to pass to it, or even whetherto add advice at all. In Sect. 4.2, this feature is exploited to uniquely index named vari-ables during compilation. Custom instrumentation code in Sect. 4.3 separately records eachinstrumented join point in order to track coverage information.
Function body duplication INTERASPECT provides a function body duplication facilitythat makes it possible to toggle instrumentation at the function level. Although insertingadvice at the GIMPLE level creates very efficient instrumentation, users may still wish toswitch between instrumented and uninstrumented code for high-performance applications.Duplication creates two or more copies of a function body (which can later be instrumented
Form Methods Syst Des
Fig. 10 Visualization of the heap during a bubble-sort operation on a linked list. Boxes represent heap-al-located structs: linked list nodes in this example. Each struct is labeled with is size, its address inmemory, and the addresses of its field. Within a struct, ovals represent fields that point to other heapobjects. Ovals that are not in a struct are global and stack variables. Each field and variable has an out-going edge to the struct that it points to, which is labeled with (1) the line number of the assignment thatcreated the edge and (2) the number of assignments to the source variable that have occurred so far. Fieldsand variables that do not point to valid memory (such as a NULL pointer) have dashed borders
differently) and redefines the function to call a special advice function that runs at functionentry and decides which copy of the function body to execute.
When joining on a pointcut for a function with a duplicated body, the caller specifieswhich copy the join should apply to. By only adding instrumentation to one copy of thefunction body, the plug-in can create a function whose instrumentation can be turned onand off at runtime. Alternatively, a plug-in can create a function that can toggle betweendifferent kinds of instrumentation. Section 4.2 presents an example of using function bodyduplication to reduce overhead by sampling.
4 Applications
In this section, we present several example applications of the INTERASPECT API. Theplug-ins we designed for these examples provide instrumentation that is tailored to specificproblems (memory visualization, integer range analysis, code coverage). Though custom-made, the plug-ins themselves are simple to write, requiring only a small amount of code.
4.1 Heap visualization
The heap visualizer uses the INTERASPECT API to expose memory events that can be usedto generate a graphical representation of the heap in real time during program execution.Allocated objects are represented by rectangular nodes, pointer variables and fields by ovalnodes, and edges show where pointer variables and fields point.
In order to draw the graph, the heap visualizer needs to intercept object allocations anddeallocations and pointer assignments that change edges in the graph. Figure 10 shows aprototype of the visualizer using Graphviz [18], an open-source graph layout tool, to drawits output. The graph shows three nodes in a linked list during a bubble-sort operation.The list variable is the list’s head pointer, and the curr and next variables are usedto traverse the list during each pass of the sorting algorithm. (The pn variable is used astemporary storage for swap operations.)
The INTERASPECT code for the heap visualizer instruments each allocation (call to mal-loc) with a call to the heap_allocation advice function, and it instruments each pointer
Form Methods Syst Des
static void instrument_malloc_calls(void){/∗ Construct a pointcut that matches calls to: void ∗malloc(unsigned int). ∗/struct aop_pointcut ∗pc = aop_match_function_call();aop_filter_call_pc_by_name(pc, "malloc");aop_filter_call_pc_by_param_type(pc, 0, aop_t_all_unsigned());aop_filter_call_pc_by_return_type(pc, aop_t_all_pointer());
/∗ Visit every statement in the pointcut. ∗/aop_join_on(pc, malloc_callback, NULL);
}
/∗ The malloc_callback() function executes once for each call to malloc() in thetarget program. It instruments each call it sees with a call toheap_allocation(). ∗/
/∗ Add a call to the advice function, passing the size and address asparameters. (AOP_TERM_ARG is necessary to terminate the list of argumentsbecause of the way C varargs functions work.) ∗/
Fig. 11 Instrumenting all memory-allocation events
assignment with a call to the pointer_assign advice function. These advice functionsupdate the graph. Instrumentation of other allocation and deallocation functions, such ascalloc and free, is handled similarly.
The INTERASPECT code in Fig. 11 instruments calls to malloc. The API function in-strument_malloc_calls constructs a pointcut for all calls to malloc and then callsaop_join_on to iterate over all the calls in the pointcut. Only a short main function (notshown) is needed to set GCC to invoke instrument_malloc_calls during compilation.
The aop_match_function_call function constructs an initial pointcut that in-cludes every function call. The filter functions narrows the pointcut to includeonly calls to malloc. First, aop_filter_call_pc_by_name filters out calls tofunctions that are not named malloc. Then, aop_filter_pc_by_param_type andaop_filter_pc_by_return_type filter out calls to functions that do not match thestandard malloc prototype, which takes an unsigned integer as the first parameter and re-turns a pointer value. This filtering step is necessary because a program could define its ownfunction with the name malloc but a different prototype.
For each join point in the pointcut (in this case, a call to malloc), aop_join_on callsmalloc_callback. The two capture calls in the callback function return aop_dynvalobjects for the call’s first parameter and return value: the size of the allocated region andits address, respectively. Recall from Sect. 3 that an aop_dynval serves as a place-holder during compilation for a value that will not be known until runtime. Finally,aop_insert_advice adds the call to the advice function, passing the two capturedvalues. Note that INTERASPECT chooses types for these values based on how they werefiltered. The filters used here restrict object_size to be an unsigned integer and ob-ject_addr to be some kind of pointer, so INTERASPECT assumes that the advice function
Form Methods Syst Des
static void instrument_pointer_assignments(void){/∗ Construct a pointcut that matches all assignments to a pointer. ∗/struct aop_pointcut ∗pc = aop_match_assignment_by_type(aop_t_all_pointer());
/∗ Visit every statement in the pointcut. ∗/aop_join_on(pc, assignment_callback, NULL);
}
/∗ The assignment_callback function executes once for each pointer assignment.It instruments each assignment it sees with a call to pointer_assign(). ∗/
void heap_allocation(unsigned long long, void ∗);To support this, INTERASPECT code must generally filter runtime values by type in order tocapture and use them.
The INTERASPECT code in Fig. 12 tracks pointer assignments, such as
list_node->next = new_node;
The aop_match_assignment_by_type function creates a pointcut that matches assign-ments, which is additionally filtered by the type of assignment. For this application, we areonly interested in assignments to pointer variables.
For each assignment join point, assignment_callback captures address, the ad-dress assigned to, and pointer, the pointer value that was assigned. In the above exam-ples, these would be the values of &list_node->next and new_node, respectively. Thevisualizer uses address to determine the source of a new graph edge and pointer todetermine its destination.
The function that captures address, aop_capture_lhs_addr, does not require ex-plicit filtering to restrict the type of the captured value because an address always hasa pointer type. The value captured by aop_capture_assigned_value and stored inpointer has a void pointer type because we filtered the pointcut to include only pointerassignments. As a result, INTERASPECT assumes that the pointer_assign advice func-tion has the prototype:
void pointer_assign(void ∗, void ∗);
4.2 Integer range analysis
Integer range analysis is a runtime tool for finding anomalies in program behavior by track-ing the range of values for each integer variable [17]. A range analyzer can learn normal
if (variable_name != NULL) {/∗ Choose an index number for this variable. ∗/scope = aop_capture_lhs_var_scope(jp);variable_index = get_index_from_name(variable_name, scope);
ranges from training runs over known good inputs. Values that fall outside of normal rangesin future runs are reported as anomalies, which can indicate errors. For example, an out-of-range value for a variable used as an array index may cause an array-bounds violation.
Our integer range analyzer uses sampling to reduce runtime overhead. Missed updatesbecause of sampling can result in underestimating a variable’s range, but this trade-off isreasonable in many cases. Sampling can be done randomly or by using a technique likeSoftware Monitoring with Controllable Overhead [19].
INTERASPECT provides function body duplication as a means to add instrumentationthat can be toggled on and off. Duplicating a function splits its body into two copies. A dis-tributor block at the beginning of the function decides which copy to run. An INTERASPECT
plug-in can add advice to just one of the copies, so that the distributor chooses between en-abling or disabling instrumentation.
Figure 13 shows how we use INTERASPECT to instrument integer variable updates. Thecall to aop_duplicate makes a copy of each function body. The first argument specifiesthat there should be two copies of the function body, and the second specifies the name ofa function that the distributor will call to decide which copy to execute. When the dupli-cated function runs, the distributor calls distributor_func, which must be a functionthat returns an integer. The duplicated function bodies are indexed from zero, and the dis-tributor_func return value determines which one the distributor transfers control to.
Form Methods Syst Des
Fig. 14 Execution time for bzip2 instrumented, using INTERASPECT or CIL, to increment a counter atevery integer assignment. The programs for the three INTERASPECT configurations are instrumented withthe same plug-in, which duplicates function bodies and inserts advice at every integer assignment. In the“enabled” and “inline” runs, the distributor always chooses the instrumented path; in the “disabled” run, italways chooses the uninstrumented path. For the “inline” run, the advice function was marked as inline,allowing GCC to inline it. We ran all performance tests 10 times, and the 90 % confidence interval had a halfwidth of less than 0.15 seconds for all measurements shown
Using aop_join_on_copy instead of the usual aop_join_on iterates only over joinpoints in the specified copy of duplicate code. As a result, only one copy is instrumented;the other copy remains unmodified.
The callback function itself is similar to the callbacks we used in Sect. 4.1. The maindifference is the call to get_index_from_name that converts the variable name to aninteger index. The get_index_from_name function (not shown for brevity) also takesthe variable’s scope so that it can assign different indices to local variables in differentfunctions. It would be possible to directly pass the name itself (as a string) to the advicefunction, but the advice function would then incur the cost of looking up the variable byits name at runtime. This optimization illustrates the benefits of INTERASPECT’s callback-based approach to custom instrumentation.
The aop_capture_lhs_name function returns a string instead of an aop_dynvalobject because variable names are known at compile time. It is necessary to check for aNULL return value because not all assignments are to named variables.
To better understand InterAspect’s performance impact, we benchmarked this plug-inon the compute-intensive bzip2 compression utility using trivial advice functions. Thebzip2 package is a popular tool included in most Linux distributions. It has 110 functionsin about 8,000 lines of code. Our test plug-in, based on the code in Fig. 13, duplicateseach function body, adding an advice call to every integer assignment in one copy of thefunction body. Depending on the test, the distributor either returns 0 immediately, choosingthe uninstrumented path, or returns 1 immediately, for the instrumented path. The integerassignment advice function only increments a counter, allowing us to measure the overheadfrom calling advice functions independently from actual monitoring overhead. All in all,the plug-in instrumented 957 assignment join points. We also compared our INTERASPECT
plug-in to a similar transformation written in CIL [24] that adds an advice call to everyinteger assignment but does not perform function body duplication.
Figure 14 shows our results for bzip2 with five different instrumentation configurations.We benchmarked each of these configurations with three different input files: a 161 MB
Form Methods Syst Des
HTML file, a 161 MB file containing random bytes, and a 1.6 GB file containing zeros. TheHTML file consists of a novel taken from the Project Gutenberg web site and duplicated tocreate a larger file.
With a distributor that maximizes overhead by always choosing the instrumented functionbody (“InterAspect (Enabled)”), we measured 78.7 % runtime overhead in the worst case:the zero file. Function body duplication by itself contributes relatively little to this overhead;with a distributor that always chooses the uninstrumented path (“InterAspect (Disabled)”),we measured only 3.00 % overhead in the worst case: the HTML file.
High overhead is expected for the integer assignment pointcut because bzip2 performsinteger assignments very frequently. To compress the HTML file, bzip2 executed 5.34 bil-lion join points, more than 249 million integer assignments per second. The CIL integerassignment transformation we tested (“CIL” in Fig. 14) added 74.0 % overhead when com-pressing the zero file.
Much of the overhead in our test comes from the time it takes to enter and exit advicefunctions. When an advice function includes only a small amount of code, as in this ex-ample, it makes sense to insert that code directly at each join point to avoid function calloverhead. GCC can automatically perform this transformation, because INTERASPECT’sinstrumentation passes occur before GCC’s function inlining pass. Marking the integer as-signment advice function with GCC’s always_inline attribute reduced overhead to just25.0 % in the worst case: compressing the random file. We computed an overall time foreach configuration by summing the average times for each of the three files. We then com-puted an overall overhead for each instrumented configuration. The overall overhead forthe “InterAspect (Inline)” configuration was 13.4 %, the lowest of all the configurations wetested.
The only memory overhead from our range analysis tool comes from duplicating ev-ery function body, which roughly doubles the size of the text segment. The instrumentedbzip2 execution image was 69 KB larger, as reported by the size utility, an increase of96 %. Image size is small, however, compared to the total 7.2 MB of heap allocations whencompressing the HTML file with or without instrumentation, as reported by Valgrind.
We disabled GCC’s function inlining for all configurations, because it interfered withcomparisons between bzip2 configurations with function body duplication and configura-tions without it. When compiling without instrumentation, GCC inlined too aggressively,actually hurting performance. But with function body duplication, GCC was more reluc-tant to inline functions that were now twice as large, making it appear as if function bodyduplication improved performance and unfairly masking some of the overhead in our bench-marks. Note that disabling function inlining did not prevent GCC from inlining the advicefunction in the “InterAspect (Inline)” configuration, because we marked the advice functionwith the always_inline attribute.
4.3 Code coverage
A straightforward way to measure code coverage is to choose a pointcut and measure thepercentage of its join points that are executed during testing. INTERASPECT’s ability to iter-ate over each join point makes it simple to label join points and then track them at runtime.
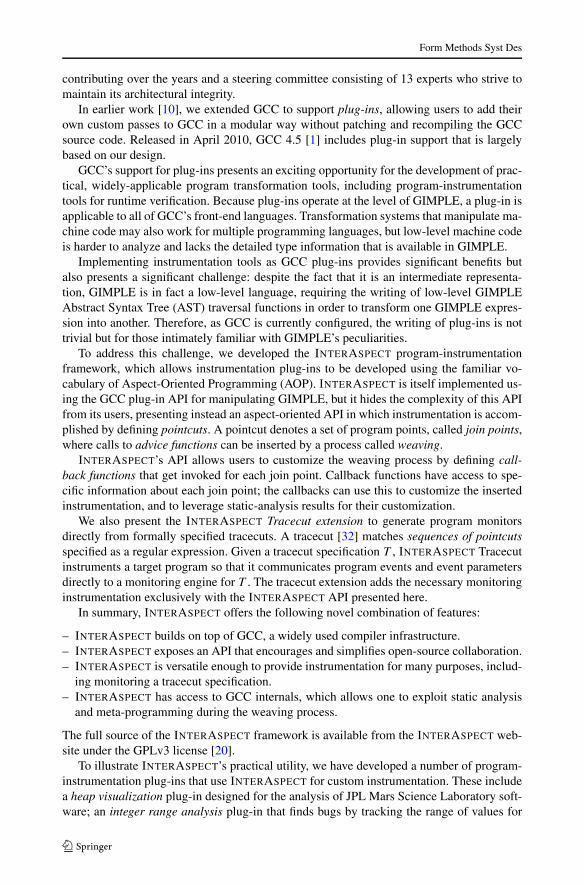
The example in Fig. 15 adds instrumentation to track coverage of function entry and exitpoints. To reduce runtime overhead, the choose_unique_index function assigns an inte-ger index to each tracked join point, similar to the indexing of integer variables in Sect. 4.2.Each index is saved along with its corresponding source filename and line number by thesave_index_to_disk function. The runtime advice needs to output only the set of cov-ered index numbers; an offline tool uses that output to compute the percentage of join points
/∗ Construct two pointcuts: one for function entry and one for function exit. ∗/entry_pc = aop_match_function_entry();exit_pc = aop_match_function_exit();
Fig. 15 Instrumenting function entry and exit for code coverage
covered or to list the filenames and line numbers of covered join points. For brevity we omitthe actual implementations of choose_unique_index and save_index_to_disk.
5 Tracecuts
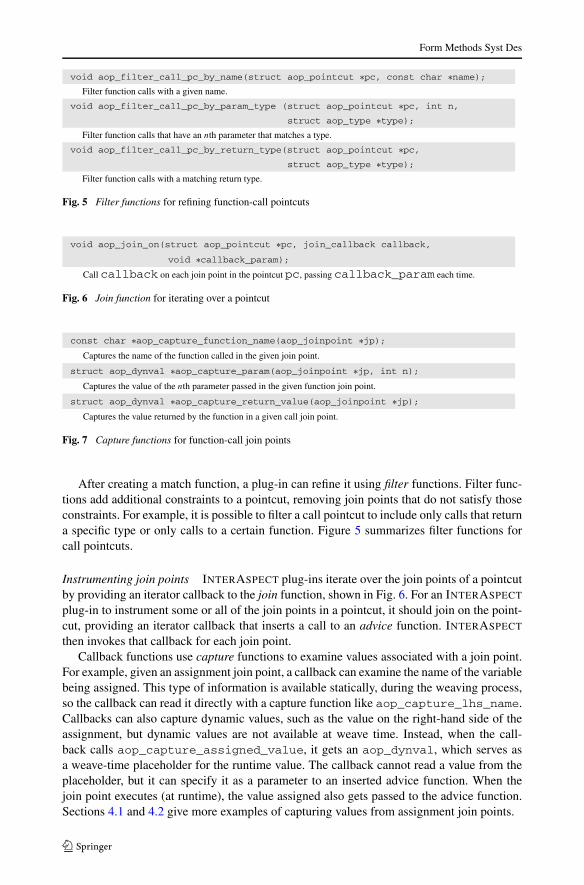
In this section, we present the API for the INTERASPECT Tracecut extension, and discussthe implementation of the associated tracecut monitoring engine. We also present two il-lustrative examples of the Tracecut extension: runtime verification of file access and GCCvectors. The architecture diagram in Fig. 3 shows how this extension and its associatedmonitoring engine fit into the overall INTERASPECT architecture.
Our INTERASPECT Tracecut extension showcases the flexibility of INTERASPECT’sAPI. Since one of our goals for this extension is to serve as a more powerful example of howto use INTERASPECT, its instrumentation component is built modularly on INTERASPECT:all of its access to GCC are through the published INTERASPECT interface.
Whereas pointcut advice is triggered by individual events, tracecut advice can be trig-gered by sequences of events matching a pattern [32]. A tracecut in our system is definedby a set symbols, each representing a possibly parameterized runtime event, and one ormore rules expressed as regular expressions over these symbols. For example, a tracecut thatmatches a call to exit or execve after a fork would specify symbols for fork, exit, andexecve function calls and the rule fork (exit | execve), where juxtaposition denotessequencing, parentheses are used for grouping, and the vertical bar “|” separates alterna-tives.
Each symbol is translated to a function-call pointcut, which is instrumented with ad-vice that sends the symbol’s corresponding event to the monitoring engine. The monitoring
Form Methods Syst Des
struct tc_tracecut ∗tc_create_tracecut(void);Create an empty tracecut.
engine signals a match whenever some suffix of the string of events matches one of theregular-expression rules.
Parameterization allows a tracecut to separately monitor multiple objects [5, 11]. Forexample, the rule fclose fread, designed to catch an illegal read from a closed file,should not match an fclose followed by an fread to a different file. When these eventsare parameterized by the file they operate on, the monitoring engine creates a unique monitorinstance for each file.
A tracecut with multiple parameters can monitor properties on sets of objects. A classicexample monitors data sources that have multiple iterators associated with them. When adata source is updated, its existing iterators become invalid, and any future access to them isan error. Parameterizing events by both data source and iterator creates a monitor instancefor each pair of data source and iterator.
The monitoring engine is implemented as a runtime library that creates monitor instancesand forwards events to their matching monitor instances. Because rules are specified as reg-ular expressions, each monitor instance stores a state in the equivalent finite-state machine.The user only has to link the monitoring library with the instrumented binary, and the trace-cut instrumentation calls directly into the library.
5.1 Tracecut API
A tracecut is specified by a C program that calls tracecut API functions. This design keepsthe tracecut extension simple, eliminating the need for a custom parser but still allowingconcise definitions. A tracecut specification can define any number of tracecuts, each withits own parameters, events, and rules.
Defining parameters The functions in Fig. 16 create a new tracecut and define its param-eters. Each parameter has a name and a type. The type is necessary because parameters areused to capture runtime values.
Defining symbols The tc_add_call_symbol function adds a new symbol that corre-sponds to an event at every call to a specified function. The tc_bind functions bind atracecut parameter to one of the function call’s parameters or to its return value. Figure 17shows tc_add_call_symbol and the tc_bind functions.
The tracecut API uses the symbol and its bindings to define a pointcut. Figure 18 showsan example symbol along with the INTERASPECT API calls that Tracecut makes to createthe pointcut. In a later step, Tracecut makes calls needed to capture the bound return valueand pass it to an advice function.
As a convenience, the API also provides the tc_declare_call_symbol function(also in Fig. 17), which can define a symbol and its parameter bindings with one call usinga simple text declaration. The declaration is syntactically similar to the C prototype for thefunction that will trigger the symbol, but the function’s formal parameters are replaced withtracecut parameter names or with a question mark “?” to indicate that a parameter shouldremain unbound. The code in Fig. 18(c) defines the same symbol as in Fig. 18(a).
(c) A more compact way to define the event in Fig. 18(a).
Fig. 18 An example of how the tracecut API translates a tracecut symbol into a pointcut. Because the cre-ate symbol’s return value is bound to the object param, the resulting pointcut is filtered to ensure thatits return value matches the type of object
enum tc_error tc_add_rule(struct tc_tracecut ∗tc, const char ∗specification);Define a tracecut rule. The specification is a regular expression using symbol names as its alphabet.
Fig. 19 Function for defining tracecut rule
Defining rules After symbols and their parameter bindings are defined, rules are expressedas strings containing symbol names and standard regular expression operators: (, ), ∗, +,and |. The function for adding a rule to a tracecut is shown in Fig. 19.
5.2 Monitor implementation
The monitoring engine maintains a list of monitor instances for each tracecut. Each instancehas a value for each tracecut parameter and a monitor state. Instrumented events pass thevalues of their parameters to the monitoring engine, which then determines which monitor
Form Methods Syst Des
instances to update. This monitor design is based on the way properties are monitored inTracematches [5] and MOP [11].
When a symbol is fully parameterized—it has a binding for every parameter defined inthe tracecut specification—the monitoring engine updates exactly one instance. If no in-stance exists with matching parameter values, one is created.
For partially parameterized symbols, like push in Fig. 23, the monitoring engine onlyrequires the specified parameters to match. As a result, events corresponding to these sym-bols can update multiple monitor instances. For example, a push event updates one monitorfor every element_pointer associated with the updated vector. As in the original MOPimplementation, partially parameterized symbols cannot create a new monitor instance [11].(MOP has since defined semantics for partially parameterized monitors [23].)
When any monitor instance reaches an accepting state, the monitoring engine reports amatch. The default match function prints the monitor parameters to stderr. Developerscan implement their own tracecut advice by overriding the default match function. Functionoverriding is possible in C using a linker feature called weak linkage. Placing a debuggerbreakpoint at the match function makes it possible to examine program state when a matchoccurs.
Monitoring instances get destroyed when they can no long reach an accepting state. Thetracecut engine does not attempt to free instances parameterized by freed objects because itis not always possible to learn when an object is freed in C and because parameters are notrequired to be pointers to heap-allocated objects.
A developer can ensure that stale monitor instances do not waste memory by designingthe rule to discard them. The easiest way to do this is to define a symbol for the functionthat deallocates an object but not to include the symbol anywhere in the tracecut’s rule.Deallocating the object then generates an event that makes it impossible for the tracecutrules to match.
Figure 20 is a pseudocode representation of the monitoring logic described in this section.Note that it uses a linear search to find monitors that need to be updated. This approachmakes sense when the number of monitor instances remains small throughout execution,as in the examples we discuss below. When the number of monitor instances is large, itwould be more efficient to maintain a hash table index for each possible parameterization.Updating these indexes would add a constant cost to creating a new monitor instance, butevents would no longer trigger an expensive O(n) lookup.
5.3 Verifying file access
As a first example of the tracecut API, we consider the runtime verification of file access.Like most resources in C, the FILE objects used for file I/O must be managed manually. Anyaccess to a FILE object after the file has been closed is a memory error which, though dan-gerous, might not manifest itself as incorrect behavior during testing. Designing a tracecutto detect these errors is straightforward.
The tracecut in Fig. 21 defines symbols for four FILE operations: open, close, and twokinds of reads. The rule matches any sequence of these symbols that opens a file, closes it,and then tries to read it.
The rule matches as soon as any read is performed on a closed FILE object, immediatelyidentifying the offending read. We tested this tracecut on bzip2 (which we also use forevaluation in Sect. 4.2); it caught an error we planted without reporting any false positives.
tc_add_rule(tc, "open (read | read_char)∗ close (read | read_char)");
Fig. 21 A tracecut for catching accesses to closed files. For brevity, the tracecut only checks read operations
5.4 Verifying GCC vectors
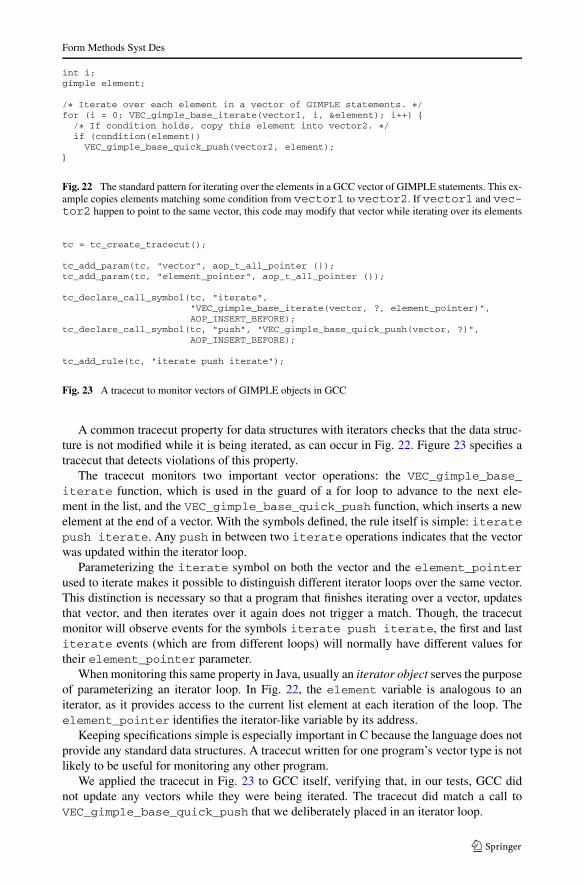
We designed a tracecut to monitor a property on a vector data structure used within GCCto store an ordered list of GIMPLE statements. The list is stored in a dynamically resizedarray. The vector API provides an iterator function to iterate over the GIMPLE statementsin a vector. Figure 22 shows how the iterator function is used. At each execution of the loop,the element variable points to the next statement in the vector.
Form Methods Syst Des
int i;gimple element;
/∗ Iterate over each element in a vector of GIMPLE statements. ∗/for (i = 0; VEC_gimple_base_iterate(vector1, i, &element); i++) {/∗ If condition holds, copy this element into vector2. ∗/if (condition(element))
VEC_gimple_base_quick_push(vector2, element);}
Fig. 22 The standard pattern for iterating over the elements in a GCC vector of GIMPLE statements. This ex-ample copies elements matching some condition from vector1 to vector2. If vector1 and vec-tor2 happen to point to the same vector, this code may modify that vector while iterating over its elements
Fig. 23 A tracecut to monitor vectors of GIMPLE objects in GCC
A common tracecut property for data structures with iterators checks that the data struc-ture is not modified while it is being iterated, as can occur in Fig. 22. Figure 23 specifies atracecut that detects violations of this property.
The tracecut monitors two important vector operations: the VEC_gimple_base_iterate function, which is used in the guard of a for loop to advance to the next ele-ment in the list, and the VEC_gimple_base_quick_push function, which inserts a newelement at the end of a vector. With the symbols defined, the rule itself is simple: iteratepush iterate. Any push in between two iterate operations indicates that the vectorwas updated within the iterator loop.
Parameterizing the iterate symbol on both the vector and the element_pointerused to iterate makes it possible to distinguish different iterator loops over the same vector.This distinction is necessary so that a program that finishes iterating over a vector, updatesthat vector, and then iterates over it again does not trigger a match. Though, the tracecutmonitor will observe events for the symbols iterate push iterate, the first and lastiterate events (which are from different loops) will normally have different values fortheir element_pointer parameter.
When monitoring this same property in Java, usually an iterator object serves the purposeof parameterizing an iterator loop. In Fig. 22, the element variable is analogous to aniterator, as it provides access to the current list element at each iteration of the loop. Theelement_pointer identifies the iterator-like variable by its address.
Keeping specifications simple is especially important in C because the language does notprovide any standard data structures. A tracecut written for one program’s vector type is notlikely to be useful for monitoring any other program.
We applied the tracecut in Fig. 23 to GCC itself, verifying that, in our tests, GCC didnot update any vectors while they were being iterated. The tracecut did match a call toVEC_gimple_base_quick_push that we deliberately placed in an iterator loop.
Fig. 24 A tracecut for catching accesses to connections after they have been closed by the server
Because monitored events in our INTERASPECT Tracecut examples execute less fre-quently than the integer assignment join points in our integer range analysis example(Sect. 4.2), we found overhead to be less of an issue. We measured overhead for both the fileaccess tracecut we tested in Sect. 5.3 and the tracecut in this section to be less than 1 %.
5.5 Verifying lighttpd connections
We also used INTERASPECT Tracecut to check a property of connections in the lighttpd(pronounced lighty) HTTP server [22]. Lighttpd creates many connections, allowing usto evaluate the performance of INTERASPECT Tracecut with many monitors. The lighttpdserver maintains a connection object for each open connection from a client. Each con-nection object stores a TCP network socket and all state information for the client’s HTTPsession.
The property we checked, shown in Fig. 24, is that the server does not try to update thestate of a connection after the connection has been closed; this is similar to the file propertypresented in Sect. 5.3. After connection_close is called on a connection object, anyupdates to that object via connection_state_machine will trigger a match, unless acall to connections_get_new_connection re-initializes the object first.
We found that lighttpd sometimes closes connections while they are on its list of con-nection objects that are pending a state update. The service routine for this list then up-dates the state of the closed connection, but this usage does not cause an error. To avoid errorreports for this correct usage, we overrode the tracecut match function to ignore matches onobjects in the pending connection list. The custom match function still reports other stateupdates on closed connections. These state updates would likely indicate an error. Our testruns did not find any such updates in the version of lighttpd we tested.
To test performance, we stressed lighttpd with the http_load tool, which loads anHTTP server with a large number of parallel requests and measures response times [27].The version we used includes a patch from the lighttpd authors [22] to report errors moreaccurately and additional modifications to report standard deviations of response time sam-ples, which we needed to make conclusions about statistical significance. We configuredhttp_load to open HTTP requests in groups of 100 at a time, the most that lighttpd couldhandle on our test hardware without dropping connections. With this test workload, IN-TERASPECT Tracecut had to maintain at least 100 monitor instances throughout the courseof the test.
Monitoring did not cause a statistically significant increase in response time, becauselighttpd’s operation is largely I/O-bound. The average response time was 21.9 ms for thetwo million requests in the unmonitored and monitored runs. Monitoring did increase the
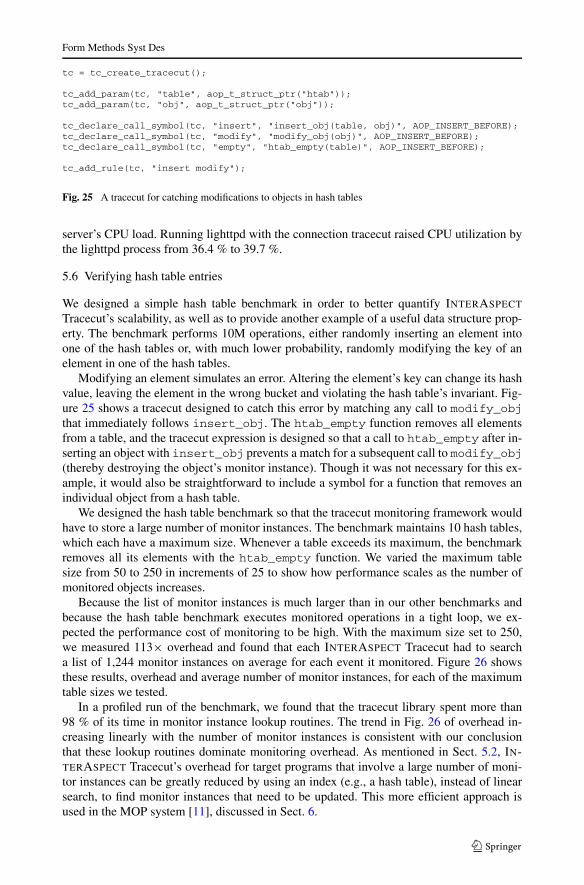
Fig. 25 A tracecut for catching modifications to objects in hash tables
server’s CPU load. Running lighttpd with the connection tracecut raised CPU utilization bythe lighttpd process from 36.4 % to 39.7 %.
5.6 Verifying hash table entries
We designed a simple hash table benchmark in order to better quantify INTERASPECT
Tracecut’s scalability, as well as to provide another example of a useful data structure prop-erty. The benchmark performs 10M operations, either randomly inserting an element intoone of the hash tables or, with much lower probability, randomly modifying the key of anelement in one of the hash tables.
Modifying an element simulates an error. Altering the element’s key can change its hashvalue, leaving the element in the wrong bucket and violating the hash table’s invariant. Fig-ure 25 shows a tracecut designed to catch this error by matching any call to modify_objthat immediately follows insert_obj. The htab_empty function removes all elementsfrom a table, and the tracecut expression is designed so that a call to htab_empty after in-serting an object with insert_obj prevents a match for a subsequent call to modify_obj(thereby destroying the object’s monitor instance). Though it was not necessary for this ex-ample, it would also be straightforward to include a symbol for a function that removes anindividual object from a hash table.
We designed the hash table benchmark so that the tracecut monitoring framework wouldhave to store a large number of monitor instances. The benchmark maintains 10 hash tables,which each have a maximum size. Whenever a table exceeds its maximum, the benchmarkremoves all its elements with the htab_empty function. We varied the maximum tablesize from 50 to 250 in increments of 25 to show how performance scales as the number ofmonitored objects increases.
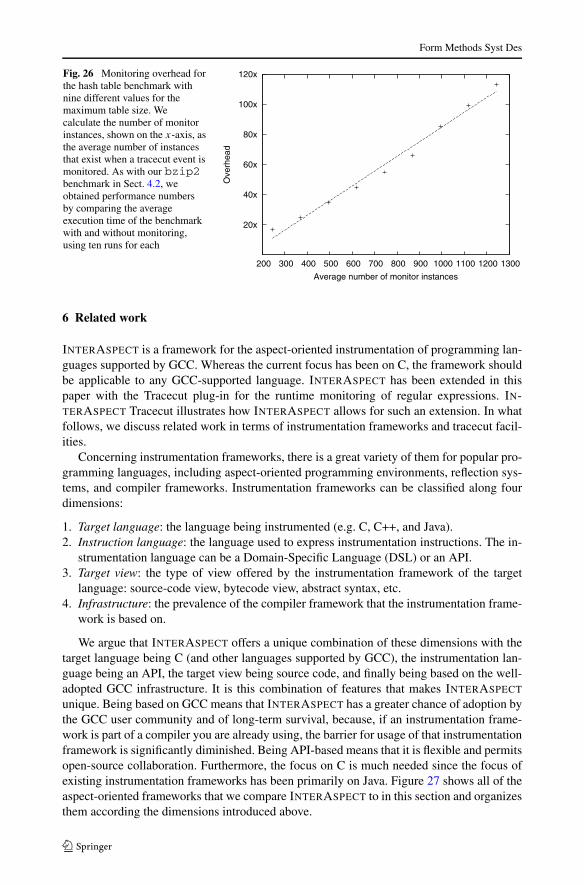
Because the list of monitor instances is much larger than in our other benchmarks andbecause the hash table benchmark executes monitored operations in a tight loop, we ex-pected the performance cost of monitoring to be high. With the maximum size set to 250,we measured 113× overhead and found that each INTERASPECT Tracecut had to searcha list of 1,244 monitor instances on average for each event it monitored. Figure 26 showsthese results, overhead and average number of monitor instances, for each of the maximumtable sizes we tested.
In a profiled run of the benchmark, we found that the tracecut library spent more than98 % of its time in monitor instance lookup routines. The trend in Fig. 26 of overhead in-creasing linearly with the number of monitor instances is consistent with our conclusionthat these lookup routines dominate monitoring overhead. As mentioned in Sect. 5.2, IN-TERASPECT Tracecut’s overhead for target programs that involve a large number of moni-tor instances can be greatly reduced by using an index (e.g., a hash table), instead of linearsearch, to find monitor instances that need to be updated. This more efficient approach isused in the MOP system [11], discussed in Sect. 6.
Form Methods Syst Des
Fig. 26 Monitoring overhead forthe hash table benchmark withnine different values for themaximum table size. Wecalculate the number of monitorinstances, shown on the x-axis, asthe average number of instancesthat exist when a tracecut event ismonitored. As with our bzip2benchmark in Sect. 4.2, weobtained performance numbersby comparing the averageexecution time of the benchmarkwith and without monitoring,using ten runs for each
6 Related work
INTERASPECT is a framework for the aspect-oriented instrumentation of programming lan-guages supported by GCC. Whereas the current focus has been on C, the framework shouldbe applicable to any GCC-supported language. INTERASPECT has been extended in thispaper with the Tracecut plug-in for the runtime monitoring of regular expressions. IN-TERASPECT Tracecut illustrates how INTERASPECT allows for such an extension. In whatfollows, we discuss related work in terms of instrumentation frameworks and tracecut facil-ities.
Concerning instrumentation frameworks, there is a great variety of them for popular pro-gramming languages, including aspect-oriented programming environments, reflection sys-tems, and compiler frameworks. Instrumentation frameworks can be classified along fourdimensions:
1. Target language: the language being instrumented (e.g. C, C++, and Java).2. Instruction language: the language used to express instrumentation instructions. The in-
strumentation language can be a Domain-Specific Language (DSL) or an API.3. Target view: the type of view offered by the instrumentation framework of the target
language: source-code view, bytecode view, abstract syntax, etc.4. Infrastructure: the prevalence of the compiler framework that the instrumentation frame-
work is based on.
We argue that INTERASPECT offers a unique combination of these dimensions with thetarget language being C (and other languages supported by GCC), the instrumentation lan-guage being an API, the target view being source code, and finally being based on the well-adopted GCC infrastructure. It is this combination of features that makes INTERASPECT
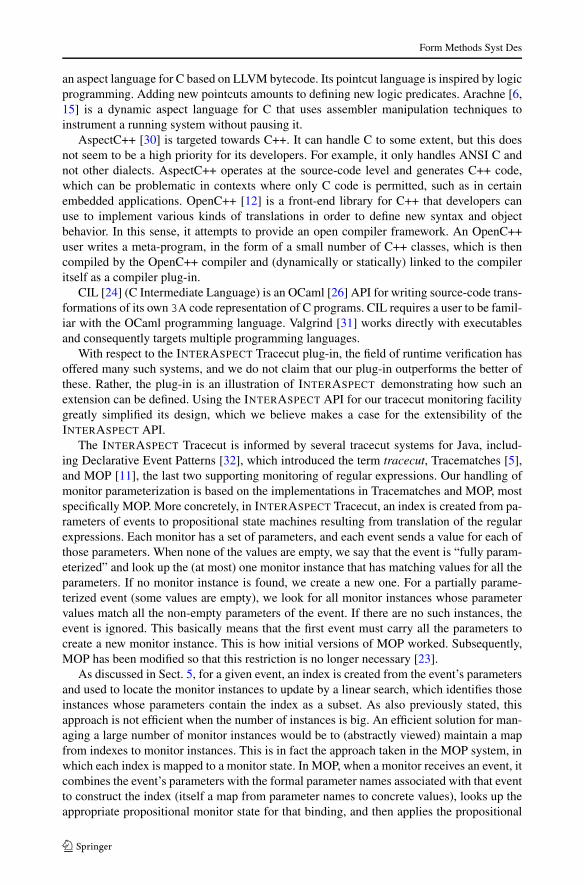
unique. Being based on GCC means that INTERASPECT has a greater chance of adoption bythe GCC user community and of long-term survival, because, if an instrumentation frame-work is part of a compiler you are already using, the barrier for usage of that instrumentationframework is significantly diminished. Being API-based means that it is flexible and permitsopen-source collaboration. Furthermore, the focus on C is much needed since the focus ofexisting instrumentation frameworks has been primarily on Java. Figure 27 shows all of theaspect-oriented frameworks that we compare INTERASPECT to in this section and organizesthem according the dimensions introduced above.
Form Methods Syst Des
Fig. 27 A breakdown of the frameworks discussed in this section by the first three of our four classificationdimensions, target language, instruction language, and target view. Not included in this hierarchy are CILand Valgrind, which both provide general-purpose frameworks that are not aspect oriented
In addition to filling a new role in the spectrum of instrumentation frameworks, IN-TERASPECT offers two novel features to the field of aspect-oriented programming. First,INTERASPECT supports the notion of callback functions, which can be applied during in-strumentation. Such functions can perform customized instrumentation at each join point, acapability other AOP approaches lack. Second, function body duplication makes it possibleto efficiently toggle instrumentation on and off at runtime or to switch between two differentinstrumentation profiles.
Aspect-oriented programming was first popularized for Java with AspectJ [16, 21].There, weaving takes place at the bytecode level. The user is provided with a source-codeview and writes instrumentation instructions in a specialized DSL supporting pointcut defi-nitions and advice definitions. The AspectBench Compiler (abc) [8] is a more recent exten-sible research version of AspectJ that makes it possible to add new language constructs [9].Similarly to INTERASPECT, it manipulates a 3A intermediate representation (Jimple) spe-cialized to Java.
Other frameworks for Java, including Javaassist [13] and PROSE [25], offer, in a man-ner similar to INTERASPECT an API for instrumenting and modifying code, and hence donot require the use of a special language. Javaassist is a class library for editing bytecode.A source-level API can be used to edit class files without knowledge of the bytecode for-mat. PROSE has similar goals. The BCEL [2] tool provides an API for manipulating Javabytecode.
AOP for other languages such as C and C++ has had a slower uptake. AspectC [14] wasone of the first AOP systems for C, based on the language constructs of AspectJ. ACC [3]is a more recent AOP system for C, also based on the language constructs of AspectJ. Bothsystems offer specialized DSLs for writing pointcuts and advice, just like AspectJ, providingthe user with a source-code view of the code to be instrumented. They transform source codeand offer their own internal compiler framework for parsing C. These are closed systems inthe sense that one cannot augment them with new pointcuts or access the internal structureof a C program in order to perform static analysis.
The XWeaver system [28], with its language AspectX, represents a program in XML,making it independent of the programming language. It supports Java and C++. The choiceof an XML-based representation of the base code has the advantage of partially decouplingthe aspect weaver and the aspect language from the language of the base code. Aspicere [7] is
Form Methods Syst Des
an aspect language for C based on LLVM bytecode. Its pointcut language is inspired by logicprogramming. Adding new pointcuts amounts to defining new logic predicates. Arachne [6,15] is a dynamic aspect language for C that uses assembler manipulation techniques toinstrument a running system without pausing it.
AspectC++ [30] is targeted towards C++. It can handle C to some extent, but this doesnot seem to be a high priority for its developers. For example, it only handles ANSI C andnot other dialects. AspectC++ operates at the source-code level and generates C++ code,which can be problematic in contexts where only C code is permitted, such as in certainembedded applications. OpenC++ [12] is a front-end library for C++ that developers canuse to implement various kinds of translations in order to define new syntax and objectbehavior. In this sense, it attempts to provide an open compiler framework. An OpenC++user writes a meta-program, in the form of a small number of C++ classes, which is thencompiled by the OpenC++ compiler and (dynamically or statically) linked to the compileritself as a compiler plug-in.
CIL [24] (C Intermediate Language) is an OCaml [26] API for writing source-code trans-formations of its own 3A code representation of C programs. CIL requires a user to be famil-iar with the OCaml programming language. Valgrind [31] works directly with executablesand consequently targets multiple programming languages.
With respect to the INTERASPECT Tracecut plug-in, the field of runtime verification hasoffered many such systems, and we do not claim that our plug-in outperforms the better ofthese. Rather, the plug-in is an illustration of INTERASPECT demonstrating how such anextension can be defined. Using the INTERASPECT API for our tracecut monitoring facilitygreatly simplified its design, which we believe makes a case for the extensibility of theINTERASPECT API.
The INTERASPECT Tracecut is informed by several tracecut systems for Java, includ-ing Declarative Event Patterns [32], which introduced the term tracecut, Tracematches [5],and MOP [11], the last two supporting monitoring of regular expressions. Our handling ofmonitor parameterization is based on the implementations in Tracematches and MOP, mostspecifically MOP. More concretely, in INTERASPECT Tracecut, an index is created from pa-rameters of events to propositional state machines resulting from translation of the regularexpressions. Each monitor has a set of parameters, and each event sends a value for each ofthose parameters. When none of the values are empty, we say that the event is “fully param-eterized” and look up the (at most) one monitor instance that has matching values for all theparameters. If no monitor instance is found, we create a new one. For a partially parame-terized event (some values are empty), we look for all monitor instances whose parametervalues match all the non-empty parameters of the event. If there are no such instances, theevent is ignored. This basically means that the first event must carry all the parameters tocreate a new monitor instance. This is how initial versions of MOP worked. Subsequently,MOP has been modified so that this restriction is no longer necessary [23].
As discussed in Sect. 5, for a given event, an index is created from the event’s parametersand used to locate the monitor instances to update by a linear search, which identifies thoseinstances whose parameters contain the index as a subset. As also previously stated, thisapproach is not efficient when the number of instances is big. An efficient solution for man-aging a large number of monitor instances would be to (abstractly viewed) maintain a mapfrom indexes to monitor instances. This is in fact the approach taken in the MOP system, inwhich each index is mapped to a monitor state. In MOP, when a monitor receives an event, itcombines the event’s parameters with the formal parameter names associated with that eventto construct the index (itself a map from parameter names to concrete values), looks up theappropriate propositional monitor state for that binding, and then applies the propositional
Form Methods Syst Des
event in that monitor state to obtain a new state. More specifically, a monitor state is updatedif it is mapped to by an index that includes the index produced by the event. The completealgorithm for MOP is more sophisticated than just described here. Note, however, that thetracecut solution is not an attempt to improve on existing monitoring solutions, but rather toillustrate how such a solution can easily be built on top of InterAspcect.
Another difference between INTERASPECT Tracecut and MOP is in their approaches todestroying monitor instances. MOP destroys an instance when the garbage collector reapsthe objects assigned to the instance’s parameters. Because C programs are not garbage col-lected and because INTERASPECT Tracecut can use parameters that are not allocated objects(such as integer file handles), instances in INTERASPECT Tracecut are destroyed when theycan no longer reach an accepting state.
For C, Arachne and Aspicere provide tracecut-style monitoring. Arachne can moni-tor pointcut sequences which have similar semantics to INTERASPECT Tracecut’s regu-lar expressions [15]. The cHALO extension to Aspicere adds predicates for defining se-quences [4]. These predicates are designed to give developers better control over the amountof memory used to track monitor instances.
7 Conclusions
We have presented INTERASPECT, a framework for developing powerful instrumentationplug-ins for the GCC suite of production compilers. INTERASPECT-based plug-ins instru-ment programs compiled with GCC by modifying GCC’s intermediate language, GIMPLE.The INTERASPECT API simplifies this process by offering an AOP-based interface. Plug-in developers can easily specify pointcuts to target specific program join points and thenadd customized instrumentation at those join points. We presented several example plug-insthat demonstrate the framework’s ability to customize runtime instrumentation for specificapplications. Finally, we developed a more full-featured application of our API: the IN-TERASPECT Tracecut extension, which monitors formally defined runtime properties. TheAPI and the tracecut extension are available under an open-source license [20].
As future work, we plan to add pointcuts for all control flow constructs, thereby allowinginstrumentation to trace a program run’s exact path of execution. We also plan to investigateAPI support for pointcuts that depend on dynamic information, such as AspectJ’s cflow.Dynamic pointcuts can already be implemented in INTERASPECT with advice functionsthat maintain and use appropriate state, or even with tracecut advice, but API support wouldeliminate the need to write such advice functions.
Acknowledgements We thank the anonymous reviewers for their valuable comments. Part of the researchdescribed herein was carried out at the Jet Propulsion Laboratory (JP), California Institute of Technology,under a contract with the National Aeronautics and Space Administration. Research described here wassupported in part by AFOSR Grant FA9550-09-1-0481, NSF Grants CCF-0926190, CCF-0613913, CNS-0831298, and CNS-0509230, and ONR Grants N00014-07-1-0928 and N00014-09-1-0651.
References
1. GCC 4.5 release series changes, new features, and fixes. http://gcc.gnu.org/gcc-4.5/changes.html2. BCEL. http://jakarta.apache.org/bcel3. ACC. http://research.msrg.utoronto.ca/ACC4. Adams B, Herzeel C, Gybels K (2008) cHALO, stateful aspects in C. In: ACP4IS ’08: Proceedings of
the 2008 AOSD workshop on aspects, components, and patterns for infrastructure software, New York,NY, USA. ACM, New York, pp 1–6
5. Allan C, Avgustinov P, Christensen AS, Hendren L, Kuzins S, Lhoták O, de Moor O, Sereni D, Sit-tamplan G, Tibble J (2005) Adding trace matching with free variables to AspectJ. In: Proceedings ofthe 20th annual ACM SIGPLAN conference on object-oriented programming, systems, languages andapplications (OOPSLA’05). ACM Press, New York
6. Arachne. www.emn.fr/x-info/arachne7. Aspicere. http://sailhome.cs.queensu.ca/~bram/aspicere8. Avgustinov P, Christensen AS, Hendren L, Kuzins S, Lhoták J, Lhoták O, de Moor O, Sereni D, Sittam-
palam G, Tibble J (2005) Abc: An extensible AspectJ compiler. In: Proceedings of the fourth interna-tional conference on aspect-oriented software development. ACM Press, New York
9. Bodden E, Havelund K (2008) Racer: Effective race detection using AspectJ. In: Proceedings of theACM/SIGSOFT international symposium on software testing and analysis (ISSTA). ACM, New York,pp 155–165
10. Callanan S, Dean DJ, Zadok E (2007) Extending GCC with modular GIMPLE optimizations. In: Pro-ceedings of the 2007 GCC developers’ summit, Ottawa, Canada, July, pp 31–37
11. Chen F, Rosu G (2007) MOP: an efficient and generic runtime verification framework. In: Proceedingsof the 22nd annual ACM SIGPLAN conference on object-oriented programming, systems, languagesand applications (OOPSLA’07)
12. Chiba S (1995) A metaobject protocol for C++. In: Proceedings of the ACM conference on object-oriented programming systems, languages, and applications, October, pp 285–299
13. Chiba S (2000) Load-time structural reflection in Java. In: Proceedings of the 14th European conferenceon object-oriented programming. LNCS, vol 1850. Springer, Berlin, pp 313–336
14. Coady Y, Kiczales G, Feeley M, Smolyn G (2001) Using AspectC to improve the modularity of path-specific customization in operating system code. In: Proceedings of the 9th ACM SIGSOFT symposiumon the foundations of software engineering (FSE), pp 88–98
15. Douence R, Fritz T, Loriant N, Menaud J-M, Ségura-Devillechaise M, Südholt M (2005) An expressiveaspect language for system applications with Arachne. In: Proceedings of the 4th international confer-ence on aspect-oriented software development (AOSD). ACM Press, New York
16. Eclipse Foundation T AspectJ. www.eclipse.org/aspectj17. Fei L, Midkiff SP (2005) Artemis: Practical runtime monitoring of applications for errors. Tech Rep
TR-ECE-05-02, Electrical and Computer Engineering, Purdue University. docs.lib.purdue.edu/ecetr/4/18. AT&T RESEARCH LABS. Graphviz, 2009. www.graphviz.org19. Huang X, Seyster J, Callanan S, Dixit K, Grosu R, Smolka SA, Stoller SD, Zadok E (2012) Software
monitoring with controllable overhead. Int J Softw Tools Technol Transf 14(3):327–34720. InterAspect. www.fsl.cs.stonybrook.edu/interaspect21. Kiczales G, Hilsdale E, Hugunin J, Kersten M, Palm J, Griswold WG (2001) An overview of AspectJ.
In: Proceedings of the 15th European conference on object-oriented programming. LNCS, vol 2072,pp 327–355
22. Kneschke J (2009) Lighttpd. www.lighttpd.net/23. Meredith PO, Jin D, Griffith D, Chen F, Rosu G (2011) An overview of the MOP runtime verification
framework. Int J Softw Tech Technol Transf, to appear24. Necula GC, McPeak S, Rahul SP, Weimer W (2002) CIL: Intermediate language and tools for analysis
and transformation of C programs. In: Proceedings of the 11th international conference on compilerconstruction. Springer, Berlin, pp 213–228
25. Nicoara A, Alonso G, Roscoe T (2008) Controlled, systematic, and efficient code replacement for run-ning Java programs. In: Proceedings of the ACM EuroSys conference, Glasgow, Scotland, UK, April
26. Objective Caml. http://caml.inria.fr/index.en.html27. Poskanzer J (2006) http_load. http://www.acme.com/software/http_load/28. Rohlik O, Pasetti A, Cechticky V, Birrer I (2004) Implementing adaptability in embedded software
through aspect oriented programming. IEEE Mechatron Robot 85–9029. Seyster J, Dixit K, Huang X, Grosu R, Havelund K, Smolka SA, Stoller SD, Zadok E (2010) Aspect-
oriented instrumentation with GCC. In: Proc. of the 1st international conference on runtime verification(RV), November. Lecture Notes in Computer Science. Springer, Berlin
30. Spinczyk O, Lohmann D (2007) The design and implementation of AspectC++. Knowl-Based Syst20(7):636–651
31. Valgrind. http://valgrind.org32. Walker R, Viggers K (2004) Implementing protocols via declarative event patterns. In: Taylor R,
Dwyer M (eds) ACM Sigsoft 12th international symposium on foundations of software engineering(FSE-12). ACM Press, New York, pp 159–169