EO S Intercomparisons of IASI and AATSR calibrated radiances John Remedios 1 Jonathan Mittaz 2 , Manik Bali 2 , David Moore 1 and Chris Whyte 1 1. EOS-SRC/NCEO, Physics and Astronomy, University of Leicester, UK 2. CICS/NOAA, Univ. of Maryland, USA
Transcript
EOS
Intercomparisons of IASI and AATSR calibrated radiances
John Remedios1
Jonathan Mittaz2, Manik Bali2, David
Moore1 and Chris Whyte1
1. EOS-SRC/NCEO, Physics and Astronomy,
University of Leicester, UK 2. CICS/NOAA, Univ. of Maryland, USA
EOS
Radiometric inter-calibration
• Important! • Operational radiance bias correction – GSICs • Calibrated level 1 radiance time series for climate • Confidence in satellite climate records – give rise directly to
delta(SST). Typically want 0.1 K accuracy, <0.04 K/decade stability (Ohring, 2005; WMO 2011)
• Could inform on radiometer spectral filter functions.
Acknowledgements: David Llewellyn-Jones , Gary Corlett , Darren Ghent (Leicester) and Dave Smith (RAL) The ATSR team in the UK Funding: Eumetsat and NOAA; Also DECC and NERC in UK
EOS
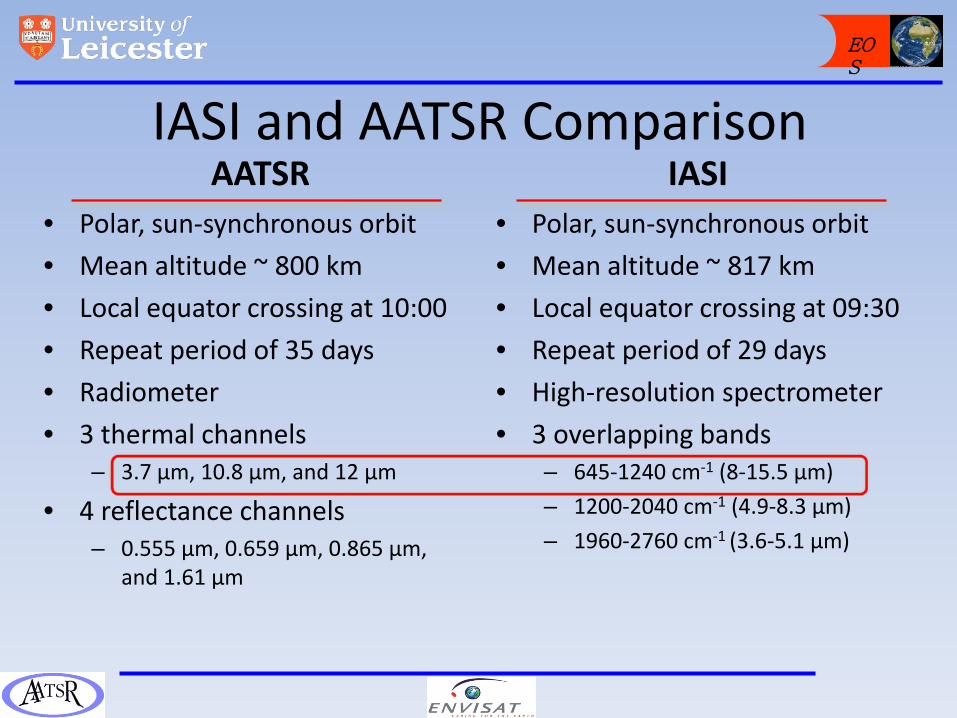
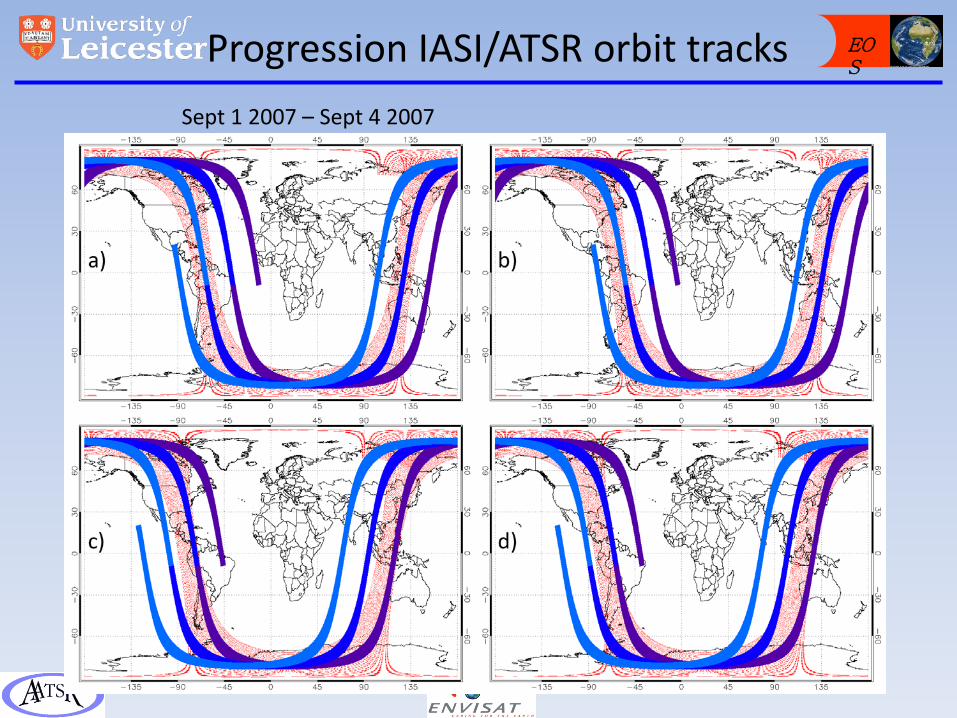
IASI and AATSR Comparison AATSR
• Polar, sun-synchronous orbit • Mean altitude ~ 800 km • Local equator crossing at 10:00 • Repeat period of 35 days • Radiometer • 3 thermal channels
IASI • Polar, sun-synchronous orbit • Mean altitude ~ 817 km • Local equator crossing at 09:30 • Repeat period of 29 days • High-resolution spectrometer • 3 overlapping bands
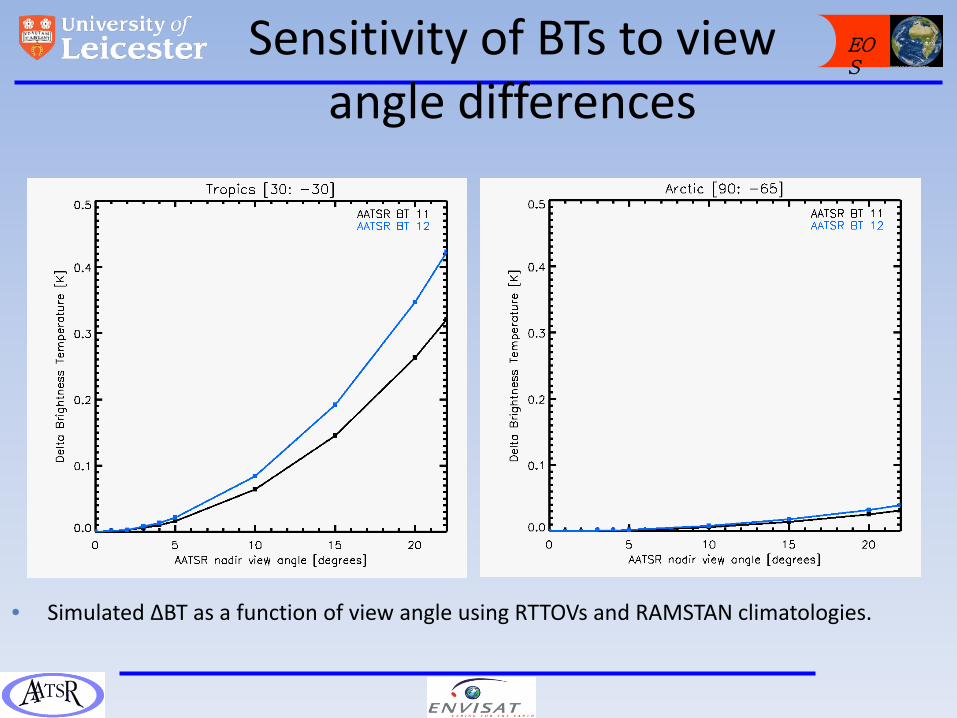
• Simulated ΔBT as a function of view angle using RTTOVs and RAMSTAN climatologies.
EOS
Co-locations
Criteria (M=long time series; L = Sept 2007): • Time difference < 15 min (M); variable (L) • SD of collated pixels < 0.5 K (M); fully clear+0.4 K cloudy (L) • SD Perimeter < 1 K (M) • Maximum satellite zenith angle difference of 1° (M); 1% in
sec(angle) (L) [similar] M – preflight spectral filter profiles L – smoothed spectral filter profiles. [Very small differences]
EOS
Results: 11 μm
• 2009-10 summer months+Jan./Feb. 20011 • Results at 11 μm show an approximately constant offset between
IASI and AATSR of 0.06 K • Consistent with 0.04 K reported in D.5 • Could be IASI or AATSR bias (note pre-launch calibration shows
small AATSR bias at 11 μm)
EOS
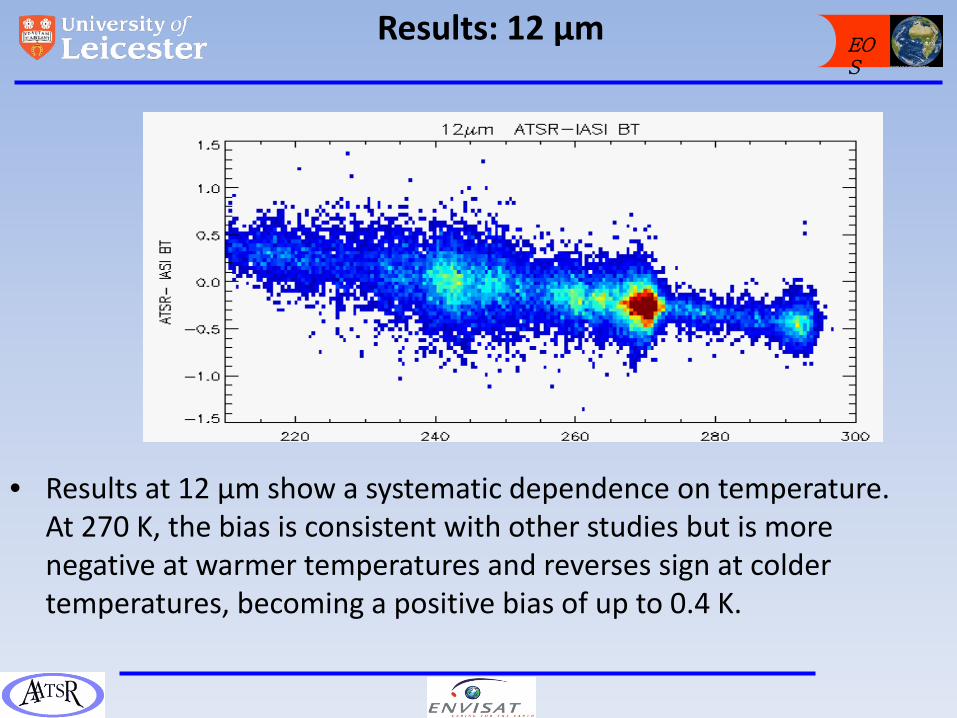
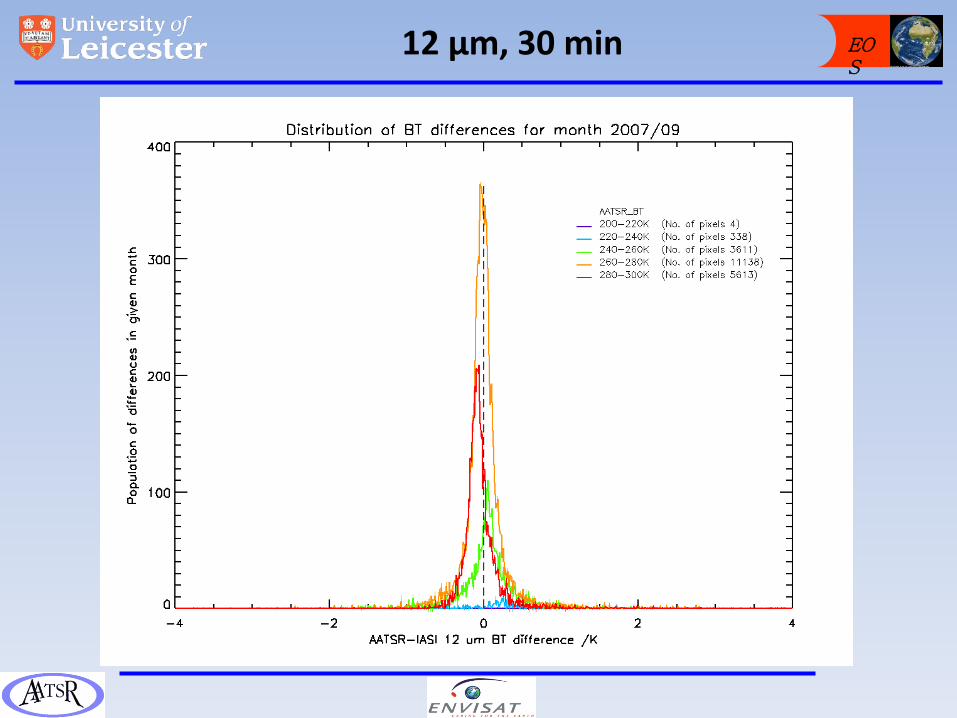
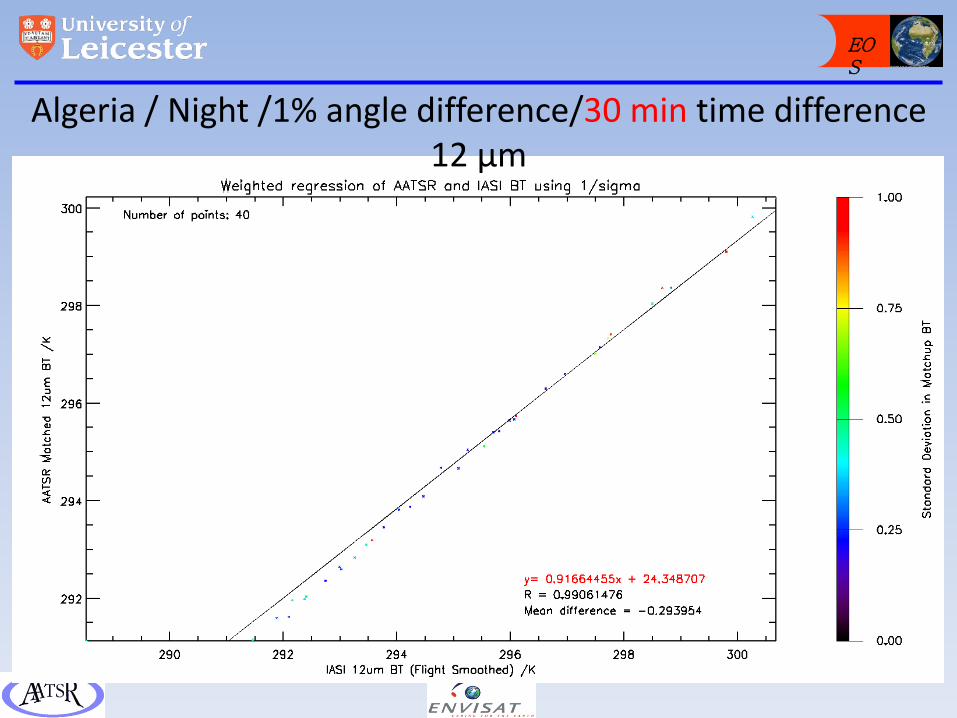
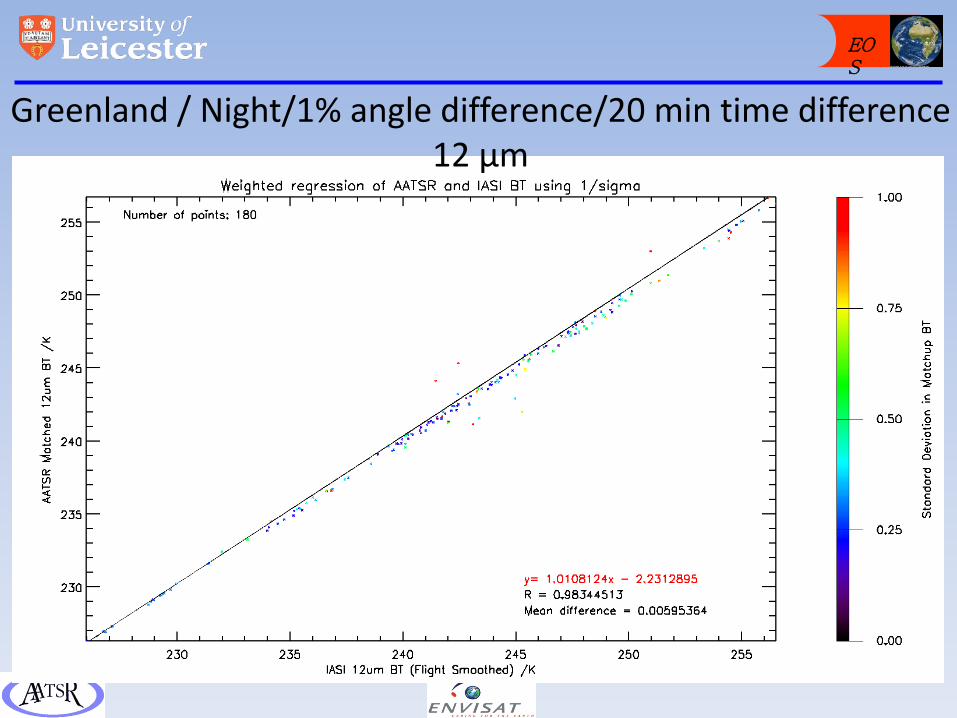
Results: 12 μm
• Results at 12 μm show a systematic dependence on temperature. At 270 K, the bias is consistent with other studies but is more negative at warmer temperatures and reverses sign at colder temperatures, becoming a positive bias of up to 0.4 K.
EOS
Sea
EOS
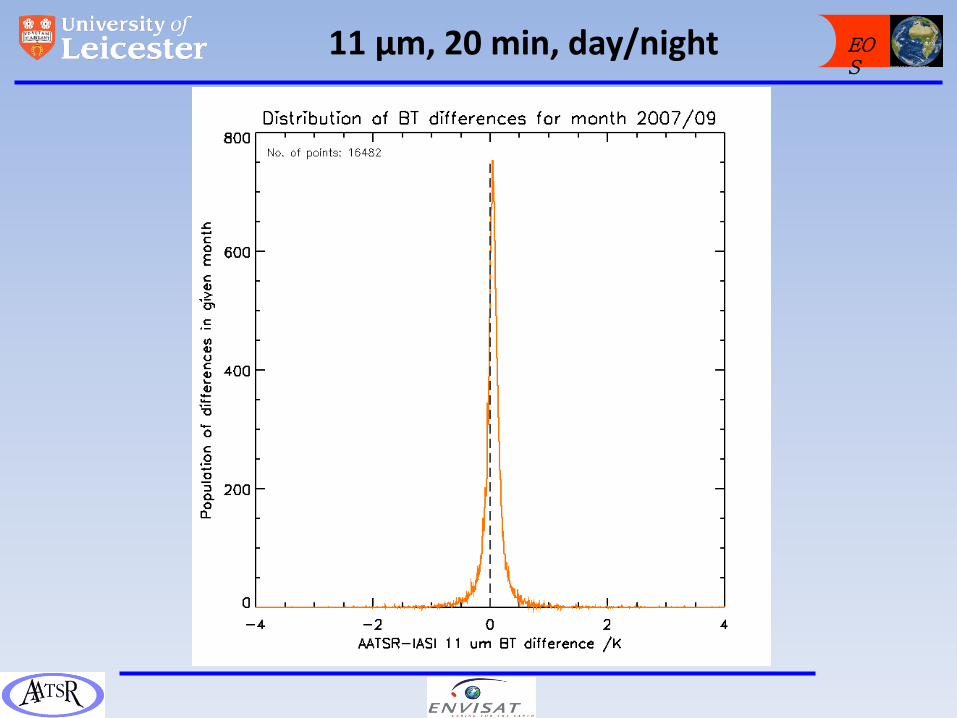
11 µm, 20 min, day/night
EOS
11 µm, 20 min, sea and night
200-220 K 0.135
220-240 K 0.075
240-260 K 0.065
260-280 K 0.015
280-300 K 0.015
EOS
12 µm, 20 min, sea and night
200-220 K 0375
220-240 K 0.265
240-260 K 0.145
260-280 K -0.035
280-300 K -0.155
EOS
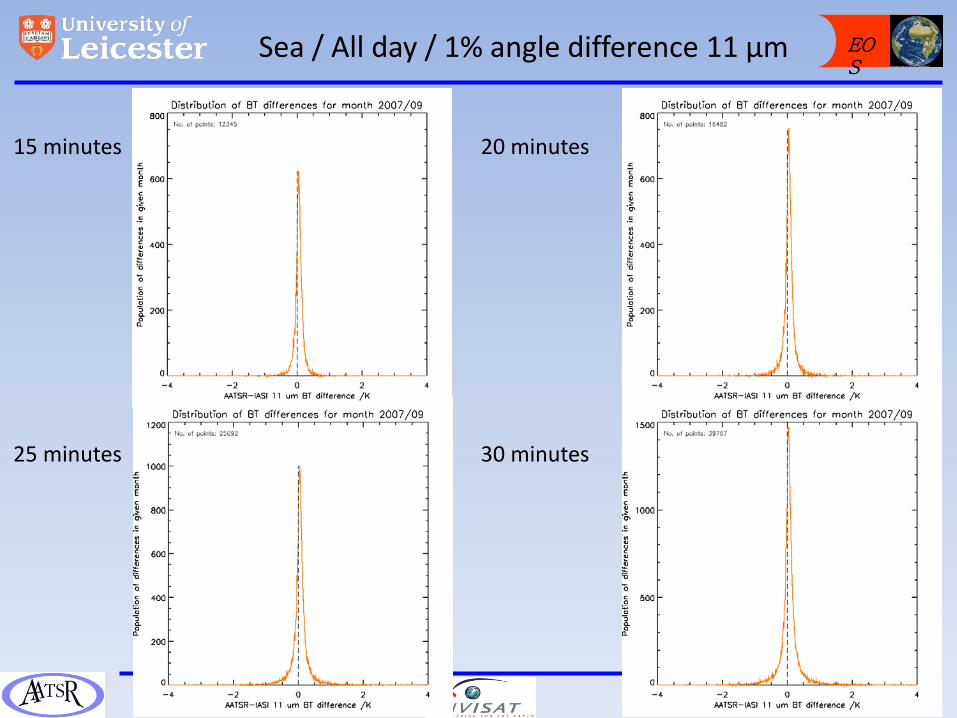
Sea / All day / 1% angle difference 11 µm
15 minutes 20 minutes
25 minutes 30 minutes
EOS
12 µm, 30 min
EOS
Land
EOS
Land / Day / 1% angle difference 11 µm
15 minutes 20 minutes
25 minutes 30 minutes
EOS
Land / Night / 1% angle difference 11 µm
15 minutes 20 minutes
25 minutes 30 minutes
EOS
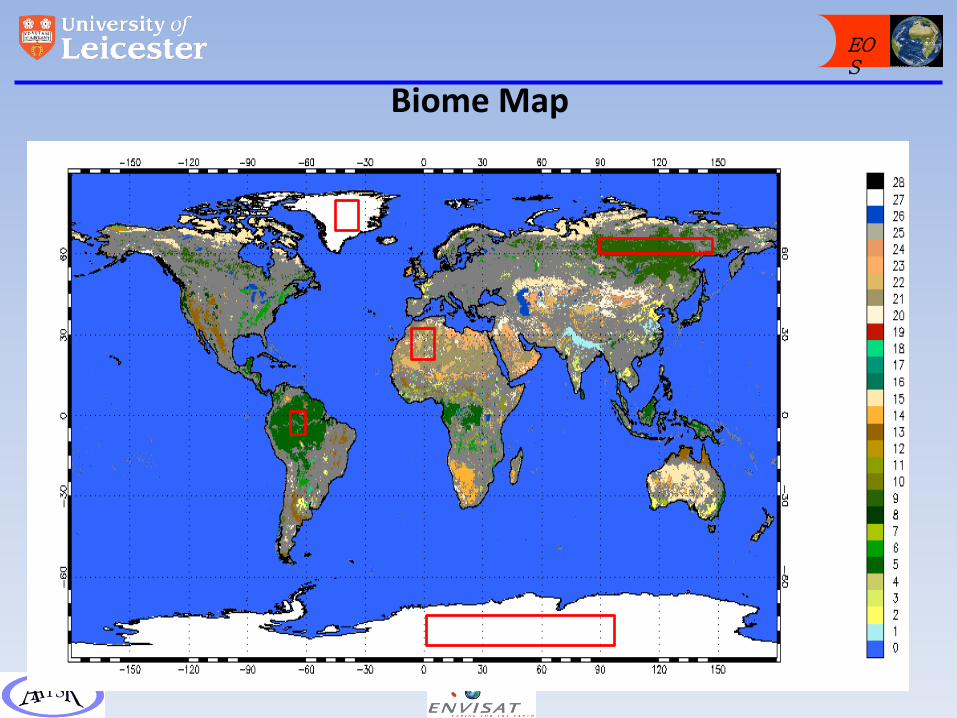
Biome Map
EOS
Algeria / Night /1% angle difference/30 min time difference 12 µm
EOS
Greenland / Night/1% angle difference/20 min time difference 12 µm
EOS
Back to Time Series (complete 2008-2010 + 1st 3 months 2011)
EOS
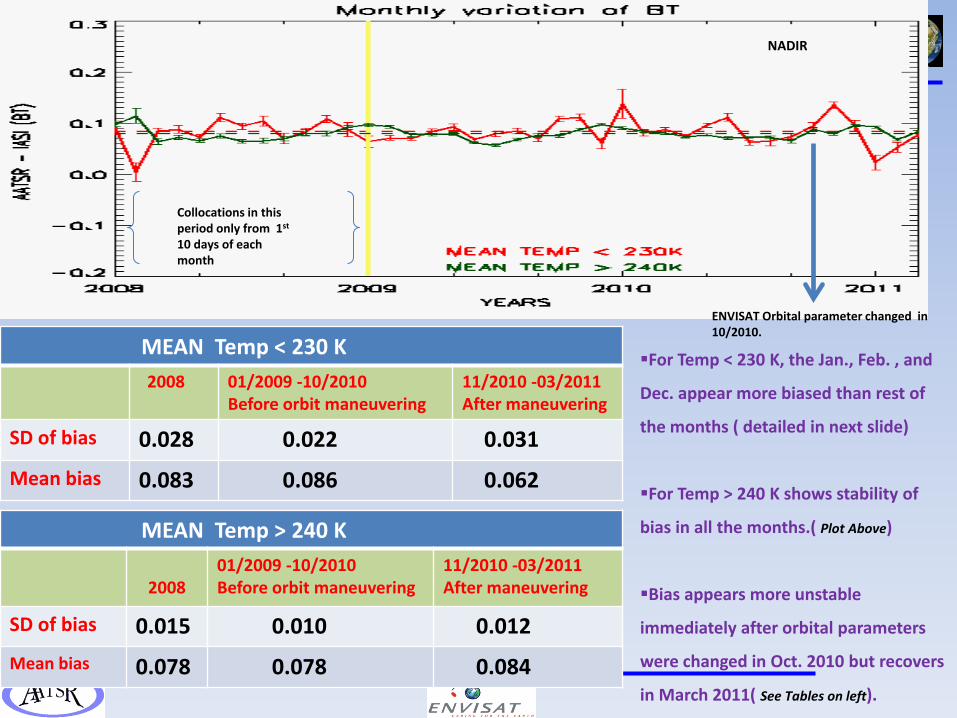
For Temp < 230 K, the Jan., Feb. , and
Dec. appear more biased than rest of
the months ( detailed in next slide)
For Temp > 240 K shows stability of
bias in all the months.( Plot Above)
Bias appears more unstable
immediately after orbital parameters
were changed in Oct. 2010 but recovers
in March 2011( See Tables on left).
MEAN Temp < 230 K 2008
01/2009 -10/2010 Before orbit maneuvering
11/2010 -03/2011 After maneuvering
SD of bias 0.028 0.022 0.031
Mean bias 0.083 0.086 0.062
MEAN Temp > 240 K 2008
01/2009 -10/2010 Before orbit maneuvering
11/2010 -03/2011 After maneuvering
SD of bias 0.015 0.010 0.012 Mean bias 0.078 0.078 0.084
ENVISAT Orbital parameter changed in 10/2010.
Collocations in this period only from 1st 10 days of each month
NADIR
EOS
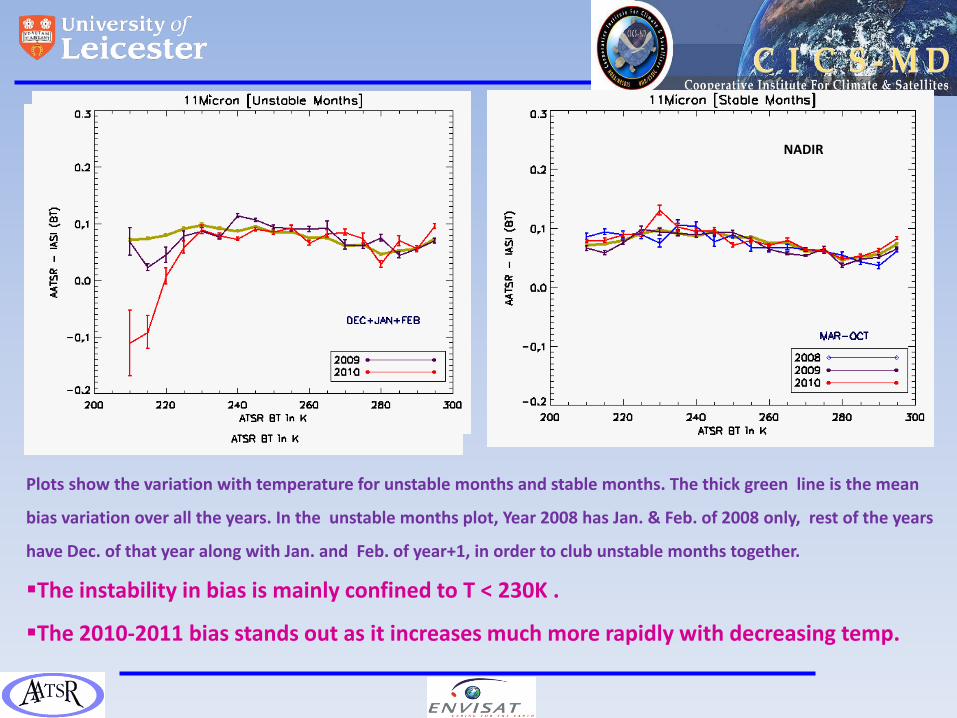
Plots show the variation with temperature for unstable months and stable months. The thick green line is the mean
bias variation over all the years. In the unstable months plot, Year 2008 has Jan. & Feb. of 2008 only, rest of the years
have Dec. of that year along with Jan. and Feb. of year+1, in order to club unstable months together.
The instability in bias is mainly confined to T < 230K .
The 2010-2011 bias stands out as it increases much more rapidly with decreasing temp.
NADIR NADIR
EOS
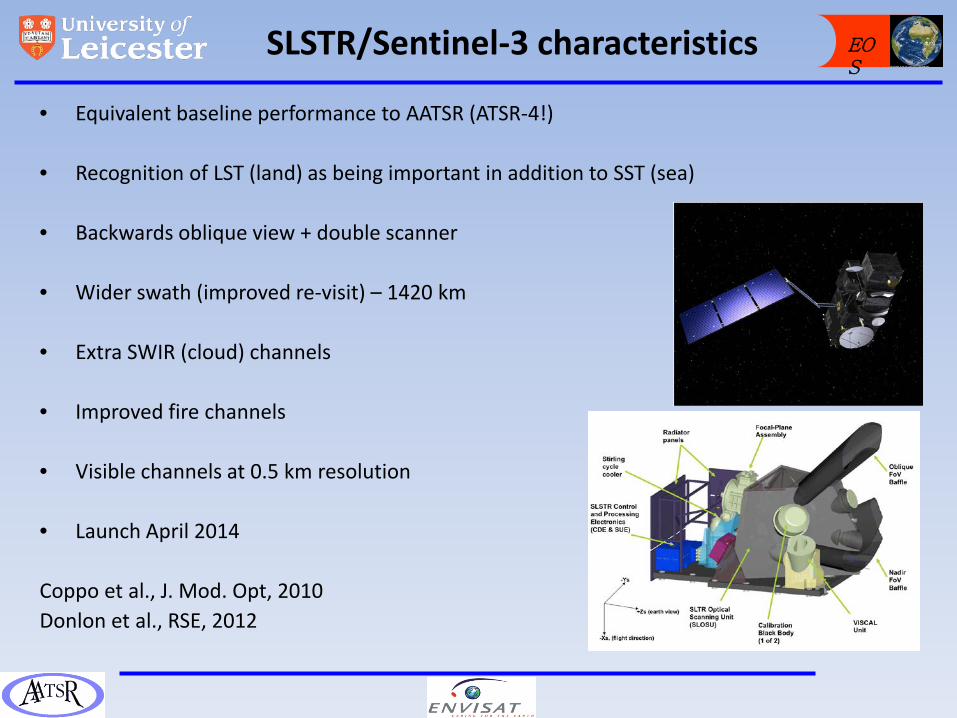
SLSTR/Sentinel-3 characteristics
• Equivalent baseline performance to AATSR (ATSR-4!)
• Recognition of LST (land) as being important in addition to SST (sea)
• Backwards oblique view + double scanner
• Wider swath (improved re-visit) – 1420 km
• Extra SWIR (cloud) channels
• Improved fire channels
• Visible channels at 0.5 km resolution
• Launch April 2014 Coppo et al., J. Mod. Opt, 2010 Donlon et al., RSE, 2012
EOS
Summary
• IASI and the ATSR series are both great instruments for climate • Difference at 11 µm is less than 0.1 K (function of BT) • Difference at 12 µm is function of BT and is larger. Suspected to be
due to AATSR spectral filter change. • Land at night and Greenland promising for inter-calibration so far. • There will be challenges with the launch of the SLSTR instrument:
complexity; radiometric calibration; • IASIs on MetOp-A and MetOp-B will be vital. Need traceable
calibration from IASI-A. Ideal is direct inter-calibration of SLSTR with IASI-A. Necessary for bridging of data gap.