MASTER IN FINANCE
THIS REPORT WAS PREPARED EXCLUSIVELY FOR ACADEMIC PURPOSES BY FRANCISCA FERNANDES & PAULINA MICHEL, MASTER IN
FINANCE STUDENTS OF THE NOVA SCHOOL OF BUSINESS AND ECONOMICS. THE REPORT WAS SUPERVISED BY A NOVA SBE FACULTY MEMBER, ACTING IN A MERE ACADEMIC CAPACITY, WHO REVIEWED THE VALUATION METHODOLOGY AND THE FINANCIAL MODEL.
(PLEASE REFER TO THE DISCLOSURES AND DISCLAIMERS AT END OF THE DOCUMENT) Page 1/38
▪ Our price target FY21 is £49.82, and our rating is Hold, with
an overall upside of 6.22% compared to current price levels as of
December 31st, 2020.
▪ InterContinental Hotels Group has an asset-light business
model, focusing on improving their fee revenues and fee margins,
with lower capital needs, leading to business growth at the same
time as generating high returns on invested capital. With nine
openings in 2019, IHG remains the largest luxury hotel brand. The
strong historical growth is expected to continue, especially in
Greater China, with 39 hotels on the IHG luxury brands pipeline.
▪ In the past few years, IHG's revenue has been continuously
growing (between 5 to 7%) and, after recovering from the current
crisis, we expect this rate to remain at the same level.
▪ The key risks include weaker growth figures than estimated
if the distribution of the Covid-19 vaccine is slower than
projected with renewed lockdown measures, and the rapidly
growing of peer-to-peer accommodation, such as Airbnb.
▪ We have weighted the expected share price as per DCF
(£48.92) with 75% and the average share price calculated with
EV/EBITDA (£52.52) with 25% to reach our target price
Company description InterContinental Hotels Group PLC, founded in April 2003 and with headquarters in Denham, England, is a British multinational hospitality company. With a presence in more than 100 countries, IHG owns a portfolio of distinct brands divided into three different segments, such as Mainstream, Upscale and Luxury.
INTERCONTINENTAL HOTELS GROUP PLC COMPANY REPORT TOURISM JANUARY 4TH 2021 STUDENT: FRANCISCA FERNANDES | PAULINA MICHEL [email protected] | [email protected]
InterContinental Hotels Group – Time to check-in?
Performance sensitivity in times of a global pandemic
Recommendation: HOLD
Vs Previous Recommendation BUY
Price Target FY21: £49.82
Vs Previous Price Target £51.39
Price (as of 3-Jan-21) £46.90
Reuters: IHG, Bloomberg: IHG:US
52-week range (£) 21.61-52.68
Market Cap (£m) 8,567
Outstanding Shares (m) 182.66
Shareholder return 7.42
Source: Bloomberg
Source: Reuters
(Values in $ millions) 2019 2020E 2021F
Revenues 4,648 2,214 2,541
EBITDA 877 558 499
Net Profit 349 143 279
EPS 1.91 0.78 1.53
P/E 36.14 82.00 43.72
EV/Sales 7.30x 14.46x 12.39x
EV/EBITDA 17.34x 25,00x 26.84x
EV/EBIT 24.14x 76.24x 33.36x
ROIC 77.09% 32.36% 91.45%
Net Capex -129.00 318,80 -156.70
Source: Company Data; Analyst Estimations
40
60
80
100
12/31/19 6/30/20 12/31/20
S&P 500 IHG
INTERCONTINENTAL HOTELS GROUP PLC COMPANY REPORT
PAGE 2/38
Table of Contents COMPANY OVERVIEW ........................................................................... 3
SECTOR OVERVIEW ............................................................................... 5
ECONOMIC OVERVIEW .......................................................................... 7
IHG VS PEERS ......................................................................................... 9
RISK ANALYSIS .....................................................................................10
▪ Pandemic Lockdowns................................................................ 10 ▪ Covid-19 Vaccine Developments and Distribution ................ 12 ▪ Peer-to-Peer Accommodation .................................................. 13
VALUE DRIVERS ....................................................................................14
HOTEL DEVELOPMENT ........................................................................................ 14 ▪ Americas ...................................................................................... 15 ▪ EMEAA ........................................................................................ 15 ▪ Greater China ............................................................................. 16 ▪ Working Spaces ......................................................................... 17
VALUATION ASSUMPTIONS .................................................................18
REVENUE FORECAST .......................................................................................... 18 FINANCIAL PROJECTIONS ................................................................................... 21 BOOK VALUES OF DEBT AND EQUITY ................................................................. 22 COST OF CAPITAL ............................................................................................... 23 INTRINSIC VALUATION ......................................................................................... 25 SCENARIO ANALYSIS .......................................................................................... 27 REVPAR SENSITIVITY ........................................................................................ 28 RELATIVE VALUATION ......................................................................................... 29 ROIC COMPARISON OF BUSINESS AREAS .......................................................... 29
RECOMMENDATION ..............................................................................31
FINAL CONSIDERATIONS .....................................................................32
APPENDIX ..............................................................................................33
FINANCIAL STATEMENTS .................................................................................... 33 ▪ Income Statement ...................................................................... 33 ▪ Balance Sheet ............................................................................ 34 ▪ Statement of Cash Flows .......................................................... 35
DISCLOSURES AND DISCLAIMERS .....................................................36
REPORT RECOMMENDATIONS ............................................................................ 36
MASTER IN FINANCE
THIS REPORT WAS PREPARED EXCLUSIVELY FOR ACADEMIC PURPOSES BY FRANCISCA FERNANDES & PAULINA MICHEL, MASTER IN
FINANCE STUDENTS OF THE NOVA SCHOOL OF BUSINESS AND ECONOMICS. THE REPORT WAS SUPERVISED BY A NOVA SBE FACULTY MEMBER, ACTING IN A MERE ACADEMIC CAPACITY, WHO REVIEWED THE VALUATION METHODOLOGY AND THE FINANCIAL MODEL.
(PLEASE REFER TO THE DISCLOSURES AND DISCLAIMERS AT END OF THE DOCUMENT) Page 3/38
Company Overview
Company description
Founded in 2003, InterContinental Hotels Group PLC is by now one of the
world's leading hotel groups. The group's purpose is stated as "providing True
Hospitality"1 for all its guests. As of December 2nd 2020, the company had 5,977
open hotels comprising 889,582 available rooms in approximately 100 countries,
divided into three operating regions – Americas, Europe, Middle East, Asia and
Africa (EMEAA), and Greater China (see Figure 1 - Room distribution per region
as of December 2nd, 2020). The Americas region currently had the most
significant group revenue percentage in 2019, corresponding to approximately
half of the total revenue (see Figure 2 - Group Revenue across the different
regions in 2019).
IHG is investing in a diversified portfolio of brands divided into three different
segments – mainstream, upscale and luxury. With 15% of the existing global
market share by rooms, IHG is a global leader in the mainstream segment. Their
mainstream brands include the midscale and upper-midscale market segments.
With 4,876 open hotels and 1,838 pipeline hotels, this segment includes Holiday
Inn Express, Holiday Inn Hotels & Resorts, Holiday Inn Club Vacations, avid
Hotels, Staybridge Suites, Candlewood Suites and Atwell Suites with its first
hotels expected to open in 2021. Holiday Inn is the flagship brand of IHG, which
generates 36% of total revenues, with 1,256 rooms (21% of the total number of
rooms). It targets not only business travellers but also families and leisure
travellers. Being considered the fastest-growing segment, IHG offers a wide
variety of upscale brands. With a total of 583 open hotels and 254 pipeline hotels,
this segment includes Hotel Indigo, EVEN Hotels, HUALUXE Hotels and Resorts,
Crown Plaza Hotels & Resorts and voco hotels. Those brands are targeting
business travellers and demanding leisure travellers. HUALUXE is a brand
designed for the Chinese market and does not exist elsewhere yet. The relatively
new brand, voco, is modern, but the branding itself is considered neutral.
Therefore, other hotels can easily, and in a considerable short period (around
one year), be transformed into voco hotels. With a resilient heritage and know-
how in luxury, IHG owns four distinctive brands in this segment. Those include
Kimpton Hotels & Restaurants, InterContinental Hotels & Resorts, Six Senses
Hotels Resorts and Spas and Regent Hotels & Resorts (acquired in 2018), which
1 IHG. 2020. Our purpose and culture. Available at: https://www.ihgplc.com/en/about-us/our-purpose-and-culture
16%140k
25%222k
59%527k
Americas EMEAA Greater China
Total rooms:890K
Figure 1 - Room distribution per region as of December 2nd, 2020 Source: Company Data
50%
35%
6%
9%
Americas
EMEAA
Greater China
Central
Figure 2 - Group Revenue across the different regions in 2019 Source: Company Data
Total rooms:890K
Mainstream 68%
Luxury 10%
Upscale 16%
Figure 3 - Room distribution per segment Source: Company Data
INTERCONTINENTAL HOTELS GROUP PLC COMPANY REPORT
PAGE 4/38
has helped to build a broad luxury offer, with 302 open hotels in total and 128
pipeline hotels (see Figure 4 - IHG pipeline segmentation, 2019). With nine
openings in 2019, their strong historical growth is expected to continue,
especially in China (an estimated increase of 6% per year in the number of
hotels).
The company has more than 36,000 employees distributed among the different
locations. IHG operates hotels in three different ways – as a franchisor, a
manager and on an owned and leased basis – this varies depending on market
maturity, proprietor preference and, in some instances, the specific brand. For
the franchise model, IHG earns a fixed percentage of rooms revenue following a
guest staying at a hotel. This model is more common in mature markets such as
the Americas and Europe, where over 90% of hotels are franchised. While in
emerging markets, such as Greater China, the managed model is typically more
predominant, with 80% of IHG Hotels being managed by IHG, and the company
revenues are generated via a fixed percentage of the total hotel revenue and a
proportion of each hotel's profit. However, over time the company expects the
Chinese market to increase their share of the franchised hotels, which attract full
franchise fees (see Figure 5 - Hotel's segmentation in Greater China).
InterContinental Hotels Group has an asset-light business model, focusing on
improving their fee revenues and fee margins, with lower capital needs, leading
to business growth at the same time as generating high returns on invested
capital. IHG is not responsible for employing professionals in franchised hotels,
neither controlling their day-to-day functions, rules or procedures. Instead, the
company and its franchise hotels cooperate in providing a stable brand
experience, managing business responsibly. Due to their asset-light strategy, the
number of owned, leased and managed leased hotels has fallen significantly,
with almost 200 hotels sold since 2003. Those gains have been attributed to the
hotel owners and investors in the form of dividends. This model's significance
and efficacy are intensified when industry RevPAR2 growth slows, a
circumstance that appeared in 2019 (see Figure 6 - IHG global RevPAR growth).
This trend was strengthened by macro and geopolitical factors, such as the Hong
Kong protests, and supply surpassing demand in some markets.
The improvement in innovation and technology to attract more hotel owners to its
brands and retain its guests led to a $5.6bn revenue in digital (web and mobile) in
2019. This result increased by 7% compared to the year before (see Figure 7 -
IHG Digital Revenue). The company has recently developed a guest reservation
system in partnership with Amadeus, allowing guests to customise their stay's
2 Revenue per available room, a product of occupancy rate and the average daily rate
0
200
400
600
800
1000
1200
1400
1600
1800
2000
Mainstream Upscale Luxury
Figure 4 - IHG pipeline segmentation, 2019 Source: Company Data
3%
9%
20%
97%
91%
80%
2017
2018
2019
Managed Franchise
Figure 5 - Hotel's segmentation in Greater China Source: Company Data
-0.3%
2.5%
2.7%
1.8%
4.4%2015
2016
2017
2018
2019
Figure 6 - IHG global RevPAR growth Source: Company Data
INTERCONTINENTAL HOTELS GROUP PLC COMPANY REPORT
PAGE 5/38
specific attributes. At the same time, hotel owners will create more value by
finding ways to optimise pricing for desirable items. IHG also manages a system
fund to drive revenue for the hotels, which resulted in 30% of total operating
revenues in 2019. Total evaluations and contributions given to the fund by hotels
are planned to be spent on marketing, IT or the IHG Rewards Club loyalty
programme and the guest reservation system. The system fund is designed to
operate at break-even and does not result in a profit or loss for IHG. The hotel
chain focuses on preserving an efficient balance sheet with an investment-grade
credit rating by having a solid long-term approach to allocating capital and
reducing the business's asset intensity.
The group's revenues grew 12% in HY1 2019 and -52% in HY1 2020, being
massively impacted by the Covid-19 pandemic. IHG revenue is highly dependent
on the fee business, accounting for 30% of total revenue for the first half of 2020
and approximately 32% of HY1 2019. Strategies to flatten the cases of corona
infections curve have resulted in a temporary closure of many hospitality
businesses, which was the case for many IHG hotels, directly impacting its
performance in 2020. In 2020 the virus caused the occupancy rates and RevPAR
to drop by roughly 50% for the fee business and 70% for the owned business.
This difference is explained by the dependency of the owned business on the
luxury segment3 and the fact that they were forced to decrease their average
daily rate (ADR) by -16%, in the first half of 2020, trying to attract more guests.
Sector Overview
Sector Analysis Before Covid-19 outbreak
Before the global economic backdrop, which has led to a decrease in RevPAR
growth, the industry saw an increasing room supply illustrating the sector's
positive fundamentals overall. This upwards trend was driven by rising
disposable incomes and increasing demand for branded hotels (see Figure 9 -
Global rooms supply (m rooms)). The hotel industry summed $535bn in 2019,
having nearly half of rooms associated with a global or regional chain. The United
States remains the most extensive hotel market, with 35% of hotel rooms in
2019. However, there is a noticeable growth from Greater China, claiming 14%,
having improved +5.3% compound annual growth rate (CAGR) in rooms supply
over the past eight years. For the last ten years until 2019, this sector saw
RevPAR constantly growing even though the hotel industry is currently facing a
slower RevPAR landscape. This is mainly caused by the global economy's
slowdown, with 2019 growth corresponding to +1%, slower than what was
3 Approximately 30% of the owned business revenues come from luxury brands.
$4.6 bn
$5.3 bn+13%
$5.6 bn+7%
2017 2018 2019
Figure 7 - IHG Digital Revenue Source: Company Data
30%
9%
31%
30%
Revenue from Fee Business
Revenue from owned Business
System Fund revenues
Reimbursement of costs
Figure 8 - Revenue split for HY1 2020 Source: Company Data
18.7
18.3
17.9
17.5
17.22015
2016
2017
2018
2019
+1.7%
+2.2%
Figure 9 - Global rooms supply (m rooms) Source: Company Data
INTERCONTINENTAL HOTELS GROUP PLC COMPANY REPORT
PAGE 6/38
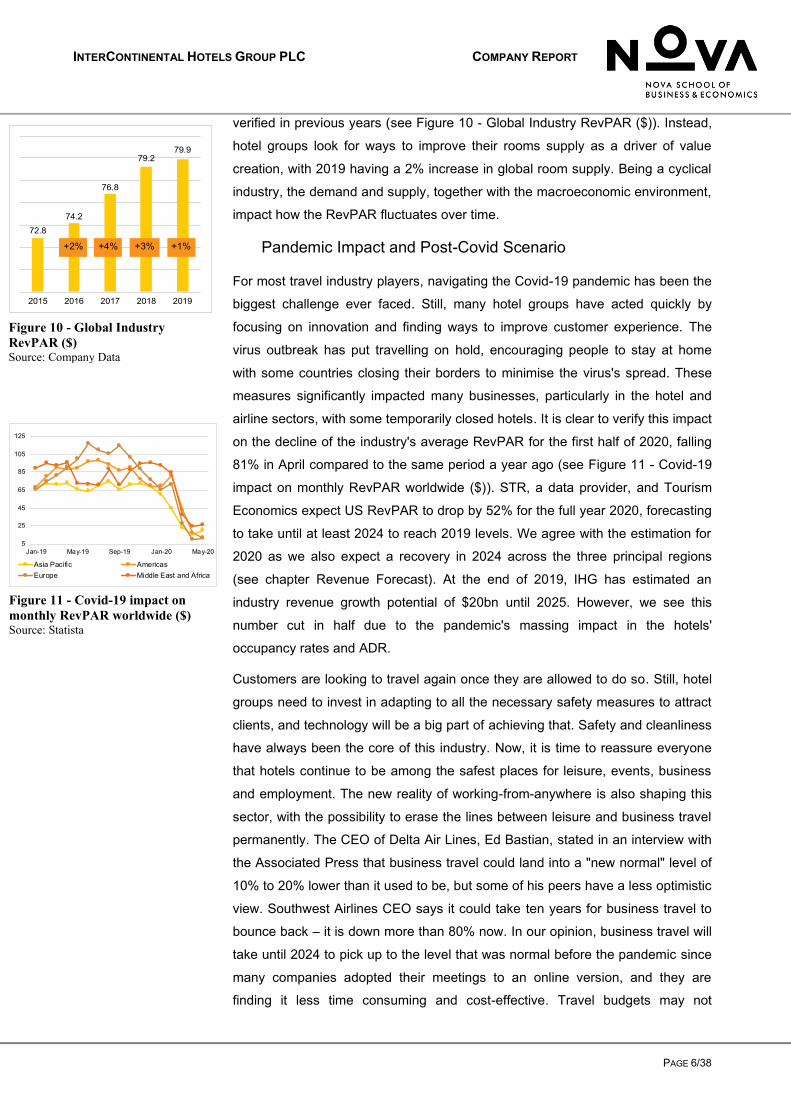
verified in previous years (see Figure 10 - Global Industry RevPAR ($)). Instead,
hotel groups look for ways to improve their rooms supply as a driver of value
creation, with 2019 having a 2% increase in global room supply. Being a cyclical
industry, the demand and supply, together with the macroeconomic environment,
impact how the RevPAR fluctuates over time.
Pandemic Impact and Post-Covid Scenario
For most travel industry players, navigating the Covid-19 pandemic has been the
biggest challenge ever faced. Still, many hotel groups have acted quickly by
focusing on innovation and finding ways to improve customer experience. The
virus outbreak has put travelling on hold, encouraging people to stay at home
with some countries closing their borders to minimise the virus's spread. These
measures significantly impacted many businesses, particularly in the hotel and
airline sectors, with some temporarily closed hotels. It is clear to verify this impact
on the decline of the industry's average RevPAR for the first half of 2020, falling
81% in April compared to the same period a year ago (see Figure 11 - Covid-19
impact on monthly RevPAR worldwide ($)). STR, a data provider, and Tourism
Economics expect US RevPAR to drop by 52% for the full year 2020, forecasting
to take until at least 2024 to reach 2019 levels. We agree with the estimation for
2020 as we also expect a recovery in 2024 across the three principal regions
(see chapter Revenue Forecast). At the end of 2019, IHG has estimated an
industry revenue growth potential of $20bn until 2025. However, we see this
number cut in half due to the pandemic's massing impact in the hotels'
occupancy rates and ADR.
Customers are looking to travel again once they are allowed to do so. Still, hotel
groups need to invest in adapting to all the necessary safety measures to attract
clients, and technology will be a big part of achieving that. Safety and cleanliness
have always been the core of this industry. Now, it is time to reassure everyone
that hotels continue to be among the safest places for leisure, events, business
and employment. The new reality of working-from-anywhere is also shaping this
sector, with the possibility to erase the lines between leisure and business travel
permanently. The CEO of Delta Air Lines, Ed Bastian, stated in an interview with
the Associated Press that business travel could land into a "new normal" level of
10% to 20% lower than it used to be, but some of his peers have a less optimistic
view. Southwest Airlines CEO says it could take ten years for business travel to
bounce back – it is down more than 80% now. In our opinion, business travel will
take until 2024 to pick up to the level that was normal before the pandemic since
many companies adopted their meetings to an online version, and they are
finding it less time consuming and cost-effective. Travel budgets may not
5
25
45
65
85
105
125
Jan-19 May-19 Sep-19 Jan-20 May-20
Asia Pacific AmericasEurope Middle East and Africa
Figure 11 - Covid-19 impact on monthly RevPAR worldwide ($) Source: Statista
72.8
74.2
76.8
79.279.9
2015 2016 2017 2018 2019
+2% +4% +3% +1%
Figure 10 - Global Industry RevPAR ($) Source: Company Data
INTERCONTINENTAL HOTELS GROUP PLC COMPANY REPORT
PAGE 7/38
rebound even after the worst of the pandemic has passed, and business trips
might take longer to go back to pre-crisis levels due to the "new normal". This is
raising concerns among hoteliers, airline executives and conference organisers.
The threat of remote working is leading to an opportunity for hotels to reinvent
their business. Many hotel chains such as Hilton, Accor and InterContinental
have started marketing their rooms as temporary workspaces for those who do
not have ideal work-from-home conditions. The rate at which a hotel charges for
a room transformed into an individual office is generally lower than the average
daily rate (see chapter Working Spaces). These lower rates may be filling empty
rooms, but we do not think they will deliver the profit margins business guests
once offered.
In the post-Covid world, we see companies looking for growth through
acquisitions, organic expansion and diversification and increasing competition
among branded players. The impact of sustainability, technology and luxury
continues to shape how the industry operates, using digital channels leading to a
wider competitive environment. Several hotel companies have shifted from
owning real estate to managing hotels – roughly 70% of branded hotels were
franchised operations in 2010, increasing to approximately 80% in 2019. We see
the "asset-light" approach continued to be adopted within the industry during the
next years. Hotel companies with more exposure to real estate are subject to
more risks while navigating this crisis because they have large outstanding
mortgages and are accountable for more people supporting everyday operations
at their properties. For this reason, we expect IHG to keep decreasing their
number of owned hotels, reaching a 0.24% weight in ten years.
Economic Overview InterContinental Hotels Group has a market presence across the world. One the
one hand, this diversification minimises regional risks. On the other hand, IHG
significantly depends on economic and financial market fluctuations such as
recessions, inflation, credit availability, and currency changes that can decrease
revenues and income. Therefore, it is relevant for our analysis to consider and
understand both global and regional economic drivers.
2020 has been marked by a global economic crisis with a virus hitting an already-
fragile global economy due to the seen slowdown in GDP in 2019. Hence, it is
crucial to evaluate the factors that demonstrate when we can expect a partial
recovery from the health crisis and see the last scars of the Covid-19 pandemic.
It is crucial to look at the GDP growth to have a better perspective on the impact
of this recession. Leisure and business travel is one of the sectors that is quickly
0%
10%
20%
30%
40%
50%
60%
70%
80%
90%
100%
Occupancy Rate EBIT Margin ROIC
2019 2024E 2029E
Figure 12 - IHG KPIs pre-Covid versus post-Covid Source: Analysts
1%
2%
3%
4%
5%
6%
2013 2014 2015 2016 2017 2018 2019
Global T&T GDP growth (%)
Global economy GDP growth (%)
Figure 13 - World's travel & tourism GDP growth versus economy GDP growth, 2013-19 Source: World Travel & Tourism Council
INTERCONTINENTAL HOTELS GROUP PLC COMPANY REPORT
PAGE 8/38
impacted by a crisis's consequences as people cut their expenses on non-
essential needs such as travelling (see Figure 13 - World's travel & tourism GDP
growth versus economy GDP growth, 2013-19). The World Bank Group projects
growth to decelerate sharply. In June 2020, it forecasted the advanced-economy
output to be drastically below levels seen in 2019 and projected in January, from
a 1.6% growth in 2019 to a contraction of -7% in 2020 – 8.4 percentage points
below to the predicted rate at the beginning of 2020 (see Figure 14 - Global
growth according to World Bank estimates). We agree with this figure due to the
significant disruption of domestic demand and supply. Some Euro-area members
are heavily dependent on tourism, which was severally affected by travel
restrictions and consumers. Portugal and Spain are amongst the most
dependent, with the share of tourism in GDP equalling 17% and 14%
respectively. This recession has also been marked by a high level of uncertainty
concerning global growth forecasts compared to years before (see Figure 16 -
Global uncertainty). In China, the first region being massively affected by the
coronavirus, these figures look equally dramatic leading to the lowest growth rate
in more than four decades, with a decrease from 6.11% in 2019 to 1.85% in
2020, but still being the only major economy to grow in terms of GDP in 2020.
We see the GDP growth in 2020 for China to be slightly above this prediction,
around 2%, since the development is finally seen in consumption after a state-
backed industrial recovery with retail sales rising 3.3% YoY in the third quarter,
above what has been predicted. In 2021, we expect growth to be above 2019
levels, around 8%, as economic activity widens to private investment and
consumption.
Another significant factor that influences price variables and consequently, the
valuation is the inflation rate. In a "normal year" the ADR grows purely from
inflation. The general rise in the price level in advanced economies remains
below pre-pandemic levels. With the business reopening their doors and
consumers start increasing spending on purchases that they were required to
delay because of lockdowns, price pressures could increase. The results from
monetary policy frameworks can also affect price developments, with inflation
expectations increasing very quickly when governments start running large fiscal
deficits. The central bank's tool kit has been attempting to minimise the
consequences of this health crisis in the economy, from big amounts of asset
purchases and lending facilities to assisting a large spectrum of borrowers
supporting credit provisions. The Federal Reserve stated4 adjustments in its
monetary policy strategy, moving to a flexible average inflation target of 2% over
time. Similarly, the European Central Bank (ECB) aims for a level below, but
4 FOMC Statement, September 16, 2020 – Federal Reserve press release
-7%
-3%
1%
5%
9%
2010
2011
2012
2013
2014
2015
2016
2017
2018
2019
E202
0E2
021
World Advanced economies EMDEs
Figure 14 - Global growth according to World Bank estimates Source: World Bank
0
100
200
300
400
500
1960 1975 1990 2005 2020
Index, long-term average = 100Index, long-term average = 100
Figure 16 - Global uncertainty Source: Ahir, Bloom, and Furceri (2018)
17%
14%13%
10%9% 9%
Port
ugal
Spa
in
Italy
Euro
Are
a
Ger
man
y
Fra
nce
Figure 15 - Europe share of tourism in GDP, 2019 Source: World Bank, World Travel and Tourism Council.
INTERCONTINENTAL HOTELS GROUP PLC COMPANY REPORT
PAGE 9/38
close to 2%. According to the ECB, an inflation rate of approximately 1.6%5 is low
enough for the economy to fully secure price stability benefits. China's relatively
muted inflation in the region has further facilitated policy efforts, with an inflation
target of around 1.9%6.
IHG vs Peers The main peers of IHG are Marriott, Hilton, Hyatt and Accor, since those four are
the most comparable to IHG in terms of core business (model), hotel segment,
size and portfolio.
IHG Hilton Hyatt Marriott Accor in €bn# Hotels (2019) 5903 6110 952 7349 5036Revenue 2019 in $bn 4.6 9.5 5.0 21.0 1.4EBIT (2019) in $bn 0.63 1.7 1.0 1.8 -0.1EBIT Margin 13.7% 17.9% 20.0% 8.6% -3.9%# Hotels Owned 26 65 31 73 201# Hotels Fee Business 5877 6045 921 7276 4835Fee business % 99.6% 98.9% 96.7% 99.0% 96.0%Geographic focus Americas (72.96%
of existing hotels) US (79.34% ofexisting hotels)
US (79.34% ofexisting hotels)
US (73.42% ofexisting hotels)
Europe (60.14% ofexisting hotels)
Table 1 - Peers Overview Source: Analysts
The five hotel companies in scope all have in common that they focus on an
asset-light approach that expands with relatively low capital expenditure costs
since those are born by the franchisors. Nevertheless, IHG is compared to its
peers the company with the lowest level of core assets. IHG's operating assets
amount to 3,346, whereas the peer ranges between 5,761 (Hyatt) and 24,124
(Marriott) in 2019. In the case of IHG, due to the small difference between assets
and liabilities, the core invested capital is relatively low compared to the core
result and causes a high return on invested capital (ROIC). Although all hotels in
scope have an asset-light business, the other peers have a significantly lower
ROIC during the period in scope. In 2019, IHG's ROIC amounted to 77.09%
whereas Hilton displayed with 12.14% the next highest one (see Table 2 - ROIC
IHG vs Peers). Even though the competitors have comparatively low property,
plant and equipment (PPE) levels, their intangibles, especially in the case of
Marriott and Hilton are multiple times higher than the one of IHG. Hilton's
operating assets are driven by goodwill and brands. In October 2007 the hotel
giant became an owned subsidiary of Blackstone. Marriott increased its
intangible assets from $2,394m to $16,868m by conducting the most extensive
merger in the hotel industry with Starwood Hotels in 2016.
Thus, instead of conducting an ROIC analysis based on core invested capital, we
considered comparing net operating profit less adjusted taxes (NOPLAT) to core
5 Monetary Policy – European Central Bank 6 China Inflation Rate – Trading Economics
2017A 2018A 2019AROIC
IHG 285.56% 64.43% 77.09%Hilton 13.81% 10.40% 12.14%Accor -28.68% 116.76% 6.33%Hyatt -0.07% 4.88% 0.71%Marriott 6.85% 11.85% 9.34%
Table 2 - ROIC IHG vs Peers Source: Analysts
2017A 2018A 2019AROIC (without Goodwill and Brands)
IHG -96.92% -145.48% -138.35%Hilton -460.08% -284.63% -148.10%Accor n/m 742.86% 12.01%Hyatt -0.08% 5.86% 0.92%Marriott -100.82% -107.41% -68.58%
Table 3 - ROIC (excl. goodwill and brands) IHG vs Peers Source: Analysts
INTERCONTINENTAL HOTELS GROUP PLC COMPANY REPORT
PAGE 10/38
invested capital excluding goodwill and brands (see Table 3 - ROIC (excl.
goodwill and brands) IHG vs Peers). For Accor and Hyatt, ROIC increases since
invested capital remains positive. However, for the other three companies
invested capital becomes negative since liabilities exceed assets, leading to a
negative ROIC. The ROIC is very sensitive to minor changes in invested capital
and thus, very volatile7. Hence, also the ROIC excluding goodwill and brands is
not an appropriate measure to compare the peers.
However, the five hotel companies can be analysed in terms of return on assets
(RoA) when excluding intangible assets to make them more comparable (see
Table 4 - RoA IHG vs Peers). Marriott uses its assets the most efficient with an
RoA of 17.70% before Hilton (16.83%) and IHG (13.42%). Accor and Hyatt
exhibit the lowest KPI, which can be explained on the one hand that those
companies are being among those five the asset "heaviest". On the other hand,
Accor's total comprehensive income shrank by -72.81% in 2019 (Hyatt -7.91%).
However, Accor's revenue has only been that high in 2018 due to selling a
majority stake (64.8%) of AccorInvest, resulting in a profit from discontinued
operations of €2.4bn.
IHG has been gaining market share over the past few years even if remaining
lower than its main peers, except Accor. Regarding future projections, we used
our forecasts for IHG's revenue with Bloomberg's estimates for the peers' results.
We concluded that overall they would all lose market share in 2020 due to the
consequences of the Covid crisis. In our view, the reason is that all these groups
have a more prominent exposure to business travel, which is currently down
more than 80% and will take longer than leisure travel to return to 2019 levels. In
contrast, smaller hotels have higher exposure to leisure travelling, which is
expected to improve faster. With a rebound in travel, we see a recovery in market
share growth in 2021 except for IHG and Marriott, that recover one year later.
These two groups are expected to have lost less market share from the
pandemic, -10.13% and -4.23% respectively, comparing to the other three peers
(Hilton -11.67%, Hyatt -22.64% and Accor -16.10%).
Risk Analysis
▪ Pandemic Lockdowns
The uncertainty surrounding when we will be able to control the spread of Covid-
19 is remarkably high. The projections for recovery depend mainly on public
health and economic factors that are naturally hard to predict. It is crucial to
7 “Comparing performance when invested capital is low” by Mikel Dodd and Werner Rehm, 2005, McKinsey
in $m 2017A 2018A 2019ARoA
IHG 11.98% 9.38% 8.78%Hilton 8.99% 5.09% 5.54%Accor 0.26% 17.66% 4.48%Hyatt 6.27% 10.75% 8.99%Marriott 8.10% 6.48% 5.20%
Table 4 - RoA IHG vs Peers Source: Analysts
0.5%
1.5%
2.5%
3.5%
4.5%
5.5%
2018 2020E 2022E 2024E
IHG Hilton Mariott Hyatt Accor
Figure 17 - Market share forecast for IHG and Peers Source: Analysts
INTERCONTINENTAL HOTELS GROUP PLC COMPANY REPORT
PAGE 11/38
analyse the pandemic's path, the required public health response, and the
consequent domestic activity disruptions, mostly predominant in contact-intensive
sectors.
The global health crisis led to a 'Tourism shock', leading to a sharp drop of
approximately 70% in international tourism during the first eight months of 2020,
according to the World Tourism Organization (UNWTO). In the first quarter of
2020, according to the World Bank, tourist arrivals declined by nearly 100% (see
Figure 18), and the number of commercial flights fell about 70% worldwide since
the beginning of the year. These figures reflect the impact of the virus on the
hotel's occupancy rate. In May 2020, the hotel occupancy rate in Europe was the
highest affected, reaching an average of 13.3%, dropping 61.6 percentage points
compared to the same time last year (see Figure 19 - Monthly hotel occupancy
rates worldwide, 2018-20, by region).
We see other lockdowns happening in the first months of 2021, and
consequently, all the consumption depending on any social interaction will be
suspended once again. External tourism will therefore struggle due to the
temporary border restrictions. Looking ahead, the threat from pandemic
lockdowns on the hotel industry is not only reflected by the impact it caused on
the results for 2020 but also on changes in consumption and work patterns that
will cut aggregate demand. Despite the development and distribution of a
vaccine, we should expect some social-distancing habits to persist during the
next year. For this reason, we see the occupancy rate8 of IHG only achieving pre-
Covid levels (approximately 70%) between 2024 and 2025, even though the ADR
is expected to recover in 2023.
The tourism activity recovery is highly dependent on the confidence level from
tourists, with travellers remaining risk-averse, and on the economic rebound, as
there is less disposable income due to several job losses9. To enable the sector
to bounce back in the aftermath of Covid-19 hotel groups should launch global
protocols to rebuild confidence amongst consumers to travel safely once all the
restrictions are lifted.
The recession caused by Covid-19 will bring massive challenges for cyclical
business such as the hotel sector. With higher uncertainty, layoffs, less income,
increased cost of debt service, unemployment increase, the suspension of many
businesses, the fear of infection, all lead to a reduction of the spend on goods
and services, tending to boost saving rates. As a result, liquidity and solvency
8 The occupancy rate is computed based on a weighted average calculated through the different hotels across the three analysed regions. 9 The US unemployment rate equalled 6.90% in October 2020 versus 3.6% in the year before.
5%
25%
45%
65%
85%
May-18 Nov-18 May-19 Nov-19 May-20
Asia Pacific AmericasEurope Middle East and Africa
Figure 19 - Monthly hotel occupancy rates worldwide, 2018-20, by region Source: Statista
-100
-75
-50
-25
0
25
50
Jan-
18
Apr-1
8
Jul-1
8
Oct
-18
Jan-
19
Apr-1
9
Jul-1
9
Oct
-19
Jan-
20
Apr-2
0EMDEs Advanced economies
Deviation from 5-year average
Figure 18 – Monthly tourist arrivals as a share of average since 2015 Source: Haver Analytics; World Bank
INTERCONTINENTAL HOTELS GROUP PLC COMPANY REPORT
PAGE 12/38
risks rise, putting both jobs and debt at risk. The fact that we are considering a
recovery in the economic cycle in the short term (mid-2021) does not mean being
back to pre-crisis levels soon, in our view that will take more time (between
2023/24).
▪ Covid-19 Vaccine Developments and Distribution
The vaccine is both the cure to stop the spread of Covid-19 and to rebound
tourism activity. Together with lifting restrictions, progress with vaccines and
treatments allows activity to return to pre-pandemic levels progressively. The
stocks that were hurt the most during the downcycle were also the ones to enjoy
substantial gains in the rally of the aftermath of the vaccine news (IHG up 27%
and Expedia Group up 41% since end-October). Drug makers Pfizer and
BioNTech announced that their coronavirus vaccine is 95% effective and they
have already started distributing their vaccine to the UK, EU, US and Japan.
Separately, BioNTech will supply 100m doses in China via its partnership with
Fosun Pharma. Besides, Moderna Inc. and the University of Oxford with
AstraZeneca Plc are also distributing their vaccines. According to the World
Health Organization, there are now more than 300 vaccine candidates, using a
combination of different techniques to generate antibodies and virus-fighting cells
to fend off infection. Figure 20 includes some of the production plans for 2021
and respective efficacy – most of the candidates have not yet confirmed the
developed vaccines' effectiveness. The focus is now shifting towards how fast
and successfully vaccines can be distributed.
The University of Oxford surveyed about an approved COVID-19 vaccine for the
NHS. The results indicated that 72%, out of the 5,114 UK adults representative
group, are willing to be vaccinated. A new Marist College poll10 concluded that
63% of the 1,065 respondents say they want to get the vaccine. The share of
Americans wanting to take the vaccine went from 50% in late September to 63%
in late November, indicating more substantial trust in the vaccine developments.
In case the safety, efficacy and durability of the distributed vaccines are worse
than expected, and with new mutations of the virus, the economic rebound could
be slower than forecasted, with renewed social distancing and tighter lockdowns
caused by virus resurges. There is also a challenge faced by logistics and
storage to the service-delivery model that contributes to a delay in the
distribution. In addition to this, two doses are needed per person, delaying the
process of global immunisation against the virus. We believe more than 70% of
people in developed markets will be vaccinated against Covid-19 by the end of
10 Marist Poll sponsored in partnership with NPR and PBS NewsHour conducted from December 1st until December 6th, 2020.
1.3bn
500m-1bn
3bn
1bn
1bn-2bn
80m
300m
1.2bn
300m
BioNTech/Pfizer
Moderna
AstraZeneca/Oxford university
Johnson & Johnson
Novavax
Medicago/GSK
CureVac
Gamaleya
CanSino
70%
94.10%
95%
95%
Figure 20 – Candidates’ vaccine production plan for 2021 and respective efficacy Source: Financial Times
4 686
3 130
1 900
951
501
350
USA
India
China
UK
Germany
South Korea
Figure 21 - Estimated production capabilities of Covid-19 vaccine candidates per country for 2020-2021 (in m) Source: Airfinity Ltd, 2020
INTERCONTINENTAL HOTELS GROUP PLC COMPANY REPORT
PAGE 13/38
2021. Goldman Sachs Economists Daan Struyven and Sid Bhushan, expects the
UK to vaccinate half of its population in March. Additionally, they forecasted that
the European Union, Japan and Australia would reach this immunisation level in
May.
▪ Peer-to-Peer Accommodation
InterContinental Hotels Group is a considerably large company, but new players
have entered the competition as well. Peer-to-peer accommodation is
characterised by a person renting an apartment or a room they own to another
person. This is usually done through digital platforms such as Airbnb.
Airbnb became public on December 10th, 2020, and the stock rallied 113% on
the first day, closing with a market cap above $85bn (currently $89.617bn versus
IHG $11.205bn), equivalent to Booking Holdings market cap. Airbnb's shares
began trading at $146, versus its IPO price of $68 a share (currently trading
around $150).
The listing inventory of Airbnb has rapidly grown surpassing that of the biggest
hotel chains, without owning any real estate. Airbnb global internet platform
complements a revolutionary difference to travel and approach one of the oldest
hospitality methods. These new methods are offering experiences to those
travellers that appreciate a home-like stay.
Some studies11 indicate that Airbnb supply increases have affected the ADR
growth of hotels negatively. Airbnb has grown to more than 7 million listings by
creating a user-friendly technology platform, from 2.9 million hosts, in 220
countries within twelve years. According to company data, approximately 2
million people stayed in an Airbnb every night in 2019. From 2015 until 2019,
Airbnb bookings more than quadrupled (see Figure 22). The largest hotel
companies have required between 30 to 240 years accomplish similar statistics12.
The rental marketplace company focuses on customising the guest experience,
generating a great value proposition for traveller and host.
Equivalent to what happens in hotels, customer reviews play a significant role in
the company's success. However, with Airbnb, this method is done differently
since hosts and guests review each other. As many costumers do not want to
give a poor review encouraging reciprocal retaliation reviews, this can explain the
reason why Airbnb's quality score of (4.5) is on average higher than hotels'
average (3.8) on Travel Advisor.
11 “Quantifying Airbnb's disruptive impact on ten key hotel markets” by Tarik Dogru, PhD, CHE and Makarand Mody, PhD and Courtney Suess, PhD. 12 STR, 2017. Airbnb & Hotel Performance - An Analysis Of Proprietary Data In 13 Global Markets.
72.4
125.7
185.8
250.3
326.9
2015 2016 2017 2018 2019
# Bookings Gross Booking Value
$8b $21b $38b
Figure 22 - Number of nights and experiences booked on Airbnb since 2015 Source: Airbnb; Statista
INTERCONTINENTAL HOTELS GROUP PLC COMPANY REPORT
PAGE 14/38
In 2017 Airbnb bought Luxury Retreats, becoming a stronger competitor to IHG
and some other industry peers. This move originated the Airbnb Luxe brand,
which enables Airbnb to lead the luxury home rental space. The threat of new
entrants in the hotel industry is low due to the high cost of capital, short access to
land, high construction cost and difficulty securing entitlements. Nonetheless, the
threat of shared economy substituents like Airbnb is high, and there is a
possibility that companies like Google or Amazon create similar platforms.
During the meeting with Matthew Woollard, he clarified that IHG does not yet see
Airbnb as a direct competitor since the client base is different. However, tourists
that book an Airbnb will occupy a seat on a plane that could have more IHG
"targeted clients", reducing the demand for InterContinental Hotels and other
industry peers. Moreover, to compete with this home-like stay, some IHG brands,
such as Kimpton Hotels & Restaurants, have initiated a more relaxed service with
fewer formalities to provide an experience similar to what Airbnb offers. Other
hotels have a more personalised offer; for example, the client can choose
whether they prefer a hard or a soft pillow. Such extra services would not be
possible for a business model like Airbnb and IHG has the opportunity to deliver
additional value in those areas.
Value Drivers
IHG's key value drivers are RevPAR, the number of rooms, the managed and
franchised hotels, and the management fee (fee business only). The revenues
until 2029 were forecasted by: Revenue per region = RevPAR * (number of
rooms * 365) * management fee (if applicable) (afterwards nominal growth).
Hotel Development
With 26 leased and owned hotels and 5,877 managed and franchised ones in
2019, IHG is one of the biggest hotel companies worldwide. Moreover, IHG plans
to open 1,918 new hotels within the next years (pipeline as of 2019).
One of the main drivers for any hotel is the number of rooms available since the
total revenue increases with the RevPAR and the rooms. For this reason, we
have been in contact with Matthew Woollard (IHG Investor Relations Vice
President) to clarify how long it usually takes the company to open a hotel from
the moment it is added to the pipeline. Moreover, he explained the realised
percentage of hotels in the pipeline and how long a hotel is open on average.
Due to different ranges, we have assumed in a best-case scenario that 45% of
the hotels in the pipeline will be operating, that it takes 2.5 years until the hotel is
opened and that it will remain operated for 25 years on average. In the base
Figure 23 - Number of hotels per region Source: Analysts
INTERCONTINENTAL HOTELS GROUP PLC COMPANY REPORT
PAGE 15/38
case, 40% of the hotels in the pipeline are completed, a hotel opens after 3.5
years and operates for 20 years. In the following, we will only focus on the base-
case since this scenario is where all forecasts are built.
▪ Americas
Although we saw an increase in the number of managed and franchised hotels
from 2016 to 2019 of 9.72%, the pipeline got slightly weaker during the period in
scope. On one hand, some hotels were realised or suspended from the pipeline,
on the other hand, the Americas is the market, where IHG is the most active
(73% of their hotels located there). Therefore, there is less need to expand in this
region. Additionally, competition is very high since Hyatt, Hilton and Marriott are
also having their main market in that region. Consequently, we see IHG
expanding more in other areas such as Greater China. We expect that the
Americas pipeline remains relatively stable over a ten-year period and changes
from 1,121 in 2019 to 1,018 in 2029. Nevertheless, the system will continue to
grow, and IHG is expected to have 4,815 franchised hotels by 2029, representing
a CAGR of 1.14% (2019-2029).
Since IHG will continue focusing on their asset-light business model, we do not
expect the group to add further owned hotels to the pipeline. Some of the existing
seven ones (2019) will close until the end of the forecasting period so that IHG
will end up with four owned hotels in 2029.
▪ EMEAA
The revenues of EMEAA are approximately generated by 50% in Europe, 16% in
the Middle East, 16% in Asia (excluding Greater China and Japan), 16% in
Australia and Japan, and a negligible amount in Africa13. Compared to other hotel
chains such as Accor, IHG has a relatively weak presence in Europe. Hence, we
see more potential for new hotel openings in this region. Thus, we see the group
to maintain the same number of hotels in the pipeline for the next years in
EMEAA. Moreover, the company has disclosed to focus on building new voco
hotels in Europe and the Middle East. Those new hotels are not only constructed
or transformed relatively fast (on average one year) but they also require a
relatively small investment by the franchisors since existing hotels are easily
converted into voco hotels. Since all voco hotels are in the fee business segment,
the expansion costs will not be carried by IHG but by the managers.
InterContinental Hotels Group plans to open within the next ten years more than
200 new voco hotels. In 2019, IHG had operated twelve voco hotels and had
additional 19 in their pipeline. Assuming that IHG successfully expands this
13 According to Matthew Woollard, Vice President IHG Investor Relations.
INTERCONTINENTAL HOTELS GROUP PLC COMPANY REPORT
PAGE 16/38
chain, we see 193 voco hotels in 2029 and IHG will keep after a heavy expansion
20 hotels in their pipeline to ensure substantial growth in the upscale segment
and cover hotels to close after 25 years because of expired contracts. We
assume that voco will exhibit similar occupancy rates and average daily rates as
Indigo Hotels or Crowne Plaza since those are the most comparable ones. Under
this premise, we see a $125.11m revenue in 2029 compared to $10.81m in 2019.
The ROIC of the voco hotels will be above the ROIC of the whole group and the
fee business only until 2031. From 2032 onwards the voco-ROIC will be slightly
below the fee-business-ROIC (115.42% vs 116.25% in 2034). It is expected that
the new openings will add significant value primarily until 2028. Later, they will
behave approximately as any other part of the fee business.
Similar to the Americas, we do not expect any further owned hotels to be built.
Consequently, the number will decrease from nineteen in 2019 to twelve in 2029.
The number of hotels belonging to the fee business will also decrease slightly
from 1,107 (2019) to 1,054 (2029). In the last years forecasted, we see
approximately 44 hotels opening and 43 closures in the EMEAA region.
However, in 2020 and 2021, we have expected more closures than openings,
explaining the decreased number after ten years.
▪ Greater China
In 2020, IHG held a total market share of 3% in the Chinese market. Even though
the company has established a solid standing in Greater China, it has still lost
parts of its market share to local competition. Nonetheless, the groups share in
the luxury segment amounts to 14% but in the major mainstream market, only
2%.
The company is focusing on its continued expansion mainly in Greater China. In
2019, only 6.48% of the total revenue came from Greater China, but
approximately a third of the pipeline hotels were designed for that region.
Consequently, the Chinese business is forecasted to reach with 731 hotels (vs
2019: 470) 16.26% of the total revenue in 2029 ($454.68m). Most hotels in the
pipeline (60%) are for the mainstream segment (Holiday Inn Express alone 39%
of the local pipeline). This intense focus can be seen as a risk due to the lower
diversification. Moreover, 87% of hotels in Greater China belonged to the
mainstream market in 2019, which makes the competition harder. However, this
is the most targeted segment; consequently, a successful expansion will have a
significant upside. We see this as likely as the group has substantial experience
INTERCONTINENTAL HOTELS GROUP PLC COMPANY REPORT
PAGE 17/38
in the mainstream market, and Chinese customers have developed a preference
for Western, luxury brands14 that will help IHG boost its popularity.
Beyond the corona pandemic, we expect further GDP growth, improved
infrastructure, and a growing middle-class population which will help the domestic
travel in Greater China. We see a market, which is growing and less targeted by
other Western hotel brands providing more significant benefits than an expansion
in the US.
▪ Working Spaces
In 2016 IHG launched $200m programmes to redesign especially Crown Plaza
hotels in the Americas and Europe. IHG invested in reinventing those hotels to
meet business travellers' demands with flexible work and meeting spaces. We
expect that this concept will be taken to the next level after the Covid-19
pandemic due to the increased home office possibilities. Thus, IHG will transform
parts of its standard rooms to office rooms or office-and-bedrooms that can be
booked for some days, weeks or even for the longer term.
We expect that working-from-anywhere will be a trend but sustain in the future
since many firms will realise that a defined office is not necessary to ensure
productivity. Moreover, a home-office solution reduces rent costs and has the
potential to increase the work-life balance (see Figure 24 - Workforce expected to
work on remote in July 2021). In case a firm requires conference rooms for
meetings with clients, such a room can be booked via IHG. With flexible offices in
IHG hotels, employees can combine travelling and working. Those flexible office
rooms will also increase business travellers' productivity as soon as this rebound,
since working before and after meetings will be supported.
We expect that those rooms will be offered to a more considerable extent in
2021. Such office rooms are available already in New York InterContinental
Times Square for a discount of 56.51% compared to a standard room which was
assumed to be the discount for every region compared to the average rate per
room. As the leading competitor, we have identified "WeWork". According to their
annual report (2019), the occupancy rate has been 85%. We target this KPI for
IHG as well and expect to reach it in 2025. It is assumed that almost all office
rooms offered will be fee-based and the same management fee as for the usual
rooms will be transferred to the group. By 2029, the revenue of working spaces
only will be $18.37bn, and this segment will exhibit an ROIC of 168.61% (vs fee-
business-ROIC of 137.02%). However, in the extended forecasting period, the
working-spaces-ROIC will decrease to 114.65% which is slightly lower than the
14 "Opportunity for luxury brands in China." by Ronald Jean Degen, 2009.
Figure 25 - Number of hotels offering working spaces and revenue from those (right axis) Source: Analysts
Figure 24 - Workforce expected to work on remote in July 2021 Source: Q4 CNBC Global CFO Council Survey
INTERCONTINENTAL HOTELS GROUP PLC COMPANY REPORT
PAGE 18/38
ROIC for the fee-business only (116.49%) but still higher than the one for the
group (85.79%). Regardless of the still high ROIC, IHG's fee business does not
benefit from the working spaces from 2030 onwards, due to a slower-growing
NOPLAT. This growth slows down since more hotels have added this new
revenue source to their business in the years earlier. However, by 2030 we
expect that most hotels interested in working spaces have added those already.
The demand for flexible office solutions might be a decade after the pandemic
lower than in the early '20s. Assuming IHG shuts down the working spaces in
2030, the ROIC for the fee business will improve from 116.25% to 116.68% in
2034. We do not assume that IHG will shut down the working spaces business
immediately. This is mainly because the group might lose some business
travellers who have booked a bedroom and a working space, which might lead to
an overall lower ROIC. The working spaces ROIC would break even with the fee
business if 17,749 instead of 17,467 office rooms were operated or an ADR of
$80.13 instead of $78.86 was charged in 2034. Hence, IHG might have the
power to increase the rate in case the ROIC delivers unsatisfying values.
Valuation Assumptions
Revenue Forecast
Since InterContinental belongs to a cyclical industry, the macroeconomic
environment has a significant impact on these estimations. Revenues (and every
other prediction) were implicitly forecasted until 2029. For additional five years,
an extended forecasting period has been applied.
In the past few years, IHG's revenue has been continuously growing. However,
the pandemic has affected the hotel industry due to travel restrictions and
governments forcing hotels to close, which has led to occupancy rates falling to
levels never seen before. To become more competitive in times that the demand
for hotels is deficient, IHG has been forced to decrease its average daily rate
(ADR). This figure is only expected to reach 2019 levels once the recovery from
this crisis is verified, which we assume to happen in 2023/24. Our model includes
the expected effect coming from the recovery after the pandemic and inflation
expectations to estimate the change in the ADR.
Since the group's business model is divided into different segments, we have
split the forecast applying the same segmentation into revenues from the fee
business, from the owned business, from the system fund and the
reimbursement of costs. Due to the current circumstances and the need for
hotels to reinvent their business, we have added a forecast for revenues from
working spaces described in the chapter before. As the tourism industry's future
INTERCONTINENTAL HOTELS GROUP PLC COMPANY REPORT
PAGE 19/38
is highly dependent on the further course of the corona pandemic, we have
induced a best-case, base-case and worst-case scenario. The base case has
been used for the valuations since the assumptions for this scenario are the ones
that are aligned with our expectations. The other scenarios will be examined and
explained further in the chapter "Scenario Analysis".
IHG weighted RevPAR15 declined last year in Greater China by -17.31%, due to
both ADR and occupancy declines. This drop was mainly due to the political
unrest and demonstrations in Hong Kong. For 2020, we expect this figure to
decrease once again due to Covid-19 (-65.37%). Nonetheless, we believe this
figure will increase in the years afterwards, mainly because Greater China's
economy and tourism activity is expected to grow due to the factors mentioned in
the chapter Hotel Development for Greater China. Besides those factors, China
is becoming a more and more critical business partner for many Western nations.
Hence, we assume that as soon as the pandemic is over and travelling rebounds,
many business travellers will come to this country. Even though China has
recovered relatively quickly from the pandemic; currently only domestic travelling
is allowed there. Consequently, we expect RevPAR to recover to pre-crisis levels
between 2022 and 2023 when all other nations visit China and when business
travelling becomes more convenient again. We expect Greater China to recover
in 2023 and continue growing afterwards with a mentionable pace in revenues.
We see Greater China's revenue CAGR for 2022 until 2029 at 21.01% due to
realised expansion plans, still increasing occupancy rates, growing business
importance and better economic conditions (see Hotel Development – Greater
China). This CAGR is mainly driven by strong growth from 2022 until 2026
(between 24.60% to 48.29% YoY).
We have forecasted a moderate increase in RevPAR in the Americas region after
the recovery period, driven by an inflation rate of 2.10%. We do not expect any
other factors influencing the RevPAR from 2025 onwards since this market is the
most saturated and stable. This region contributed to 49.93% of the group's
revenues in 2019, and we see this ratio to remain at this level over the years.
Even though the system is not expected to grow as much as in the other regions,
the Americas still exhibit the highest ADR. As soon as people start travelling
again, IHG can charge higher ADRs due to the increased demand. We expect
the fee business after a RevPAR drop of -49.66% in 2020 and a recovery in
2023. We see Americas fee business revenue growing with a CAGR of 8.55%
from 2022 to 2029. In the next years, we expect the owned business to continue
losing importance in this region. We do not expect IHG to open further owned
15 We have calculated weighted RevPAR for three main regions considered based on the number of hotels present in each region.
Figure 26 - RevPAR development per region Source: Analysts
INTERCONTINENTAL HOTELS GROUP PLC COMPANY REPORT
PAGE 20/38
hotels there since the company has decided to pursue the asset-light strategy
and we see this as likely as well, due to promising returns with this strategy in the
past. Although we see RevPAR recovering in 2023 for the owned business, the
revenue will not reach pre-Covid levels due to seven owned hotels' closures and
no further new openings in this segment.
Last year EMEAA RevPAR grew 0.3%, driven by a 0.7ppt growth in occupancy.
Revenues are primarily coming from hotels in the United Kingdom and gateway
cities in continental Europe, the Middle East and Asia. We expect the slowest
recovery in EMEAA due to stricter policies than, for example, in the US and due
to a severer pandemic course than in China. The prior levels of revenue and
RevPAR will be reached in 2024. After a revenue drop of -65.95% in the fee
business in 2020, we expect in 2021 a revenue jump of 53.75% (from $114.75m
to $176.42m). We see that travelling within most European Union countries
should be allowed in the first half of 2021. Many European countries are currently
in a second or third lockdown; thus, cases should recover, and restrictions will be
eased. Additionally, since a vaccine is available in many countries already, herd
immunity can be reached in summer. The most populous European country,
Germany, aims to achieve herd immunity in the end of summer 202116. For the
fee business revenue, we see a CAGR (2022-2029) of 6.17%. Like the US, the
owned hotel business will never recover fully, since the system will shrink a bit
due to hotels' possible closures without new ones being built.
We do not expect the whole economy to recover from the pandemic only in 2023.
Still, due to changes in society, in working circumstances and mindsets, we see
the tourism industry to take longer. Many firms will get used to Zoom-meetings
and will take some time to go back to the more expensive business travelling.
Nevertheless, we see IHG also targeting business travellers in the next years, but
with the new flexible working format. The home office trend enables many people
to work from anywhere. We expect an $18.64m revenue from this segment by
2029 due to the factors described in the chapter Working Spaces.
The last two components contributing to the group's revenue are the system fund
and reimbursement of costs. Since the system fund revenue is used for
marketing and IT, we have forecasted it as a percentage of the fee business's net
income (recovery in 2023, CAGR (2022-2029): 8.20%). As mentioned before, the
system Fund is designed to operate at break-even and does not result in a profit
or loss for IHG. Nevertheless, we ran a scenario analysis with different rates. If
the system fund rate increases, more revenue is created on the one hand, which
will be spent on the other hand. Consequently, the unlevered free cash flow and
16 “Herdenimmunität bis Ende des Sommers“, dpa, 15th of December 2020
in $m (2034) 4.49% 4.00% 5.00% 6.00%Sales 7965 7694 8250 8806EBIT 1550 1551 1549 1547Op. FCF 1108 1110 1106 1102S.price GBP 48.92 49.04 48.79 48.53
Return for 5.50% 5.76% 5.22% 4.67%Shareholder
System fund rate scenario analysis
Table 5 - System fund rate scenario analysis Source: Analysts
INTERCONTINENTAL HOTELS GROUP PLC COMPANY REPORT
PAGE 21/38
the whole valuation remain relatively unchanged (see Table 5 - System fund rate
scenario analysis).
Financial Projections
In the past, InterContinental Hotels Group has shown a continuous decrease in
EBIT margins with 2019 showing some improvements, decreasing from 18.26%
in 2017 to 13.42% in 2018 but gaining 0.2 percentage points in 2019. However,
after the sharp decline expected to be seen in 2020 (8.35%) due to the
pandemic's impact, we predict a substantial recovery of the EBIT margin in 2022,
equalling 19.00% (see Figure 28 - EBIT and EBIT margin projections). We see
the profitability margin increasing to a maximum of 21.85% in 2025 because we
expect that the revenues increase faster in that period than the cost since IHG
will maintain some of their cost-saving measures after the worst of the pandemic
is over. In 2019 IHG has had 6.21 managers per hotel, which will be decreased
until the occupancy rate is back to pre-crisis levels which will happen in
2024/2025. From 2025 onwards, IHG will operate with on average with 6.05 to
6.11 managers per hotel. Another reason for revenues increasing faster than
costs in that period is the management fee. As Matthew Woolard has confirmed,
IHG has lowered the management fee during the pandemic. We expect RevPAR
to return to normal levels between 2024 and 2025, the management fee is
estimated to reach the 2019 levels of 5.28% in 2022 already and will increase to
5.47% in 2024. This is because the management fee in Greater China has
always been higher, and the contribution to the group's revenue will increase
over time from this area. After that period of EBIT margin growth, it is expected to
decrease to a value of 21.26% in 2029. Even though the change in costs will
continue to fall until the extended forecasting period in 2030, revenues will grow
even slower. The moderately lower increase in costs is due to economies of
scale, as even if the number of hotels will be evolving in the future, the expenses
for marketing or IT do not grow at the same pace. The slighter decrease in
revenues can be explained by a stagnating occupancy rate from 2025 onwards.
According to past data, an occupancy rate of around 70.5% is where IHG can
expect the highest RevPAR.
IHG's slowdown on expansion during the past years has been characterised by
negative but increasing numbers in CapEx due to smaller changes in PPE. In
2018 and 2019, CapEx remained stable since IHG focusses on the fee business.
This segment does not lead to higher CapEx. In the future, the figure will move in
line with the forecasted number of owned hotels, which we expect to decrease.
Regarding Net Working Capital (NWC), we forecast trade and other payables
using the average payable period. IHG took in the past four years 209 days on
Figure 28 - EBIT and EBIT margin projections Source: Analysts
Figure 27 - IHG sources of revenue in $m Source: Analysts
-218
-179
-180
319
-1292019
2020E
2025E
2030E
2034E
Figure 29 - Net CapEx Forecast Source: Analysts
INTERCONTINENTAL HOTELS GROUP PLC COMPANY REPORT
PAGE 22/38
average to pay their bills. In contrast, IHG has collected outstanding payments
within 52 days. This period is assumed to be kept in the future. Inventories were
forecasted based as a percentage of the revenue of the owned business since
the inventories for the fee business are on the balance sheet of the franchisors.
For that reason, this number is considerably small, and no major changes are
expected. To complete the analysis of the change in NWC, the operating cash
has been projected. We estimated operating cash and cash equivalents to be 2%
of the operating revenue, as we do not assume a hotel needs more cash to
handle the daily operations. Since the revenue will grow after the crisis, operating
cash does so as well. However, we expect a sharper drop than in the revenues in
2020 (by -79.47%) due to the crisis' impact since we assume that IHG will need
some short-term liquidity in that period.
Considering all positions described above, we expect NWC to increase in 2020
and 2021. Afterwards, we expect it to decrease further with the same rate as the
revenue grows. IHG used to have and will continue to have a negative NWC
since the guests pay in advance (see Figure 30 - NWC development).
The operating free-cash-flow (FCF) of the company in 2020 is forecasted to be
$1,110m, five times higher than in 2019 (see Figure 31 - FCF development). A
break on new investments to be able to recover from the crisis causes this
development. EBIT is projected to be in this year only half of the previous one.
Nevertheless, this development will be driven by a significant increase in net
CapEx and NWC to offset the operating decrease. However, in 2021 we expect
the operating FCF to decrease to less than 2019 levels, as new investments are
projected to come in, especially if the Covid-19 vaccine starts being distributed
across the world. Due to periods of more or fewer investments, FCF remains
volatile but stabilises around 2027.
Book Values of Debt and Equity
When analysing IHG's balance sheet, one of the most prominent points is the
high debt and the corresponding low equity. Such a relationship indicates a high
level of risk for investors.
Equity becomes negative if liabilities exceed assets. This does not necessarily
mean that the company is over-levered. In the case of IHG, the cause of that
relationship is the asset-light business model. With relatively low PPE values, a
considerable typical debt ratio compared to the equity market value can lead to a
negative book value of equity.
To assess if the current and future debt level can impose a risk for IHG, the
absolute amount of debt and the corresponding level of interest expenses were Figure 32 - IHG net debt to equity Source: Analysts
Figure 30 - NWC development Source: Analysts
Figure 31 - FCF development Source: Analysts
INTERCONTINENTAL HOTELS GROUP PLC COMPANY REPORT
PAGE 23/38
examined. Therefore, we have calculated the net debt to earnings before interest,
tax, depreciation, and amortisation (EBITDA) ratio and the interest coverage
ratio. When the net debt to EBITDA ratio is higher than four or five, this can be a
warning sign, which is the case for IHG in 2020 and 2021 (4.12 and 4.37) due to
lower EBITDA caused by the decreased travel activity. However, if IHG manages
to increase sales in the next years as predicted, the ratio will move to a healthy
range again. The interest coverage ratio is exceptionally high in the future;
consequently, IHG should not have problems paying back their interest expenses
(see Figure 33 - IHG debt coverage). Those numbers indicate that the group can
handle that high debt burden, but IHG should bear in mind that too much
leverage can harm the business due to decreased ratings. A reduced rating
would lead to higher costs of debt, a higher WACC and a lower valuation. In that
case, we still do not expect IHG to struggle with meeting its interest payments,
due to the sufficient interest coverage ratio.
High leverage does not seem to be unusual in the hotel industry. When
comparing IHG with its closest peers (see Figure 34), one can see that Hilton and
Marriott are firmly levered as well. In Hilton's and Marriott's case, the debt to
equity ratio is highly positive (or negative). Due to the low level of assets, the
book value of equity becomes very small or negative to balance the balance
sheet. Only Accor maintains a capital structure (in book values) where equity
exceeds debt. A combination of relatively low financial liabilities with a
considerably high level of non-operating cash pushes the net debt down. Despite
the asset-light business, Accor's assets do not exceed liabilities and allow the
smallest debt to equity ratio (21%) among the peers.
Cost of Capital
To derive the share price of IHG, the Discounted Cash Flow Method (DCF) is
considered a suitable approach as the capital structure is not expected to change
significantly. Therefore, to discount the expected FCFs, the weighted average
cost of capital (WACC) needs to be determined.
First, the Capital Asset Pricing Model has been used to calculate the cost of
equity. As a proxy for the nominal risk-free rate (2.38%), we have adjusted the
10y US Treasury Yield (0.91% as of January 3rd, 2021) for inflation. For the
estimation of beta, the monthly returns of the MSCI World (in $) were regressed
against the IHG returns from January 2015 until end of December 2020, which
led to a levered beta of 1.35 within a confidence interval from 1.01 to 1.69.
Considering such a wide interval, we have validated the result by regressing the
main competitors of IHG (namely Accor, Hilton, Hyatt and Marriott) against the
MSCI World in $ and € (for Accor only). Those betas were unlevered to enable us
Figure 33 - IHG debt coverage Source: Analysts
Figure 34 - Peers net debt to equity, 2019 (in $m) Source: Analysts
INTERCONTINENTAL HOTELS GROUP PLC COMPANY REPORT
PAGE 24/38
to analyse them independently of their capital structure. Those competitors reflect
the confidence interval and the average re-levered beta amounts to 1.35.
Therefore, the beta development for different periods and the rolling beta of IHG
(see Figure 35 and Figure 36) and its peers have been examined. The period
that was initially chosen (from 2015 to 2020) leads to the highest beta. Although
IHG is a cyclical stock by nature, we are concerned that a levered beta of 1.35
can be too high after analysing its development. Especially when only
considering only the period 2019-2020, which includes a very volatile period, a
beta of 1.35 has also been derived, which makes 1.35 less appropriate as a
forward-looking value. Since a period with monthly observations from 2016-2020
is considered sufficient17, the analysis and further calculations will be based on a
levered beta 1.31 and an unlevered one of 1.02 (see Table 6 - IHG beta).
Accor Hilton Marriott Hyatt IHGBeta levered 1.37 1.36 1.90 1.583 1.31 Debt Beta 0.06- 0.06- 0.06- 0.057- 0.06- D/EV 16% 23% 25% 20.17% 18%E/EV 84% 77% 75% 79.83% 82%D/E 18% 30% 34% 25.26% 22%
Beta unlevered 1.15 1.04 1.40 1.253 1.06Relevered Beta 1.41 1.27 1.72 1.54 1.31Median unlevered Beta 1.15Relevered median beta 1.41
Unlevered Beta of Peers and IHG (2016-2020)
Table 6 - IHG beta Source: Analysts
With this beta, a nominal risk-free rate of 2.38% and an expected market return
of 6.75% (as suggested by KPMG18) cost of equity of 11.21% were calculated.
To derive the cost of debt, a long-dated IHG bond (BBB-rating), its yield, default
rate and loan recovery rate were considered, and a rate of 1.96% was estimated.
Finally, with an E/EV-ratio of 82.19% and a tax rate of 17%, the WACC amounts
to 9.50%.
However, one has to keep in mind that most of the inputs were assumptions. For
this reason, the sensitivity of the cost of equity in dependence of the risk-free rate
and the beta was tested. The values for beta were chosen between the
confidence interval (2016-2020). The risk-free rate can change in the future either
because the economy needs more stimulus to fight economic consequences of
the Covid-19 crisis (decrease) or because the Fed decides to fight potentially
increased inflation caused by the higher money supply (increase).
17 „Valuation: measuring and managing the value of companies” by Tim Koller et al, 2010. 18 „Equity Market Risk Premium – Research Summary” by KPMG, 2020
Figure 36 - IHG beta development Source: Analysts
Figure 35 - IHG rolling beta Source: Analysts
INTERCONTINENTAL HOTELS GROUP PLC COMPANY REPORT
PAGE 25/38
11.21% 0.96 1.04 1.13 1.22 1.31 1.40 1.48 1.57 1.66 1.96% 8.42% 9.01% 9.60% 10.19% 10.78% 11.37% 11.96% 12.55% 13.15%2.17% 8.63% 9.22% 9.81% 10.40% 11.00% 11.59% 12.18% 12.77% 13.36%2.38% 8.84% 9.44% 10.03% 10.62% 11.21% 11.80% 12.39% 12.98% 13.57%2.57% 9.03% 9.62% 10.21% 10.80% 11.39% 11.98% 12.58% 13.17% 13.76%2.75% 9.21% 9.81% 10.40% 10.99% 11.58% 12.17% 12.76% 13.35% 13.94%
Levered Beta
Nom
inal
risk
fr
ee ra
te
Table 7 - Sensitivity of cost of equity based on the levered beta and risk-free rate Source: Analysts
Furthermore, the WACC sensitivity with the cost of equity between 9.60% and
12.76% (derived by different levels of beta) and the cost of debt between 1.56%
and 2.95% were tested.
9.50% 9.60% 10.00% 10.40% 10.81% 11.21% 11.60% 11.98% 12.37% 12.76%1.56% 8.12% 8.45% 8.78% 9.11% 9.44% 9.76% 10.08% 10.40% 10.72%1.76% 8.15% 8.48% 8.81% 9.14% 9.47% 9.79% 10.11% 10.43% 10.75%1.96% 8.18% 8.51% 8.84% 9.17% 9.50% 9.82% 10.14% 10.46% 10.78%2.16% 8.21% 8.54% 8.87% 9.20% 9.53% 9.85% 10.17% 10.49% 10.81%2.35% 8.24% 8.57% 8.90% 9.23% 9.56% 9.88% 10.20% 10.52% 10.84%2.55% 8.27% 8.60% 8.93% 9.26% 9.59% 9.91% 10.23% 10.55% 10.87%2.75% 8.30% 8.63% 8.96% 9.29% 9.62% 9.94% 10.26% 10.58% 10.90%2.95% 8.33% 8.66% 8.99% 9.32% 9.65% 9.97% 10.29% 10.61% 10.92%
Cos
t of D
ebt
Cost of Equity
Table 8 - WACC sensitivity Source: Analysts
Intrinsic Valuation
To derive IHG's share price with the DCF Method, the unlevered free cash flows
from 2021 onwards are discounted separately with the WACC. Additionally, the
terminal value of the last unlevered free cash flow (2034) has been applied with
the Gordon Growth Model. The perpetual growth rate (g), as a product of ROIC
and reinvestment rate, is equal to the assumed overall nominal growth rate in
2034 (4.92%, weighted average of IHG's regions). In the last forecasted years,
sales, core result, investments, and consequently the unlevered free cash flow
have stabilised and were all driven by the growth in sales only, which was
expected to align with the nominal growth.
The sum of the discounted cash flows and the terminal value amount to an
enterprise value of $13,964m. To derive the equity value and share price, the
non-operating enterprise (book) value of 2021 is added, and the net debt (book)
value of 2021 deducted. The result is an equity value of $12,214m, which
corresponds to a share price of $66.85 or £48.92 (see Table 9 - DCF IHG). Since
55.84% of IHG's value is driven by the terminal value, which is highly dependent
on g (as a product of ROIC and RR) a sensitivity analysis has been performed on
those parameters for the final FCF and consequently the share price (see Table
10 - Sensitivity of g and Table 11 - Share price sensitivity in dependence of
WACC and g). The terminal value has significant importance, and hence, it is
crucial to building reliable assumptions for an intrinsic valuation.
INTERCONTINENTAL HOTELS GROUP PLC COMPANY REPORT
PAGE 26/38
InterContinental Hotel Group: DCF Valuation
Perpetual Growth 4.92%WACC 9.50%
1 2 3 4 5 6 7 8 9 10 11 12 13
in $m 2021FC 2022FC 2023FC 2024FC 2025FC 2026FC 2027FC 2028FC 2029FC 2030FC 2031FC 2032FC 2033FC 2034FCTotal Sales 3315 4070 4515 4937 5292 5593 5923 6278 6583 6902 7237 7591 7965
Cost of Sales and admisnistrative expenses -246 -298 -329 -352 -381 -406 -432 -460 -482 -505 -529 -555 -583Staff costs -1484 -1795 -1980 -2123 -2298 -2445 -2602 -2769 -2976 -3200 -3443 -3706 -3992Other operating costs -844 -1021 -1141 -1268 -1350 -1418 -1499 -1587 -1613 -1637 -1657 -1674 -1687
EBITDA 741 956 1065 1194 1263 1323 1390 1463 1512 1560 1607 1655 1703D&A -101 -105 -105 -107 -111 -114 -117 -121 -127 -133 -139 -146 -153
Operating EBIT 640 852 960 1087 1152 1210 1273 1342 1386 1427 1468 1509 1550Operating EBIT Margin 19% 21% 21% 22% 22% 22% 21% 21% 21% 21% 20% 20% 19%Notional Taxes -109 -145 -163 -185 -196 -206 -216 -228 -236 -243 -250 -257 -263Adjusted Taxes -45 -60 -68 -77 -82 -86 -90 -95 -98 -101 -104 -107 -110
NOPLAT 486 646 728 825 874 918 966 1019 1052 1083 1114 1146 1176.63D&A 101 105 105 107 111 114 117 121 127 133 139 146 153
Gross CF from operations 587 751 834 932 985 1032 1083 1140 1179 1216 1254 1292 1330
Capex -234 -235 -182 -180 -172 -165 -174 -182 -179 -188 -197 -207 -218Change in NWC -43 -36 -21 -29 -9 -8 -10 -11 -13 -13 -13 -14 -15Change in other operating assets -159 -156 -113 -108 -88 -78 -89 -95 -106 -111 -117 -123 -130Change in other operating liabilities -38 280 156 161 115 91 106 113 115 120 126 133 140
Unlevered Operating FCF 113 604 674 776 832 872 916 965 995 1025 1053 1080 1108 @ WACC 9.50% 9.50% 9.50% 9.50% 9.50% 9.50% 9.50% 9.50% 9.50% 9.50% 9.50% 9.50% 9.50%Discount Factor 0.91 0.83 0.76 0.70 0.64 0.58 0.53 0.48 0.44 0.40 0.37 0.34 0.31
Discounted Cash Flows 103 504 513 540 528 506 485 467 440 413 388 363 340Present Value of Terminal Value 7797
Enterprise Value 13,388 14,547 15,325 16,107 16,862 17,633 18,436 19,272 20,138 21,057 22,033 23,074 24,186 25,377 Debt Value acc. to Balance Sheet 1,743 2,069 2,077 2,148 2,218 2,178 2,267 2,410 2,516 2,638 2,766 2,900 3,042 3,192
D/EV 13.0% 14.2% 13.6% 13.3% 13.2% 12.4% 12.3% 12.5% 12.5% 12.5% 12.6% 12.6% 12.6% 12.6%
Sum of Discounted Cash Flows 5,591 Share Price in USD 66.85 Terminal Value 7,797 Number of shares 182.70 Non-Operating Enterprise Value 576 $/GBP 0.7318 Source: Bloomberg
Enterprise Value 13,964 Share price in GBP 48.92 Minority Interest 8 Current Share Price in GBP 46.90 As of 03/01/2021
Financial Debt Value 1,743- Upside/Downside 4.30%Equity Value 12,213 Return for shareholder incl. dividend 5.50%
7.5%NOPLAT 133 237 342 446 550 655 759 863 968 1,072 1,177 1,281 1,385 1,385 Invested Capital 1,400 1,404 1,411 1,419 1,422 1,427 1,442 1,448 1,454 1,460 1,467 1,473 1,493 1,506 New Invested Capital 2 7 13 22 24 29 44 50 57 63 69 75 95 109
Operating FCF 130 230 328 424 526 626 715 813 911 1,010 1,108 1,206 1,291 1,277
ROIC 9.50% 16.97% 24.44% 31.91% 0.39374 0.46842 0.5431 0.61777 69.25% 76.71% 84.18% 91.65% 99.12% 99.12%RR 1.85% 2.85% 3.85% 4.85% 4.40% 4.40% 5.85% 5.85% 5.85% 5.85% 5.85% 5.85% 6.85% 7.85%
Growth rate 0.18% 0.48% 0.94% 1.55% 1.73% 2.06% 3.18% 3.61% 4.05% 4.49% 4.92% 5.36% 6.79% 7.78%
Terminal Value 430 789 1,190 1,664 2,117 2,638 3,581 4,394 5,342 6,460 7,797 9,422 15,591 24,512 Sum of Discounted FCFs 5,591 5,591 5,591 5,591 5,591 5,591 5,591 5,591 5,591 5,591 5,591 5,591 5,591 5,591 Enterprise Value 6,597 6,956 7,357 7,831 8,283 8,805 9,748 10,561 11,509 12,627 13,964 15,589 21,757 30,679 Equity Value 4,846 5,205 5,605 6,080 6,532 7,054 7,997 8,810 9,758 10,876 12,213 13,838 20,006 28,927
Share Price in USD 26.52 28.49 30.68 33.28 35.75 38.61 43.77 48.22 53.41 59.53 66.85 75.74 109.50 158.33Share Price in GBP 19.41 20.85 22.45 24.35 26.17 28.25 32.03 35.29 39.08 43.56 48.92 55.43 80.13 115.87
Discounted Cash Flows
Sensitivity Analysis of share price in dependence of ROIC and RRBase Case
Table 9 - DCF IHG Source: Analysts
To analyse the sensitivity of the share price in dependence of g and the WACC,
another analysis has been performed. First, the most appropriate values for g
were determined with a sensitivity based on ROIC and reinvestment rate (see
Table 10 - Sensitivity of g). Those values were used for determining the share
price in dependence of g and WACC (range for sensitivity analysis has been
specified in Table 8 - WACC sensitivity already).
4.92% 78.18% 80.18% 82.18% 84.18% 86.18% 88.18% 90.18%4.35% 3.40% 3.49% 3.57% 3.66% 3.75% 3.83% 3.92%4.85% 3.79% 3.89% 3.98% 4.08% 4.18% 4.27% 4.37%5.35% 4.18% 4.29% 4.39% 4.50% 4.61% 4.71% 4.82%5.85% 4.57% 4.69% 4.80% 4.92% 5.04% 5.16% 5.27%6.35% 4.96% 5.09% 5.22% 5.34% 5.47% 5.60% 5.72%6.85% 5.35% 5.49% 5.63% 5.76% 5.90% 6.04% 6.17%7.35% 5.74% 5.89% 6.04% 6.18% 6.33% 6.48% 6.63%R
einv
estm
ent R
ate
ROIC
Table 10 - Sensitivity of g Source: Analysts
in GBP48.92 8.48% 8.82% 9.16% 9.50% 9.86% 10.22% 10.58%3.89% 54.03 49.81 46.14 42.91 39.91 37.25 34.88 4.23% 56.98 52.26 48.19 44.65 41.38 38.51 35.96 4.58% 60.46 55.11 50.56 46.63 43.05 39.92 37.16 4.92% 64.61 58.47 53.31 48.92 44.95 41.52 38.52 5.29% 70.09 62.82 56.83 51.80 47.32 43.48 40.17 5.67% 77.02 68.20 61.09 55.24 50.10 45.77 42.07 6.04% 86.05 75.01 66.37 59.41 53.43 48.47 44.29
WACC
Gro
wth
Rat
e
Table 11 - Share price sensitivity in dependence of WACC and g Source: Analysts
INTERCONTINENTAL HOTELS GROUP PLC COMPANY REPORT
PAGE 27/38
Scenario Analysis
As mentioned in the chapter "Revenue Forecast", three scenarios were built that
capture the risks and chances depending on the pandemic's further course.
Assumption
Full recovery in…
Fee Busi- ness (2029)
Owned Busi-ness
Working Spaces
Best Case
Vaccine fully developed end of the 2020 which will be broadly available to public in the first half of 2021, fully effective, no further lockdowns and traveling rebounds rather quick
2023 2,997m$ 487m$ 64m$
Base Case
Vaccine fully developed end of 2020, broadly available second half of 2021, 90% effective, until then some further restrictions, rather slow recovery due to increased awareness, mutations and restrictions
2024 2,416m$ 360m$ 19m$
Worst Case
Vaccine rather later broadly available due to supply bottlenecks (2022), some mutations that make a vaccine less effective and further travel restrictions until 2023, rather slow recovery
2026 1,913m$ 290m$ -$
Table 12 - Scenario overview Source: Analysts
Depending on the scenario, the pipeline forecast, the ADR and the occupancy
rate are changing. In the best case, we assume a hotel to be operated three
years after the contract has been signed and that 45% of the hotels in the
pipeline are completed. In the base- and worst-case it takes 3.5 years, and they
exhibit a completion rate of 40%.
in $m Base (100%) Best (100%) Worst (100%)Best (50%) Base (50%)
Best (30%) Base (70%)
Worst (50%)Base (50%)
Worst (30%)Base (70%)
Best (20%)Base (60%)
Worst (20%)Total Sales (2034) 7,965 8,995 6,767 8,488 8,280 7,345 7,586 7,913 EBIT (2034) 1,550 1,787 879 1,673 1,625 1,195 1,330 1,444 NOPLAT (2034) 1,177 1,356 668 1,270 1,233 907 1,010 1,096 Operating FCF (2034) 1,108 1,285 611 1,200 1,164 845 945 1,030 Sum of Discounted CFs 5,591 6,553 3,363 6,074 5,881 4,439 4,886 5,297 Terminal Value 7,797 9,043 4,299 8,443 8,190 5,944 6,648 7,247 Enterprise Value 13,964 16,187 8,208 15,100 14,652 10,944 12,101 13,117 Equity Value 12,213 14,455 6,341 13,359 12,906 9,135 10,315 11,346 Share Price in USD 66.85 79.12 34.71 73.12 70.64 50.00 56.46 62.10 Share Price in GBP 48.92 57.90 25.40 53.51 51.70 36.59 41.32 45.45
Return for Shareholder 5.50% 24.99% -45.45% 15.45% 11.52% -21.19% -10.95% -2.00%
Scenario Summary
Table 13 - Scenario Analysis Source: Analysts In the best-case, the recommendation would change to a buy with a return for the
shareholder of 24.99%. The higher upside can be explained by a combination of
faster system growth and a more robust recovery in terms of occupancy rates
and ADR's. However, if the worst-case would occur, the target share price would
change due to the slower and weaker recovery to £25.40, corresponding to a
total return of -45.45%.
The best-case scenario seems not to be realistic since it assumes a fast growth,
especially in ADR's, which might only be feasible with more substantial growth in
travel demand, increased general economic growth, and higher available
incomes. To model the possibility that the base case turns out better than
expected, the probabilities of base- and best-case were weighted (same for
worst-case) (see Table 14 - Best-case scenario). To have a 10.00% upside for
the shareholder, and hence, a buy recommendation, the base case needs to turn
Best case
Shareprice in GBP
Upside for Shareholders
0.0% 48.92 5.50%2.5% 49.39 6.51%5.0% 49.85 7.52%7.5% 50.32 8.53%
10.0% 50.78 9.53%12.5% 51.24 10.53%15.0% 51.70 11.52%
(While base case = 100% - best case)
Table 14 - Best-case scenario Source: Analysts
INTERCONTINENTAL HOTELS GROUP PLC COMPANY REPORT
PAGE 28/38
out 22.35% better than expected (meaning a weighting of 22.35% best-case,
77.65% base-case) (for more scenarios see Table 14 - Best-case scenario).
The worst-case scenario is also not considered likely since an effective vaccine is
already available and is also announced to be broadly distributed soon. As
described in the risk analysis chapter, there is some risk left regarding mutations
and supply bottlenecks. That scenario is more severe than the best-case since
some of IHG's costs do not change even if fewer hotels are operated (for
example for marketing or the guest reservation system). For the shareholder to
have a total return of zero (0.07%), the base case needs to turn out 9.70% worse
than expected (meaning a weighting of 9.30% worst-case, 90.70% base-case)
(see Table 15 - Worst-case scenario). Just slightly better or worse assumptions
in one of the value drivers can cause a return for the shareholder of ≤0% or
≥10%. The valuation is thus, highly dependent on the accuracy of our forecast.
RevPAR Sensitivity
For each of the previously examined scenarios, the most important input is the
RevPAR. A DCF was built, starting with the income from fee business, which is
split in RevPAR and the management fee, and goes from there to the operating
free cash flow. The 95% confidence interval of the past values for RevPAR
(2021-2034) has been used for the sensitivity analysis. The management fee
values were chosen between the maximum and the minimum amount in our
observation period.
48.92 8.48% 8.82% 9.16% 9.50% 9.86% 10.22% 10.58% 48.92 4.68% 5.06% 5.44% 5.60% 5.76%87.94 46.24 42.05 38.52 35.52 32.80 30.45 28.39 87.94 23.30 29.41 35.52 38.08 40.64 90.65 49.67 45.18 41.41 38.20 35.29 32.78 30.57 90.65 25.60 31.90 38.20 40.84 43.48 93.35 53.10 48.32 44.30 40.88 37.78 35.10 32.76 93.35 27.91 34.39 40.88 43.60 46.31 96.05 56.53 51.45 47.19 43.56 40.28 37.43 34.94 96.05 30.21 36.89 43.56 46.36 49.15 98.75 59.95 54.59 50.08 46.24 42.77 39.76 37.13 98.75 32.52 39.38 46.24 49.11 51.99
101.45 63.38 57.72 52.97 48.92 45.26 42.09 39.31 101.45 34.82 41.87 48.92 51.87 54.82 104.15 66.81 60.86 55.86 51.60 47.75 44.41 41.50 104.15 37.13 44.36 51.60 54.63 57.66 106.85 70.24 63.99 58.75 54.28 50.24 46.74 43.68 106.85 39.43 46.86 54.28 57.39 60.50 109.55 73.66 67.13 61.64 56.96 52.73 49.07 45.87 109.55 41.74 49.35 56.96 60.15 63.34 112.25 77.09 70.26 64.53 59.64 55.22 51.40 48.05 112.25 44.04 51.84 59.64 62.91 66.17 114.95 80.52 73.40 67.42 62.32 57.71 53.72 50.23 114.95 46.35 54.33 62.32 65.67 69.01
Management FeeWACC
Rev
PAR
Rev
PAR
Table 16 - RevPAR and WACC & RevPAR and Management Fee sensitivity analysis Source: Analysts
One can see that an increase in RevPAR of 5.32% (from $101.45 to $106.85)
translates ceteris paribus to a rise in the share price of 10.96%. Moreover, the
management fee's effect has been investigated, since the franchised business's
income makes up 86.44% of the total income in 2034 (excluding system fund
revenue and reimbursement of cost). Significantly, the management fee is a
rather vague assumption, since IHG does not disclose any information about it
and is calculated based on the past management fees. An increase in the fee of
2.93% (from 5.44% to 5.60%) would lead ceteris paribus to a share price
increase of 6.04%. A combined effect of a RevPAR rise of 5.38% and fee
Worst case
Shareprice in GBP
Downside for Shareholders
0.0% 48.92 5.50%5.0% 47.60 2.64%
10.0% 46.30 -0.17%15.0% 45.02 -2.93%20.0% 43.77 -5.64%25.0% 42.54 -8.31%30.0% 41.32 -10.95%
(While base case = 100% - worst case)
Table 15 - Worst-case scenario Source: Analysts
INTERCONTINENTAL HOTELS GROUP PLC COMPANY REPORT
PAGE 29/38
increase of 2.97% would result in a share price increase of 17.31%. In case, the
RevPAR decreases from $101.45 to $98.85 (occupancy rate of 71.73% but a
lower ADR of $137.81 instead of $141.43), or if the average management fee is
5.30% instead of 5.44%, the shareholder cannot expect any return within one
year. However, if the ADR turns out to be $144.39 or the average management
fee increases to 5.56%, the recommendation changes to "buy", leaving the
shareholder with a total return of 10.00%. Thus, the share price depends strongly
on the RevPAR and management fee assumption and must be treated very
carefully.
Relative Valuation
One of the disadvantages of intrinsic valuations became evident in the previous
chapter – that the outcome is very sensitive to changes in assumptions and
requires a lot of those. Therefore, to validate and complete our results, we have
valued IHG using its peers as well. This valuation approach's idea is that
companies within the same sector, which have the same core business and are
similar in terms of size and portfolio, should also be comparable in valuation
(Marriott, Hilton, Hyatt and Accor).
The four companies and IHG were compared in terms of Prices/Earnings (P/E),
enterprise value to EBIT (EV/EBIT) and EBITDA (EV/EBITDA). Usually, Earnings
before interest, taxes, depreciation, amortisation and rent (EBITDAR) should
have been considered for a hospitality company; however, IHG's rent expenses
are neglectable since a hotel is either owned or is franchised.
The average of the comparable companies was built to determine the value that
reflects the industry the best. The average, instead of the median, was used
since those peers are the ones that are very similar to IHG, and the median
would only reflect one company. The multiple valuations do reflect the DCF share
price. Especially, EV/EBITDA which can be seen (after EV/EBITDAR) as the
most appropriate multiple for the hotel industry is in line with the DCF valuation,
which confirms the previous assumptions and result. On average, an EV/EBITDA
multiple based on the chosen peer group would suggest a share price of £52.52
within a range of £45.50 and £62.11 (DCF: £48.92) (see Table 17 - Comparable
Company Analysis).
ROIC comparison of business areas
A company creates value if the investment in the company delivers better returns
than an alternative. Thus, a company creates value if the ROIC exceeds the
WACC. However, the ROIC of IHG is not meaningful and should not be
compared with the WACC since the business is asset-light. The primary source
EV/EBITDA
EV/EBIT P/E
IHG 22.90x 28.56x 46.03x HLT 23.60x 35.06x 56.14x MAR 23.94x 38.84x 54.13x H 22.72x 36.87- NAAC 35.45x - -
Excluded in terms of EBIT and P/E1st Quartile 22.81x 28.56x 46.03x Average 25.72x 34.15x 52.10x 3rd Quartile 29.70x 38.84x 56.14x
Multiples 25th Average 75th EV/EBITDA 45.50 52.52 62.11EV/EBIT 45.71 56.53 65.58P/E 38.35 44.66 48.86
Average 43.19 51.24 58.85
Multiple analysis
Share Price in GBP
Table 17 - Comparable Company Analysis Source: Analysts
INTERCONTINENTAL HOTELS GROUP PLC COMPANY REPORT
PAGE 30/38
for NOPLAT is IHG's fee business, which involves almost no assets.
Consequently, invested capital is low, which leads to a considerably high ROIC.
In 2018 and 2019, ROIC noted at 64.43% and 77.09%. Due to a decreased
NOPLAT in 2020, ROIC is expected to be at its lowest point (32.38%). Despite,
we expect it to increase the year significantly after (102.34%), due to an all-time
low in invested capital in 2020. In that year, IHG is expected to decrease assets
and increase liabilities for more liquidity. In the extended forecast period this KPI
will stabilise around 87%. This number does not say anything about IHG's value
creation; however, business units can be compared.
The owned business ROIC is not eligible to be compared to other business units
(such as working spaces or the voco hotels discussed in chapter Hotel
Development - EMEAA) due to the asset-heavy business model. However, this
unit would have been eligible to be compared with WACC, since this area needs
to invest capital to create returns. However, it is a discontinued revenue stream.
Hence, there is no focus on value creation. Consequently, also less is invested in
renovations or modernisations. Although ROIC exceeds WACC in 2034 (12.07%
vs 9.50%), one cannot immediately conclude that this business area creates
above-average returns substantially. This business area is sweating the assets
and will not exist anymore as soon as all contracts are expired, or major
renovations would be needed (see Figure 38 - IHG business units ROIC).
Pre-crisis and from 2023 onwards, the ROIC from the fee business is higher than
the total and owned business. It became negative since it is assumed that
operating liabilities increase during the pandemic to ensure more short-term
liquidity to meet IHG's obligations. Since assets are considerably low for that
area, liabilities exceed assets, resulting in a negative invested capital and thus, a
negative ROIC. Also, the fee business ROIC turned negative during the crisis;
however, for different reasons: The owned business is expected to carry the
whole amount of depreciation and amortisation (D&A) since the PPE belongs to
this part of the company. The level of D&A is not expected to decrease, resulting
in a negative NOPLAT for the owned business. The ROIC for the whole group
remains positive during the pandemic since EBITDA is higher. Even after
deducting D&A NOPLAT remains positive, and when combining both business
areas, assets exceed liabilities due to the PPE from the owned business.
The ROIC development of the last business area, working spaces, has been
already discussed in the chapter "Working Spaces". In the long run, it becomes
more aligned with the overall fee-business; however, remains in 2034 slightly
below (109.86% vs 111.63%).
Figure 37 – Number of owned hotels and hotels belonging to the fee business Source: Analysts
Figure 38 - IHG business units ROIC Source: Analysts
INTERCONTINENTAL HOTELS GROUP PLC COMPANY REPORT
PAGE 31/38
Recommendation After analysing IHG into depth, we recommend holding the stock. IHG has been
and still is suffering from the corona crisis, and due to the restrictions concerning
the travel industry the strongest, the consequences will be felt for a more
extended period. However, IHG is in a promising way to return to better levels
than pre-crisis. One of the critical factors that will help is IHG's expansion plan.
Due to the asset-light business model, the company will not bear the majority of
the costs, but the franchisors do. So, a possible expansion comes with little up-
front costs. Despite the crisis, the group had in the third quarter of 2020 890k
rooms operated and 286k in its pipeline, suggesting a healthy system growth the
next years. 34% of the pipeline is planned in Greater China. This area exhibits
mentionable growth potential since it becomes an important business partner for
Western nations. Moreover, the group already claims 14% of the Chinese luxury
market share and tries to establish a similar standing in the major mainstream
market.
Significantly, under the assumption that a vaccine will allow travelling to rebound
in mid/late 2021, IHG will have upside potential in terms of revenues. We expect
those to be back at pre-pandemic levels in 2024 ($4,500m) and continue growing
for the next six years with a CAGR of 5.65% (afterwards growth in line with the
nominal growth rate, 4.92%). However, the pandemic will leave some changes in
society in the near future. Therefore, it is assumed that the home-office trend will
remain, as it is cheaper to not spend money on renting an office. We see
business travel to remain lower than in previous years as the corporate world
well-accepted alternative solutions. In that case, IHG may profit in the long run
from offering flexible working solutions that will enable employees to work from
anywhere, which can offset to some extent, changed business travel behaviour.
Since 5.53% (management fee) of the working spaces' revenues will be
transferred to IHG, this business area will only make up 0.67% of the hotel
business's revenues in 2034. Nevertheless, this additional segment will attract
business travellers, clients who seek to combine travelling and working, or
employees who do not have a fixed office location.
As soon as the Covid-19 vaccine is broadly available, and herd immunity is
reached, international travel will rebound, and hotels will be allowed to use their
full capacity. There is a risk of mutations or supply bottlenecks in the vaccine
distribution. However, we see a chance that travelling will be possible in the
second half of 2021 and that people seek to go on vacation as soon as allowed19.
19 “International travel to come back strong after Covid-19”, consultancy.eu, December 2020.
INTERCONTINENTAL HOTELS GROUP PLC COMPANY REPORT
PAGE 32/38
Another threat is the shift in preferences, that some customers prefer spending
their vacation in an Airbnb. Pedro Oliveira20 has mentioned that Airbnb is a
powerful competitor that steadily forces IHG to improve and stay worth the
money. Approaches to do so include several customisations or investing in new,
"easy-going" brands such as voco.
The stock price has not recovered to the pre-crisis levels (around £50) yet,
however, we see the share price quoting by the end of 2021 around £47.00 to
£53.00.
We consider a share price of £49.82 as target share price. To get to this value,
we have weighted the expected share price as per DCF (£48.92) with 75% and
the average share price calculated with EV/EBITDA (£52.52) with 25%. We have
decided on this split since the DCF is more detailed and forward-looking;
however, it relies on many assumptions.
When investing today, as of 3rd of January 2021, in a share of IHG for £46.90, the
expected return for the shareholder (including a dividend per share of £0.56 in
2021) over a one-year time horizon would equal 7.42% (pure share price upside:
6.22%).
Final Considerations A factor that has not been considered in the model yet is a rumour that IHG can
merge with Accor. The French newspaper "Le Figaro" has reported in August,
that Accor has set up a team to pinpoint possible options. However, neither IHG
nor Accor have confirmed those plans. A potential merger would make the new
conglomerate to the largest hotel chain worldwide. IHG could benefit in such a
scenario from Accor's strong presence in Europe and Accor from IHG's in
Northern America. This mega-merger would have a significant impact on IHG's
future development. Nevertheless, since it is only a rumour so far, this effect has
not been included in the model.
20 Pedro Oliveira, Area Director of Finance and Business Support Iberia, was interviewed by us in November 2020.
Figure 39 - Football Field: Share price in GBP Source: Analysts
MASTER IN FINANCE
THIS REPORT WAS PREPARED EXCLUSIVELY FOR ACADEMIC PURPOSES FRANCISCA FERNANDE & PAULINA MICHEL, MASTER IN
FINANCE STUDENTS OF THE NOVA SCHOOL OF BUSINESS AND ECONOMICS. THE REPORT WAS SUPERVISED BY A NOVA SBE FACULTY MEMBER, ACTING IN A MERE ACADEMIC CAPACITY, WHO REVIEWED THE VALUATION METHODOLOGY AND THE FINANCIAL MODEL.
(PLEASE REFER TO THE DISCLOSURES AND DISCLAIMERS AT END OF THE DOCUMENT) Page 33/38
Appendix
Financial Statements
▪ Income Statement
in $m 2016A 2017A 2018A 2019A 2020FC 2021FC 2022FC 2023FC 2024FC 2025FC 2026FC 2027FC 2028FC 2029FCCore Activities
Revenue from fee business 1,329 1,379 1,486 1,510 748 933 1,228 1,520 1,718 1,906 2,038 2,149 2,277 2,416 Revenue from owned and managed leased hotels 338 351 447 573 217 148 226 297 294 304 323 341 351 360 System Fund revenues 1,199 1,242 1,233 1,373 762 810 1,045 1,264 1,409 1,555 1,660 1,749 1,851 1,962 Reimbursement of costs 1,046 1,103 1,171 1,171 464 642 804 972 1,073 1,150 1,245 1,325 1,410 1,500 Working Spaces - - - - - 0 2 4 5 6 8 11 14 19
Total revenue 3,912 4,075 4,337 4,627 2,190 2,533 3,304 4,057 4,500 4,921 5,274 5,574 5,903 6,257 Other operating revenue 9 84 14 21 24 8 11 14 15 17 18 19 20 21
As % of total revenue 0.23% 2.06% 0.32% 0.45% 1.10% 0.34% 0.34% 0.34% 0.34% 0.34% 0.34% 0.34% 0.34% 0.34%Total Operating revenue 3,921 4,159 4,351 4,648 2,214 2,541 3,315 4,070 4,515 4,937 5,292 5,593 5,923 6,278
Cost of Sales and Administrative Expenses 299- 264- 395- 440- 142- 197- 246- 298- 329- 352- 381- 406- 432- 460- Staff cost 1,907- 2,040- 2,165- 2,180- 856- 1,184- 1,484- 1,795- 1,980- 2,123- 2,298- 2,445- 2,602- 2,769- System Fund expenses 853- 937- 1,032- 1,109- 626- 622- 810- 980- 1,096- 1,219- 1,297- 1,362- 1,439- 1,523- Reimbursement costs 44- 47- 61- 39- 20- 27- 34- 41- 46- 49- 53- 56- 60- 64- Depreciation and Amortisation 75- 112- 115- 116- 102- 98- 101- 105- 105- 107- 111- 114- 117- 121-
as % of PPE and intangibles 5.87% 6.58% 5.96% 5.33% 5.94% 5.94% 5.94% 5.94% 5.94% 5.94% 5.94% 5.94% 5.94% 5.94%Total operating income 743 759 583 764 468 413 640 852 960 1,087 1,152 1,210 1,273 1,342
Adjusted taxes 195- 138- 151- 198- 113- 100- 154- 205- 231- 262- 277- 291- 307- 323- Core result after taxes 548 621 432 566 355 314 486 646 728 825 874 918 966 1,019
Non-Core ActivitiesShare of losses / gains of associates and JVs 2- 3 1- 3- 12- 12- 12- 12- 12- 12- 12- 12- 12- 12- Impairment charges 16- 18- - 131- 273- - - - - - - - - - Financial Income 6 4 5 6 6 6 6 6 6 6 6 6 6 6 Fair value on contingent purchase consideration - - 4- 27 16 - - - - - - - - - Other expectational items 13- - - - - - - - - - - - - -
Non-core result before taxes 25- 11- - 101- 263- 6- 6- 6- 6- 6- 6- 6- 6- 6- Non-core tax shield 5 2 - 19 45 1 1 1 1 1 1 1 1 1 Other comprehensive income 188 137- 34 37- 59 - - - - - - - - -
Non-core result after taxes 168 146- 34 119- 159- 5- 5- 5- 5- 5- 5- 5- 5- 5-
Financial Interest expense on bonds and syndicated facility 71- 58- 61- 78- 40- 24- 21- 28- 27- 29- 30- 29- 30- 33- Interest expense on lease liabilities 20- 39- 39- 41- 13- 11- 13- 13- 13- 13- 14- 14- 14- 14- Other positions 5 2 1- 2- 11- - - - - - - - - -
Financial result before taxes 86- 95- 101- 121- 64- 36- 34- 40- 41- 42- 43- 43- 44- 47- Financial Tax Shield 17 18 19 23 11 6 6 7 7 7 7 7 8 8
Financial result after taxes 69- 77- 82- 98- 53- 29- 28- 34- 34- 35- 36- 35- 37- 39-
Total comprehensive income 647 398 384 349 143 279 453 608 690 785 833 878 924 975
InterContinental Hotel Group: Income Statement reformulated
MASTER IN FINANCE
THIS REPORT WAS PREPARED EXCLUSIVELY FOR ACADEMIC PURPOSES FRANCISCA FERNANDE & PAULINA MICHEL, MASTER IN
FINANCE STUDENTS OF THE NOVA SCHOOL OF BUSINESS AND ECONOMICS. THE REPORT WAS SUPERVISED BY A NOVA SBE FACULTY MEMBER, ACTING IN A MERE ACADEMIC CAPACITY, WHO REVIEWED THE VALUATION METHODOLOGY AND THE FINANCIAL MODEL.
(PLEASE REFER TO THE DISCLOSURES AND DISCLAIMERS AT END OF THE DOCUMENT) Page 34/38
▪ Balance Sheet
in $m 2016A 2017A 2018A 2019A 2020FC 2021FC 2022FC 2023FC 2024FC 2025FC 2026FC 2027FC 2028FC 2029FCCore Business
Goodwill and other intangibles 858 967 1,143 1,376 1,101 1,074 1,163 1,250 1,315 1,379 1,435 1,487 1,545 1,607 PPE as stated 419 250 273 309 567 569 541 512 457 429 429 429 429 429 Right of use assets - 486 513 490 505 511 520 529 539 548 558 567 576 586
Total PPE 419 736 786 799 378 437 571 701 777 850 911 962 1019 1080as % of sales 10.71% 18.06% 18.12% 17.27% 17.27% 17.27% 17.27% 17.27% 17.27% 17.27% 17.27% 17.27% 17.27% 17.27%
Contract costs 45 51 55 67 33 41 55 67 76 85 90 95 101 107 as % of sales from fee business 3.4% 3.7% 3.7% 4.4% 4.4% 4.4% 4.4% 4.4% 4.4% 4.4% 4.4% 4.4% 4.4% 4.4%
Contract assets 185 241 270 311 284 164 215 267 301 334 357 377 399 424 as % of sales from fee business 13.9% 17.5% 18.2% 20.6% 29.3% 17.5% 17.5% 17.5% 17.5% 17.5% 17.5% 17.5% 17.5% 17.5%
Trade and other receivable 8 - - - - - - - - - - - - - Total non-current assets 1,515 1,995 2,254 2,553 1,797 1,716 2,003 2,284 2,470 2,647 2,794 2,922 3,065 3,218
Inventories 3 3 5 6 4 3 4 5 5 6 6 6 7 7 as % of revenue 0.08% 0.07% 0.12% 0.13% 0.17% 0.11% 0.11% 0.11% 0.11% 0.11% 0.11% 0.11% 0.11% 0.11%
Trade and other receivable 469 549 610 666 384 361 471 578 642 702 752 795 842 892 Days trade outstanding 44 48 51 52 63 52 52 52 52 52 52 52 52 52
Cash and cash equivalents 78 83 87 93 19 51 66 81 90 99 106 112 118 126 % of total operating revenue 2% 2% 2% 2% 2% 2% 2% 2% 2% 2% 2% 2% 2% 2%
Contract costs 8 7 5 5 4 5 7 8 9 10 11 11 12 13 as % of non-current contract costs 17.8% 13.7% 9.1% 7.5% 12.1% 12.0% 12.0% 12.0% 12.0% 12.0% 12.0% 12.0% 12.0% 12.0%
Contract assets 13 17 20 23 21 12 16 19 22 24 26 27 29 31 as % of non-current contract assets 7.0% 7.1% 7.4% 7.4% 7.2% 7.2% 7.2% 7.2% 7.2% 7.2% 7.2% 7.2% 7.2% 7.2%
Total current assets 571 659 727 793 431 432 563 692 768 840 900 952 1,008 1,068 Total operating assets 2,086 2,654 2,981 3,346 2,228 2,148 2,567 2,976 3,237 3,488 3,694 3,873 4,072 4,287
Trade and other payables 526 595 616 568 239 331 415 501 553 593 642 683 727 773Days payable outstanding 215 239 204 176 209 209 209 209 209 209 209 209 209 209
Deferred Revenue 462 490 572 555 341 394 515 632 701 766 821 868 919 974as % of revenue 11.8% 12.0% 13.2% 12.0% 15.6% 15.6% 15.6% 15.6% 15.6% 15.6% 15.6% 15.6% 15.6% 15.6%
Total current operating liabilities 988 1085 1188 1123 580 725 929 1133 1254 1359 1463 1551 1646 1748Trade and other payables 29 7 125 116 71 92 100 107 113 119 123 128 133 138
as % of goodwill 3.4% 0.7% 10.9% 8.4% 6.4% 8.6% 8.6% 8.6% 8.6% 8.6% 8.6% 8.6% 8.6% 8.6%Deferred Revenue 852 867 934 1,009 1,234 886 721 876 957 1,047 1,102 1,143 1,192 1,245
as % of revenue 21.8% 21.3% 21.5% 21.8% 56.3% 35.0% 28.5% 21.6% 21.3% 21.3% 20.9% 20.5% 20.2% 19.9%Non-current tax payable - 25 - - - - - - - - - - - -
Total non-current liabilities 881 899 1,059 1,125 1,305 979 821 984 1,070 1,166 1,226 1,271 1,325 1,383 Total operating liabilities 1,869 1,984 2,247 2,248 1,885 1,704 1,750 2,117 2,324 2,525 2,689 2,822 2,971 3,131
Non-Core BusinessInvestments in JVs 111 141 104 110 110 110 110 110 110 110 130 150 170 190 Retirement benefit assets - 3 - - - - - - - - - - - - Other financial assets 248 228 260 284 200 168 219 269 299 327 350 370 392 416
as % of revenue 6.3% 5.6% 6.0% 6.1% 9.1% 6.6% 6.6% 6.6% 6.6% 6.6% 6.6% 6.6% 6.6% 6.6%Derivative financial instruments - - 7 - - - - - - - - - - - Non-current tax receivable 23 16 31 28 23 26 28 28 28 28 28 28 28 28 Deferred tax assets 69 78 63 66 74 69 69 69 69 69 69 69 69 69 Deferred compensation plan assets - - - - 129 177 221 263 285 305 316 321 326 331
Compensation plan per employee 8,097 8,097 8,097 8,097 8,097 8,097 8,097 8,097 8,097 8,097 Total non-current assets 451 466 465 488 537 550 648 739 791 839 893 938 985 1,034
Current tax receivable 77 101 27 16 - - - - - - - - - - Other financial assets 20 16 1 4 - - - - - - - - - - Derivative financial instruments - - 1 1 - - - - - - - - - - Cash and cash equivalents 128 85 617 102 530 382 233 233 233 233 233 233 233 233
Total current assets 225 202 646 123 530 382 233 233 233 233 233 233 233 233 Assets classified as held for sale - - - 19 - - - - - - - - - -
Total non-operating assets 676 668 1,111 630 1,067 932 881 972 1,024 1,072 1,126 1,171 1,218 1,266
Provisions 3 3 10 40 27 27 27 27 27 27 27 27 27 27 Derivative financial instruments 3 - - - - - - - - - - - - - Current tax payable 50 64 50 50 37 53.5 53.5 53.5 53.5 53.5 53.5 53.5 53.5 53.5
Total current liabilities 56 67 60 90 64 81 81 81 81 81 81 81 81 81 Derivative financial instruments - - - 20 - - - - - - - - - - Retirement benefit obligations 96 104 91 96 47 65 81 96 104 112 116 118 120 121
per employee 2,822 2,989 2,576 2,620 2,969 2,969 2,969 2,969 2,969 2,969 2,969 2,969 2,969 2,969 Provisions 5 5 17 22 33 33 33 33 33 33 33 33 33 33 Deferred compensation plan liabilities - - - - 129 177 221 263 285 305 316 321 326 331 Deferred tax liabilities 170 95 124 118 74 - - - - - - - - -
Total non-current liabilities 271 204 232 256 284 276 335 392 422 450 465 472 479 485 Liabilities classified as held for sale - - - 22 - - - - - - - - - -
Total non-operating liabilities 327 271 292 368 348 356 416 472 503 531 545 552 559 566
Financing ActivitiesLoans and other borrowings 106 110 104 87 790 200 200 87 87 80 82 83 85 87
as % of long-term loans and borrowings 6.60% 6.56% 5.45% 4.19% 79.98% 42.08% 4.19% 4.19% 4.19% 4.19% 4.19% 4.19% 4.19% 4.19%Lease liabilities - 44 55 65 64 59 60 61 62 63 64 66 67 68
as % of long-term lease liabilities 7.47% 8.94% 10.92% 12.70% 10.01% 10.01% 10.01% 10.01% 10.01% 10.01% 10.01% 10.01% 10.01%Total current financing liabilities 106 154 159 152 854 259 260 148 149 144 146 149 152 154
Loans and other borrowings 1,606 1,678 1,910 2,078 988 1,275 1,441 1,550 1,609 1,674 1,621 1,696 1,826 1,918 Lease liabilities - 589 615 595 504 590 601 612 622 633 644 655 665 676
Lease liabilities per hotel - 0 0 0 0 0 0 0 0 0 0 0 0 0 Total non-current financing liabilities 1,606 2,267 2,525 2,673 1,492 1,866 2,042 2,161 2,231 2,307 2,264 2,351 2,491 2,594 Total financing liabilities 1,712 2,421 2,684 2,825 2,346 2,125 2,302 2,310 2,381 2,451 2,411 2,500 2,643 2,748
EquityShareholder Equity 1,154- 1,361- 1,139- 1,473- 1,291- 1,113- 1,028- 959- 955- 955- 833- 837- 891- 901- Non-controlling interest 8 7 8 8 8 8 8 8 8 8 8 8 8 8
Total Equity 1,146.00- 1,354- 1,131- 1,465- 1,283- 1,105- 1,020- 951- 947- 947- 825- 829- 883- 893-
InterContinental Hotel Group: Balance Sheet reformulated
MASTER IN FINANCE
THIS REPORT WAS PREPARED EXCLUSIVELY FOR ACADEMIC PURPOSES FRANCISCA FERNANDE & PAULINA MICHEL, MASTER IN
FINANCE STUDENTS OF THE NOVA SCHOOL OF BUSINESS AND ECONOMICS. THE REPORT WAS SUPERVISED BY A NOVA SBE FACULTY MEMBER, ACTING IN A MERE ACADEMIC CAPACITY, WHO REVIEWED THE VALUATION METHODOLOGY AND THE FINANCIAL MODEL.
(PLEASE REFER TO THE DISCLOSURES AND DISCLAIMERS AT END OF THE DOCUMENT) Page 35/38
▪ Statement of Cash Flows
in $m 2016A 2017A 2018A 2019A 2020FC 2021FC 2022FC 2023FC 2024FC 2025FC 2026FC 2027FC 2028FC 2029FCEBIT 743 759 583 764 468 413 640 852 960 1087 1152 1210 1273 1342Notional Taxes -149 -144 -111 -145 -80 -70 -109 -145 -163 -185 -196 -206 -216 -228Adjusted Taxes -47 6 -40 -53 -33 -29 -45 -60 -68 -77 -82 -86 -90 -95
NOPLAT 548 621 432 566 355 314 486 646 728 825 874 918 966 1019Depreciation and Amortization 75 112 115 116 102 98 101 105 105 107 111 114 117 121
Gross Cash Flow from Operations 623 733 547 682 457 411 587 751 834 932 985 1032 1083 1140
Net Capex -494 -429 -165 -129 319 -157 -234 -235 -182 -180 -172 -165 -174 -182Inventories 3 0 2 1 -2 -1 1 1 1 0 0 0 0 0Trade receivables 469 80 61 56 -282 -23 110 107 63 60 50 43 47 51Cash and cash equivalents 78 5 4 6 -74 32 15 15 9 8 7 6 7 7Trade and other payables 526 69 21 -48 -329 92 84 87 52 40 49 41 44 47
Change in Net Working Capital 24- 16- 46- 111- 29 84 43- 36- 21- 29- 9- 8- 10- 11- Change in all other operating assets 1,117- 166- 210- 289- 339 147 159- 156- 113- 108- 88- 78- 89- 95- Change in all other operating liabilities 1,343 46 242 49 34- 273- 38- 280 156 161 115 91 106 113
Operating FCF 330 168 368 202 1110 213 113 604 674 776 832 872 916 965
Non Operating ActivitiesNon operating income -25 -11 0 -101 -263 -6 -6 -6 -6 -6 -6 -6 -6 -6Taxes 5 2.09 0 19 45 1 1 1 1 1 1 1 1 1
Items that may be reclassified to profit or loss 188 -122 40 -41 101 0 0 0 0 0 0 0 0 0Items that will not be reclassified to profit / loss 0 -15 -6 4 -42 0 0 0 0 0 0 0 0 0
Other comprehensive income 188 -137 34 -37 59 0 0 0 0 0 0 0 0 0Change in all non operating assets 548- 35- 89 -34 -9 -14 -97 -91 -52 -49 -54 -45 -47 -49Change in all non operating liabilities 327 56- 21 76 -20 8 60 56 30 28 14 7 7 7
Non-Operating FCF -53 -237 144 -77 -188 -10 -42 -40 -26 -25 -45 -43 -45 -47
Unlevered FCF 277 -69 512 125 922 203 70 565 648 750 787 829 872 918Tax Shield 17 18 19 23 11 6 6 7 7 7 7 7 8 8
Levered FCF 295 -51 531 148 933 209 76 571 655 757 794 836 879 926
Financing ActivitiesInterest Expense, Net -86 -95 -101 -121 -64 -36 -34 -40 -41 -42 -43 -43 -44 -47Change in Financial Debt 1584 751.76 -269.16 656 -907 -73 326 8 71 70 -40 89 143 106Change in Shareholders Funds 1,793- 606.00 - -161 -683 39 -101 -368 -539 -685 -786 -711 -883 -978 -984
Financing Free Cash Flow -277 69 -512 -125 -922 -203 -70 -565 -648 -750 -787 -829 -872 -918
InterContinental Hotel Group: Cash Flow Map
MASTER IN FINANCE
THIS REPORT WAS PREPARED EXCLUSIVELY FOR ACADEMIC PURPOSES FRANCISCA FERNANDE & PAULINA MICHEL, MASTER IN
FINANCE STUDENTS OF THE NOVA SCHOOL OF BUSINESS AND ECONOMICS. THE REPORT WAS SUPERVISED BY A NOVA SBE FACULTY MEMBER, ACTING IN A MERE ACADEMIC CAPACITY, WHO REVIEWED THE VALUATION METHODOLOGY AND THE FINANCIAL MODEL.
(PLEASE REFER TO THE DISCLOSURES AND DISCLAIMERS AT END OF THE DOCUMENT) Page 36/38
Disclosures and Disclaimers
Report Recommendations
Buy Expected total return (including expected capital gains and expected dividend yield)
of more than 10% over a 12-month period.
Hold Expected total return (including expected capital gains and expected dividend yield)
between 0% and 10% over a 12-month period.
Sell Expected negative total return (including expected capital gains and expected
dividend yield) over a 12-month period.
This report was prepared by Francisca Fernandes and Paulina Michel, Master in Finance students of Nova
School of Business and Economics ("Nova SBE"), within the context of the Field Lab – Equity Research.
This report is issued and published exclusively for academic purposes, namely for academic evaluation and
master graduation purposes, within the context of said Field Lab – Equity Research. It is not to be construed
as an offer or a solicitation of an offer to buy or sell any security or financial instrument.
This report was supervised by a Nova SBE faculty member, acting merely in an academic capacity, who
revised the valuation methodology and the financial model.
Given the exclusive academic purpose of the reports produced by Nova SBE students, it is Nova SBE
understanding that Nova SBE, the authors, the present report and its publishing, are excluded from the
persons and activities requiring previous registration from local regulatory authorities. As such, Nova SBE, its
faculty and the authors of this report have not sought or obtained registration with or certification as financial
analyst by any local regulator, in any jurisdiction. In Portugal, neither the authors of this report nor their
academic supervisor is registered with or qualified under COMISSÃO DO MERCADO DE VALORES MOBILIÁRIOS
("CMVM", the Portuguese Securities Market Authority) as a financial analyst. No approval for publication or
distribution of this report was required and/or obtained from any local authority, given the exclusive academic
nature of the report.
The additional disclaimers also apply:
USA: Pursuant to Section 202 (a) (11) of the Investment Advisers Act of 1940, neither Nova SBE nor the
authors of this report are to be qualified as an investment adviser and, thus, registration with the Securities
and Exchange Commission ("SEC", United States of America's securities market authority) is not necessary.
Neither the authors nor Nova SBE receive any compensation of any kind for the preparation of the reports.
INTERCONTINENTAL HOTELS GROUP PLC COMPANY REPORT
PAGE 37/38
Germany: Pursuant to §34c of the WpHG (Wertpapierhandelsgesetz, i.e., the German Securities Trading
Act), this entity is not required to register with or otherwise notify the Bundesanstalt für
Finanzdienstleistungsaufsicht ("BaFin", the German Federal Financial Supervisory Authority). It should be
noted that Nova SBE is a fully-owned state university and there is no relation between the student's equity
reports and any fund raising programme.
UK: Pursuant to section 22 of the Financial Services and Markets Act 2000 (the "FSMA"), for an activity to be
a regulated activity, it must be carried on "by way of business". All regulated activities are subject to prior
authorisation by the Financial Conduct Authority ("FCA"). However, this report serves an exclusively
academic purpose and, as such, was not prepared by way of business. The authors - Master's students – are
the sole and exclusive responsible for the information, estimates and forecasts contained herein, and for
the opinions expressed, which exclusively reflect his/her own judgment at the date of the report. Nova SBE
and its faculty have no single and formal position in relation to the most appropriate valuation method,
estimates or projections used in the report and may not be held liable by the author's choice of the latter.
The information contained in this report was compiled by students from public sources believed to be reliable,
but Nova SBE, its faculty, or the students make no representation that it is accurate or complete, and accept
no liability whatsoever for any direct or indirect loss resulting from the use of this report or of its content.
Students are free to choose the target companies of the reports. Therefore, Nova SBE may start covering
and/or suspend the coverage of any listed company, at any time, without prior notice. The students or Nova
SBE are not responsible for updating this report, and the opinions and recommendations expressed herein
may change without further notice.
The target company or security of this report may be simultaneously covered by more than one student.
Because each student is free to choose the valuation method, and make his/her own assumptions and
estimates, the resulting projections, price target and recommendations may differ widely, even when referring
to the same security. Moreover, changing market conditions and/or changing subjective opinions may lead to
significantly different valuation results. Other students' opinions, estimates and recommendations, as well as
the advisor and other faculty members' opinions may be inconsistent with the views expressed in this report.
Any recipient of this report should understand that statements regarding future prospects and performance
are, by nature, subjective, and may be fallible.
This report does not necessarily mention and/or analyse all possible risks arising from the investment in the
target company and/or security, namely the possible exchange rate risk resulting from the security being
denominated in a currency either than the investor's currency, among many other risks.
The purpose of publishing this report is merely academic and it is not intended for distribution among private
investors. The information and opinions expressed in this report are not intended to be available to any
person other than Portuguese natural or legal persons or persons domiciled in Portugal. While preparing this
report, students did not have in consideration the specific investment objectives, financial situation or
INTERCONTINENTAL HOTELS GROUP PLC COMPANY REPORT
PAGE 38/38
particular needs of any specific person. Investors should seek financial advice regarding the appropriateness
of investing in any security, namely in the security covered by this report.
The authors hereby certify that the views expressed in this report accurately reflect his/her personal opinion
about the target company and its securities. He/ She has not received or been promised any direct or indirect
compensation for expressing the opinions or recommendation included in this report.
The content of each report has been shown or made public to restricted parties prior to its publication in Nova
SBE's website or in Bloomberg Professional, for academic purposes such as its distribution among faculty
members for students' academic evaluation.
Nova SBE is a state-owned university, mainly financed by state subsidies, students tuition fees and
companies, through donations, or indirectly by hiring educational programs, among other possibilities. Thus,
Nova SBE may have received compensation from the target company during the last 12 months, related to its
fundraising programs, or indirectly through the sale of educational, consulting or research services.
Nevertheless, no compensation eventually received by Nova SBE is in any way related to or dependent on
the opinions expressed in this report. The Nova School of Business and Economics does not deal for or
otherwise offer any investment or intermediation services to market counterparties, private or intermediate
customers.
This report may not be reproduced, distributed or published, in whole or in part, without the explicit previous
consent of its authors, unless when used by Nova SBE for academic purposes only. At any time, Nova SBE
may decide to suspend this report reproduction or distribution without further notice. Neither this document
nor any copy of it may be taken, transmitted or distributed, directly or indirectly, in any country either than
Portugal or to any resident outside this country. The dissemination of this document other than in Portugal or
to Portuguese citizens is therefore prohibited and unlawful.