Page 1
www.icm
rr.or
g
Volume 1, Issue 1 (March, 2013)
INTERCONTINENTAL JOURNAL OF FINANCE RESEARCH REVIEW
SR. NO. PARTICULARS PAGE NO.
1.
A STUDY ON MEASURING THE EXTENT OF FACTORS
INFLUENCING THE URBAN CO-OPERATIVE BANKS
PROFITABILITY
DR.R.UMAMAHESWARI
1-10
2.
PORTFOLIO CONSTRUCTION ON DIFFERENT INVESTMENT
PROPOSALS AND THEIR RETURNS
S. ALAGUSAMY Dr.R.SUBRAMANIAN
10-27
3.
A STUDY ON A COMPARATIVE STUDY OF SECTOR FUNDS
WITH SPECIAL REFERENCE TO SHAREKHAN LIMITED,
CHENNAI
P. ARUNSHANKAR B. PRABHU
28-46
4.
A COMPARATIVE STUDY ON WORKING CAPITAL
MANAGEMENT OF PAINT COMPANIES WITH SPECIAL
REFERENCE TO BERGER PAINTS INDIA LIMITED AND KANSAI
NEROLAC PAINTS LIMITED – HOSUR
S. GOKULAKRISHNAN
47-69
5. A STUDY ON ROLE OF FUNDAMENTAL AND TECHNICAL
ANALYSIS IN EQUITY RESEARCH.
V.MANGAYARKARASI
70-87
6.
A STUDY ON COMPARATIVE ANALYSIS ON GOLD VERSUS
CRUDE OIL AT HARVEST FUTURES CONSULTANT INDIA (P)
LIMITED CHENNAI
A.MOHANA
88-109
7.
A STUDY ON FLUCTUATIONS IN INDIAN STOCK MARKET
JEGADEESAN.M
110- 125
Pee
r R
evie
wed
Jo
urn
al o
f In
ter-
Co
nti
nen
tal M
anag
emen
t R
esea
rch
Co
nso
rtiu
m
htt
p:/
/ww
w.ic
mrr
.org
A Peer Reviewed International Journal
IJFRR
INTERCONTINENTAL JOURNAL OF FINANCE RESEARCH REVIEW
ISSN 2321-0354
Page 2
www.icm
rr.or
g
1
Volume 1, Issue 1 (March, 2013)
INTERCONTINENTAL JOURNAL OF FINANCE RESEARCH REVIEW
Pee
r R
evie
wed
Jo
urn
al o
f In
ter-
Co
nti
nen
tal M
anag
emen
t R
esea
rch
Co
nso
rtiu
m
htt
p:/
/ww
w.ic
mrr
.org
A STUDY ON MEASURING THE EXTENT OF FACTORS INFLUENCING THE
URBAN CO-OPERATIVE BANKS PROFITABILITY
WITH SPECIAL REFERENCE TO COIMBATORE DIST, TAMILNADU, INDIA
Dr.R.UMAMAHESWARI
Assistant Professor
PG Department of Management Science
Sree Saraswathi Thyagaraja College, Pollachi
Coimbatore (Dist), Tamilnadu, India
ABSTRACT
Banking system occupies an important place in a nation‘s economy. A banking institution is indispensable
in a modern society. The Co-operatives play an important role in the Indian financial system, especially at the rural
level. The origins of the Urban Cooperative Banking (UCBs) movement in India can be traced to the close of
nineteenth century when, inspired by the success of the experiments related to the co-operative movement in Britain
and cooperative credit movement in Germany such societies were set up in India. Cooperative societies are based on
the principles of cooperation, - mutual help, democratic decision making and open membership. This paper looked
into the various factors influencing the profitability of the UCBs and also the correlation between the factors to
determine the profitability.
Keywords: UCBs, correlation analysis, profitability
1.1. INTRODUCTION
Banking system occupies an important place in a nation‘s economy. A banking institution is indispensable
in a modern society. It plays a pivotal role in the economic development of a country and forms the core of the
money market in an advanced country. Agriculture forms the backbone of the Indian economy. Despite converted
industrialization in over last two decades, agriculture occupies a place of pride. Being the largest industry in the
country, agriculture is the source of livelihood for over seventy percent of population in the country. The financial
requirements of Indian farmers are met through loans borrowed from money lenders and co-operative credit
societies.The Co-operatives play an important role in the Indian financial system, especially at the rural level. Co-
operatives as a great instrument to help poor and the weakest in improving their economic conditions through self-
reliance and mutual aid. In Indian economy, co-operative banks or credit societies have developed over the period
with the specific objective of financing agricultural and other economic units in the unorganized sectors.
A Peer Reviewed International Journal
IJFRR
INTERCONTINENTAL JOURNAL OF FINANCE RESEARCH REVIEW
ISSN 2321-0354
Page 3
www.icm
rr.or
g
2
Volume 1, Issue 1 (March, 2013)
INTERCONTINENTAL JOURNAL OF FINANCE RESEARCH REVIEW
Pee
r R
evie
wed
Jo
urn
al o
f In
ter-
Co
nti
nen
tal M
anag
emen
t R
esea
rch
Co
nso
rtiu
m
htt
p:/
/ww
w.ic
mrr
.org
The origins of the urban cooperative banking movement in India can be traced to the close of nineteenth
century when, inspired by the success of the experiments related to the co-operative movement in Britain and
cooperative credit movement in Germany such societies were set up in India. Cooperative societies are based on the
principles of cooperation, - mutual help, democratic decision making and open membership. Cooperatives
represented a new and alternative approach to organization as against proprietary firms, partnership firms and joint
stock companies which represent the dominant form of commercial organization.
1.2. REVIEW OF LITERATURE
1. Amit Basak (2009)1 Urban Cooperative Banks (UCBs) figure among the vital segments of the banking
industry of the country. They essentially cater to the credit needs of persons of small means. Though some
UCBs have performed creditably in the recent years, a large number of them have shown discernible signs
of weakness. The operational efficiency is unsatisfactory and characterized by low profitability, ever-
growing Non-Performing Assets (NPAs) and relatively low capital base. The large-scale sickness in the
UCBs has shaken the public confidence in cooperative banks. In this context, this paper makes an attempt
to examine the working and financial performance of the UCBs. To make the analysis simpler and
presentable, the author takes up the Contai Co-operative Bank Ltd., one of the leading UCBs in West
Bengal for a case study. The objective of the study is to identify and analyze the trend, progress and
problems of this bank, to throw light on the problems of swelling NPAs and to offer some meaningful
suggestions for improving the efficiency and effectiveness of this bank. The study is based on secondary
data and other information provided by the bank in its published annual reports. The relevant data have
been collected for the period from 1995-96 to 2006-07. This data have been analyzed with the help of
statistical tools like ratios, percentages, averages and trend analysis, chi-square test, and multiple regression
analysis.
2. Sampath P. Sing and Varsha S. Vrade (1974)2 of National Institute of Bank Management (NIBM) have
made a number of studies on the profitability of nationalized banks covering different aspects of
measurement of cost of funds to a bank; monitoring branch profitability; profit management; profit
management in banks; ranking of banks according to their performance in terms of deposits; branch
network and credit deposit ratio.
3. Bhatia (1978)3 in his thesis on ―Banking structure and performance‖ attempts to describe and analyse the
economic performance of the Indian Banking System as it is reflected in output, price and profitability
performance during the period 1950-68. The study suggest that the Banking Regulations in India should
not emphasize direct regulation of the rate of return as much as the regulation if the asset portfolio of banks
in order to improve the output performance of the Indian Banking System
4. Bhairav H. Desai and Mayar Raj J. Farmar (2000)4 in their article on ―concept of break even analysis and
banks profitability – a case study‖, attempted to determine the factors affecting the profitability as well as
the margin of safety of commercial banks are interest expenses and non-interest expenses.
5. Dash (2000)5, attempted to evaluate the financial performance of Nawanagar Co-operative bank by using
operational ratios, profitability ratios, productivity ratios and solvency ratios. He concluded that despite
satisfactory financial performance, there are certain grey areas which need immediate attention. Effective
steps are required to improve profitability and capital base activities.
1.3 NEED / IMPORTANCE OF THE STUDY
UCBs have always been the major vehicle for nation‘s economic development. Co-operative banks which
have been in existence for a century in India are found in both rural and urban areas. There are plenty of surpluses
1 Amit Basak , “Performance Appraisal of Urban Cooperative Banks: A Case Study”, The Icfai University Journal of Accounting
Research, Vol. 8, No. 1, pp. 31-44, January 2009. 2 Sing S.P. “Profitability of nationalized Banks”, Economic and political weekly, Vol. IX. No. 35. 3 Bhatia R.C “Banking structure and performance, A case study of Indian Banking system”, 1965-68 Ph.D. Thesis, West Viginia
University.
4 Bhairav.H.D. Desai (2000)” concept of break even analysis and Banks profitability – A case study, “The Indian Journal of Commerce,
Vol. 53, No. 182. pp. 53-59.
5 Dash .D.K (2000), “Financial Performance Evaluation through Ratio analysis – A case study of Nawanagar Co-operative Bank
Jamnagar (Gujarat, Indian Co-operative Review, Vol: XXXVII, No. 3, pp.162- 170.
ISSN 2321-0354
Page 4
www.icm
rr.or
g
3
Volume 1, Issue 1 (March, 2013)
INTERCONTINENTAL JOURNAL OF FINANCE RESEARCH REVIEW
Pee
r R
evie
wed
Jo
urn
al o
f In
ter-
Co
nti
nen
tal M
anag
emen
t R
esea
rch
Co
nso
rtiu
m
htt
p:/
/ww
w.ic
mrr
.org
resource with the urban and semi urban people, and their channelization towards economic growth is the main task
of the banks. No wonder that management of funds has emerged as an area of vital importance for banks. Notable
development has also taken place in the diversification of bank lending work, certain sectors like agriculture, small
and tiny industrial units, small transport operators; retail traders etc. which were neglected by the commercial banks
are now receiving credit from UCBS. But several factors have contributed to the poor performance of the UCBs in
India. The UCBs are facing increasing competition and therefore reduced market power; they have not modernized
their operation which leads to poor financial management and risk assessment techniques. Owing to certain structure
weakness, failure to mobilize sufficient deposits, the amounting overdue and lack of trained staff, the co-operatives
had failed to come up to expectations. In recent years, the profitability performance of UCBs in India has become a
novel topic for discussion.
1.4. STATEMENT OF THE PROBLEM
There is ample evidence to show the declining profitability of the banking industry. With the change in the
social and economic objectives of co-operative banks, particularly of the UCBs in India, it becomes extremely
essential to assess their profitability performance. However, in most of the studies covering the recent period,
‗profit‘ has been used as one of the many indicators of their performance appraisal. This dilutes the importance of
profits to a large extent. Despite the change in thrust, banks remain commercial organizations and profit factor
cannot be ignored without endangering viability of banks and continuity of their operations. In fact, the approach of
policy-makers towards profitability too has changed, with the result that low profits have become a fact of life.
Therefore, it is high time to concentrate efforts on analyzing the profits and profitability position of Urban Co-
operative Banks, so that the confidence of the public in the soundness of the banking system remains unimpaired
and the social objectives of banks do not necessarily dilute. The Urban Co-operative Bank suffers from political as
well as governmental interference and official bureaucracy in respect of resource mobilization and recovery of
loans. This has adversely affected their profitability and viability. The optimum utilization of financial resource
refers to maximization of financial return and minimization of cost and this shall be the major essence of financial
management and better utilization of funds in UCBs. The financial analysis of UCBs needs to be studied with their
impact and their effect on solvency and profitability. In this context it is felt that an in–depth analysis of ―FINANCIAL
MANAGEMENT OF URBAN CO-OPERATIVE BANKS‖ will highlight the need for the study. Hence, an attempt is
made to study the ―FINANCIAL MANAGEMENT OF URBAN CO-OPERATIVE BANKS IN
COIMBATORE DISTRICT”.
1.5. OBJECTIVES OF THE STUDY
1. To assess the factors responsible for profitability.
2. To analyze the correlation between factors of profitability.
3. To assess the performance of selected UCBs by analyzing the possible impact of various sources and uses of
funds on profitability and solvency of the banks
4. To offer suitable suggestions for the efficient and effective utilization of funds.
1.6. HYPOTHESES OF THE STUDY
1. The increase in credit has an indirect and positive effect on the profitability of banks.
2. The incremental flow of Deposits has positive relation to the bank‘s profitability.
1.7. RESEARCH METHODOLOGY
For the study, Coimbatore District in Tamil Nadu was selected purposely. All the five banks in Coimbatore
district namely Coimbatore UCB, Udumalpet UCB, Pollachi UCB, Tirupur UCB, and Mettupalayam UCB have
been included for the study. The study is based on both primary as well as secondary data. The main sources of
secondary data with regard to various aspects of UCBs are annual report and office records. Data have also been
compiled from various journals and magazines relating to the study. The primary data were also collected from
officials of the banks with the help of an interview schedule. To elicit the opinion of customers about bank services,
a separate interview schedule was administered.
ISSN 2321-0354
Page 5
www.icm
rr.or
g
4
Volume 1, Issue 1 (March, 2013)
INTERCONTINENTAL JOURNAL OF FINANCE RESEARCH REVIEW
Pee
r R
evie
wed
Jo
urn
al o
f In
ter-
Co
nti
nen
tal M
anag
emen
t R
esea
rch
Co
nso
rtiu
m
htt
p:/
/ww
w.ic
mrr
.org
All the selected banks were in the Coimbatore district when the study was commenced. In October 2008,
Tirupur and some of the nearby areas of Tirupur were separated from Coimbatore district and were included in the
newly constituted Tirupur district. So Udumalpet UCB and Tirupur UCB previously included in the Coimbatore district
are now in the newly constituted Tirupur District. As the study period (1997-98 to 2008-09) end in 2008-09, the researcher
decided to show all the selected banks to be a part of the Coimbatore district. This will in no way affect any of the
technical aspects of the research.
PERIOD OF THE STUDY
The study covered a period of twelve financial years from 1997-98 to 2008-09. The financial year starts
from 1st day of April of a year and ends on 31
st day of March of next year.
DATA COLLECTION
SECONDARY DATA
The information collected for the study is purely based on secondary in nature. The data for the study have
been collected from the Urban Co-operative Banks in Coimbatore District for the financial period from 1997-98 to
2008-2009. The required information are collected from the volumes of published reports by the Statistical
Department of RBI at Mumbai, RBI Bulletins, Reports on Trend and Progress of Banking in India, Report on
Currency and Finance, books relating to urban co-operative banks, journals, magazines, and unpublished reports.
1.8. FRAMEWORK OF ANALYSIS
The following is the framework of analysis applied by the researcher to identify solutions to the objectives
of the study.
MEASURING THE EXTENT OF FACTORS INFLUENCING THE BANK PROFITABILITY
To identify the prominent factors responsible for the profitability of UCB and to measure the extent of
influence of the independent variables on the dependent variable the following tools was applied by the researcher.
a) Correlation Analysis
1.9. LIMITATIONS OF THE STUDY
The study covers only the period between 1997-98 to 2008-09. It does not consider the changes, if any, before
or after the period.
The calculations have been made on the basis of the figures provided in the published financial statements.
Hence the study is subjected to inherent limitations of accounting and accounting practices.
The financial position of a bank is affected by several factors like economical, social, political, etc., but only
financial factors is considered here.
The financial performance are not compared with a similar firm in the same industry
MEASURING THE EXTENT OF FACTORS INFLUENCING THE BANK PROFITABILITY
CORRELATION ANALYSIS
Correlation co-efficient among the different variables has been worked out so as to arrive at a correlation
matrix, which incorporates correlation co-efficient of all the selected variables with the dependent variable, as well
as correlation coefficients among different independent variables. The calculated correlation co-efficient values
were compared with a critical value of simple correlation co-efficient available in the statistical tables (Fisher
and Yates) for its significance.
The correlation coefficient matrices of the selected variables with the dependent variable, i.e., return on total assets
of selected co-operative banks for the periods from 1997-98 to 2008-2009 presented below.
ISSN 2321-0354
Page 6
www.icm
rr.or
g
5
Volume 1, Issue 1 (March, 2013)
INTERCONTINENTAL JOURNAL OF FINANCE RESEARCH REVIEW
Pee
r R
evie
wed
Jo
urn
al o
f In
ter-
Co
nti
nen
tal M
anag
emen
t R
esea
rch
Co
nso
rtiu
m
htt
p:/
/ww
w.ic
mrr
.org
TABLE 1
CORRELATION ANALYSIS BETWEEN SELECTED VARIABLES WITH RETURN ON TOTAL
ASSETS
Varia
bles
No.
Ratios
COIMBATORE
UCB UDUMALPET UCB
R p-value r p-value
X1 Advances to Assets .244 .222 0.517 .043**
X2 Debt - Equity Ratio -.091 .389 -0.258 0.209
X3 Investments to Total Assets -.511 .045** -0.231 0.235
X4 Other Assets to Total Assets -.129 .345 0.319 0.156
X5 Credit Deposit Ratio -.024 .471 0.484 0.055
X6 Investments Deposit Ratio -.481 .056 -0.186 0.281
X7 Credit + Investments Deposit Ratio -.349 .133 0.074 0.41
X8 Fixed Assets to Total Assets .301 .171 -0.287 0.183
X9 Fixed Assets to Net worth .450 .071 -0.21 0.256
X10 Return on Advances .973 .000* 0.974 .000**
X11 Interest Income to Total Assets .604 .019** 0.404 0.096
X12 Other Liabilities to Total Assets -.129 .345 0.319 0.156
X13 Net worth to Capital employed -.349 .133 0.082 0.399
X14 Return on Net worth .832 .000* 0.518 .042**
X15 Wage Bill to Total Income -.227 .239 -0.21 0.257
X16 Operating Expenses to Total Income -.137 .336 -0.042 0.448
X17 Interest Expended to Total Expenses .205 .261 -0.034 0.458
X18 Interest expended to interest earned .306 .167 -0.519 .042**
X19 Equity paid up to Capital Employed -.468 .063 0.072 0.412
X20 Spread to Working Fund .230 .236 0.518 .042**
X21 Burden to Working Fund -.378 .113 0.119 0.356
X22 Operating profit to Total Assets .046 .444 0.104 0.374
X23 Interest Income to Total Income .093 .387 0.555 .031**
X24 Non-Interest Income to Working Fund .026 .468 -0.223 0.243
X25 Non Operating Expenses to Total Assets .378 .113 -0.024 0.47
X26 Equity paid up to Net worth .316 .158 0.031 0.462
X27 Return on capital employed .062 .424 0.133 0.34
X28 Deposits to Total Assets .246 .221 -0.166 0.303
X29 Liquid Assets to Total Assets .429 .082 -0.024 0.47
X30 Provision & Contingencies to Total Assets -.331 .147 -0.252 0.215
X31 Cash Deposit Ratio .516 .043** -0.267 0.2
X32 Investments to Advances -.529 .038** -0.286 0.183
X33 Interest cover .340 .140 0.781 .001*
*Correlation is significant at the 0.01 level (p<0.01) **Correlation is significant at the 0.05 level (p<0.05)
ISSN 2321-0354
Page 7
www.icm
rr.or
g
6
Volume 1, Issue 1 (March, 2013)
INTERCONTINENTAL JOURNAL OF FINANCE RESEARCH REVIEW
Pee
r R
evie
wed
Jo
urn
al o
f In
ter-
Co
nti
nen
tal M
anag
emen
t R
esea
rch
Co
nso
rtiu
m
htt
p:/
/ww
w.ic
mrr
.org
TABLE 2
CORRELATION ANALYSIS BETWEEN SELECTED VARIABLES WITH RETURN ON TOTAL
ASSETS
Variables
No. Ratios
POLLACHI UCB TIRUPUR UCB
R p-value r p-value
X1 Advances to Assets 0.821 .001* 0.374 0.116
X2 Debt - Equity Ratio - - - -
X3 Investments to Total Assets -0.888 .000* 0.632 .014**
X4 Other Assets to Total Assets 0.615 .017** 0.556 .030**
X5 Credit Deposit Ratio 0.733 .003* 0.91 .000*
X6 Investments Deposit Ratio -0.872 .000* 0.76 .002*
X7 Credit + Investments Deposit Ratio -0.886 .000* 0.866 .000*
X8 Fixed Assets to Total Assets 0.092 0.388 -0.78 .001*
X9 Fixed Assets to Net worth 0.734 .003* -0.864 .000*
X10 Return on Advances 0.9 .000* 0.999 .000*
X11 Interest Income to Total Assets 0.399 0.1 -0.76 .002*
X12 Other Liabilities to Total Assets 0.615 .017** 0.556 .030**
X13 Net worth to Capital employed -0.361 0.124 0.943 .000*
X14 Return on Net worth 0.952 .000* 0.385 0.108
X15 Wage Bill to Total Income -0.605 .019** 0.621 .016*
X16 Operating Expenses to Total Income -0.651 .011** 0.152 0.318
X17 Interest Expended to Total Expenses 0.742 .003* -0.569 .027**
X18 Interest expended to interest earned 0.811 .001* -0.878 .000*
X19 Equity paid up to Capital Employed 0.862 .000* 0.657 .010*
X20 Spread to Working Fund -0.794 .001* 0.779 .001*
X21 Burden to Working Fund -0.863 .000* -0.199 0.267
X22 Operating profit to Total Assets -0.086 0.395 0.857 .000*
X23 Interest Income to Total Income -0.635 .013** -0.552 .031**
X24 Non-Interest Income to Working Fund 0.694 .006* 0.505 .047**
X25 Non Operating Expenses to Total Assets 0.667 .009* -0.855 .000*
X26 Equity paid up to Net worth 0.675 .008* -0.93 .000*
X27 Return on capital employed -0.346 0.135 0.829 .000*
X28 Deposits to Total Assets 0.863 .000* -0.852 .000*
X29 Liquid Assets to Total Assets 0.367 0.12 -0.635 .013**
X30 Provision &Contingencies to Total Assets -0.423 0.085 0.377 0.114
X31 Cash Deposit Ratio 0.355 0.129 -0.126 0.348
X32 Investments to Advances -0.843 .000* 0.627 .015**
X33 Interest cover 0.609 .018** 0.974 .000*
*Correlation is significant at the 0.01 level (p<0.01) **Correlation is significant at the 0.05 level (p<0.05)
ISSN 2321-0354
Page 8
www.icm
rr.or
g
7
Volume 1, Issue 1 (March, 2013)
INTERCONTINENTAL JOURNAL OF FINANCE RESEARCH REVIEW
Pee
r R
evie
wed
Jo
urn
al o
f In
ter-
Co
nti
nen
tal M
anag
emen
t R
esea
rch
Co
nso
rtiu
m
htt
p:/
/ww
w.ic
mrr
.org
TABLE 3
CORRELATION ANALYSIS BETWEEN SELECTED VARIABLES WITH RETURN ON TOTAL
ASSETS
Variables
No. Ratios
METTUPALAYAM UCB
r p-value
X1 Advances to Assets -0.143 0.328
X2 Debt - Equity Ratio 0.056 0.432
X3 Investments to Total Assets -0.242 0.225
X4 Other Assets to Total Assets -0.094 0.386
X5 Credit Deposit Ratio -0.38 0.111
X6 Investments Deposit Ratio -0.259 0.208
X7 Credit + Investments Deposit Ratio -0.33 0.147
X8 Fixed Assets to Total Assets 0.232 0.234
X9 Fixed Assets to Net worth 0.279 0.19
X10 Return on Advances 0.994 .000*
X11 Interest Income to Total Assets 0.518 0.042
X12 Other Liabilities to Total Assets -0.094 0.386
X13 Net worth to Capital employed -0.355 0.129
X14 Return on Net worth 0.898 .000*
X15 Wage Bill to Total Income -0.367 0.12
X16 Operating Expenses to Total Income 0.034 0.459
X17 Interest Expended to Total Expenses -0.341 0.139
X18 Interest expended to interest earned 0.031 0.462
X19 Equity paid up to Capital Employed -0.354 0.13
X20 Spread to Working Fund 0.256 0.211
X21 Burden to Working Fund 0.169 0.3
X22 Operating profit to Total Assets -0.269 0.199
X23 Interest Income to Total Income 0.239 0.228
X24 Non-Interest Income to Working Fund -0.159 0.31
X25 Non Operating Expenses to Total Assets 0.285 0.185
X26 Equity paid up to Net worth 0.259 0.209
X27 Return on capital employed -0.302 0.17
X28 Deposits to Total Assets 0.373 0.116
X29 Liquid Assets to Total Assets 0.387 0.107
X30 Provision & Contingencies to Total Assets -0.156 0.314
X31 Cash Deposit Ratio 0.329 0.148
X32 Investments to Advances -0.244 0.222
X33 Interest cover 0.903 .000*
*Correlation is significant at the 0.01 level (p<0.01) **Correlation is significant at the 0.05 level (p<0.05)
ISSN 2321-0354
Page 9
www.icm
rr.or
g
8
Volume 1, Issue 1 (March, 2013)
INTERCONTINENTAL JOURNAL OF FINANCE RESEARCH REVIEW
Pee
r R
evie
wed
Jo
urn
al o
f In
ter-
Co
nti
nen
tal M
anag
emen
t R
esea
rch
Co
nso
rtiu
m
htt
p:/
/ww
w.ic
mrr
.org
1.10.FINDINGS
In Coimbatore UCB, it can be seen by table 1 that the variables namely X10(Return on Advances), X11 (Interest Income to
Total Assets), X14 (Return on Net worth), and X31 (Cash Deposit Ratio) have significant positive correlation with bank
profitability and the coefficient are 0.973, 0.604, 0.832 and 0.516 respectively.
In Udumalpet UCB, the variables namely X1 (Advances to Assets), X10 (Return on Advances), X14 (Return on Net worth),
X20 (Spread to Working Fund), X23 (Interest Income to Total Income), and X33 (Interest cover) have significant positive
correlation with bank profitability and the coefficient are 0.517, 0.974, 0.518, 0.518, 0.555, and 0.781 respectively.
An observation of the table 2 reveals that in Pollachi UCB, the variables namely X1 (Advances to Assets), X4
(Other Assets to Total Assets), X5 (Credit Deposit Ratio), X9 (Fixed Assets to Net worth), X10 (Return on Advances), X12
(Other Liabilities to Total Assets), X14(Return on Net worth), X17 (Interest Expended to Total Expenses), X18 (Interest
expended to interest earned), X19 (Equity paid up to Capital Employed), X24 (Non-Interest Income to Working Fund), X25
(Non-Operating Expenses to Total Assets), X26 (Equity paid up to Net worth), X28 (Deposits to Total Assets), and X33
(Interest cover) have significant positive correlation with bank profitability and the coefficient are 0.821, 0.615, 0.733,
0.734, 0.900, 0.615, 0.952, 0.742, 0.811, 0.862, 0.694, 0.667, 0.675, 0.863 and 0.609 respectively.
In Tirupur UCB, the variables namely X3 (Investments to Total Assets), X4 (Other Assets to Total Assets),
X5 (Credit Deposit Ratio), X6 (Investments Deposit Ratio), X7 (Credit + Investments Deposit Ratio), X10 (Return on
Advances), X12 (Other Liabilities to Total Assets), X13 (Net worth to Capital employed), X15 (Wage Bill to Total
Income), X19 (Equity paid up to Capital Employed), X20 (Spread to Working Fund), X22 (Operating profit to Total
Assets), X24 (Non-Interest Income to Working Fund), X27 (Return on capital employed), X32 (Investments to
Advances), X33 (Interest cover), have significant positive correlation with bank profitability and the coefficient are
0.632, 0.556, 0.910, 0.760, 0.866, 0.999, 0.556, 0.943, 0.621, 0.657, 0.779, 0.857, 0.505, 0.829, 0.627, and 0.974
respectively.
It is seen from table 3 that in Mettupalayam UCB, the variables namely X10 (Return on Advances), X14(Return on
Net worth), and X33 (Interest cover) have significant positive correlation with bank profitability and the coefficient are 0.994, 0.898
and 0.903 respectively.
1.11. Testing of Hypothesis
The correlation analysis proves the Hypothesis 1 and 2. The increase in the credit position of the bank has
positive effect on the profitability of banks. From the correlation coefficient matrics of the selected variables with
the dependent variable, i.e., return on total assets of UCBs for the period1997-98 to 2008-09, it can be seen that X5 -
Credit deposit ratio (r 0.733, p-value 0.003), in Pollachi UCB, the same variable(r 0.91, p-value 0.000) and X7
Credit + investment Deposit ratio (r 0.866, p-value 0.000) in Tirupur UCB, has significant correlation with positive
effect on profitability of Banks.
The second hypothesis holds good for Urban Co-operative Bank. The proportion of X28 - Deposits to total
assets (r- 863, p-value 0.000) has showed a positive correlation for Pollachi UCB. This reveals that the incremental
flow of deposits has positive impact on the profitability of selected Urban Co-operative Banks.
1.12. SUGGESTIONS
There is imperative need for launching direct development and transformation process of the co-operative
banking system towards self – sufficient and self- reliance mode.
All UCBs must adopt efficient and effective entrepreneurship skills and knowledge.
Freedom must be given to the co-operative banking system to choose their auditors, fixing accountability and
responsibility.
The UCBs need to prepare a comprehensive perspective plan for product diversification for enhancing their fee-
based income.
ISSN 2321-0354
Page 10
www.icm
rr.or
g
9
Volume 1, Issue 1 (March, 2013)
INTERCONTINENTAL JOURNAL OF FINANCE RESEARCH REVIEW
Pee
r R
evie
wed
Jo
urn
al o
f In
ter-
Co
nti
nen
tal M
anag
emen
t R
esea
rch
Co
nso
rtiu
m
htt
p:/
/ww
w.ic
mrr
.org
The UCBs should take the initiative for opening ― No Frills Account‖ to the vast sections of disadvantage and
low – income group so as to ensure greater financial inclusion.
Undertake proper assessment and regular bank audits
Establishment of apex bank for urban banks
End political intervention in co-operative banks
End dual control and redefine the functions of the authorities.
To have better functioning of Co-operative banks, the Government of India should take necessary steps to
establish‖ the Co-operative Bank of India.‖
1.13. CONCLUSION
The survival and success of urban co-operative banks depend upon the performance mainly based on the
mobilization and utilization of resources. This study is especially useful for policy makers, bankers, and researchers
as it provides adequate information about the determinants of the bank earning and profit.
1.14. SCOPE FOR THE FURTHER RESEARCH
In future efforts should be made by the researchers to identify factors responsible for poor performance of banks.
This can be possible through profitability analysis of branch banks. Moreover, factors basically responsible for low
performance of such banks should also be determined. Apart from the profitability, the concept of productivity also plays a
significant role in determining the efficiency and performance of service industry like banks. In future, it would be better
to apply the concept of productivity for analyzing the profitability of banks. More emphasis should be given to the factors,
viz., the level of non-performing assets, management of assets-liability, customer satisfaction, improvement of information
and communication technology, formulation of appropriate policies for the human resource development and corporate
governance to make the study more reliable and fruitful. The future researchers can consider the primary data for their
research to assess the customer satisfaction, employee satisfaction, turnover assessment, etc.
REFERENCES
1. Wessel and Robert, H., “Principles of Financial Analysis”, Macmillan Publishing Company, New York, 1961.
2. Desai, D.D., “Banking Finance for Agricultural Production and Marketing”, University of Bombay, Ph.D. Thesis, 1977, p. 200.
3. Reserve Bank of India, “Report of the Committee on Urban Co-operative Banks”, Bombay, 1979.
4. Purushotham, P., “Operational Growth of PACS in Andhra Pradesh”, IndianCo-operative Review, Vol XV. No.4, July 1978, pp. 479-491.
5. National Federation of State Co-operative Banks Limited, Accounting Manual, Vol.II, Bombay, 1979.
6. Masthan Jugga Rao., “Working of Scheduled Urban Co-operative Banks: Problems and Prospects”, Urban Credit, Vol.XX10, No3, Sept.,
2002, p.31.
7. Sarkar, A.N and Hanamashetty, J.S. “Co-operation in India” Sahitya Bhawan Publishers & Distributors (P) Ltd., Agra, 2002.
8. Philip Molyneux, Jonathan Williams, “Managerial Finance”; Volume: 31, Publisher: Emerald Group Publishing Limited, 2005, p. 26–35.
9. Geeta Sharma Ganesh Kawadia, “Efficiency of Urban Co-operative Banks of Maharashtra: A DEA Analysis”, The ICFAI Journal of Bank
Management, Vol. 5, Nov 2006, p. 25-38.
10. Asher, Mukul, G., “Paradigm shift in the way urban co-operative banks are managed, governed, and regulated in India”, Journal of Financial Regulation & Compliance”, Vol. 15, LKY School of Public Policy, National University.
ISSN 2321-0354
Page 11
www.icm
rr.or
g
10
Volume 1, Issue 1 (March, 2013)
INTERCONTINENTAL JOURNAL OF FINANCE RESEARCH REVIEW
Pee
r R
evie
wed
Jo
urn
al o
f In
ter-
Co
nti
nen
tal M
anag
emen
t R
esea
rch
Co
nso
rtiu
m
htt
p:/
/ww
w.ic
mrr
.org
PORTFOLIO CONSTRUCTION ON DIFFERENT INVESTMENT PROPOSALS AND
THEIR RETURNS
S. ALAGUSAMY Dr.R.SUBRAMANIAN *
* Assistant Professor
Sengunthar Institute of Management Studies
Sengunthar Arts and Science College
Tiruchengode (Tk), Namakkal (Dt) 637205.
ABSTRACT
―Portfolio Construction on different Investment proposals and their Returns‖ is an analytical project to
study the construction of investment portfolio over various phases of trade cycle for a period of Six years through
the data collected from published sources. . It aims to find out the best portfolio construction which will maximize
the return for the investor at any given period of trade cycle in terms of pricing efficiency, liquidity and stability
through the informational role. The selected investments for the portfolio construction taken for the study are
Shares, Mutual Fund, Currencies, Commodities – Metals (Gold, Silver).
Keywords: Portfolio Construction, Shares, Mutual Fund, Currencies, Commodities
1. Introduction to Portfolio Construction
In Finance industry portfolio construction deals with how to divide the investor's wealth across
some asset classes selected from a given asset classes' menu in order to maximize the investor's gain. An asset class
is a specific category of investments such as stocks, bonds, cash, and commodities. In quantitative finance portfolio
construction is achieved by an optimization process.
Portfolio construction deals with how to divide the investor wealth across some asset classes' in order to
maximize the investor gain. An asset class is a specific category of investments such as bonds, stocks, and
commodities. Assets within the same class generally exhibit similar risk characteristics, behave similarly in the
market place, and are subject to the same laws and regulations.
A Peer Reviewed International Journal
IJFRR
INTERCONTINENTAL JOURNAL OF FINANCE RESEARCH REVIEW
ISSN 2321-0354
Page 12
www.icm
rr.or
g
11
Volume 1, Issue 1 (March, 2013)
INTERCONTINENTAL JOURNAL OF FINANCE RESEARCH REVIEW
Pee
r R
evie
wed
Jo
urn
al o
f In
ter-
Co
nti
nen
tal M
anag
emen
t R
esea
rch
Co
nso
rtiu
m
htt
p:/
/ww
w.ic
mrr
.org
1.2 Introduction of the Study
In Finance industry portfolio construction deals with how to divide the investor's wealth across some asset
classes selected from a given asset classes' menu in order to maximize the investor's gain. An asset class is a specific
category of investments such as stocks, bonds, cash, and commodities. In quantitative finance portfolio construction
is achieved by an optimization process. A pioneering work in this regard is the well known Markowitz model. Given
a target performance, Markowitz method provides the optimal strategy which minimizes the investment risk. This
method and variations of it, are extensively used at the present by many asset managers. However, recent evolutions
of the world market showed limitations of this method and motivated many researchers and practitioners to study
alternative methodologies to portfolio construction. Main drawbacks of the Markowitz method are summarized in:
The asset classes performance is assumed to be multivariate Gaussian distributed, Investors make a one
shot allocation; the model does not face the portfolio rebalancing during the investment life time.
The first drawback is shown by basic econometric analysis of the world market to be inappropriate to
capture relevant statistical properties of asset classes' performances, while the second one does not allow the
investor to have a tight control of portfolio evolution during the investment life{time. Recently, Optimal Dynamic
Asset Allocation (ODAA) proposes a methodology to overcome such limitations. ODAA deals with how to
optimally allocate a multi-period investment. First studies in ODAA faced the problem on how to divide the
investment among stock and money markets. More recently, some work appeared in the literature concerning
optimal strategies for long{lived investors under stochastic investment opportunities. In particular, the work in
studies portfolio rebalancing in the presence of stochastic variation in the interest rate, the work in considers the
effects of inflation in a portfolio of stock or nominal bonds, the work in and takes into account the uncertainty in the
asset returns prediction.
Portfolio construction deals with how to divide the investor wealth across some asset classes' in order to
maximize the investor gain. An asset class is a specific category of investments such as bonds, stocks, and
commodities. Assets within the same class generally exhibit similar risk characteristics, behave similarly in the
market place, and are subject to the same laws and regulations. Due to unpredictability of their behavior, asset
classes‘ dynamics is usually modeled by means of stochastic processes.
1.3 Background of the Study
India is growing in a faster growth rate than any other developed country in the world. The Indian
company‘s contribution in the world economic growth is enormous. The investors like Institutional investors and
small Investors like common people are searching for a good opportunity to invest in various investment
perspectives like Shares, Mutual Funds, Gold, Bonds, Bank, Post office etc...
ISSN 2321-0354
Page 13
www.icm
rr.or
g
12
Volume 1, Issue 1 (March, 2013)
INTERCONTINENTAL JOURNAL OF FINANCE RESEARCH REVIEW
Pee
r R
evie
wed
Jo
urn
al o
f In
ter-
Co
nti
nen
tal M
anag
emen
t R
esea
rch
Co
nso
rtiu
m
htt
p:/
/ww
w.ic
mrr
.org
The Indian capital market has witnessed a major transformation and structural change the past one decade
as a result of ongoing financial sector reforms initiated by the Government of India. One of the major objectives of
these reforms was to bring the Indian capital market up to a certain international standard. Due to such reforming
process, one of the significant step taken in the secondary market is the introduction of derivative products in two
major Indian stock exchanges viz. National Stock Exchange (NSE) and Bombay Stock Exchange (BSE) , with a
view to provide tools for risk management to investors and to improve informational efficiency of the cash market.
The instruments are used for risk management by hedging i.e. taking opposite position in the futures.
In the last decade, many emerging and transition economies have started introducing diversified portfolio
construction. Policy makers and regulators in the markets are concerned about the impact of futures on the
underlying cash market. It had long been argued that a very undesirable feature of the Indian stock market was the
mixing of cash and futures trading. Such mixing was caused by the existence of the ‗badla system‘, combined with
long settlement cycles. All this has been ended by the package of reforms implemented after the stock market crisis
of March 2001. There is need for assessing the resulting new situation which is still in transition but some useful
experience has been gathered over the last few months. Such assessment has to be based on an examination of the
nature of inter-relationships, both direct and indirect, between the operation of the futures market and the cash
markets.
Institutional investors have lot of data can easily take their investment decision. But the small investor can‘t
do like that. This is because the small investor unclear on how to analyze the investment perspective and also they
don‘t know how to take decision during the market failures. This study provides the suggestion for small investor
about where to invest the money for higher returns as well as with minimal amount of risks in all the cases, whether
market is big boom or on recession. An important aspect to study is the migration of most of the speculative activity
from one investment to another investment provides easier and high returns.
1.4 Statement of the Problem
The market in which investment happens is unstable and unpredictable one. The investors may have the
chances of losing their investment or loosing higher return. This happens only when the investors are not aware of
market situations and high yielding investment choices. The main sufferer in all the investment alternatives during
the unstable state is the Small investors. The problems faced by them are higher losing of the capital.
1.5 Period of Study
The period of the study has been taken-Up from the year 2007 to 2012(6 Years), a sufficient time for any
portfolio to correct themselves according to their ups and downs.
ISSN 2321-0354
Page 14
www.icm
rr.or
g
13
Volume 1, Issue 1 (March, 2013)
INTERCONTINENTAL JOURNAL OF FINANCE RESEARCH REVIEW
Pee
r R
evie
wed
Jo
urn
al o
f In
ter-
Co
nti
nen
tal M
anag
emen
t R
esea
rch
Co
nso
rtiu
m
htt
p:/
/ww
w.ic
mrr
.org
2. REVIEW OF LITERATURE
Mark Rubinstein (1973). According to their results, investors are risk averse and show preference for
positive asymmetry, being even disposed to pay a significant price for the "safety" that the latter provides
Ross (1976), Arditti & John (1980) and Breeden & Litzenberger (1978), among others, evidencing the
important contribute of these instruments for the expansion contingencies covered by the market. On the other hand,
some empirical studies demonstrate that options‘ introduction has positive effects both on volatility and on
underlying asset price, contributing to market stability [e.g. Nabar and Park (1988), Conrad (1989), Gemmill (1989),
Detemple & Selden (1991), Haddad & Voorheis (1991), Figlewski & Webb (1993)].
Leland (1999) suggests a new evaluation methodology, considered more appropriated to the asymmetrical
return distributions exposed in the third section. Leland (1999) modifies the traditional risk measure, beta, so that it
captures all the elements of risk, here. In the sequence of this adjustment, the performance of any investment
strategy can be more precisely evaluated.
Fernandes (2003) evaluated index fund implementation in India. In this paper, tracking error of index funds
in India is measured. The consistency and level of tracking errors obtained by some well-run index fund suggests
that it is possible to attain low levels of tracking error under Indian conditions. At the same time, there seems to be
periods where certain index funds appear to depart from the discipline of indexation.
Pendaraki, Zopounidis and Doumpous (2005) studied construction of portfolios, developed a multi-criteria
methodology and applied it to the Greek market of equity funds. The methodology is based on the combination of
discrete and continuous multi-criteria decision aid methods for mutual fund selection and composition.
Zakri (2005) matched a sample of socially responsible funds to randomly selected conventional funds of
similar net assets to investigate differences in characteristics of assets held, degree of portfolio diversification and
variable effects of diversification on investment performance. The study found that socially responsible funds do not
differ significantly from conventional funds in terms of any of these attributes.
Agarwal (2007) provides an overview of mutual fund activity in emerging markets. It describes their size
and asset allocation. This paper analyzes the Indian Mutual Fund Industry pricing mechanism with empirical studies
on its valuation. It also analyzes data at both the fund-manager and fund-investor levels.
Guha (2008) focused on return-based style analysis of equity mutual funds in India using quadratic
optimization of an asset class factor model proposed by William Sharpe. The study found the ―Style Benchmarks‖
of each of its sample of equity funds as optimum exposure to 11 passive asset class indexes. The study also analyzed
the relative performance of the funds with respect to their style benchmarks. The results of the study showed that the
funds have not been able to beat their style benchmarks on the average.
Anand and Murugaiah (2008) examined the components and sources of investment performance in order to
attribute it to specific activities of Indian fund managers. They also attempted to identify a part of observed return
which is due to the ability to pick up the best securities at given level of risk. For this purpose, Fama's methodology
ISSN 2321-0354
Page 15
www.icm
rr.or
g
14
Volume 1, Issue 1 (March, 2013)
INTERCONTINENTAL JOURNAL OF FINANCE RESEARCH REVIEW
Pee
r R
evie
wed
Jo
urn
al o
f In
ter-
Co
nti
nen
tal M
anag
emen
t R
esea
rch
Co
nso
rtiu
m
htt
p:/
/ww
w.ic
mrr
.org
is adopted here. The study covers the period between April 1999 and March 2003 and evaluates the performance of
mutual funds based on 113 selected schemes having exposure more than 90percent of corpus to equity stocks of 25
fund houses. The empirical results reported reveal the fact that the mutual funds were not able to compensate the
investors for the additional risk that they have taken by investing in the mutual funds. The study concludes that the
influence of market factor was more severe during negative performance of the funds while the impact selectivity
skills of fund managers was more than the other factors on the fund performance in times of generating positive
return by the funds. It can also be observed from the study that selectivity, expected market risk and market return
factors have shown closer correlation with the fund return.
3. Objectives of the study
The ultimate objective of this study is to create a deeper understanding of this new phenomenon especially
in Indian scenario the specific Indian setting. It aims to find out whether the diversified portfolio has contributed
towards the improvement of the reducing risk in capital and increasing returns with functions in terms of pricing
efficiency, liquidity and stability. Moreover this project will also be helpful in making the people more informative
and knowledgeable about the investment options in the unstable market.
1. To analyze the performance of the selected investment alternatives in India through the returns given
by them.
2. To find out which investment alternatives gives the maximum return.
3. To find the optimum selection of investment.
4. To offer suitable suggestions for the common man about where to invest money for higher returns.
3.1 Limitations of the Study
Taking into consideration the objectives of the study and its coverage both in terms of time span and the
number of banks, the study is prone to many limitations. Some of the major unavoidable limitations of the present
work are as follows:
The study has been undertaken only through the analysis of only selected investment alternatives.
While computing the data for the purpose of analysis, the approximation of decimal places leads to minor
variations in ratios and percentage analysis, which are bound to exist in the present study.
Various accounting and statistical tools extensively used for the present study have their own limitations.
Financial information collected for the present study is entirely secondary in nature. In such a case, the
study carries all the limitations inherent with the secondary data and financial information.
There may be chance of giving a higher return on selection of some other alternative investment.
Thus, the findings of the present study should be used judiciously and carefully taking into account the
various limitations.
ISSN 2321-0354
Page 16
www.icm
rr.or
g
15
Volume 1, Issue 1 (March, 2013)
INTERCONTINENTAL JOURNAL OF FINANCE RESEARCH REVIEW
Pee
r R
evie
wed
Jo
urn
al o
f In
ter-
Co
nti
nen
tal M
anag
emen
t R
esea
rch
Co
nso
rtiu
m
htt
p:/
/ww
w.ic
mrr
.org
4 RESEARCH METHODOLOGY
4.1Type of Project
Portfolio Construction on Different Investment Proposals and their Returns is an analytical project
to study the construction of investment portfolio over various phases of trade cycle for a period of three years
through the data collected from published sources.
4.2 Data Source
Secondary data Viz., Interest rates, Share prices, Mutual fund unit prices, Net Asset value , Currency
prices on various dates, Bid price of Initial Public offers, Interest rates of Bonds and Debentures, Prices of
Commodities like Gold, Silver, Copper were to collected for the period 2007 to 2012 (6 Years).
They are collected from various websites such as NSE India, Amfi India, Forex, Kitco, Mcx, Published
journals and News papers.The selected investments for the portfolio construction taken for the study are,
Shares – Selected shares from Nifty.
Mutual Fund – Selected Funds.
Currencies – Selected Currencies.
Commodities – Metals (Gold, Silver).
4.3 Sample Design
Simple Random Sampling is the foundation of Probability Sampling. It is a special case of probability
sampling in which every unit in the population has the same chance of being selected. Thus the investments are
selected at randomly.
4.4 Tools for Analysis
To suit the objectives of the study, the following tools and techniques were applied for the study.
Comparative Analysis.
Percentage Analysis.
5. INVESTMENT ALTERNATIVES
5.1 Shares
In finance a share is a unit of account for various financial instruments including stocks, mutual funds, limited
partnerships, and REIT's. In British English, the usage of the word share alone to refer solely to stocks is so common
that it almost replaces the word stock itself.
ISSN 2321-0354
Page 17
www.icm
rr.or
g
16
Volume 1, Issue 1 (March, 2013)
INTERCONTINENTAL JOURNAL OF FINANCE RESEARCH REVIEW
Pee
r R
evie
wed
Jo
urn
al o
f In
ter-
Co
nti
nen
tal M
anag
emen
t R
esea
rch
Co
nso
rtiu
m
htt
p:/
/ww
w.ic
mrr
.org
In simple Words, a share or stock is a document issued by a company, which entitles its holder to be one of the
owners of the company. A share is issued by a company or can be purchased from the stock market.By owning a
share you can earn a portion and selling shares you get capital gain. So, your return is the dividend plus the capital
gain. However, you also run a risk of making a capital loss if you have sold the share at a price below your buying
price.
Quick Facts on Stocks and Shares
Owning a stock or a share means you are a partial owner of the company, and you get voting rights in
certain company issues.
Over the long run, stocks have historically averaged about 10% annual returns However, stocks offer no
guarantee of any returns and can lose value, even in the long run.
Investments in stocks can generate returns through dividends, even if the price.
5.2 Mutual Funds
Mutual funds are investment companies that pool money from investors at large and offer to sell and buy
back its shares on a continuous basis and use the capital thus raised to invest in securities of different companies.
At the beginning of this millennium, mutual funds out numbered all the listed securities in New York Stock
Exchange. Mutual funds have an upper hand in terms of diversity and liquidity at lower cost in comparison to bonds
and stocks.
Mutual funds are investment companies that pool money from investors at large and offer to sell and buy
back its shares on a continuous basis and use the capital thus raised to invest in securities of different companies.
The stocks these mutual funds have are very fluid and are used for buying or redeeming and/or selling shares at a net
asset value. Mutual funds posses shares of several companies and receive dividends in lieu of them and the earnings
are distributed among the share holders.
Mutual funds can be either or both of open ended and closed ended investment companies depending on
their fund management pattern. An open-end fund offers to sell its shares (units) continuously to investors either in
retail or in bulk without a limit on the number as opposed to a closed-end fund. Closed end funds have limited
number of shares.
Mutual funds have diversified investments spread in calculated proportions amongst securities of various
economic sectors. Mutual funds get their earnings in two ways. First is the most organic way, which is the dividend
they get on the securities they hold. Second is by the redemption of their shares by investors will be at a discount to
the current NAVs (net asset values).
ISSN 2321-0354
Page 18
www.icm
rr.or
g
17
Volume 1, Issue 1 (March, 2013)
INTERCONTINENTAL JOURNAL OF FINANCE RESEARCH REVIEW
Pee
r R
evie
wed
Jo
urn
al o
f In
ter-
Co
nti
nen
tal M
anag
emen
t R
esea
rch
Co
nso
rtiu
m
htt
p:/
/ww
w.ic
mrr
.org
5.3 Currency
Originally, only very large enterprises had access to the foreign exchange trading (forex / fx / currency)
trading in the inter-bank business, the largest and most liquid financial market in the world. In this market,
currencies up to a value of around 1,500 billion USD are bought and sold by its approximately 200,000 world-wide
participants every day and 24 hours per day.
In the past few years this highly attractive market has become more and more accessible to individual
clients. The market participants, who are linked world-wide by modern communication systems, control the prices
(rates), as this market too, follows the laws of supply and demand.
As a result continuous changes in rates are seen. Foreign exchange trading (buying and selling of different
currencies) consists of making profitable use of these market fluctuations on the basis of well-tried currency trading
models. The special advantage of this investment as opposed to traditional investments such as fixed interest shares
etc. is that profits can also be made in case of the USD falling instead of rising compared to other currencies.
A deal is concluded between two different currencies, with one currency theoretically representing the loan
currency (debit) and the other one the investment currency (credit). Results are limited to the amount of the
difference between the entrance and exit prices. It is possible to trade using 100 times or more of our own capital.
This is called leverage or gearing. A relatively small market movement will have a proportionately larger impact on
the funds we have deposited or will have to deposit
Trading successfully is no simple matter. It takes time, market knowledge and market understanding and a
large amount of self restraint.
The Foreign exchange market is volatile by nature. The practice of trading it by way of margin increases
that volatility exponentially. We are talking about a very 'fast market' which is naturally inconsistent. In order to
make a successful trade, a trader has to take into account technical and fundamental data and make an informed
decision based on his perception of market sentiment and market expectation. Timing a trade correctly is probably
the most important variable in trading successfully. Invariably there will be times when a traders' timing will be off.
So don't expect to generate returns on every trade.
5.4 Commodity
A commodity is something that is supplied in several different places without any qualitative difference.
For example: gold, crude oil, copper, wheat and so on. Therefore, barring man-made taxes and transportation costs,
their prices would be broadly similar in all locations. So there is a thriving market for commodities worldwide—
unlike equities, which are usually country specific. And in the recent past, commodities have become an accepted
asset class with significant chunks of smart money being invested in commodities markets worldwide.
ISSN 2321-0354
Page 19
www.icm
rr.or
g
18
Volume 1, Issue 1 (March, 2013)
INTERCONTINENTAL JOURNAL OF FINANCE RESEARCH REVIEW
Pee
r R
evie
wed
Jo
urn
al o
f In
ter-
Co
nti
nen
tal M
anag
emen
t R
esea
rch
Co
nso
rtiu
m
htt
p:/
/ww
w.ic
mrr
.org
Given the global growth in GDP, we remain in the early stages of a multiyear bull market in commodities. It is
clearly a consumption-driven story, with the leading players being China and India and followed by a host of other
fast developing nations.
Besides, there is the argument frequently made that ―commodity prices cannot go to zero‖ and thus are, in a
sense, bounded on the upside as well as on the downside. In other words, rising input costs of raw materials, labour
or even capital will force supply and demand responses so that price increase is controlled. It may be pertinent and
topical to note at this point that crude oil has gone to $100 per barrel levels but the experience of just a decade ago
shows that high prices fed by high demand eventually led to a downward spiral with low prices and low demand
brought about by lower consumption due to high prices.
So if there is no guarantee that prices will continue going up, then where is the guarantee of returns? Well,
just as in equity trading, markets can and do move both ways. The trick is to use not only the futures markets but
also the spot markets for getting returns commensurate with the perceived risk. However, futures markets, unlike
spot markets, are a virtual zero-sum game and work using leverage (only a margin of 5-25% of the contract value
typically has to be deposited to take the ‗position‘). Sure, there is a lot of money waiting to be made in the
commodity markets over the next decade, but all trading needs care, identification of sources of return and learning
more and more about the markets as an ongoing process.
Like all markets, commodity markets are meeting places of buyers and sellers and the commodity
exchanges in India mainly trade bullion, base metals, energy and agricultural produce. Unlike developed countries,
foreign currency and stock indices are not part of our commodity markets and are unlikely to be integrated in the
near future.
One clear and useful economic function that commodity markets perform is that they provide a platform for
price risk management for both producers and consumers. Commodity prices typically move in tandem with
inflation and as demand for goods and services increases, the price of goods and services usually rises too, as does
the price of the commodities used to produce those goods and services.
ISSN 2321-0354
Page 20
www.icm
rr.or
g
19
Volume 1, Issue 1 (March, 2013)
INTERCONTINENTAL JOURNAL OF FINANCE RESEARCH REVIEW
Pee
r R
evie
wed
Jo
urn
al o
f In
ter-
Co
nti
nen
tal M
anag
emen
t R
esea
rch
Co
nso
rtiu
m
htt
p:/
/ww
w.ic
mrr
.org
6. DATA ANALYSIS AND INTERPRETATION
INVESTMENTS & RETURNS CHARTS
CONSOLIDATED STATEMENT OF INVESTMENT AND RETURNS - 2007
Table No.1
S.No Alternatives Principal Sale Proceeds Capital Gain Contributing
%
1 Shares 149861 223579 73718 49.19
2 Mutual Fund 149452.5 424060.85 274608.35 183.74
3 Currency 149701.5 195097.5 45396 30.32
4 Commodities – gold 149875.2 170035.2 20160 13.45
5 Commodities –silver 149528.11 139201.77 -10326.34 -6.91
Total 748418 1151974 403556 269.80
Chart No.1
While observing the data it is interfered that in the year 2007, return from Mutual Fund ranks 1st with
183.74 % followed by shares in secondary market which fetches 49.19%
But on the other hand the currency trading investment lead to a negative mark and result in loss of capital
invested up to -6.91%. The overall investment fetches a return of 269.80%.
ISSN 2321-0354
Page 21
www.icm
rr.or
g
20
Volume 1, Issue 1 (March, 2013)
INTERCONTINENTAL JOURNAL OF FINANCE RESEARCH REVIEW
Pee
r R
evie
wed
Jo
urn
al o
f In
ter-
Co
nti
nen
tal M
anag
emen
t R
esea
rch
Co
nso
rtiu
m
htt
p:/
/ww
w.ic
mrr
.org
CONSOLIDATED STATEMENT OF INVESTMENT AND RETURNS - 2008
Table No.2
S.No Alternatives Principal Sale Proceeds Capital Gain Contributing %
1 Shares 149904.2 77774.6 -72129.6 -48.11
2 Mutual Fund 149274.2 68873.79 -80400.41 -53.86
3 Commodities – gold 149874.75 153945.75 4071 2.71
4 Commodities -silver 149897.2 108331.6 -41565.6 -27.72
5 currency 149863.9 184917.57 35053.67 23.39
Total Investment 748814.25 593843.31 -154970.94 -20.69
Chart No.2
The above statement shows the investment in various alternatives and their returns. It also shows the percentage of
returns in positive and negative values for the year 2008.
The total investment for the year, the return on the total investment, capital gain or loss and the percentage of return
on investment is also shown.
ISSN 2321-0354
Page 22
www.icm
rr.or
g
21
Volume 1, Issue 1 (March, 2013)
INTERCONTINENTAL JOURNAL OF FINANCE RESEARCH REVIEW
Pee
r R
evie
wed
Jo
urn
al o
f In
ter-
Co
nti
nen
tal M
anag
emen
t R
esea
rch
Co
nso
rtiu
m
htt
p:/
/ww
w.ic
mrr
.org
CONSOLIDATED STATEMENT OF INVESTMENT AND RETURNS – 2009
Table No.3
S.No Alternatives Principal Sale Proceeds Capital Gain Contributing %
1 Shares 149440.4 289324.25 139883.85 93.6
2 Mutual Fund 149841.5 262779.84 112938.34 75.37
3 Commodities – gold 149539.5 185962.5 36423 24.35
4 Commodities -silver 149912.4 229874.7 79962.3 53.33
5 currency 149762.21 145945.1 -3817.11 -2.54
Total Investment 748496.01 1113886.39 365,390.38 48.81
Chart No.3
The above statement shows the investment in various alternatives and their returns. It also shows the percentage of
returns in positive and negative values for the year 2009.
The total investment for the year, the return on the total investment, capital gain or loss and the percentage of return
on investment is also shown.
ISSN 2321-0354
Page 23
www.icm
rr.or
g
22
Volume 1, Issue 1 (March, 2013)
INTERCONTINENTAL JOURNAL OF FINANCE RESEARCH REVIEW
Pee
r R
evie
wed
Jo
urn
al o
f In
ter-
Co
nti
nen
tal M
anag
emen
t R
esea
rch
Co
nso
rtiu
m
htt
p:/
/ww
w.ic
mrr
.org
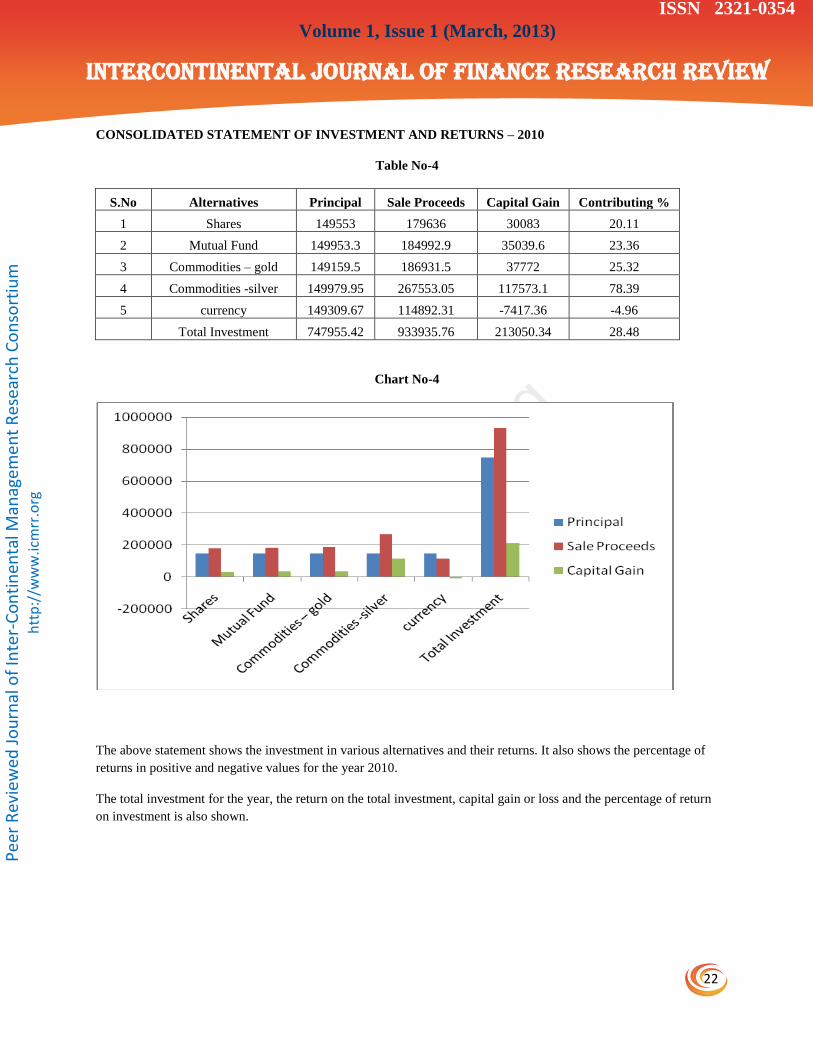
CONSOLIDATED STATEMENT OF INVESTMENT AND RETURNS – 2010
Table No-4
S.No Alternatives Principal Sale Proceeds Capital Gain Contributing %
1 Shares 149553 179636 30083 20.11
2 Mutual Fund 149953.3 184992.9 35039.6 23.36
3 Commodities – gold 149159.5 186931.5 37772 25.32
4 Commodities -silver 149979.95 267553.05 117573.1 78.39
5 currency 149309.67 114892.31 -7417.36 -4.96
Total Investment 747955.42 933935.76 213050.34 28.48
Chart No-4
The above statement shows the investment in various alternatives and their returns. It also shows the percentage of
returns in positive and negative values for the year 2010.
The total investment for the year, the return on the total investment, capital gain or loss and the percentage of return
on investment is also shown.
ISSN 2321-0354
Page 24
www.icm
rr.or
g
23
Volume 1, Issue 1 (March, 2013)
INTERCONTINENTAL JOURNAL OF FINANCE RESEARCH REVIEW
Pee
r R
evie
wed
Jo
urn
al o
f In
ter-
Co
nti
nen
tal M
anag
emen
t R
esea
rch
Co
nso
rtiu
m
htt
p:/
/ww
w.ic
mrr
.org
CONSOLIDATED STATEMENT OF INVESTMENT AND RETURNS – 2011
Table No-5
S.No Alternatives Principal Sale Proceeds Capital Gain Contributing %
1 Shares 149603.9 120542.7 -29061.2 -19.42
2 Mutual Fund 149316.92 112194.26 -37122.66 -24.86
3 Commodities – gold 149958 165348 15390 10.26
4 Commodities -silver 149976.3 137800.2 -12176.1 -8.11
5 currency 149179.59 175482.83 26303.24 17.63
Total Investment 748034.71 711367.99 -36666.72 -4.9
Chart No-5
The above statement shows the investment in various alternatives and their returns. It also shows the percentage of
returns in positive and negative values for the year 2011.
The total investment for the year, the return on the total investment, capital gain or loss and the percentage of return
on investment is also shown.
ISSN 2321-0354
Page 25
www.icm
rr.or
g
24
Volume 1, Issue 1 (March, 2013)
INTERCONTINENTAL JOURNAL OF FINANCE RESEARCH REVIEW
Pee
r R
evie
wed
Jo
urn
al o
f In
ter-
Co
nti
nen
tal M
anag
emen
t R
esea
rch
Co
nso
rtiu
m
htt
p:/
/ww
w.ic
mrr
.org
CONSOLIDATED STATEMENT OF INVESTMENT AND RETURNS - 2012
Table No-6
S.No Alternatives Principal Sale Proceeds Capital Gain Contributing %
1 Shares 149404.5 183193.8 33789.3 22.61
2 Mutual Fund 149706.88 194582.61 44875.73 29.97
3 Commodities – gold 149614 154147.5 5533.5 3.69
4 Commodities -silver 149656 155740 6084 4.06
5 currency 149622 155338.02 5716.02 3.82
Total Investment 748003.38 687261.93 95999.05 12.83
Chart No-6
The above statement shows the investment in various alternatives and their returns. It also shows the percentage of
returns in positive and negative values for the year 2012.
The total investment for the year, the return on the total investment, capital gain or loss and the percentage of return
on investment is also shown.
ISSN 2321-0354
Page 26
www.icm
rr.or
g
25
Volume 1, Issue 1 (March, 2013)
INTERCONTINENTAL JOURNAL OF FINANCE RESEARCH REVIEW
Pee
r R
evie
wed
Jo
urn
al o
f In
ter-
Co
nti
nen
tal M
anag
emen
t R
esea
rch
Co
nso
rtiu
m
htt
p:/
/ww
w.ic
mrr
.org
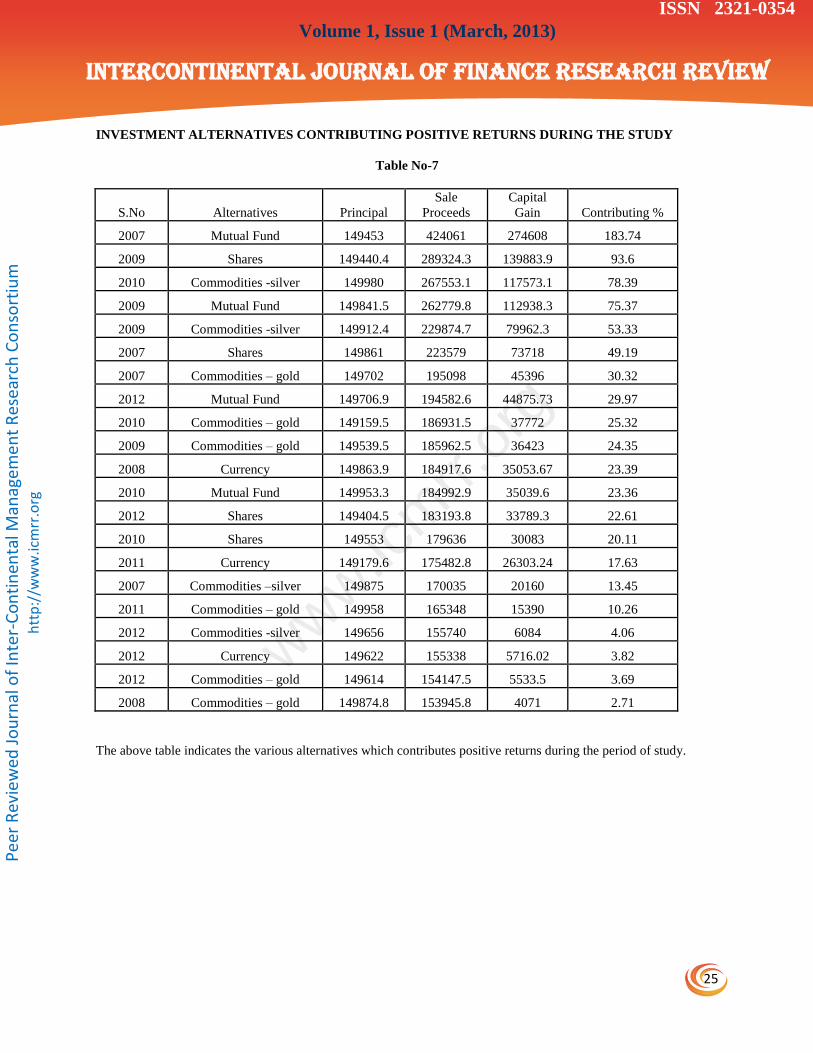
INVESTMENT ALTERNATIVES CONTRIBUTING POSITIVE RETURNS DURING THE STUDY
Table No-7
S.No Alternatives Principal
Sale
Proceeds
Capital
Gain Contributing %
2007 Mutual Fund 149453 424061 274608 183.74
2009 Shares 149440.4 289324.3 139883.9 93.6
2010 Commodities -silver 149980 267553.1 117573.1 78.39
2009 Mutual Fund 149841.5 262779.8 112938.3 75.37
2009 Commodities -silver 149912.4 229874.7 79962.3 53.33
2007 Shares 149861 223579 73718 49.19
2007 Commodities – gold 149702 195098 45396 30.32
2012 Mutual Fund 149706.9 194582.6 44875.73 29.97
2010 Commodities – gold 149159.5 186931.5 37772 25.32
2009 Commodities – gold 149539.5 185962.5 36423 24.35
2008 Currency 149863.9 184917.6 35053.67 23.39
2010 Mutual Fund 149953.3 184992.9 35039.6 23.36
2012 Shares 149404.5 183193.8 33789.3 22.61
2010 Shares 149553 179636 30083 20.11
2011 Currency 149179.6 175482.8 26303.24 17.63
2007 Commodities –silver 149875 170035 20160 13.45
2011 Commodities – gold 149958 165348 15390 10.26
2012 Commodities -silver 149656 155740 6084 4.06
2012 Currency 149622 155338 5716.02 3.82
2012 Commodities – gold 149614 154147.5 5533.5 3.69
2008 Commodities – gold 149874.8 153945.8 4071 2.71
The above table indicates the various alternatives which contributes positive returns during the period of study.
ISSN 2321-0354
Page 27
www.icm
rr.or
g
26
Volume 1, Issue 1 (March, 2013)
INTERCONTINENTAL JOURNAL OF FINANCE RESEARCH REVIEW
Pee
r R
evie
wed
Jo
urn
al o
f In
ter-
Co
nti
nen
tal M
anag
emen
t R
esea
rch
Co
nso
rtiu
m
htt
p:/
/ww
w.ic
mrr
.org
INVESTMENT ALTERNATIVES CONTRIBUTING NEGATIVE RETURNS DURING THE STUDY
Table No-8
S.No Alternatives Principal Sale Proceeds Capital Gain Contributing %
2008 Mutual Fund 149274.2 68873.79 -80400.41 -53.86
2008 Shares 149904.2 77774.6 -72129.6 -48.11
2008 Commodities -silver 149897.2 108331.6 -41565.6 -27.72
2011 Mutual Fund 149316.92 112194.26 -37122.66 -24.86
2011 Shares 149603.9 120542.7 -29061.2 -19.42
2011 Commodities -silver 149976.3 137800.2 -12176.1 -8.11
2007 currency 149528.11 139201.77 -10326.34 -6.91
2010 currency 149309.67 114892.31 -7417.36 -4.96
2009 currency 149762.21 145945.1 -3817.11 -2.54
The above table indicates the various alternatives which contributes negative returns during the period of study.
7. FINDINGS
1. The analysis shows the investment in shares fetch a positive return on investment during the years 2007,
2009, 2010 and 2012.
2. During the period of study, the investment in shares incur a capital loss in the years of 2008 and 2011.
3. The analysis shows the investment in mutual funds fetch a positive return on investment during the years
2007, 2009, 2010 and 2012.
4. During the period of study, the investment in mutual funds incurs a capital loss in the years of 2008 and
2011.
5. Investment in gold found to be continuously showing a positive return on investment throughout the period
of study.
6. Except in the years 2008 and 2011, investment in silver has also contributed a positive return on
investment.
7. Alternatively currency fetches a positive return on investment in those years whenever shares and mutual
funds give a negative return.
8. The total return on investment found to be positive in the years of 2007,2009,2010,2012.
ISSN 2321-0354
Page 28
www.icm
rr.or
g
27
Volume 1, Issue 1 (March, 2013)
INTERCONTINENTAL JOURNAL OF FINANCE RESEARCH REVIEW
Pee
r R
evie
wed
Jo
urn
al o
f In
ter-
Co
nti
nen
tal M
anag
emen
t R
esea
rch
Co
nso
rtiu
m
htt
p:/
/ww
w.ic
mrr
.org
8. SUGGESTIONS
From the above study the suggestions for the investor are,
1. As India is a developing country the investors always should give more preference to shares, mutual funds
and gold as a part of investment.
2. During the period of the study there may be a changes in import and export, the investor should keep an eye
on the forex trading.
3. In order to reduce the risk on the capital investment, the investor should invest up to 25% in bank deposit,
bonds and debenture which gives fixed return.
4. As the commodity market gaining important in current market condition, the investor can invest 10 to 15%
of his investment in commodity market especially in metals.
5. Any investor should construct his portfolio according to the phase of trade cycle prevails in the country to
get maximum returns.
9. CONCLUSION
From the study, it is very clear that Stock market, Mutual Funds remains a good investment alternative for
any investor . At the same time the investor should know the level of risk to be taken to safe guard the investment.
The study gives a new scope for any investor to decide the amount of risk he can take. This gives a new insight in
the area of portfolio construction. On the other hand any investor‘s aim is to safeguard the capital first rather than
maximize the return. So investor has to make a blend of investment and risk on return.
REFERENCES
Bibliography
1. Shah, A. and Thomas, S., “Policy issues in the Indian securities market”. July 2001.
2. Reddy, Y.V., “Developing Capital Markets in Emerging Economies: Issues and Indian Experience”.
Keynote address at the Asian Bond Conference at Bangkok, March 2002.
3. Fernandes, K. (2003). ―Evaluating index fund implementation in India”. Working paper,
http://www.nseindia.com/content/research/Paper66.pdf.
4. Zakri Y. B. (2005), ―Socially Responsible Investing and Portfolio Diversification‖. The Journal of
Financial Research, 28, 1: 41-57.
5. Anand, S. and Murugaiah, V. (2006). “Analysis of Components of Investment Performance - An Empirical
Study of Bonds in India”. 10th Indian Institute of Capital Markets Conference. ICFAI: Hyderabad.
6. Agrawal D. (2007). “Measuring Performance of IPO investment”. Prabhandan Tanikniqui, 1, 1: 43-52.
7. Guha, S. (2008). ―Performance of Indian Equity Mutual Funds‖. The ICFAI Journal of Applied Finance,
14, 1: 49-81.
8. Bose, S. and Mukherjee, P., “Constant maturity yield curve estimation for India”, Presented at the 4th
Annual Conference on Money and Finance -IGIDR, Mumbai.
9. Majumdar, S., “Indian Money and Fixed Income Securities Market – A” study of evolution‖,
www.debtonnetindia.com.
10. Security analysis and portfolio management – Punithavathy Pandian.
ISSN 2321-0354
Page 29
www.icm
rr.or
g
28
Volume 1, Issue 1 (March, 2013)
INTERCONTINENTAL JOURNAL OF FINANCE RESEARCH REVIEW
Pee
r R
evie
wed
Jo
urn
al o
f In
ter-
Co
nti
nen
tal M
anag
emen
t R
esea
rch
Co
nso
rtiu
m
htt
p:/
/ww
w.ic
mrr
.org
A STUDY ON A COMPARATIVE STUDY OF SECTOR FUNDS WITH SPECIAL
REFERENCE TO SHAREKHAN LIMITED, CHENNAI
P. ARUNSHANKAR B. PRABHU*
* Assistant Professor
Sengunthar Institute of Management Studies
Sengunthar Arts and Science College
Tiruchengode (Tk), Namakkal (Dt) 637205.
ABSTRACT
Sector mutual funds are those mutual funds that restrict their investments to a particular segment or sector of the
economy. These funds concentrate on one industry such as infrastructure, heath care, utilities, pharmaceuticals etc.
Sector funds tend to be riskier and more volatile than the broad market because they are less diversified, although
the risk level depends on the specific sector. Some investors choose sector funds when they believe that a specific
sector will outperform the overall market, while others choose sector funds to hedge against other holdings in a
portfolio. Sector funds are perceived as a good move for diversification, because an investor is attempting to locate
the strongest sector within the market. Buying the right sector funds can help the investor to diversify the portfolio
into areas where other investments don't give much exposure.
Keywords: Sector Funds, Mutual Funds, Market risk (β)
1. INTRODUCTION
Sector funds are those mutual funds that restrict their investments to a particular segment or sector of the
economy. These funds concentrate on one industry such as infrastructure, heath care, utilities, pharmaceuticals etc.
The idea is to allow investors to place bets on specific industries or sectors, which have strong growth potential.
These funds tend to be more volatile than funds holding a diversified portfolio of securities in many
industries. Such concentrated portfolios can produce tremendous gains or losses, depending on whether the chosen
sector is in or out of favour.Sector funds have seldom given returns higher than the Indian stock market. These funds
are not known to outperform the blue-chips belonging to the sector they focus on. The indices designed by stock
exchanges to track sectors such as the Bombay Stock Exchange‘s BSE Pharma or BSE Bankex too comfortably beat
returns from sectoral funds that invest in the stocks belonging to the same industries.
A Peer Reviewed International Journal
IJFRR
INTERCONTINENTAL JOURNAL OF FINANCE RESEARCH REVIEW
ISSN 2321-0354
Page 30
www.icm
rr.or
g
29
Volume 1, Issue 1 (March, 2013)
INTERCONTINENTAL JOURNAL OF FINANCE RESEARCH REVIEW
Pee
r R
evie
wed
Jo
urn
al o
f In
ter-
Co
nti
nen
tal M
anag
emen
t R
esea
rch
Co
nso
rtiu
m
htt
p:/
/ww
w.ic
mrr
.org
According to data on the performance of mutual funds and the sectoral indices sourced from Value
Research for the last three years, the two auto funds — from JM and UTI — on offer, for instance, have not quite
outperformed the BSE Auto index or the broader market spectacularly. While, JM Auto Fund has yielded returns of
20 per cent over the last three years, the UTI Auto Fund has barely given gains of 9 per cent to its investors. In sharp
comparison, the BSE Auto Index grew 20 per cent during the same period. The Sensex, on the other hand, climbed
almost 40 per cent in the last three years.
The story remains the same in the case of bank funds. The BSE Bankex rose 43 per cent in the last three
years. The only two bank funds available in the mutual fund market — Reliance Banking and UTI Banking Sector
— have underperformed the BSE Bankex. While Reliance Banking grew by 38 per cent, UTI banking Sector fared
only marginally better with gains of 40 per cent. The mutual fund schemes built around the pharmaceuticals sector
too have failed to outdo either the broad market or the Bombay Stock Exchange‘s index for the pharmaceuticals
sector over the last three years.
―Fund houses launch thematic funds only to garner new money because beyond a point investors normally
do not invest in existing schemes in a big way,‖ says Surya Bhatia, principal consultant at financial advising firm
Asset Managers. Thus, in keeping with the recent surge in construction and infrastructure development in the
country, a bunch of infrastructure funds have been launched. Similarly, power, retail and media and entertainment
have been the hot sectors for some time and to cash in on the hype around these themes, fund houses have launched
funds focused on them.
There are very few funds that have managed to buck the trend. ICICI Prudential FMCG Fund stands out as
a rare, hard-to-find exception, the returns from which not only beat the market but also the Bombay Stock
Exchange‘s index tracking the fast moving consumer goods stock over the last three years.
2. OBJECTIVES OF THE STUDY
1. To study the concepts and parameters of mutual funds
2. To study about the benefits available to investors with mutual fund investments.
3. To study about different types of schemes available in mutual funds.
4. To study and compare the performance of sector funds of different AMC‘S
3. SCOPE OF THE STUDY
The scope of the study is limited to only few sector funds viz.
DSP Block Rock Technology.Com Fund.
SBI Magnum It Funds.
ICICI Prudential Technology Fund.
SBI Magnum FMCG Fund.
ICICI Prudential FMCG.
UTI Banking Sector Fund.
Reliance Banking Fund.
4. LIMITATIONS
The study is limited to only few selected sector funds.
The time period taken for the study is only 45 days; hence extensive study could not be made.
ISSN 2321-0354
Page 31
www.icm
rr.or
g
30
Volume 1, Issue 1 (March, 2013)
INTERCONTINENTAL JOURNAL OF FINANCE RESEARCH REVIEW
Pee
r R
evie
wed
Jo
urn
al o
f In
ter-
Co
nti
nen
tal M
anag
emen
t R
esea
rch
Co
nso
rtiu
m
htt
p:/
/ww
w.ic
mrr
.org
5. RESEARCH METHODOLOGY
5.1 Research Design:-
For the present study, different sector funds are taken, their returns, standard deviation are calculated.
Sharpe performance index, Treynor‘s performance index, Jenson‘s performance index is calculated and comparison
is done on their performance.
5.2 Data Collection:-
The present study is based purely on secondary data. The sources used for secondary data are
Various websites
Company fact sheets.
Standard reference books.
6. LITERATURE SURVEY
Mutual Funds are professionally managed pool of money from a group of investors. A Mutual fund
manager invests your funds in securities including stocks and bonds, Money Market instruments or some
combination and decides the best time to buy and sell. By pooling your resources with other investors in Mutual
Funds, you can diversify even a small investment over a wide spectrum.
A Mutual fund is a special type of investment institution which acts as an investment conduit. It pools the
savings, particularly of the relatively small investors, and invests them in a well-diversified portfolio of sound
investment. As an investment intermediary, it offers a variety of services/advantages to the relatively small investors
who on their own cannot successfully construct and manage investment portfolio mainly due to the small size of
their funds, lack of expertise and experience, and so on. These services include the diversification of portfolio,
expertise of the professional management, liquidity of investment, tax shelter, reduced risk and reduced cost.
Mutual fund is the most suitable investment mode for the common man as it offers an opportunity to invest
in a diversified, professionally managed portfolio at a relatively low cost. Anybody with an investible surplus of as
little as a few thousand rupees can invest in mutual funds. Each Mutual fund scheme has a defined investment
objective and strategy.
The most important trend in the Mutual Fund industry is the aggressive expansion of the foreign owned
Mutual Fund companies and the decline of the companies floated by nationalized banks and smaller private sector
players. Funds issue and redeem shares on demand at the fund's net asset value (NAV). Mutual fund management
fees typically range between 0.5% and 2% of assets per year, exchange fees and other administrative charges also
apply.
According to SEBI - Mutual Fund is defined as - ―A fund established in the form of a trust to
raise money‘s through the sale of units to the public or a section of the public under one or more schemes for
investing in securities, including money market instruments.‖ Mutual Fund is a mechanism for pooling the resources
by issuing units to the investors and investing funds in securities in accordance with objectives as disclosed in the
offer document.
6.1 SECTOR FUNDS
Sector mutual funds are those mutual funds that restrict their investments to a particular segment or sector
of the economy. These funds concentrate on one industry such as infrastructure, heath care, utilities, pharmaceuticals
etc. The idea is to allow investors to place bets on specific industries or sectors, which have strong growth potential.
ISSN 2321-0354
Page 32
www.icm
rr.or
g
31
Volume 1, Issue 1 (March, 2013)
INTERCONTINENTAL JOURNAL OF FINANCE RESEARCH REVIEW
Pee
r R
evie
wed
Jo
urn
al o
f In
ter-
Co
nti
nen
tal M
anag
emen
t R
esea
rch
Co
nso
rtiu
m
htt
p:/
/ww
w.ic
mrr
.org
These funds tend to be more volatile than funds holding a diversified portfolio of securities in many industries. Such
concentrated portfolios can produce tremendous gains or losses, depending on whether the chosen sector is in or out
of favour .Sector funds tend to be riskier and more volatile than the broad market because they are less diversified,
although the risk level depends on the specific sector. Some investors choose sector funds when they believe that a
specific sector will outperform the overall market, while others choose sector funds to hedge against other holdings
in a portfolio. Some common sector funds include financial services funds, gold and precious metals funds, health
care funds, and real estate funds, but sector funds exist for just about every sector. Sector funds are mutual funds
which specialize in investing in a few sectors within the market. This allows an investor to focus in on one or two
sectors for investing.
6.2 Technology Funds
The performance of technology funds over the past few months has been disappointing. Says Maheshwari:
―With rising worries over cutbacks in technology spending and the financial sector in turmoil, it might be time to
step away from the domestic IT services companies for now. We are already seeing projects being postponed and
bill rate pressures on companies.‖ On the positive side, though, the rupee‘s depreciation against the dollar is
expected to improve the profitability of tech exporters. Also, the financial crisis has made many western IT
companies attractive for acquisition by Indian tech.
6.3 FMCG Funds
Always considered the most defensive of funds, FMCG funds have looked particularly attractive during the
current turmoil. The average one-year trailing returns of FMCG funds today stand at a negative 26.94 per cent, far
lower than the Nifty‘s returns of a negative 47.03 per cent. Analysts believe the sector is poised for sustained growth
over the medium and long term due to favorable demographics, low penetration, proliferation of modern trade
channels, strong rural growth backed by higher agricultural incomes and the consequent increase in the purchasing
power. Fund managers recommend selective investment in FMCG funds.
6.4 Banking Funds
The monetary tightening by RBI to arrest inflationary pressures had adversely impacted the NAVs of banking
funds, which have recorded negative returns of 40.75 per cent. But the recent rate cuts and liquidity infusion are
expected to boost credit off-take. Another positive trigger could be the imminent reforms in the insurance and
banking sectors. Says Maheshwari: ―After the massive correction in October, valuations in the banking space have
become quite attractive. Taking into account all the factors, we are extremely positive on the sector.‖ As on
November 3, 2008, Reliance Banking Fund, which has over 80 per cent of its investments in financial services
stocks, has given a negative return of 29.66 per cent over the last one year. During the same period, UTI Banking
Sector Fund has given a negative return of 41.39 per cent.
ISSN 2321-0354
Page 33
www.icm
rr.or
g
32
Volume 1, Issue 1 (March, 2013)
INTERCONTINENTAL JOURNAL OF FINANCE RESEARCH REVIEW
Pee
r R
evie
wed
Jo
urn
al o
f In
ter-
Co
nti
nen
tal M
anag
emen
t R
esea
rch
Co
nso
rtiu
m
htt
p:/
/ww
w.ic
mrr
.org
6. ANALYSIS AND INTERPRETATION
DSP BLOCK ROCK TECHNOLOGY FUND
Fund Features
Type of scheme Open ended
nature equity
option growth
Inception date May 16, 2000
Face value 10
Fund size in Rs.cr. 42.99 as on Feb 28,2013
Expense ratio (%) 2.68
Portfolio turnover Ratio (%) 83
Minimum investment : 5000
Entry load : Entry load is 0%.
Exit load : If redeemed bet. 0 months to 12 months; Exit load is 1%.
Period
NAV
(∑x)
Fund
Return(x)
Bench
mark(∑y)
Bench
mark
return(y)
dx
(∑x-x)
dy
(∑y-y)
dx²
dy²
dxdy
6 Months
1 Year
3 Year
5 Year
13.3
13.2
1.7
4.6
8.2
8.2
8.2
8.2
18.7
11.8
7.2
5.5
10.8
10.8
10.8
10.8
5.1
5
-6.5
-3.6
7.9
1
-3.6
-5.3
26.01
25
42.25
12.96
62.41
1
12.96
28.09
40.29
5
23.4
19.08
32.8 43.2 106.22 104.46 87.77
X = ∑x/n = 32.8 / 4
= 8.2
Y = ∑Y / n = 43.2 / 4
= 10.8
Standard Deviation σx = √∑dx² / n
= √106.22 / 4
= √26.55
= 5.15
ISSN 2321-0354
Page 34
www.icm
rr.or
g
33
Volume 1, Issue 1 (March, 2013)
INTERCONTINENTAL JOURNAL OF FINANCE RESEARCH REVIEW
Pee
r R
evie
wed
Jo
urn
al o
f In
ter-
Co
nti
nen
tal M
anag
emen
t R
esea
rch
Co
nso
rtiu
m
htt
p:/
/ww
w.ic
mrr
.org
σy = √∑dy² / n
= √104.46 / 4
= √26.11
= 5.11
Market risk (β)
β = ∑dxdy / ∑dy²
= 87.77 / 104.46
= 0.84
Performance measures
Spi = rp-rf / σx
= 8.2 - 10 / 5.15
= -1.8 / 5.15
= -0.35
tpi = rp-rf / β
= 8.2 – 10 / 0.84
= -1.8 / 0.84
= -2.14
Jenson’s performance measure
jpi = Rf + (Rm-Rf) β
= 10 + (10.8 – 10) 0.84
= 10 + (0.8) 0.84
= 10 + 0.67
= 10.67
Actual return –expected return
= 8.2 + 10.67
= 18.87
ICICI Prudential Technology Fund – Growth
Fund Features
Type of scheme Open ended
nature equity
option growth
Inception date Mar 3, 2000
Face value 10
Fund size in Rs.cr. 110.38 as on Jan 31,2013
Expense ratio (%) 2.49
Portfolio turnover Ratio (%) 20
ISSN 2321-0354
Page 35
www.icm
rr.or
g
34
Volume 1, Issue 1 (March, 2013)
INTERCONTINENTAL JOURNAL OF FINANCE RESEARCH REVIEW
Pee
r R
evie
wed
Jo
urn
al o
f In
ter-
Co
nti
nen
tal M
anag
emen
t R
esea
rch
Co
nso
rtiu
m
htt
p:/
/ww
w.ic
mrr
.org
Minimum investment : 5000
Entry load : Entry load is 0%.
Exit load : If redeemed bet. 0 Year to 1 Year; Exit load is 1%
Period NAV
(∑x)
Fund
Return(x)
Bench
mark(∑y)
Bench
mark
return(y)
dx
(∑x-
x)
dy
(∑y-
y)
dx²
dy²
dxdy
6
Months
1 Year
3 Years
5 Years
12.3
19.7
14.7
10.9
14.4
14.4
14.4
14.4
18.7
11.8
7.2
5.5
10.8
10.8
10.8
10.8
-2.1
5.3
0.3
-3.5
7.9
1
-3.6
-5.3
4.41
28.09
0.09
12.25
62.41
1
12.96
28.09
-16.59
5.3
-1.08
18.55
57.6 43.2 44.84 101.46 6.18
X = ∑x/n
= 57.6 / 4
= 14.4
Y = ∑Y / n
= 43.2 / 4
= 10.8
Standard Deviation
σx = √∑dx² / n
= √44.84 / 4
= √11.21
= 3.35
σy = √∑dy² / n
= √104.46 / 4
= √26.11
= 5.11
Market risk (β)
β = ∑dxdy / ∑dy²
= 6.18 / 104.46
= 0.06
Performance measures
Spi = rp-rf / σx
= 14.4 - 10 / 3.35
= 4.4 / 3.35
= 1.31
ISSN 2321-0354
Page 36
www.icm
rr.or
g
35
Volume 1, Issue 1 (March, 2013)
INTERCONTINENTAL JOURNAL OF FINANCE RESEARCH REVIEW
Pee
r R
evie
wed
Jo
urn
al o
f In
ter-
Co
nti
nen
tal M
anag
emen
t R
esea
rch
Co
nso
rtiu
m
htt
p:/
/ww
w.ic
mrr
.org
tpi = rp-rf / β
= 14.4 – 10 / 0.06
= 4.4 / 0.06
= 73.33
Jenson’s performance measure
jpi = Rf + (Rm-Rf) β
= 10 + (10.8 – 10) 0.06
= 10 + (0.8) 0.06
= 10 + 0.048
= 10.048
Actual return –expected return
= 14.4 + 10.048
= 24.4
SBI Magnum IT fund
Fund Features
Type of scheme Open ended
nature Equity
option Growth
Inception date Jan 1, 1999
Face value 10
Fund size in Rs.cr. 1096.81 as on Jan 31,2013
Expense ratio (%) 2.22
Portfolio turnover Ratio (%) 1.37
Minimum investment : 1000
Entry load : Entry load is 0%.
Exit load : If redeemed bet. 0 Year to 1 Year; Exit load is 1%
NAV
(∑x)
Fund
Return(x)
Bench
mark(∑y)
Bench
mark
return(y)
dx
(∑x-x)
dy
(∑y-y)
dx² dy² dxdy
6 Months
1 Year
3 Years
5 Years
15.9
15.8
10.6
7.3
12.4
12.4
12.4
12.4
17.2
14.3
10.0
14.4
13.97
13.97
13.97
13.97
3.5
3.4
-1.8
-5.1
3.23
0.33
-3.97
0.43
12.25
11.56
3.24
26.01
10.43
0.11
15.76
0.18
11.30
1.12
7.15
-2.19
49.6 55.9 53.06 26.48 17.38
ISSN 2321-0354
Page 37
www.icm
rr.or
g
36
Volume 1, Issue 1 (March, 2013)
INTERCONTINENTAL JOURNAL OF FINANCE RESEARCH REVIEW
Pee
r R
evie
wed
Jo
urn
al o
f In
ter-
Co
nti
nen
tal M
anag
emen
t R
esea
rch
Co
nso
rtiu
m
htt
p:/
/ww
w.ic
mrr
.org
X = ∑x/n
= 49.6 / 4
= 12.4
Y = ∑Y / n
= 55.9 / 4
= 13.97
Standard Deviation σx = √∑dx² / n
= √53.06 / 4
= √13.26
= 3.64
σy = √∑dy² / n
= √26.48 / 4
= √6.62
= 2.57
Market risk (β)
β = ∑dxdy / ∑dy²
= 17.38 / 26.48
= 0.65
Performance measures
Spi = rp-rf / σx
= 12.4 - 10 / 3.64
= 2.4 / 3.64
= 0.66
tpi = rp-rf / β
= 12.4 – 10 / 0.65
= 2.4 / 0.65
= 3.69
Jenson’s performance measure
jpi = Rf + (Rm-Rf) β
= 10 + (13.97 – 10) 0.65
= 10 + (3.97) 0.65
= 10 + 2.58
= 12.58
Actual return –expected return
= 12.4 + 12.58
= 24.98
ISSN 2321-0354
Page 38
www.icm
rr.or
g
37
Volume 1, Issue 1 (March, 2013)
INTERCONTINENTAL JOURNAL OF FINANCE RESEARCH REVIEW
Pee
r R
evie
wed
Jo
urn
al o
f In
ter-
Co
nti
nen
tal M
anag
emen
t R
esea
rch
Co
nso
rtiu
m
htt
p:/
/ww
w.ic
mrr
.org
ANALYSIS OF TECHNOLOGY FUNDS:
Fund name Fund
returns
Std
deviation
(σx)
Benchmark
returns
Benchmark std
deviation(σy)
Market
risk(β)
ICICI PRUDENTIAL
TECHNOLOGY FUND
SBI MAGNUM IT
DSP BLOCK ROCK
TECHNOLOGY FUND
14.4
12.4
8.2
3.35
3.64
5.15
10.8
13.97
1.8
5.11
2.57
5.11
0.06
0.65
0.84
From the above table Analysis we observe the technology fund. ICICI Prudential technology
Fund is giving greater positive returns that i.e. 14.4. It is to be noted that in spite of less standard
deviation, ICICI Prudential technology fund returns are impressive.
ICICI Prudential FMCG - Growth
Fund Features
Type of scheme Open ended
nature equity
option growth
Inception date Mar 30,1999
Face value 10
Fund size in Rs.cr. 214.40 as on Dec 31, 2012
Expense ratio (%) 1.20
Portfolio turnover Ratio (%) 111
Minimum investment : 5000
Entry load : Entry load is 0%.
Exit load : Exit load is 1%
Period NAV
(∑x)
Fund
Return(x)
Bench
mark(∑y)
Bench
mark
return(y)
dx
(∑x-x)
dy
(∑y-y)
dx² dy² dxdy
6 Months
1 Year
3 Years
5 Years
3.6
29.7
25.9
17.5
19.17
19.17
19.17
19.17
8.6
41.0
27.2
-
19.2
19.2
19.2
19.2
-15.57
10.53
6.73
-1.67
-10.6
21.8
8
-19.2
242.42
110.88
45.29
2.79
112.36
475.24
64
368.64
165.04
229.55
53.84
32.06
76.7 76.8 401.38 1020.24 480.49
ISSN 2321-0354
Page 39
www.icm
rr.or
g
38
Volume 1, Issue 1 (March, 2013)
INTERCONTINENTAL JOURNAL OF FINANCE RESEARCH REVIEW
Pee
r R
evie
wed
Jo
urn
al o
f In
ter-
Co
nti
nen
tal M
anag
emen
t R
esea
rch
Co
nso
rtiu
m
htt
p:/
/ww
w.ic
mrr
.org
X = ∑x/n
= 76.7 / 4
= 19.17
Y = ∑Y / n
= 76.8 / 4
= 19.2
Standard Deviation
σx = √∑dx² / n
= √401.38 / 4
= √100.34
= 10.01
σy = √∑dy² / n
= √1020.24 / 4
= √255.06
= 15.97
Market risk (β)
β = ∑dxdy / ∑dy²
= 480.49 / 1020.24
= 0.47
Performance measures
Spi = rp-rf / σx
= 19.17 - 10 / 10.01
= 9.17 / 10.01
= 0.91
tpi = rp-rf / β
= 19.17 – 10 / 0.47
= 9.17 / 0.47
= 19.51
Jenson’s performance measure
jpi = Rf + (Rm-Rf) β
= 10 + (19.2 – 10) 0.47
= 10 + (9.2) 0.47
= 10 + 4.32
= 14.32
Actual return –expected return
= 19.17 + 14.32
= 33.49
ISSN 2321-0354
Page 40
www.icm
rr.or
g
39
Volume 1, Issue 1 (March, 2013)
INTERCONTINENTAL JOURNAL OF FINANCE RESEARCH REVIEW
Pee
r R
evie
wed
Jo
urn
al o
f In
ter-
Co
nti
nen
tal M
anag
emen
t R
esea
rch
Co
nso
rtiu
m
htt
p:/
/ww
w.ic
mrr
.org
SBI magnum FMCG fund.
Fund Features
Type of scheme Open ended
nature equity
option growth
Inception date Jul 31,1999
Face value 10
Fund size in Rs.cr. 149.20 as on Dec.31,2012
Expense ratio (%) 2.61
Portfolio turnover Ratio (%) 72
Minimum investment : 2000
Entry load : Entry load is 0%.
Exit load : Exit load is 1%
Period NAV
(∑x)
Fund
Return(x)
Bench
mark(∑y)
Bench
mark
return(y)
dx (∑x-
x)
dy (∑y-
y)
dx² dy² dxdy
6 Months
1 Year
3 Years
5 Years
10.6
41.0
30.2
26.3
27.02
27.02
27.02
27.02
7.5
38.4
27.1
21.4
23.6
23.6
23.6
23.6
-16.42
13.98
3.18
-0.72
-16.1
14.8
3.5
-2.2
269.61
195.44
10.11
0.51
259.21
219.04
12.25
4.84
264.36
206.90
11.13
1.58
108.1 94.4 475.67 495.34 483.37
X = ∑x/n
= 108.1 / 4
= 27.02
Y = ∑Y / n
= 94.4 / 4
= 23.6
Standard Deviation
σx = √∑dx² / n
= √475.67 / 4
= √118.91
= 10.90
σy = √∑dy² / n
= √495.34 / 4
= √123.83
= 11.13
ISSN 2321-0354
Page 41
www.icm
rr.or
g
40
Volume 1, Issue 1 (March, 2013)
INTERCONTINENTAL JOURNAL OF FINANCE RESEARCH REVIEW
Pee
r R
evie
wed
Jo
urn
al o
f In
ter-
Co
nti
nen
tal M
anag
emen
t R
esea
rch
Co
nso
rtiu
m
htt
p:/
/ww
w.ic
mrr
.org
Market risk (β)
β = ∑dxdy / ∑dy²
= 483.37 / 495.34
= 0.97
Performance measures
Spi = rp-rf / σx
= 27.02 - 10 / 10.90
= 17.02 / 10.90
= 1.56
tpi = rp-rf / β
= 27.02 – 10 / 0.97
= 17.02 / 0.97
= 17.55
Jenson’s performance measure
jpi = Rf + (Rm-Rf) β
= 10 + (23.6 – 10) 0.97
= 10 + (13.6) 0.97
= 10 + 13.19
= 23.19
Actual return –expected return
= 27.02 + 23.19
= 50.21
Analysis of FMCG (Fast Moving Consumer Goods) funds
Fund name Fund returns Std deviation
(σx)
Benchmark
returns
Benchmark std
deviation(σy)
Market
risk(β)
SBI magnum
FMCG Fund
ICICI
prudential
FMCG Fund
27.02
19.17
10.90
10.01
23.6
19.2
11.13
15.97
0.97
0.47
From the above table FMCG sector both SBI magnum FMCG fund and ICICI prudential FMCG fund are giving
positive returns.
Though the standard deviation for SBI Magnum is more, yet the returns from SBI Magnum are better compare
to ICICI Prudential FMCG fund. It is to be noted that SBI Magnum FMCG fund is having a maximum market risk.
ISSN 2321-0354
Page 42
www.icm
rr.or
g
41
Volume 1, Issue 1 (March, 2013)
INTERCONTINENTAL JOURNAL OF FINANCE RESEARCH REVIEW
Pee
r R
evie
wed
Jo
urn
al o
f In
ter-
Co
nti
nen
tal M
anag
emen
t R
esea
rch
Co
nso
rtiu
m
htt
p:/
/ww
w.ic
mrr
.org
UTI Banking Fund – Growth
Fund Features
Type of scheme Open ended
nature equity
option growth
Inception date Mar 9, 2004
Face value 10
Fund size in Rs.cr. 351.78 as on Feb 28, 2013
Expense ratio (%) 2.32
Portfolio turnover Ratio (%) 169
Minimum investment : 5000
Entry load : Entry load is 0%.
Exit load : If redeemed bet. 0 Year to 1 Year; Exit load is 1%
Period
NAV
(∑x)
Fund
Return(x)
Bench
mark(∑y)
Bench
mark
return(y)
dx
(∑x-
x)
dy
(∑y-
y)
dx²
dy²
dxdy
6 Months
1 Year
3 Years
5 Years
20.8
13.5
10.5
11.9
14.17
14.17
14.17
14.7
20.2
16.1
10.1
10.9
14.32
14.32
14.32
14.32
6.63
-0.67
-3.67
-2.27
5.88
1.78
-4.22
-3.42
43.96
0.45
13.47
5.15
34.57
3.17
17.81
11.70
38.98
-1.19
15.49
7.76
56.7 57.3 63.03 67.25 61.04
X = ∑x/n
= 56.7 / 4
= 14.17
Y = ∑Y / n
= 57.3 / 4
= 14.32
Standard Deviation σx = √∑dx² / n
= √63.03 / 4
= √15.75
= 3.97
σy = √∑dy² / n
= √67.25 / 4
= √16.81
= 4.1
ISSN 2321-0354
Page 43
www.icm
rr.or
g
42
Volume 1, Issue 1 (March, 2013)
INTERCONTINENTAL JOURNAL OF FINANCE RESEARCH REVIEW
Pee
r R
evie
wed
Jo
urn
al o
f In
ter-
Co
nti
nen
tal M
anag
emen
t R
esea
rch
Co
nso
rtiu
m
htt
p:/
/ww
w.ic
mrr
.org
Market risk (β)
β = ∑dxdy / ∑dy²
= 61.04 / 67.25
= 0.91
Performance measures
Spi = rp-rf / σx
= 14.17 - 10 / 3.97
= 4.17 / 3.97
= 1.05
tpi = rp-rf / β
= 14.17 – 10 / 0.91
= 4.17 / 0.91
= 4.58
Jenson’s performance measure
jpi = Rf + (Rm-Rf) β
= 10 + (14.32 – 10) 0.91
= 10 + (4.32) 0.91
= 10 + 3.93
= 13.93
Actual return –expected return
= 14.17 + 13.93
= 28.1
Reliance Banking Fund – Growth
Fund Features
Type of scheme Open ended
nature equity
option growth
Inception date May 26,2003
Face value 10
Fund size in Rs.cr. 1968.72 as on Jan 31, 2013
Expense ratio (%) 1.93
Portfolio turnover Ratio (%) 57
Minimum investment : 5000
Entry load : Entry load is 0%.
Exit load : If redeemed bet. 0 Year to 1 Year Exit load is 1%.
ISSN 2321-0354
Page 44
www.icm
rr.or
g
43
Volume 1, Issue 1 (March, 2013)
INTERCONTINENTAL JOURNAL OF FINANCE RESEARCH REVIEW
Pee
r R
evie
wed
Jo
urn
al o
f In
ter-
Co
nti
nen
tal M
anag
emen
t R
esea
rch
Co
nso
rtiu
m
htt
p:/
/ww
w.ic
mrr
.org
Period NAV
(∑x)
Fund
Return(x)
Bench
mark(∑y)
Bench
mark
return(y)
dx
(∑x-
x)
dy
(∑y-y)
dx² dy² dxdy
6 Months
1 Year
3 Years
5 Years
22.5
17.0
13.6
15.6
17.17
17.17
17.17
17.17
20.2
16.1
10.1
10.9
14.32
14.32
14.32
14.32
5.33
-0.17
-3.57
-1.57
5.88
1.78
-4.22
-3.42
28.41
0.03
12.74
2.46
34.57
3.17
17.81
11.70
31.34
-0.30
15.06
5.37
68.7 57.3 43.64 67.25 51.47
X = ∑x/n
= 68.7 / 4
= 17.17
Y = ∑Y / n
= 57.3 / 4
= 14.32
Standard Deviation σx = √∑dx² / n
= √43.64 / 4
= √10.91
= 3.30
σy = √∑dy² / n
= √67.25 / 4
= √16.81
= 4.1
Market risk (β)
β = ∑dxdy / ∑dy²
= 51.47 / 67.25
= 0.76
Performance measures
Spi = rp-rf / σx
= 17.17 - 10 / 3.30
= 7.17 / 3.30
= 2.17
tpi = rp-rf / β
= 17.17 – 10 / 0.76
= 7.17 / 0.76
= 9.43
ISSN 2321-0354
Page 45
www.icm
rr.or
g
44
Volume 1, Issue 1 (March, 2013)
INTERCONTINENTAL JOURNAL OF FINANCE RESEARCH REVIEW
Pee
r R
evie
wed
Jo
urn
al o
f In
ter-
Co
nti
nen
tal M
anag
emen
t R
esea
rch
Co
nso
rtiu
m
htt
p:/
/ww
w.ic
mrr
.org
Jenson’s performance measure
jpi = Rf + (Rm-Rf) β
= 10 + (14.32 – 10) 0.76
= 10 + (4.32) 0.76
= 10 + 3.28
= 13.28
Actual return –expected return
= 17.17 + 13.28
= 30.45
Analysis of Banking funds:
Fund name Fund
returns
Std
deviation
(σx)
Benchmark
returns
Benchmark std
deviation(σy)
Market
risk(β)
Reliance Banking
Fund
UTI Banking fund
17.17
14.17
3.30
3.97
14.32
14.32
4.1
4.1
0.76
0.91
From the above table if we observe the performance of the banking fund. Both the banking funds (UTI banking
fund and Reliance banking fund) are giving Positive returns. Though this standard deviation for UTI banking fund
is greater than RELIANCE baking fund, the returns from RELIANCE banking fund are better compare to UTI
banking fund.
8.FINDINGS
As far as IT sector funds are taken into consideration, ICICI Prudential technology fund is giving more
positive return, when compared to SBI magnum IT and DSP Black rock technology fund.
The performance ICICI Prudential technology fund is very impressive according to Sharpe performance
index, Tyner‘s performance index and Jensen‘s performance index. And ranks in first position followed by
SBI magnum IT fund, DSP Black rock technology fund respectively.
In the FMCG sectors, both the funds under study i.e., SBI FMCG and ICICI prudential FMCG are giving
Positive returns.
Inspite of high standard deviation for SBI Magnum FMCG. The performance is good with high returns
compared to ICICI FMCG.
Coming to banking sector both UTI and Reliance banking funds are giving Positive returns. Inspite of less
standard deviation for Reliance banking fund, the returns are better. When compared to UTI banking fund.
The performance of Reliance banking fund is satisfactory, according to Sharpe performance index, treynor
performance index and Jensen‘s performance index.
ISSN 2321-0354
Page 46
www.icm
rr.or
g
45
Volume 1, Issue 1 (March, 2013)
INTERCONTINENTAL JOURNAL OF FINANCE RESEARCH REVIEW
Pee
r R
evie
wed
Jo
urn
al o
f In
ter-
Co
nti
nen
tal M
anag
emen
t R
esea
rch
Co
nso
rtiu
m
htt
p:/
/ww
w.ic
mrr
.org
9. SUGGESTIONS
1. SBI Magnum IT fund and DSP Black rock technology should try to reduce unsystematic risk, in order to perform
well.
2. To improve Sharpe‘s performance index the unsystematic risk should be eliminated.
3. ICICI prudential FMCG fund perform well when compared to SBI Magnum FMCG. Because of low
unsystematic risk as well as low systematic risk.
4. SBI Magnum FMCG fund should diversify unsystematic risk in order to perform well.
5. The Sharpe performance index, treynor performance index of the SBI Magnum fund can be improved only, if
these two funds returns are improved. These can be achieved only if unsystematic risk is reduced.
6. To improve the performance of banking funds, the unsystematic risk should be diversified.
7. Though the market risk for FMCG fund is less, the performance is satisfactory, the variations are too high, when
compared to other hands
10. CONCLUSION
There has been a flurry of mutual fund products which are "sectoral funds". These funds restrict
themselves to only investing in one sector. And IT sectoral fund would only buy IT stocks "Sector funds are ideally
suited for informed investors seeking growth in a time horizon of three to five years through investment in shares of
well-managed companies with good prospects, sector funds are purely for those investors who are well informed
about the sector. They are more risky, but if one stays invested for a longer period, the return potential can be very
attractive "It is fine to invest in a sector if one knows about it and has the risk taking capacity. But even then,
sectoral allocation should be done, looking at a fund's track record and their portfolio allocation.To sum it up,
having a sectoral allocation is alright if one knows the sector well enough and has the risk-taking ability. However,
even then, it won't be a bad idea to diversify your risks through investing in a variety of fund types and thus a
reduction in overall risk. After all, why put all your eggs in one basket?
11. BIBILOGRAPHY
Magazines & Newspapers
Business today
India today
Business world
The Hindu
Business Line
The Economic Times
Deccan Chronicle
ISSN 2321-0354
Page 47
www.icm
rr.or
g
46
Volume 1, Issue 1 (March, 2013)
INTERCONTINENTAL JOURNAL OF FINANCE RESEARCH REVIEW
Pee
r R
evie
wed
Jo
urn
al o
f In
ter-
Co
nti
nen
tal M
anag
emen
t R
esea
rch
Co
nso
rtiu
m
htt
p:/
/ww
w.ic
mrr
.org
Text Books
Investment Policy and performance of mutual funds---M.Jayadev
Mutual Funds Management and working--Lalitb K. Bansal
Mutual Funds in India----S.Krishnamurthy
Websites
www.amfiindia.com
www. mutualfundsIndia .com
www.moneycontrol.com
www.indiacapital.com
ISSN 2321-0354
Page 48
www.icm
rr.or
g
47
Volume 1, Issue 1 (March, 2013)
INTERCONTINENTAL JOURNAL OF FINANCE RESEARCH REVIEW
Peer
Rev
iew
ed Jo
urna
l of I
nter
-Con
tinen
tal M
anag
emen
t Res
earc
h Co
nsor
tium
http
://w
ww
.icm
rr.o
rg
A COMPARATIVE STUDY ON WORKING CAPITAL MANAGEMENT OF PAINT
COMPANIES WITH SPECIAL REFERENCE TO BERGER PAINTS INDIA LIMITED
AND KANSAI NEROLAC PAINTS LIMITED - HOSUR
S. GOKULAKRISHNAN
Research Scholar, Department of Management Studies, MS University, Tirunelveli.
ABSTRACT
Working capital is that part of capital which is required to meet the day to day needs in running the
business. It is required for the purchase of raw material, meeting the day to day expenses such as
salaries, rent, stationery etc. Capital is also required to keep the stock of partly and fully finished
products. Working capital generally involves the use of short term funds in business and is regularly
converted into cash. To analyze the working capital management of Berger Paints India Limited, Hosur,
and Kansai Nerolac Paints Limited, Hosur. To study the profitability position, efficiency and
liquidity position and to find out the short term and long term solvency position of the
companies.To offer suggestions and recommendations for the improvement of performance of
Berger Paints India Limited, Hosur, and Kansai Nerolac Paints Limited, Hosur.
Keywords: profitability position, Working capital
1. INTRODUCTION
Working capital is that part of capital which is required to meet the day to day needs in running the
business. It is required for the purchase of raw material, meeting the day to day expenses such as salaries,
rent, stationery etc. Capital is also required to keep the stock of partly and fully finished products.
Working capital generally involves the use of short term funds in business and is regularly converted into
cash.
Efficient management of working capital is very much important for the success of the company.
Working capital management refers to the management of current assets and current liabilities to
maintain liquidity / solvency. Operating cycle involves the following five stages:
1. Conversion of cash into raw materials
2. Conversion of raw materials into work-in-progress
A Peer Reviewed International Journal
IJFRR
INTERCONTINENTAL JOURNAL OF FINANCE RESEARCH REVIEW
ISSN 2321-0354
Page 49
www.icm
rr.or
g
48
Volume 1, Issue 1 (March, 2013)
INTERCONTINENTAL JOURNAL OF FINANCE RESEARCH REVIEW
Peer
Rev
iew
ed Jo
urna
l of I
nter
-Con
tinen
tal M
anag
emen
t Res
earc
h Co
nsor
tium
http
://w
ww
.icm
rr.o
rg
3. Conversion of work-in-progress into finished goods
4. Conversion of finished goods into accounts receivable
5. Conversion of accounts receivables into cash.
1.2 CLASSIFICATION OF WORKING CAPITAL
Gross Working Capital
Gross working capital refers to the firm‘s investment in current assets, that is the total
of current asset is called Gross working capital.
Net Working Capital
Under this concept, the net working capital means excess of current assets over
current liabilities.
Fixed or Permanent Working Capital
Every manufacturer, from his records, could calculate the necessary amount required from point of
production to the point of sale and its remittance. The total amount of funds required for keeping current
like cash, raw materials and finished goods, accounts receivable, accounts payable, etc., will represent the
amount of working capital required. This is the permanent working capital.
Primary Working Capital
This represents that part of the working capital which is irreducible any further. It is the basic minimum
working capital required for keeping raw material and making payments of expenses like wages, rents,
etc. The total value of these basic minimum current assets represents the amount of working capital called
primary working capital.
Normal Working Capital
It is required to maintain the operations of a company at an average normal level during a period in which
business conditions are normal. The average normal requirements may be different for different periods.
Variable Working Capital
During the busy periods, current assets have to be expanded and more working capital is required for the
purpose meeting the increasing need of finance. In slack periods the volume of current assets has to be
constricted and consequently less working capital is required. This amount by which working capital
expands or contracts is known as variable working capital.
Seasonal Working Capital
Most products are sensitive to seasonal demand and a manufacturer working for profit cannot but meet
this additional demand. This is made more complicated by the fact that most of the raw materials are
available only in certain seasons of the year e.g., cotton, jute, sugarcane, etc. The capital needed for this
reason is known as seasonal working capital.
ISSN 2321-0354
Page 50
www.icm
rr.or
g
49
Volume 1, Issue 1 (March, 2013)
INTERCONTINENTAL JOURNAL OF FINANCE RESEARCH REVIEW
Peer
Rev
iew
ed Jo
urna
l of I
nter
-Con
tinen
tal M
anag
emen
t Res
earc
h Co
nsor
tium
http
://w
ww
.icm
rr.o
rg
Special or emergency working capital
This type of capital is needed to meet certain contingencies that are common in any type of business. The
need for such kind of capital arises during very strange situations caused by floods, droughts and other
natural calamities which destroy current assets.
1.3 REVIEW OF LITERATURE
The purpose of this chapter is to present a review of literature relating to the working capital management.
A number of studies on working capital management have been conducted in India which is discussed
below.
The first, small but fine piece of work is the study conducted by National Council of Applied Economic
Research (NCAER) in 1966 with reference to working capital management in three industries namely
cement, fertilizer and sugar. The study revealed that inventory constituted a major portion of working
capital i.e. 74.06 per cent in the sugar industry followed by cement industry (63.1%) and fertilizer
industry (59.58%). As regards financing of working capital, the study showed that internal sources had
contributed very little towards the financing of working capital. It was 11.87 per cent in the cement
industry, 15.03 per cent in sugar and 31.25 per cent in fertilizer industry, 17.78 per cent being the average.
However, this study failed to put into sharp focus the various problems involved in the management of
specific working capital accounts.
Misra (1975) studied the problems of working capital with special reference to six selected public sector
undertakings in India over the period 1960-61 to 1967-68. Analysis of financial ratios and responses to a
questionnaire revealed somewhat the same results as those of NCAER study with respect to composition
and utilization of working capital. The study further revealed the overstocking of inventory in regard to its
each component, very low receivables turnover and more cash than warranted by operational
requirements and thus total mismanagement of working capital in public sector undertakings.
Agarwal (1983) also studied working capital management on the basis of sample of 34 large
manufacturing and trading public limited companies in ten industries in private sector for the period
1966-67 to 1976-77. Applying the same techniques of ratio analysis, responses to questionnaire and
interview, the study concluded the although the working capital per rupee of sales showed a declining
trend over the years but still there appeared a sufficient scope for reduction in investment in almost all the
segments of working capital. An upward trend in cash to current assets ratio and a downward trend in
cash turnover showed the accumulation of idle cash in these industries. Almost all the industries had
overstocking of raw materials shown by increase in the share of raw material to total inventory while
share of semi-finished and finished goods came down. It also revealed that long-term funds as a
percentage of total working capital registered an upward trend, which was mainly due to restricted flow of
bank credit to the industries.
Inventory, in most industries, accounts for the largest proportion of gross working capital. A number of
studies, therefore, have been conducted to find the determinants of investment in inventories. The
following discussion provides a brief review of studies, dealing with factors influencing investments in
inventory in India.
Sastry‘s study (1966) was a cross section analysis of total inventories of companies across several
heterogeneous industries for the period 1955-60 using balance sheet data of public limited companies in
the private sector. The study brought out the importance of accelerator represented by change in sales. It
ISSN 2321-0354
Page 51
www.icm
rr.or
g
50
Volume 1, Issue 1 (March, 2013)
INTERCONTINENTAL JOURNAL OF FINANCE RESEARCH REVIEW
Peer
Rev
iew
ed Jo
urna
l of I
nter
-Con
tinen
tal M
anag
emen
t Res
earc
h Co
nsor
tium
http
://w
ww
.icm
rr.o
rg
also showed negative influence of fixed inventory investment.
Krishnamurty and Sastry‘s study in 1970was perhaps the most comprehensive study on manufacturers‘
inventories. They used CMI data and the consolidated balance sheet data of public limited companies
published by RBI, to analyse each of the major components i.e. raw material, goods-in-process and
finished goods for 21 industries over the period 1946-62. It was a time series study but some inter-
industry cross section analysis had also been done. Accelerator represented by change in sales, bank
finance and short-term interest rate were found to be important determinants. Utilisation of productive
capacity and price anticipations had been found to be of some relevance.
The study by Vinod Prakash (1970) was a time series analysis with mostly undeflated data taken from
CMI and Annual Survey of Industries (ASI) for the period 1946-63. It examined the influence of
structural changes in manufacturing activity on the relative size and composition of inventory in the large
scale-manufacturing sector in India. Three different models for industry groups and for six important
individual industries had been tried. Output/sales, capacity utilization, short-term rate of interest, money
supply, foreign exchange availability, and price index, size and time trend were taken as explanatory
variable. The flexible accelerator models were found to be inferior. The impact of price index was found
to be generally insignificant, while the impact of foreign exchange and money supply was absent. The
rate of interest showed a perverse impact. Time trend appeared to be important than the size of
establishment. The role of availability of funds was completely ignored in this study.
The study by R.N. Agarwal (1982) estimated total inventory investment equation for individual firms in
automobile manufacturing industry, which was divided into two sectors car-sector and non car-sector. His
study was based on the data for 1959-60 through 1978-79. Official Directory of Mumbai Stock Exchange
had been the basic source of data. Analysis of two sector revealed that sales and stock-sales ratio were
important explanatory variables. Cost of capital and trend were important in only car sector while fixed
investment and flows of external funds were significant in non-car sector. Existing stock of inventories
was statistically significant in both the sector but contrary to expectations, it possessed negative
coefficient. Several other variables as dividends, capacity utilization and liquidity ratio were found to be
of no importance in explaining inventory investment behaviour.
Adesh Sharma(1994) applied accelerator model with financial variables to determine the factors
influencing investment in inventories in pesticides industry in India. Data had been taken from the Stock
Exchange Official Directory, Mumbai for the period 1978-1992 in respect of 18 firms in this industry.
The coefficients of the accelerator and financial variables were found to be significant and positive. The
coefficient of inventory of inventory stock was significant and negative.
There have been many studies exploring the determinants of inventory investment; no attempt has been
made to study the factors influencing investment in total working capital. On the basis of previous
studies, the present study aims at filling this gap.
2. OBJECTIVES OF THE STUDY
2.1 OBJECTIVES OF THE STUDY
Primary objectives
To analyze the working capital management of Berger Paints India Limited, Hosur, and Kansai
Nerolac Paints Limited, Hosur.
ISSN 2321-0354
Page 52
www.icm
rr.or
g
51
Volume 1, Issue 1 (March, 2013)
INTERCONTINENTAL JOURNAL OF FINANCE RESEARCH REVIEW
Peer
Rev
iew
ed Jo
urna
l of I
nter
-Con
tinen
tal M
anag
emen
t Res
earc
h Co
nsor
tium
http
://w
ww
.icm
rr.o
rg
Secondary objectives
1. To study the profitability position
2. The study the efficiency and liquidity position
3. To find out the short term and long term solvency position
4. To offer suggestions and recommendations for the improvement of performance of Berger
Paints India Limited, Hosur, and Kansai Nerolac Paints Limited, Hosur.
2.2 LIMITATIONS OF THE STUDY:
The working capital management analysis of the organizations fully depends on secondary
data
Some data were not provided by the company due to confidentiality
The working capital analysis is made for the two organizations under study. The results are
not applicable to other organizations.
Financial performance is analyzed based on annual financial statements. Hence any changes
that take place in the middle of the year may not be fully reflected in the year end accounts.
3. RESEARCH METHODOLOGY
3.1 RESEARCH DESIGN
The research design is the conceptual structure within which research will be conducted.
Design includes an outline of what the researcher will do from writing the hypothesis and its
operational implications to the final analysis of the data.
Since the study includes analyzing the fluctuations to revenue in the organization and the
working capital management of the company, the study is based on analytical type of the
research. Analytical research is based on facts or information already available and the
researcher makes a detailed analysis of those data to make a critical evaluation.
3.2 DATA COLLECTION METHOD
Both primary and secondary data were collected for the study. Primary data is first
hand information obtained through interaction with various department heads in their respective
areas. Secondary data is the data collected from annual reports, published financial statement
books, magazines and internet browsing, profile of the company.
3.3 TOOLS USED FOR DATA ANALYSIS
The tools used in the analysis of working capital are:
Ratio Analysis
Liquidity Ratio
Current Ratio
Liquidity Ratio
Absolute Liquidity Ratio
ISSN 2321-0354
Page 53
www.icm
rr.or
g
52
Volume 1, Issue 1 (March, 2013)
INTERCONTINENTAL JOURNAL OF FINANCE RESEARCH REVIEW
Peer
Rev
iew
ed Jo
urna
l of I
nter
-Con
tinen
tal M
anag
emen
t Res
earc
h Co
nsor
tium
http
://w
ww
.icm
rr.o
rg
Turnover Ratio
Working Capital Turnover Ratio
Debtors Turnover Ratio
Debt Collection Period
Stock Turnover Ratio
Stock Conversion Period
Creditors Turnover Ratio
Debt Payment Period
Cash to Current Assets
Inventories to Current Assets
Schedule of Changes in Working Capital
Trend Analysis
4.0 DATA ANALYSIS AND INTERPRETATION
4.1 RATIO ANALYSIS
4.1.1 Current Ratio
This ratio is an indicator of the firm‘s commitment to meet its short-term liabilities. An
ideal current ratio is 2. The current ratio is an index of the concern‘s financial stability. The
formula is:
Table No. 4.1.1 – Current Ratio
Rs in ‗000
Year
Berger Paints India Limited Kansai Nerolac Paints Limited
Current
Asset
Current
Liabilities Times
Current
Asset
Current
Liabilities Times
2007 4639982 2134450 2.17 4609100 2014600 2.29
2008 5266451 2304703 2.28 4678676 2525949 1.85
2009 5383091 2385081 2.26 4980777 3280836 1.52
2010 5900138 3176802 1.86 5619861 3979985 1.41
2011 8203228 4082918 2.01 7042845 4726512 1.49
Source: Annual Reports
Interpretation
The above table reveals that the current ratio is adequate, so the liquidity position of
Berger Paints India Limited is satisfactory. But the current ratio of Kansai Nerolac Paints Limited
is not satisfactory, because an ideal current ratio is 2.
ISSN 2321-0354
Page 54
www.icm
rr.or
g
53
Volume 1, Issue 1 (March, 2013)
INTERCONTINENTAL JOURNAL OF FINANCE RESEARCH REVIEW
Peer
Rev
iew
ed Jo
urna
l of I
nter
-Con
tinen
tal M
anag
emen
t Res
earc
h Co
nsor
tium
http
://w
ww
.icm
rr.o
rg
4.1.2 Liquidity Ratio
This ratio is also termed as ‗acid test‘ ratio or ‗quick‘ ratio. This ratio is ascertained by
comparing the liquid assets (i.e. assets which are immediately convertible into cash without loss)
to current liabilities. Prepaid expenses and stock are not taken as liquid assets. The formula is:
Table No. 4.1.2 – Liquid Ratio
Rs in ‗000
Year
Berger Paints India Limited Kansai Nerolac Paints Limited
Liquid
Asset
Current
Liabilities Times
Liquid
Asset
Current
Liabilities Times
2007 2119288 2134450 0.99 2804900 2014600 1.39
2008 2575497 2304703 1.12 2944565 2525949 1.17
2009 2719780 2385081 1.14 3274438 3280836 1.00
2010 2906868 3176802 0.91 3145417 3979985 0.79
2011 4164042 4082918 1.02 3501820 4726512 0.74
Source: Annual Reports
Interpretation
The ideal ratio is 1. The above table shows that the liquid ratio is less than the ideal value
of 1 in the years 2010 for Berger Paints India Limited and in the years 2010 & 2011 for Kansai
Nerolac Paints Limited. So the short-term solvency position of both the companies need to be
imporoved. Further analysis reveals that the major portion of current assets is in the form of
inventories in both the cases.
4.1.3 Absolute Liquid Ratio
Although receivables, like debtors and bills receivable are generally more liquid than
inventories, yet there may be doubts regarding their realization into cash immediately or in time.
Hence, some analyst exclude even receivables from the current assets and find out the absolute
liquid ratio. The formula is:
ISSN 2321-0354
Page 55
www.icm
rr.or
g
54
Volume 1, Issue 1 (March, 2013)
INTERCONTINENTAL JOURNAL OF FINANCE RESEARCH REVIEW
Peer
Rev
iew
ed Jo
urna
l of I
nter
-Con
tinen
tal M
anag
emen
t Res
earc
h Co
nsor
tium
http
://w
ww
.icm
rr.o
rg
Table No. 4.1.3 – Absolute Liquid Ratio
Rs in ‗000
Year
Berger Paints India Limited Kansai Nerolac Paints Limited
Absolute
Liquid
Asset
Current
Liabilities Times
Absolute
Liquid
Asset
Current
Liabilities Times
2007 217427 2134450 0.10 214900 2014600 0.11
2008 399003 2304703 0.17 333754 2525949 0.13
2009 318695 2385081 0.13 761639 3280836 0.23
2010 375641 3176802 0.12 410825 3979985 0.10
2011 1229233 4082918 0.30 396906 4726512 0.08
Source: Annual Reports
Interpretation
The ideal ratio 0.5:1 from the above table, it is seen that the absolute liquid ratio position
is not good for both companies.
4.1.4 Working Capital Turnover Ratio
This ratio indicates whether or not working capital has been effectively utilized in
making sales. This ratio indicates the number of times the working capital is turned over in the
course of a year. A higher ratio indicates efficient utilization of working capital and a low ratio
indicates inefficiency. Formula for calculating this ratio is as follows:
Table No. 4.1.4 – Working Capital Turnover Ratio
Rs in ‗000
Year
Berger Paints India Limited Kansai Nerolac Paints Limited
Sales Working
Capital Times Sales
Working
Capital Times
2007 11651164 2505532 4.65 12874800 2594500 4.96
2008 13396688 2961748 4.52 13197501 2152727 6.13
2009 15083357 2998010 5.03 13745192 1699941 8.09
2010 16841669 2723336 6.18 17063836 1639876 10.40
2011 20962243 4120310 5.09 21387302 2316333 9.23
Source: Annual Reports
ISSN 2321-0354
Page 56
www.icm
rr.or
g
55
Volume 1, Issue 1 (March, 2013)
INTERCONTINENTAL JOURNAL OF FINANCE RESEARCH REVIEW
Peer
Rev
iew
ed Jo
urna
l of I
nter
-Con
tinen
tal M
anag
emen
t Res
earc
h Co
nsor
tium
http
://w
ww
.icm
rr.o
rg
Interpretation
From the table it is understood that working capital is effectively utilized by the Kansai
Nerolac Paints India Limited, but in Berger Paints India Limited somewhat not satisfactory.
4.1.5 Debtors Turnover Ratio
The quality of debtors to a great extent determines a firm‘s liquidity. The debtor‘s
turnover ratio is calculated as under:
Sales to accounts receivable ratio indicates the efficiency of collection of book debts.
Higher the ratio, better it is, since it would indicate that debts are being collected promptly. For
measuring the efficiency, it is necessary, to establish a standard.
Table No. 4.1.5 – Debtors Turnover Ratio
Rs in ‗000
Year Berger Paints India Limited Kansai Nerolac Paints Limited
Credit Sales Debtors Times Credit Sales Debtors Times
2007 11651164 1435218 8.11 12874800 1946900 6.61
2008 13396688 1584355 8.45 13197501 2129330 6.20
2009 15083357 1803799 8.36 13745192 2095729 6.55
2010 16841669 2047298 8.22 17063836 2323662 7.34
2011 20962243 2402882 8.72 21387302 2602599 8.22
Source: Annual Reports
Interpretation
The above table reveals a satisfactory position of debtor‘s turnover in both the
companies. But in Berger effectively manages its debtors when compared to Kansai Nerolac.
4.1.6 Debt Collection Period
Debtor‘s collection period measures the quality of debtors since it measures the rapidity
or slowness with which money is collected from them. A shorter collection period implies prompt
payment by debtors. It reduces the chances of bad debts. A longer collection period implies too
liberal and inefficiency in credit collection. The formula for calculating the ratio is:
ISSN 2321-0354
Page 57
www.icm
rr.or
g
56
Volume 1, Issue 1 (March, 2013)
INTERCONTINENTAL JOURNAL OF FINANCE RESEARCH REVIEW
Peer
Rev
iew
ed Jo
urna
l of I
nter
-Con
tinen
tal M
anag
emen
t Res
earc
h Co
nsor
tium
http
://w
ww
.icm
rr.o
rg
Table No. 4.1.6 – Debt Collection Period
Rs in ‗000
Year
Berger Paints India Limited Kansai Nerolac Paints Limited
Days in a
year
Debtors
Turnover Times
Days in a
year
Debtors
Turnover Times
2007 365 8.11 45 365 6.61 55
2008 365 8.45 43 365 6.20 59
2009 365 8.36 44 365 6.55 56
2010 365 8.22 44 365 7.34 50
2011 365 8.72 42 365 8.22 44
Source: Annual Reports
Interpretation
The above table reveals the period taken by both the companies to convert its receivables
into cash in the each year under study. Kansai Nerolac takes more days to convert its receivables
into cash when compared to Berger.
4.1.7 Stock Turnover Ratio
This ratio indicates whether investments in inventory are efficiently used or not. A high
inventory turnover indicates efficient management of inventory because more frequently the
stocks are sold, the lesser is the amount of money required to finance the inventory; the ratio is
calculated as follows:
Table No. 4.1.7 – Stock Turnover Ratio
Rs in ‗000
Year
Berger Paints India Limited Kansai Nerolac Paints Limited
Net Sales Average
Inventory Times Net Sales
Average
Inventory Times
2007 11651164 1260347 9.24 12874800 902100 14.27
2008 13396688 1345477 9.96 13197501 867055 15.22
2009 15083357 1331655 11.34 13745192 853169 16.11
2010 16841669 1496635 11.25 17063836 1237222 13.79
2011 20962243 2019593 10.38 21387302 1770512 12.08
Source: Annual Reports
ISSN 2321-0354
Page 58
www.icm
rr.or
g
57
Volume 1, Issue 1 (March, 2013)
INTERCONTINENTAL JOURNAL OF FINANCE RESEARCH REVIEW
Peer
Rev
iew
ed Jo
urna
l of I
nter
-Con
tinen
tal M
anag
emen
t Res
earc
h Co
nsor
tium
http
://w
ww
.icm
rr.o
rg
Interpretation
It is seen from the above table that the inventory is effectively controlled by both the companies.
But Kansai Nerolac is more effectively managing its inventory level when compared to Berger Paints.
4.1.8 Stock Conversion Period Ratio
This ratio indicates the time taken to clear the stock. With the help of this ratio the
management can draw the stock clearing plan. The formula for calculating this ratio is:
Table No. 4.1.8 – Stock Conversion Period Ratio
Rs in ‗000
Year
Berger Paints India Limited Kansai Nerolac Paints Limited
Days in a
year
Stock Turnover
Ratio Times
Days in a
year
Stock Turnover
Ratio Times
2007 365 9.24 40 365 14.27 26
2008 365 9.96 37 365 15.22 24
2009 365 11.34 32 365 16.11 23
2010 365 11.25 32 365 13.79 26
2011 365 10.38 35 365 12.08 30
Source: Annual Reports
Interpretation
From the table it is understood that the number days taken to clear the stock is more in
the both companies. But Kansai Nerolac is more effectively clearing its stocks when compared to
Berger.
4.1.9 Creditors Turnover Ratio
It indicates the speed with which the payments for credit purchases are made to the
creditors. A higher creditor‘s turnover ratio signifies that the creditors are being paid promptly
thus enhancing the creditworthiness of the company. Since credit purchase is not known, the total
purchase is taken as credit purchase for calculation.
ISSN 2321-0354
Page 59
www.icm
rr.or
g
58
Volume 1, Issue 1 (March, 2013)
INTERCONTINENTAL JOURNAL OF FINANCE RESEARCH REVIEW
Peer
Rev
iew
ed Jo
urna
l of I
nter
-Con
tinen
tal M
anag
emen
t Res
earc
h Co
nsor
tium
http
://w
ww
.icm
rr.o
rg
Table No. 4.1.9 – Creditors Turnover Ratio
Rs in ‗000
Year
Berger Paints India Limited Kansai Nerolac Paints Limited
Credit
Purchase Creditors Times
Credit
Purchase Creditors Times
2007 7608303 925665 8.22 7855100 1374200 5.72
2008 8711498 1122046 7.76 8373171 1615755 5.18
2009 10069239 1184169 8.5 8995828 2300112 3.91
2010 10774747 1950025 5.52 10718223 2940440 3.64
2011 13388785 2431325 5.5 14002453 3512502 3.98
Source: Annual Reports
Interpretation
The above table shows the speed of payment to creditors. Kansai Nerolac has made their
credit payments in shorter period when compared to Berger Paints.
4.1.10 Payment Period Ratio
The ratio gives the average credit period enjoyed from creditors. This ratio is useful for
the management to plan the payment schedule. The formula to calculate the payment period is:
Table No. 4.1.10 – Payment Period Ratio
Rs in ‗000
Year
Berger Paints India Limited Kansai Nerolac Paints Limited
Days in a
year
Creditors
Turnover Ratio Times
Days in a
year
Creditors
Turnover Ratio Times
2007 365 8.22 44 365 5.72 64
2008 365 7.76 47 365 5.18 70
2009 365 8.50 43 365 3.91 93
2010 365 5.52 66 365 3.64 100
2011 365 5.50 66 365 3.98 92
Source: Annual Reports
Interpretation
This table indicates the number of days allowed by the creditors to the company for
making payments. The creditors of Kansai Nerolac allow more days to repay the amount when
compared to Berger Paints.
ISSN 2321-0354
Page 60
www.icm
rr.or
g
59
Volume 1, Issue 1 (March, 2013)
INTERCONTINENTAL JOURNAL OF FINANCE RESEARCH REVIEW
Peer
Rev
iew
ed Jo
urna
l of I
nter
-Con
tinen
tal M
anag
emen
t Res
earc
h Co
nsor
tium
http
://w
ww
.icm
rr.o
rg
4.1.11 CASH TO CURRENT ASSETS RATIO
Cash is the life blood of every business. Cash to current assets ratio explains the
proportion of cash in the current assets. The management must keep sufficient cash balance to
meet the day to day expenses, wages and emergency liabilities. Cash to current ratio is calculated
through the following formula.
Table No. 4.1.11 – Cash to Current Assets Ratio
Rs in ‗000
Year Berger Paints India Limited Kansai Nerolac Paints Limited
Cash Current Asset Times Cash Current Asset Times
2007 217427 4639982 0.05 214900 4609100 0.05
2008 399003 5266451 0.08 333754 4678676 0.07
2009 318695 5388091 0.06 761639 4980777 0.15
2010 375641 5900138 0.06 410825 5619861 0.07
2011 1229233 8203228 0.15 396906 7042845 0.06
Source: Annual Reports
Interpretation
From the table it is understood that there was a constant trend in cash from the both
companies.
4.1.12 Inventories to Current Assets
In the current assets, inventory is a significant component. So when the management tries
to manage current assets it must effectively manage inventories. The formula for calculating the
ratio is:
Table No. 4.1.12 – Inventories to Current Assets
Rs in ‗000
Year Berger Paints India Limited Kansai Nerolac Paints Limited
Inventories Current Asset Times Inventories Current Asset Times
2007 2520694 4639982 0.54 1804200 4609100 0.39
2008 2690954 5266451 0.51 1734111 4678676 0.37
2009 2663311 5388091 0.49 1706339 4980777 0.34
2010 2993270 5900138 0.51 2474444 5619861 0.44
2011 4039186 8203228 0.49 3541025 7042845 0.50
Source: Annual Reports
ISSN 2321-0354
Page 61
www.icm
rr.or
g
60
Volume 1, Issue 1 (March, 2013)
INTERCONTINENTAL JOURNAL OF FINANCE RESEARCH REVIEW
Peer
Rev
iew
ed Jo
urna
l of I
nter
-Con
tinen
tal M
anag
emen
t Res
earc
h Co
nsor
tium
http
://w
ww
.icm
rr.o
rg
Interpretation
From the table it is observed that inventories are maintained at a fixed proportion to
current assets, by and large. However, Kansai Nerolac is more efficient in terms of maintaining
inventory than Berger.
4.2 SCHEDULE OF CHANGES IN WORKING CAPITAL
4.2.1 Berger Pains India Limited
Table No. 4.2.1.1 - Changes in Working Capital for the Year 2006-2007
Particulars 2006
( Rs.‘000)
2007
( Rs.‘000)
Increase
( Rs.‘000)
Decrease
( Rs.‘000)
I. Current Asset
Inventories 1995793 2520694 524901 -
Sundry Debtors 1095091 1435218 340127 -
Cash & Bank Balances 253353 217427 - 35926
Loans and Advances 296429 466799 170370 -
Total Current Assets 3640666 4640138
II. Current Liabilities
Liabilities 2011388 1983324 28064 -
Provisions 250703 151282 99421 -
Total Current Liabilities 2262091 2134606
Working Capital (I-II) 1378575 2505532
Increase in Working Capital 1126957 1126957
Total 2505532 2505532 1162883 1162883
Interpretation
In the year 2006-2007 Increase in working capital of the value is Rs. 1126957 (000).
Table No. 4.2.1.2 - Changes in Working Capital for the Year 2007-2008
Particulars 2007
( Rs.‘000)
2008
( Rs.‘000)
Increase
( Rs.‘000)
Decrease
( Rs.‘000)
I. Current Asset
Inventories 2520694 2690954 170260 -
Sundry Debtors 1435218 1584355 149137 -
Cash & Bank Balances 217427 399003 181576 -
Loans and Advances 466799 592139 125340 -
Total Current Assets 4640138 5266451
II. Current Liabilities
Liabilities 1983324 2116477 - 133153
Provisions 151282 188226 - 36944
Total Current Liabilities 2134606 2304703
Working Capital (I-II) 2505532 2961748
Increase in Working Capital 456216 456216
Total 2961748 2961748 626313 626313
ISSN 2321-0354
Page 62
www.icm
rr.or
g
61
Volume 1, Issue 1 (March, 2013)
INTERCONTINENTAL JOURNAL OF FINANCE RESEARCH REVIEW
Peer
Rev
iew
ed Jo
urna
l of I
nter
-Con
tinen
tal M
anag
emen
t Res
earc
h Co
nsor
tium
http
://w
ww
.icm
rr.o
rg
Interpretation
In the year 2007-2008 Increase in working capital of the value is Rs.456216 (000).
Table No. 4.2.1.3 - Changes in Working Capital for the Year 2008-2009
Particulars 2008
( Rs.‘000)
2009
( Rs.‘000)
Increase
( Rs.‘000)
Decrease
( Rs.‘000)
I. Current Asset
Inventories 2690954 2663311 - 27643
Sundry Debtors 1584355 1803799 219444 -
Cash & Bank Balances 399003 318695 - 80308
Loans and Advances 592139 597286 5147 -
Total Current Assets 5266451 5383091
II. Current Liabilities
Liabilities 2116477 2107651 8826 -
Provisions 188226 277430 - 89204
Total Current Liabilities 2304703 2385081
Working Capital (I-II) 2961748 2998010
Increase in Working Capital 36262 36262
Total 2998010 2998010 233417 233417
Interpretation
In the year 2008-2009 Increase in working capital of the value is Rs.36262 (000).
Table No. 4.2.1.4 - Changes in Working Capital for the Year 2009-2010
Particulars 2009
( Rs.‘000)
2010
( Rs.‘000)
Increase
( Rs.‘000)
Decrease
( Rs.‘000)
I. Current Asset
Inventories 2663311 2993270 329959 -
Sundry Debtors 1803799 2047298 243499 -
Cash & Bank Balances 318695 375641 56946 -
Loans and Advances 597286 483929 - 113357
Total Current Assets 5383091 5900138
II. Current Liabilities
Liabilities 2107651 2650950 - 543299
Provisions 277430 525852 - 248422
Total Current Liabilities 2385081 3176802
Working Capital (I-II) 2998010 2723336
Decrease in Working Capital - 274674 274674 -
Total 2998010 2998010 233417 905078
ISSN 2321-0354
Page 63
www.icm
rr.or
g
62
Volume 1, Issue 1 (March, 2013)
INTERCONTINENTAL JOURNAL OF FINANCE RESEARCH REVIEW
Peer
Rev
iew
ed Jo
urna
l of I
nter
-Con
tinen
tal M
anag
emen
t Res
earc
h Co
nsor
tium
http
://w
ww
.icm
rr.o
rg
Interpretation
In the year 2009-2010 Decrease in working capital of the value is Rs.274674 (000).
Table No. 4.2.1.5 - Changes in Working Capital for the Year 2010-2011
Particulars 2010
( Rs.‘000)
2011
( Rs.‘000)
Increase
( Rs.‘000)
Decrease
( Rs.‘000)
I. Current Asset
Inventories 2993270 4039186 1045916 -
Sundry Debtors 2047298 2402882 355584 -
Cash & Bank Balances 375641 1229233 853592 -
Loans and Advances 483929 531927 47998 -
Total Current Assets 5900138 8203228
II. Current Liabilities
Liabilities 2650950 3642855 - 991905
Provisions 525852 440063 85789 -
Total Current Liabilities 3176802 4082918
Working Capital (I-II) 2723336 4120310
Increase in Working Capital 1396974 - - 1396974
Total 4120310 4120310 2388879 2388879
Interpretation
In the year 2010-2011 Increase in working capital of the value is Rs.1396974 (000).
4.2.2 Kansai Nerolac Paints Limited
Table No. 4.2.2.1 - Changes in Working Capital for the Year 2006-2007
Particulars 2006
( Rs.‘000)
2007
( Rs.‘000)
Increase
( Rs.‘000)
Decrease
( Rs.‘000)
I. Current Asset
Inventories 1995793 1804200 - 191593
Sundry Debtors 1095091 1946900 851809 -
Cash & Bank Balances 253353 214900 - 38453
Loans and Advances 296429 643000 346571 -
Total Current Assets 3640666 4609000
II. Current Liabilities
Liabilities 2011388 1574200 437188 -
Provisions 250703 440300 - 189597
Total Current Liabilities 2262091 2014500
Working Capital (I-II) 1378575 2594500
Increase in Working Capital 1215925 - - 1215925
Total 2594500 2594500 1635568 1635568
ISSN 2321-0354
Page 64
www.icm
rr.or
g
63
Volume 1, Issue 1 (March, 2013)
INTERCONTINENTAL JOURNAL OF FINANCE RESEARCH REVIEW
Peer
Rev
iew
ed Jo
urna
l of I
nter
-Con
tinen
tal M
anag
emen
t Res
earc
h Co
nsor
tium
http
://w
ww
.icm
rr.o
rg
Interpretation
In the year 2006-2007 Increase in working capital of the value is Rs. 1215925(000).
Table No. 4.2.2.2 - Changes in Working Capital for the Year 2007-2008
Particulars 2007
( Rs.‘000)
2008
( Rs.‘000)
Increase
( Rs.‘000)
Decrease
( Rs.‘000)
I. Current Asset
Inventories 1804200 1734111 - 70089
Sundry Debtors 1946900 2129330 182430 -
Cash & Bank Balances 214900 333754 118854 -
Loans and Advances 643000 481481 - 161519
Total Current Assets 4609000 4678676
II. Current Liabilities
Liabilities 1574200 1688950 - 114750
Provisions 440300 836999 - 396699
Total Current Liabilities 2014500 2525949
Working Capital (I-II) 2594500 2152727
Decrease in Working Capital - 441773 441773 -
Total 2594500 2594500 743057 743057
Interpretation
In the year 2007-2008 Decrease in working capital of the value is Rs.441773 (000).
Table No. 4.2.2.3 - Changes in Working Capital for the Year 2008-2009
Particulars 2008
( Rs.‘000)
2009
( Rs.‘000)
Increase
( Rs.‘000)
Decrease
( Rs.‘000)
I. Current Asset
Inventories 1734111 1706339 - 27772
Sundry Debtors 2129330 2095729 - 33601
Cash & Bank Balances 333754 761639 427885 -
Loans and Advances 481481 417070 - 64411
Total Current Assets 4678676 4980777
II. Current Liabilities
Liabilities 1688950 2442349 - 753399
Provisions 836999 838487 - 1488
Total Current Liabilities 2525949 3280836
Working Capital (I-II) 2152727 1699941
Decrease in Working Capital - 452786 452786 -
Total 2152727 2152727 880671 880671
ISSN 2321-0354
Page 65
www.icm
rr.or
g
64
Volume 1, Issue 1 (March, 2013)
INTERCONTINENTAL JOURNAL OF FINANCE RESEARCH REVIEW
Peer
Rev
iew
ed Jo
urna
l of I
nter
-Con
tinen
tal M
anag
emen
t Res
earc
h Co
nsor
tium
http
://w
ww
.icm
rr.o
rg
Interpretation
In the year 2008-2009 Decrease in working capital of the value is Rs.452786 (000).
Table No. 4.2.2.4 - Changes in Working Capital for the Year 2009-2010
Particulars 2009
( Rs.‘000)
2010
( Rs.‘000)
Increase
( Rs.‘000)
Decrease
( Rs.‘000)
I. Current Asset
Inventories 1706339 2474444 768105 -
Sundry Debtors 2095729 2323662 227933 -
Cash & Bank Balances 761639 410825 - 350814
Loans and Advances 417070 410930 - 6140
Total Current Assets 4980777 5619861
II. Current Liabilities
Liabilities 2442349 3043244 - 600895
Provisions 838487 936741 - 98254
Total Current Liabilities 3280836 3979985
Working Capital (I-II) 1699941 1639876
Decrease in Working Capital - 60065 60065 -
Total 1699941 1699941 1056103 1056103
Interpretation
In the year 2009-2010 Decrease in working capital of the value is Rs.60065(000).
Table No. 4.2.2.5 - Changes in Working Capital for the Year 2010-2011
Particulars 2010
( Rs.‘000)
2011
( Rs.‘000)
Increase
( Rs.‘000)
Decrease
( Rs.‘000)
I. Current Asset
Inventories 2474444 3541025 1066581 -
Sundry Debtors 2323662 2602599 278937 -
Cash & Bank Balances 410825 396906 - 13919
Loans and Advances 410930 502315 91385 -
Total Current Assets 5619861 7042845
II. Current Liabilities
Liabilities 3043244 3635437 - 592193
Provisions 936741 1091075 - 154334
Total Current Liabilities 3979985 4726512
Working Capital (I-II) 1639876 2316333
Increase in Working Capital 676457 - - 676457
Total 1699941 1699941 1436903 1436903
ISSN 2321-0354
Page 66
www.icm
rr.or
g
65
Volume 1, Issue 1 (March, 2013)
INTERCONTINENTAL JOURNAL OF FINANCE RESEARCH REVIEW
Peer
Rev
iew
ed Jo
urna
l of I
nter
-Con
tinen
tal M
anag
emen
t Res
earc
h Co
nsor
tium
http
://w
ww
.icm
rr.o
rg
Interpretation
In the year 2010-2011 Increase in working capital of the value is Rs.676457(000).
4.3 TREND ANALYSIS
Table No. 4.4.1 - Trend Percentage of Berger Paints India Limited
Interpretation
In the above table, values in the year 2007 are taken as the base and values of the
succeeding years are represented as a percentage of the base year value. If the value of an item is
less than the amount in the base year, the percentage will be below 100, if it is more than the base
amount the trend percentage would be more than 100.
Chart No. 4.3.1 - Chart showing the Trend Percentage of Berger Paints India Limited
Particulars 2007 (%) 2008 (%) 2009 (%) 2010 (%) 2011 (%)
Sources of Funds
Shareholders‘ Fund 100.00 126.52 154.12 227.02 262.11
Loan Funds 100.00 104.86 67.69 21.21 68.13
Application of Funds
Fixed Assets 100.00 110.69 134.36 153.64 169.01
Investments 100.00 170.45 230.34 1327.93 917.48
Net Current Assets 100.00 118.21 119.65 108.69 164.45
ISSN 2321-0354
Page 67
www.icm
rr.or
g
66
Volume 1, Issue 1 (March, 2013)
INTERCONTINENTAL JOURNAL OF FINANCE RESEARCH REVIEW
Peer
Rev
iew
ed Jo
urna
l of I
nter
-Con
tinen
tal M
anag
emen
t Res
earc
h Co
nsor
tium
http
://w
ww
.icm
rr.o
rg
Table No. 4.3.2 - Trend Percentage of Kansai Nerolac Paints Limited
Interpretation
In the above table, values in the year 2007 are taken as the base and values of the
succeeding years are represented as a percentage of the base year value. If the value of an item is
less than the amount in the base year, the percentage will be below 100, if it is more than the base
amount the trend percentage would be more than 100.
Chart No. 4.3.2 - Trend Percentage of Kansai Nerolac Paints Limited
Particulars 2007 (%) 2008 (%) 2009 (%) 2010 (%) 2011 (%)
Sources of Funds
Shareholders‘ Fund 100.00 116.02 127.89 151.02 179.03
Loan Funds 100.00 89.05 85.11 99.98 74.98
Application of Funds
Fixed Assets 100.00 109.16 125.08 152.42 146.56
Investments 100.00 149.94 190.17 259.36 240.16
Net Current Assets 100.00 86.97 69.60 67.65 94.45
ISSN 2321-0354
Page 68
www.icm
rr.or
g
67
Volume 1, Issue 1 (March, 2013)
INTERCONTINENTAL JOURNAL OF FINANCE RESEARCH REVIEW
Peer
Rev
iew
ed Jo
urna
l of I
nter
-Con
tinen
tal M
anag
emen
t Res
earc
h Co
nsor
tium
http
://w
ww
.icm
rr.o
rg
4.4 CORRELATION ANALYSIS
Table No. 4.4.1 - Correlation Analysis of Berger Paints India Limited
Year
Factor 2007 2008 2009 2010 2011
Sales (Rs.‘000000) 11651.164 13396.688 15083.357 16841.669 20962.243
Profit (Rs.’000000) 830.674 920.781 887.554 1201.378 1483.079
X
(Sales)
Y
(Profit) X-Xi Y-Yi X
2 Y
2 XY
11651.164 830.674 (3936) (233) 135749622.6 690019.3 9678319.0
13396.688 920.781 (2190) (143) 179471249.4 847837.6 12335415.8
15083.357 887.554 (504) (176) 227507658.4 787752.1 13387293.8
16841.669 1201.378 1255 137 283641814.7 1443309.0 20233210.6
20962.243 1483.079 5375 419 439415631.6 2199523.0 31088662.4
Xi= 15587 Yi= 1065 ∑X
2=
1265785977
∑Y2=
5968441
∑XY=
86722901.6
Correlation (r) = xy/ x2 y2
= 86722901.6/ 1265785977* 5968441
= 86722901.6/86918173.72
= 0.997
Table No. 4.4.2 - Correlation Analysis of Kansai Nerolac Paints Limited
Year
Factor 2007 2008 2009 2010 2011
Sales (Rs.‘000000) 12874.8 13194.8 14786.8 18147.1 22587.1
Profit (Rs.’000000) 971.3 1060.1 944.4 1596.0 1773.5
X
(Sales)
Y
(Profit) X-Xi Y-Yi X
2 Y
2 XY
12874.8 971.3 (3443.32) (297.76) 165760475 943423.7 12505293
13194.8 1060.1 (3123.32) (208.96) 174102747 1123812.0 13987807
14786.8 944.4 (1531.32) (324.66) 218649454 891891.4 13964654
18147.1 1596.0 1828.98 326.94 329317238 2547216.0 28962772
22587.1 1773.5 6268.98 504.44 510177086 3145302.0 40058222
Xi= 16318.12 Yi=
1269.06
∑X2=
1398007000
∑Y2=
8651645.1
∑XY=
109478748
Correlation (r) = xy/ x2 y2
= 109478748/ 1398007000* 8651645.1
= 109478748/109977545
= 0.995
ISSN 2321-0354
Page 69
www.icm
rr.or
g
68
Volume 1, Issue 1 (March, 2013)
INTERCONTINENTAL JOURNAL OF FINANCE RESEARCH REVIEW
Peer
Rev
iew
ed Jo
urna
l of I
nter
-Con
tinen
tal M
anag
emen
t Res
earc
h Co
nsor
tium
http
://w
ww
.icm
rr.o
rg
5. FINDINGS
1. The Current Ratio reveals that the Berger Paints India Limited has an ideal current ratio
while the current ratio of Kansai Nerolac Paints Limited is far from satisfactory.
2. The liquidity ratios reveal that the liquidity position of both the companies are
unsatisfactory in majority of the years in the study period.
3. Working capital turnover ratio indicates that the working capital is effectively utilized by
the Kansai Nerolac Paints India Limited, but in Berger Paints India Limited it is not that
satisfactory.
4. Berger Paints India Limited is effectively managing its debtors compared to Kansai
Nerolac Paints Limited.
5. Kansai Nerolac Paints Limited takes more days to convert its receivables into cash when
compared to Berger Paints India Limited.
6. Stock Turnover ratio indicates that the stock is effectively managed at an average level.
But Kansai Nerolac Paints Limited is more effectively managing its inventory level than
Berger Paints India Limited.
7. Stock Conversion Period Ratio indicates that the number days taken to clear the stock are
more in Berger Paints India Limited and less in Kansai Nerolac Paints Limited.
8. Creditors turnover ratios reveals the speed of payment to creditors. Kansai Nerolac Paints
Limited makes payment in shorter period compared to Berger Paints India Limited.
9. Payment period Ratio indicates that the number of days allowed by the creditors to the
company for making payments. The creditors of Kansai Nerolac Paints Limitedare allow
more days to repay the amount compared to Berger Paints India Limited.
10. Cash to Current Assets Ratio indicates that the cash is a small component in the total
current assets for both the companies. So both the companies need to maintain adequate
cash for meeting immediate liabilities.
11. Inventories to Current Assets Ratio indicate that the inventories are maintained in the
current assets for the both companies at a constant rate. But Berger Paints India Limited
is more effectively maintaining the inventory level compared to Kansai Nerolac Paints
Limited.
12. The Statement of Changes in Working Capital indicates that the working capital
maintenance is satisfactory in Berger Paints India Limited. But it is not satisfactory in
Kansai Nerolac Paints Limited.
13. The statements of funds flow indicate that both the company produce more funds from
their respective operations.
14. Sales and profits are highly positively correlated for both the companies.
ISSN 2321-0354
Page 70
www.icm
rr.or
g
69
Volume 1, Issue 1 (March, 2013)
INTERCONTINENTAL JOURNAL OF FINANCE RESEARCH REVIEW
Peer
Rev
iew
ed Jo
urna
l of I
nter
-Con
tinen
tal M
anag
emen
t Res
earc
h Co
nsor
tium
http
://w
ww
.icm
rr.o
rg
15. The overall finding form the study is that the company‘s working capital is not at
satisfactory levels in Nerolac Paints India Limited but it is satisfactory in Berger Paints
India Limited. So Nerolac has to focus on various ways to improve their working capital
management.
6.SUGGESTIONS & CONCLUSION
In the light of the study the following suggestions and conclusions are made for
improvement.
1. The Kansai Nerolac Paints Limited must concentrate on their current assets position to
improve the current ratio.
2. Both the companies must concentrate on their liquidity position to improve the liquid ratio.
3. The Berger Paints India Limited must utilize their working capital in effective way.
4. Nerolac Paints must concentrate on improving their debtors collection period.
5. Berger Paints India Limited needs to take necessary steps to improve its efficiency in
inventory management.
6. Berger Paints India Limited must take necessary steps to clear its stock effectively.
7. Berger Paints India Limited needs to take necessary steps to repay its creditors early to
maintain its creditworthiness.
Berger Paints India Limited and Kansai Nerolac Paints Limited have grown over the last
few decades in to dominant players in the Indian paint market. However both the companies
have to concentrate on certain aspects of working capital and fund management. The performance
of both these companies will improve significantly if they implement the above suggestions.
7.BIBLIOGRAPHY
BOOKS:
1. Dr.S.N.Maheswari (2000) Principles of Management Accounting Published by Sultan Chand &
Sons, New Delhi.
2. I.M.Pandey (2009) Financial Management Published by Vikas Publishing House Pvt.New Delhi.
3. V.E. RAMAMOORTHY - Working Capital management by IFMR publication.
4. S. DILEEP. R. METHA - Working capital management prentice – Hall Inc.
WEBSITES:
1. www.nerolac.com
2. www.bergerpaints.com
ISSN 2321-0354
Page 71
www.icm
rr.or
g
70
Volume 1, Issue 1 (March, 2013)
INTERCONTINENTAL JOURNAL OF FINANCE RESEARCH REVIEW
Peer
Rev
iew
ed Jo
urna
l of I
nter
-Con
tinen
tal M
anag
emen
t Res
earc
h Co
nsor
tium
http
://w
ww
.icm
rr.o
rg
A STUDY ON ROLE OF FUNDAMENTAL AND TECHNICAL ANALYSIS IN EQUITY
RESEARCH
V.MANGAYARKARASI HADBEST FINANCIAL SERVICES LIMITED, ERODE
ABSTRACT
Fundamental analysis of a business involves analyzing its financial statements and health, its
management and competitive advantages, and its competitors and markets. When applied to
futures and forex, it focuses on the overall state of the economy, interest rates, production,
earnings, and management. When analyzing a stock, futures contract, or currency using
fundamental analysis there are two basic approaches one can use; bottom up analysis and top
down analysis The term is used to distinguish such analysis from other types of investment
analysis, such as quantitative analysis and technical analysis. Fundamental analysis is performed
on historical and present data, but with the goal of making financial forecasts. There are several
possible objectives: to conduct a company stock valuation and predict its probable price
evolution, to make a projection on its business performance, to evaluate its management and
make internal business decisions, to calculate its credit risk.
Keywords: financial statements, stock, futures contract, currency
1. INTRODUCTION TO BSE AND NSE
Bombay Stock Exchange Limited is the oldest stock exchange in Asia with a rich heritage.
Popularly known as ―BSE‖, it was established as ―The Native Share & Stock Brokers
Association‖ in 1875. It is the first stock exchange in country to obtain permanent recognition
in 1956 from the Government of India under the Securities Contracts (Regulation) Act, 1956.
The Exchange‘s pivotal and pre-eminent role in the development of the Indian capital market
is widely recognized and its index, SENSEX, is tracked worldwide. Earlier an Association of
Persons (AOP), the Exchange is now a demutualised and corporative entity incorporated
A Peer Reviewed International Journal
IJFRR
INTERCONTINENTAL JOURNAL OF FINANCE RESEARCH REVIEW
ISSN 2321-0354
Page 72
www.icm
rr.or
g
71
Volume 1, Issue 1 (March, 2013)
INTERCONTINENTAL JOURNAL OF FINANCE RESEARCH REVIEW
Peer
Rev
iew
ed Jo
urna
l of I
nter
-Con
tinen
tal M
anag
emen
t Res
earc
h Co
nsor
tium
http
://w
ww
.icm
rr.o
rg
under the provisions of the Companies Act, 1956, pursuant to the BSE (Corporatization and
Demutualization) Scheme, 2005 notified by the Securities and Exchange Board of India
(SEBI). With demutualization, the trading rights and ownership rights have been de linked
effectively addressing concerns regarding perceived and real conflicts of interest.
The Exchange is professionally managed under the overall direction of the Board of
Directors. The Board comprises eminent professionals. Representatives of Trading Members
and the Managing Director of the Exchange. The Board is inclusive and is designed to benefit
from the participation of market intermediaries. The Exchange has a nation-wide reach with a
presence in 417 cities and towns of India. The systems and processes of the Exchange are
designed to safeguard market integrity and enhance transparency in operations. During the
year 2004-2005, the trading volumes on the Exchange showed robust growth. The Exchange
provides an efficient and transparent market for trading in equity, debt instruments and
derivatives. The BSE on Line Trading System (BOLT) is a proprietary system of the
Exchange and is BS 7799-2-2002 certified. The surveillance and clearing and settlement
functions of the Exchange are ISO 9001:2000 certified.
SENSEX – THE BAROMETER OF INDIAN CAPITAL MARKETS
For the premier Stock Exchange that pioneered the stock broking activity in Indian, 128 years
of experience seems to be a proud milestone. A lot has changed since 1875 when 318 persons
became members of what today is called ―The Stock Exchange, Mumbai‖ by paying a
princely amount of Re1. Till the decade of eighties, there was no scale to measure the ups and
downs in the Indian stock market. The Stock Exchange, Mumbai (BSE) in 1986 came out
with a stock index that subsequently became the barometer of the Indian stock market.
First compiled in 1986, SENSEX is a basket of 30 constituent stocks representing a sample of
large, liquid and representative companies. The base year of SENSEX is 1978-79 and the
base value is 100. The index is widely reported in both domestic and international markets
through print as well as electronic media. The entry and exit of any specific stock depends on
the market capitalization of the top 30 companies in the market and are from different sectors.
ISSN 2321-0354
Page 73
www.icm
rr.or
g
72
Volume 1, Issue 1 (March, 2013)
INTERCONTINENTAL JOURNAL OF FINANCE RESEARCH REVIEW
Peer
Rev
iew
ed Jo
urna
l of I
nter
-Con
tinen
tal M
anag
emen
t Res
earc
h Co
nsor
tium
http
://w
ww
.icm
rr.o
rg
NATIONAL STOCK EXCHANGE
The National Stock Exchange (NSE) is India‘s leading stock exchange covering various cities
and towns across the country. NSE was set up by leading institutions to provide a modern,
fully automated screen-based trading system with national reach.. NSE has played a catalytic
role in reforming the Indian securities market in terms of microstructure, market practices and
trading volumes. The market today uses state-of art information technology to provide an
efficient and transparent trading, clearing and settlement mechanism, and has witnessed
several innovations in products & services viz. demutualization of stock exchange
governance, screen based trading, Professionalization of trading members, fine-tuned risk
management systems, emergence of clearing corporations to assume counter party risks,
market of debt and derivative instruments and intensive use of information technology. IDBI
& other financial institution with paid equity capital of Rs 25 cores set up NSE. It started
operation in Wholesale debt market in June 1994 & in equity, in Nov 1994.
2. REVIEW OF LITERATURE
A study by Yu-Hon Lui and David Mole1 (1998) reports on the use by foreign exchange
dealers in Hong Kong of fundamental and technical analyses to form their forecasts of
exchange rate movements. The findings of this study reveal that more than 90 percent of the
respondents rely on both fundamental and technical analyses for predicting future rate
movements at different horizons.
Thomas Oberlechner2 (2001) presents the findings of a questionnaire and an interview
survey on the perceived importance of Technical and Fundamental analysis among foreign
exchange traders and financial journalists in Frankfurt, London, Vienna and Zurich. Foreign
Exchange traders confirm that, out of the both forecasting approaches, technical analysis is
more prominent than the other. But the Financial journalists put more emphasis on
fundamental analysis than foreign exchange traders.
ISSN 2321-0354
Page 74
www.icm
rr.or
g
73
Volume 1, Issue 1 (March, 2013)
INTERCONTINENTAL JOURNAL OF FINANCE RESEARCH REVIEW
Peer
Rev
iew
ed Jo
urna
l of I
nter
-Con
tinen
tal M
anag
emen
t Res
earc
h Co
nsor
tium
http
://w
ww
.icm
rr.o
rg
Sanjay Seghal and Meenkashi gupta3 (2005) presents the survey which aims at providing
insights about the way technical traders operate in the financial market and the trading
strategies that they adopt. The survey covered institutional and individual technical traders
with a long and active trading record for the Indian market. In this study also it is observed
that the sample respondents tend to use Technical analysis along with Fundamental analysis
for security selection.
Jenni.LBettman, Stephen.J.Sault, Emma.JSchultz4 (2008), proposes an equity valuation
model integrating Fundamental and Technical analysis, they tend to recognize their potential
as complements rather than as substitutes. Testing confirms the complimentary nature of
Fundamental and Technical analysis by showing that inspite of each performing in isolation
models integrating both have superior explanatory power.
Nobert.M.Fliess, Ronald Macdonald5 (2002) assigns a special importance to the open, high,
low and closed prices in forecasting the mean and volatility of exchange rates using Technical
analysis. In this paper the authors propose to investigate the time series properties and the
informational content of these different prices, using range and Co integration methods. In
sum, in this article it is argued that a Technical analysis of high low and close prices is useful
way of learning about latent granger causality in high frequency exchange rate.
Doron Nissim and Stephen.H.Penman6 (2001), this research work envisages on Financial
Statement Analysis and identifies that this analysis has traditionally been seen as part of the
Fundamental analysis required for equity valuation. This paper outlines a financial statement
analysis for use in equity valuation. Standard profitability is incorporated, and extended and is
complemented with an analysis of growth.
3. OBJECTIVES OF THE STUDY
Primary Objective:
To carry out Fundamental and Technical analysis of select equity shares.
To evaluate the usefulness and validity of fundamental and technical analysis in making an
investment decision.
ISSN 2321-0354
Page 75
www.icm
rr.or
g
74
Volume 1, Issue 1 (March, 2013)
INTERCONTINENTAL JOURNAL OF FINANCE RESEARCH REVIEW
Peer
Rev
iew
ed Jo
urna
l of I
nter
-Con
tinen
tal M
anag
emen
t Res
earc
h Co
nsor
tium
http
://w
ww
.icm
rr.o
rg
Secondary Objective:
To obtain knowledge on selecting right companies for investment.
To analyze the performance of the selected companies.
LIMITATIONS OF THE STUDY
The study covers only select stocks which are not chosen randomly. The findings of the study
therefore cannot be generalized to a larger population.
The period for which data were collected and analyzed poses another limitation. Data on the
same stocks pertaining to a different period may present a different picture altogether.
The stock prices taken have not been adjusted for abnormal market conditions and therefore it
is possible that the results of analysis may be skewed to the extent abnormality was present in
the overall market
SCOPE OF THE STUDY:
The study is undertaken in Angel Broking (p) ltd,.
The company has significant amount of investible funds.
The researcher was given the task of identifying securities in top performing sectors which would
be considered by the company in formulating its portfolio.
The analysis was mainly carried out to study the Fundamental and Technical analysis of Equity
shares.
4. RESEARCH METHODLOGY
Research methodology is defined as systems of models, procedures and techniques used to
find the result of a research problem is called research methodology. Research methodology is
a way to systematically solve the research problem. It may be understood as a science of
studying how research is done scientifically.
In it we study the various steps that are generally adopted by a researcher in studying his
research problem along with the logic behind them. It is necessary for the researcher to know
not only the research methods/techniques but also the methodology. Researchers not only need
to know how to develop certain indices or tests, how to calculate the mean, the mode, the
median or the standard deviation or chi-square, how to apply particular research techniques,
but they also need to know which of these methods or techniques, are relevant and which are
not, and what would they mean and indicate and why.
ISSN 2321-0354
Page 76
www.icm
rr.or
g
75
Volume 1, Issue 1 (March, 2013)
INTERCONTINENTAL JOURNAL OF FINANCE RESEARCH REVIEW
Peer
Rev
iew
ed Jo
urna
l of I
nter
-Con
tinen
tal M
anag
emen
t Res
earc
h Co
nsor
tium
http
://w
ww
.icm
rr.o
rg
Researchers also need to understand the assumptions underlying various techniques and they
need to know the criteria by which they can decide that certain techniques and procedures will
be applicable to certain problems and others will not. All this means that it is necessary for the
researcher to design his methodology for his problem as the same may differ from problem to
problem. For example, an architect, who designs a building, has to consciously evaluate the
basis of his decisions, i.e., he has to evaluate why and on what basis he selects particular size,
number and location of doors, windows and ventilators, uses particular materials and not
others and the like.
Similarly, in research the scientist has to expose the research decisions to evaluation before
they are implemented. He has to specify very clearly and precisely what decisions he selects
and why he selects them so that they can be evaluated by others also.
RESEARCH DESIGN
It is a conceptual structure within which research should be conducted. Thus
the preparation of such as design facilitates research to be as efficient as possible and will
yield maximal information
SAMPLING DESIGN
One month closing price is taken for Moving Average and Rate of Change for 5 different
banks Year taken for study : 2011
SAMPLING TECHNIQUE:
The study was conducted by means of non-probability convenience sampling technique.
SAMPLE UNITS
This type of shares is listed in Bombay Stock Exchange and National Stock Exchange, whose
financial data will constitute the sample unit.
METHOD OF DATA COLLECTION
The task of collecting data begins after a research problem has been defined
and plan is chalked out. This study pertains to collection of data from secondary sources.
ISSN 2321-0354
Page 77
www.icm
rr.or
g
76
Volume 1, Issue 1 (March, 2013)
INTERCONTINENTAL JOURNAL OF FINANCE RESEARCH REVIEW
Peer
Rev
iew
ed Jo
urna
l of I
nter
-Con
tinen
tal M
anag
emen
t Res
earc
h Co
nsor
tium
http
://w
ww
.icm
rr.o
rg
Secondary source includes:
1) Various books related to stock market
2) Books related to Financial Management
3) Web sites were used as the vital information source.
THE COMPANIES TAKEN INTO RESEARCH FROM BANKING SECTORS:
1. AXIS bank
2. HDFC bank
3. ICICI bank
4. KOTAK bank
5. PUNJAB NATIONAL bank
STATISTICAL TOOLS
The data has been mainly analyzed by using the following methods
MOVING AVERAGE
RATE OF CHANGE
5.ANALYSIS AND INTERPRETATION
5.1 MOVING AVERAGE & RATE OF CHANGE
AXIS BANK
AXIS Bank is one of the fastest growing banks in private sector. The Bank operates in four
segments, namely treasury, retail banking, corporate/ wholesale banking and other banking
business. The treasury operations include investments in sovereign and corporate debt, equity
and mutual funds, trading operations, derivative trading and foreign exchange operations on
the account, and for customers and central funding. Retail banking includes lending to
individuals/ small businesses subject to the orientation, product and granularity criterion.
It also includes liability products, card services, Internet banking, automated teller machines
(ATM) services, depository, financial advisory services, and non-resident Indian (NRI)
services. The corporate/ wholesale banking segment includes corporate relationships not
included under retail banking, corporate advisory services, placements and syndication,
management of publics issue, project appraisals, capital market related services, and cash
management services. The Bank's registered office is located at Ahmadabad and their Central
Office is located at Mumbai.
The Bank has a very wide network of more than 1042 branches (including 56 Service
Branches/ CPCs as on June 30, 2010). The Bank has a network of over 4,474 ATMs
providing 24 hrs a day banking convenience to their customers.
ISSN 2321-0354
Page 78
www.icm
rr.or
g
77
Volume 1, Issue 1 (March, 2013)
INTERCONTINENTAL JOURNAL OF FINANCE RESEARCH REVIEW
Peer
Rev
iew
ed Jo
urna
l of I
nter
-Con
tinen
tal M
anag
emen
t Res
earc
h Co
nsor
tium
http
://w
ww
.icm
rr.o
rg
This is one of the largest ATM networks in the country. The Bank has five wholly-owned
subsidiaries namely Axis Securities and Sales Ltd, Axis Private Equity Ltd, Axis Trustee
Services Ltd, Axis Asset Management Company Ltd and Axis Mutual Fund Trustee Ltd.
TABLE 5.1
THREE DAY MOVING AVERAGE & RATE OF CHANGE FOR AXIS BANK
DATE CLOSE PRICE 3-DAY MOVING
AVERAGE
RATE OF
CHANGE
01/12/2011 972.60
02/12/2011 1005.95 1003.57 3.43
05/12/2011 1032.15 1025.88 2.60
07/12/2011 1039.55 1025.03 0.72
08/12/2011 1003.40 1011.61 -3.48
09/12/2011 991.90 988.56 -1.15
12/12/2011 970.40 974.06 -2.17
13/12/2011 959.90 963.15 -1.08
14/12/2011 959.15 956.05 -0.08
15/12/2011 949.10 937.43 -1.04
16/12/2011 904.05 900.73 -4.75
19/12/2011 849.05 857.80 -6.08
20/12/2011 820.30 841.21 -3.38
21/12/2011 854.30 849.41 4.14
22/12/2011 873.65 869.30 2.30
23/12/2011 879.95 875.20 0.72
26/12/2011 872.00 865.73 -0.90
27/12/2011 845.25 849.95 -3.06
28/12/2011 832.60 831.13 -1.49
29/12/2011 815.55 818.75 -2.04
30/12/2011 808.10 -0.91
ISSN 2321-0354
Page 79
www.icm
rr.or
g
78
Volume 1, Issue 1 (March, 2013)
INTERCONTINENTAL JOURNAL OF FINANCE RESEARCH REVIEW
Peer
Rev
iew
ed Jo
urna
l of I
nter
-Con
tinen
tal M
anag
emen
t Res
earc
h Co
nsor
tium
http
://w
ww
.icm
rr.o
rg
INTERPRETATION FOR AXIS BANK MOVING AVERAGE
The scrip price came down from 8th
December to 20th
December. The closing price as
on 8th
December is Rs.1003.40 which is lesser than the moving average. Similarly from
2nd
December to 7th
December the closing price is higher than the moving average.
RATE OF CHANGE
Rate of Change Chart shows oversold the shares from 8th
December to 20th
December. In the same way overbought the shares from 21st December to 23
rd
December.
INFERENCE
There is a small price fluctuation in this month. It is good for long term
investors.
HDFC BANK
The HDFC Bank was incorporated on August 1994 by the name of 'HDFC
Bank Limited', with its registered office in Mumbai, India. HDFC Bank commenced
operations as a Scheduled Commercial Bank in January 1995. The Housing
Development Finance Corporation (HDFC) was amongst the first to receive an 'in
principle' approval from the Reserve Bank of India (RBI) to set up a bank in the private
sector, as part of the RBI's liberalization of the Indian Banking Industry in 1994.
HDFC Bank is headquartered in Mumbai. The Bank at present has an enviable
network of over 1416 branches spread over 550 cities across India. All branches are
linked on an online real-time basis. Customers in over 500 locations are also serviced
through Telephone Banking. The Bank also has a network of about over 3382
networked ATMs across these cities.
The promoter of the company HDFC was incepted in 1977 is India's premier
housing finance company and enjoys an impeccable track record in India as well as in
international markets. HDFC has developed significant expertise in retail mortgage
loans to different market segments and also has a large corporate client base for its
housing related credit facilities. With its experience in the financial markets, a strong
market reputation, large shareholder base and unique consumer franchise, HDFC was
ideally positioned to promote a bank in the Indian environment.
ISSN 2321-0354
Page 80
www.icm
rr.or
g
79
Volume 1, Issue 1 (March, 2013)
INTERCONTINENTAL JOURNAL OF FINANCE RESEARCH REVIEW
Peer
Rev
iew
ed Jo
urna
l of I
nter
-Con
tinen
tal M
anag
emen
t Res
earc
h Co
nsor
tium
http
://w
ww
.icm
rr.o
rg
The shares are listed on the Bombay Stock Exchange Limited and The National
Stock Exchange of India Limited. The Bank's American Depository Shares ( ADS ) are
listed on the New York Stock Exchange (NYSE) under the symbol 'HDB' and the
Bank's Global Depository Receipts (GDRs) are listed on Luxembourg Stock Exchange.
TABLE 5.2
THREE DAY MOVING AVERAGE & RATE OF CHANGE FOR HDFC BANK
DATE CLOSE PRICE 3DAY MOVING
AVERAGE
RATE OF
CHANGE
1/12/2011 453.50
2/12/2011 466.00 460.61 2.75
5/12/2011 462.35 465.15 -0.78
7/12/2011 467.10 461.06 1.02
8/12/2011 453.75 454.86 -2.85
9/12/2011 443.75 443.18 -2.20
12/12/2011 432.05 438.06 -2.63
13/12/2011 438.40 434.93 1.47
14/12/2011 434.35 434.7 -0.92
15/12/2011 431.35 427.00 -0.69
16/12/2011 415.30 417.55 -3.72
19/12/2011 406.00 411.83 -2.23
20/12/2011 414.20 418.55 2.01
21/12/2011 435.45 430.83 5.13
22/12/2011 442.85 438.61 1.69
23/12/2011 437.55 441.36 -1.19
26/12/2011 443.70 440.31 1.40
27/12/2011 439.70 441.06 0.990
28/12/2011 439.80 436.36 0.02
29/12/2011 429.60 432.41 -2.31
30/12/2011 426.85 -0.64
ISSN 2321-0354
Page 81
www.icm
rr.or
g
80
Volume 1, Issue 1 (March, 2013)
INTERCONTINENTAL JOURNAL OF FINANCE RESEARCH REVIEW
Peer
Rev
iew
ed Jo
urna
l of I
nter
-Con
tinen
tal M
anag
emen
t Res
earc
h Co
nsor
tium
http
://w
ww
.icm
rr.o
rg
INTERPRETATION FOR HDFC BANK
MOVING AVERAGE
The scrip price came down from 13th
December to 19th
December. The closing
price as on 5th
December is Rs.462.35 which is lesser than the moving average.
Similarly from 21st December to 22
nd December the closing price is higher than the
moving average.
RATE OF CHANGE
Rate of Change Chart shows oversold the shares from 8th
December to 12th
December. In the same way overbought the shares from 20th
December to 22nd
December.
INFERENCE
There is a bearish and bullish market in this month
ICICI BANK
ICICI Bank is India's second-largest bank with total assets of Rs. 4,062.34
billion (US$ 91 billion) at March 31, 2011 and profit after tax Rs. 51.51 billion (US$
1,155 million) for the year ended March 31, 2011. The Bank has a network of 2,582
branches and 8,003 ATMs in India, and has a presence in 19 countries, including India.
ICICI Bank offers a wide range of banking products and financial services to
corporate and retail customers through a variety of delivery channels and through its
specialised subsidiaries in the areas of investment banking, life and non-life insurance,
venture capital and asset management.
The Bank currently has subsidiaries in the United Kingdom, Russia and
Canada, branches in United States, Singapore, Bahrain, Hong Kong, Sri Lanka, Qatar
and Dubai International Finance Centre and representative offices in United Arab
Emirates, China, South Africa, Bangladesh, Thailand, Malaysia and Indonesia. Our UK
subsidiary has established branches in Belgium and Germany.
ISSN 2321-0354
Page 82
www.icm
rr.or
g
81
Volume 1, Issue 1 (March, 2013)
INTERCONTINENTAL JOURNAL OF FINANCE RESEARCH REVIEW
Peer
Rev
iew
ed Jo
urna
l of I
nter
-Con
tinen
tal M
anag
emen
t Res
earc
h Co
nsor
tium
http
://w
ww
.icm
rr.o
rg
ICICI Bank's equity shares are listed in India on Bombay Stock Exchange and
the National Stock Exchange of India Limited and its American Depositary Receipts
(ADRs) are listed on the New York Stock Exchange (NYSE).
TABLE 5.3
THREE DAY MOVING AVERAGE & RATE OF CHANGE FOR ICICI BANK
DATE CLOSE PRICE 3 DAY MOVING
AVERAGE
RATE OF
CHANGE
1/12/2011 762.15
2/12/2011 787.70 776.46 3.35
5/12/2011 779.55 778.36 -1.03
7/12/2011 767.85 763.9 -1.50
8/12/2011 744.30 747.76 -3.06
9/12/2011 731.15 727.51 -1.76
12/12/2011 707.10 714.9 -3.28
13/12/2011 706.45 705.98 -0.09
14/12/2011 704.40 703.15 -0.29
15/12/2011 698.60 693.00 -0.82
16/12/2011 676.00 677.26 -3.23
19/12/2011 657.20 662.2 -2.78
20/12/2011 653.40 670.98 -0.57
21/12/2011 702.35 694.63 7.49
22/12/2011 728.15 717.41 3.67
23/12/2011 721.75 726.5 -0.87
26/12/2011 729.60 725.81 1.08
27/12/2011 726.10 717.68 -0.47
28/12/2011 697.35 703.13 -3.95
29/12/2011 685.95 689.31 -1.63
30/12/2011 684.65 -0.18
ISSN 2321-0354
Page 83
www.icm
rr.or
g
82
Volume 1, Issue 1 (March, 2013)
INTERCONTINENTAL JOURNAL OF FINANCE RESEARCH REVIEW
Peer
Rev
iew
ed Jo
urna
l of I
nter
-Con
tinen
tal M
anag
emen
t Res
earc
h Co
nsor
tium
http
://w
ww
.icm
rr.o
rg
INTERPRETATION FOR ICICI BANK
MOVING AVERAGE
The scrip price came down from 2nd
December to 20th
December. The closing
price as on 12th
December is Rs.707.10 which is lesser than the moving average.
Similarly from 13th
December to 15th
December the closing price is higher than the
moving average.
RATE OF CHANGE
Rate of Change Chart shows oversold the shares from 5th
December to 20th
December. In the same way overbought the shares from 21st December to 22
nd
December.
INFERENCE
There is a bearish market in this month.
KOTAK MAHINDRA BANK
Kotak Mahindra Bank (BSE: 500247, NSE: KOTAKBANK) is an Indian
financial service firm established in 1985. It was previously known as Kotak Mahindra
Finance Limited, a non-banking financial company. In February 2003, Kotak Mahindra
Finance Ltd, the group's flagship company was given the license to carry on banking
business by the Reserve Bank of India (RBI). Kotak Mahindra Finance Ltd. is the first
company in the Indian banking history to convert to a bank. Today it has more than
20,000 employees and Rs. 10,000 crore in revenue.
Mr. Uday Kotak is Executive Vice Chairman & Managing Director of Kotak
Mahindra Bank Ltd. In July 2011 Mr. C. Jayaram and Mr. Dipak Gupta, whole time
directors of the Bank, were appointed the Joint Managing Directors of Kotak
Mahindra Bank. Dr. Shankar Acharya is the chairman of board of Directors in the
company.
The Bank has its registered office at Nariman Bhavan, Nariman Point, Mumbai.
ISSN 2321-0354
Page 84
www.icm
rr.or
g
83
Volume 1, Issue 1 (March, 2013)
INTERCONTINENTAL JOURNAL OF FINANCE RESEARCH REVIEW
Peer
Rev
iew
ed Jo
urna
l of I
nter
-Con
tinen
tal M
anag
emen
t Res
earc
h Co
nsor
tium
http
://w
ww
.icm
rr.o
rg
TABLE 5.4
THREE DAY MOVING AVERAGE & RATE OF CHANGE FOR KOTAK
BANK
DATE CLOSE PRICE 3DAY MOVING
AVERAGE
RATE OF
CHANGE
1/12/2011 478.80
2/12/2011 495.85 488.61 3.56
5/12/2011 491.20 493.11 -0.93
7/12/2011 492.30 489.2 0.22
8/12/2011 484.10 488.43 -1.66
9/12/2011 488.90 485.83 0.99
12/12/2011 484.50 486.6 -0.89
13/12/2011 486.40 486.36 0.39
14/12/2011 488.20 486.03 0.37
15/12/2011 483.50 484.41 -0.96
16/12/2011 481.55 477.6 -0.40
19/12/2011 467.75 464.78 -2.86
20/12/2011 445.05 459.18 -4.85
21/12/2011 464.75 457.45 4.42
22/12/2011 462.55 461.45 -0.47
23/12/2011 457.05 460.98 -1.18
26/12/2011 463.35 457.66 1.37
27/12/2011 452.60 456.75 -2.32
28/12/2011 454.30 450.95 0.37
29/12/2011 445.95 443.6 -1.83
30/12/2011 430.55 -3.45
ISSN 2321-0354
Page 85
www.icm
rr.or
g
84
Volume 1, Issue 1 (March, 2013)
INTERCONTINENTAL JOURNAL OF FINANCE RESEARCH REVIEW
Peer
Rev
iew
ed Jo
urna
l of I
nter
-Con
tinen
tal M
anag
emen
t Res
earc
h Co
nsor
tium
http
://w
ww
.icm
rr.o
rg
INTERPRETATION FOR KOTAK MAHINDRA BANK
MOVING AVERAGE
The scrip price came down from 14th
December to 20th
December. The closing
price as on 5th
December is Rs.491.20 which is lesser than the moving average.
Similarly from 13th
December to 14th
December the closing price is higher than the
moving average.
RATE OF CHANGE
Rate of Change Chart shows oversold the shares from 15th
December to 20th
December. In the same way overbought the shares from 13th
December to 14th
December.
INFERENCE
There is a small price fluctuation in this month. It is good for long term
investors.
PUNJAB NATIONAL BANK
Punjab National Bank (PNB) (BSE: 532461, NSE: PNB) is an Indian
financial services company based in New Delhi, India. PNB is the third largest bank in
India by assets. It was founded in 1894 and is currently the second largest state-owned
commercial bank in India ahead of Bank of Baroda with about 5000 branches across
764 cities. It serves over 37 million customers. The bank has been ranked 248th biggest
bank in the world by the Bankers Almanac, London. The bank's total assets for
financial year 2007 were about US$60 billion. PNB has a banking subsidiary in the
UK, as well as branches in Hong Kong, Dubai and Kabul, and representative offices in
Almaty, Dubai, Oslo, and Shanghai. PNB has the distinction of being the first Indian
bank to have been started solely with Indian capital that has survived to the present.
(The first entirely Indian bank, the Oudh Commercial Bank, was established in 1881 in
Faizabad, but failed in 1958.)
ISSN 2321-0354
Page 86
www.icm
rr.or
g
85
Volume 1, Issue 1 (March, 2013)
INTERCONTINENTAL JOURNAL OF FINANCE RESEARCH REVIEW
Peer
Rev
iew
ed Jo
urna
l of I
nter
-Con
tinen
tal M
anag
emen
t Res
earc
h Co
nsor
tium
http
://w
ww
.icm
rr.o
rg
TABLE 5.5
THREE DAY MOVING AVERAGE & RATE OF CHANGE FOR PUNJAB
NATIONALS BANK
DATE CLOSE
PRICE
3-DAY MOVING
AVERAGE
RATE OF
CHANGE
01/12/2011 900.95
02/12/2011 916.35 914.93 1.70
05/12/2011 927.50 921.61 1.21
07/12/2011 921.00 927.30 -0.70
08/12/2011 933.40 927.13 1.34
09/12/2011 927.00 917.76 -0.68
12/12/2011 892.90 903.05 -3.67
13/12/2011 889.25 889.21 -3.30
14/12/2011 885.50 889.91 -0.42
15/12/2011 895.00 883.01 1.07
15/12/2011 868.55 864.06 -2.95
16/12/2011 828.65 832.08 -4.59
19/12/2011 799.05 801.93 -3.56
20/12/2011 778.10 794.05 -2.62
20/12/2011 805.00 791.10 3.45
21/12/2011 790.20 805.85 -1.83
22/12/2011 822.35 809.78 4.06
23/12/2011 816.80 817.26 -0.67
26/12/2011 812.65 812.60 -0.50
27/12/2011 808.35 798.45 -0.52
28/12/2011 774.35 787.86 -4.20
29/12/2011 780.90 778.86 0.84
30/12/2011 780.80 -0.01
ISSN 2321-0354
Page 87
www.icm
rr.or
g
86
Volume 1, Issue 1 (March, 2013)
INTERCONTINENTAL JOURNAL OF FINANCE RESEARCH REVIEW
Peer
Rev
iew
ed Jo
urna
l of I
nter
-Con
tinen
tal M
anag
emen
t Res
earc
h Co
nsor
tium
http
://w
ww
.icm
rr.o
rg
INTERPRETATION FOR PUNJAB NATIONAL BANK
MOVING AVERAGE
The scrip price came down from 9th
December to 14th
December.. The closing price as
on 7th
December is Rs.927.3 which is lesser than the moving average. Similarly from 8th
December to 9th
December the closing price is higher than the moving average.
RATE OF CHANGE
Rate of Change Chart shows oversold the shares from 9th
December to 14th
December. In the same way overbought the shares from 2nd
December to 5th
December.
INFERENCE
This month is bearish market and it is good for long term investors.
6. FINDINGS
The overall findings of the study indicate that fundamental and technical analysis are quite useful for
the investors to forecast market price of individual stocks
While fundamental analysis helps investors to decide ‘what’ stocks to buy or sell based on their
intrinsic valuation, technical analysis helps investors decide ‘when’ (meaning at what price) to buy or
sell
The study further revealed that stock price movements are closely associated with general market
movements and therefore, technical analysis is of paramount importance in timing our buy or sell.
The above statement however, does not weaken the importance of fundamental analysis as in the
long term the price of a stock is decided purely by the intrinsic value / worth of the stock which fact
is also vividly brought out by the study.
7. SUGGESTIONS & CONCLUSIONS
With the help of project I concluded that reputed companies and Banks are playing very
important role in the share market. Lot of investors are investing their money in the Banks.
And this is the reason that the volume of Banks is high. During this project period I came to
ISSN 2321-0354
Page 88
www.icm
rr.or
g
87
Volume 1, Issue 1 (March, 2013)
INTERCONTINENTAL JOURNAL OF FINANCE RESEARCH REVIEW
Peer
Rev
iew
ed Jo
urna
l of I
nter
-Con
tinen
tal M
anag
emen
t Res
earc
h Co
nsor
tium
http
://w
ww
.icm
rr.o
rg
know that in the process of equity analysis of a company two weapons are playing a vital
role i.e. Fundamental Analysis and Technical Analysis.
The concept of Fundamental Analysis studies the performance of the companies. With the
help of Fundamental Analysis one can know the past performance of the companies.
Fundamental Analysis considers the long-term performance of companies and this helps the
investors to invest their money for long term as well as can get the good returns.
Technical Analysis comprises short-term analysis of the companies. Technical Analysis
really just studies supply and demand in the market in an attempt to determine what direction
or trend will continue in the future.
The study of technical as well as fundamental analysis can give detail information about the
well running companies in the market. Before investing in any company one should study
both these concepts.
8.BIBLIOGRAPHY
BOOKS
Technical analysis of stock trend - by Robert D. Edward & Magee
Martin Pricing on market momentum - by Martin J. Pring
Technical analysis A to Z- by Steven B. Achilles
Security analysis and portfolio management - Punithavathi Pandiyan
WEBSITES
www.nseindia.com
www.bseindia.com
www.trendwatchindia.com
www.technicaltrends.com
ISSN 2321-0354
Page 89
www.icm
rr.or
g
88
Volume 1, Issue 1 (March, 2013)
INTERCONTINENTAL JOURNAL OF FINANCE RESEARCH REVIEW
Peer
Rev
iew
ed Jo
urna
l of I
nter
-Con
tinen
tal M
anag
emen
t Res
earc
h Co
nsor
tium
http
://w
ww
.icm
rr.o
rg
A STUDY ON COMPARATIVE ANALYSIS ON GOLD VERSUS CRUDE OIL AT
HARVEST FUTURES CONSULTANT INDIA (P) LIMITED CHENNAI
A.MOHANA RESEARCH SCHOLAR, DEPARTMENT OF COMMERCE, BHARATHIAR UNIVERSITY, COIMBATORE
ABSTRACT
The Study States that the Online Forex Commodities trading are a sophisticated form of
investing. It is similar to stock trading but instead of buying and selling shares of companies, an
investor buys and sells commodities. Like stocks, commodities are traded on exchanges where
buyers and sellers can work together to either get the products they need or to make a profit from
the fluctuating prices. Commodity trading online makes the collection of commodity
information, up to date prices, weather forecasts, and commodity charts so much more
convenient to access. The Comparative Analysis on Gold versus Crude Oil is very much
important for the investor to get maximum returns to their fund. For that, the awareness about the
investment opportunity and maximum risk and returns in gold and crude oil in the online forex
trading and market analyzing strategies to invest their fund at right time at right price. So it is
necessary to educate the investors about the forex trading and market analyzing strategies which
might be useful for them to predict the future price. As the style of charting is relatively easier to
read and understand, it became very popular and analysts relate the chart patterns to various
bullish or bearish signals, which were considered quite reliable in predicting future market
directions. The Relative Strength Index Technical Indicator (RSI) is a price-following oscillator
that ranges between 0 and 100. When Wilder introduced the Relative Strength Index, he
recommended using a 14-day RSI. Standard Deviation — value of the market volatility
measurement. This indicator describes the range of price fluctuations relative to simple moving
average. So, if the value of this indicator is high, the market is volatile, and prices of bars are
rather spread relative to the moving average. Williams‘ Percent Range Technical Indicator (%R)
is a dynamic technical indicator, which determines whether the market is overbought / oversold.
An interesting phenomenon of the Williams Percent Range indicator is its uncanny ability to
anticipate a reversal in the underlying security‘s price. The indicator almost always forms a peak
and turns down a few days before the security‘s price peaks and turns down.
Keywords: Forex Commodities, Gold, Crude Oil
A Peer Reviewed International Journal
IJFRR
INTERCONTINENTAL JOURNAL OF FINANCE RESEARCH REVIEW
ISSN 2321-0354
Page 90
www.icm
rr.or
g
89
Volume 1, Issue 1 (March, 2013)
INTERCONTINENTAL JOURNAL OF FINANCE RESEARCH REVIEW
Peer
Rev
iew
ed Jo
urna
l of I
nter
-Con
tinen
tal M
anag
emen
t Res
earc
h Co
nsor
tium
http
://w
ww
.icm
rr.o
rg
1. INTRODUCTION ABOUT THE STUDY
CHARTTING
Ever since the rapid development in internet world, online trading in foreign exchange is
getting more and more popular, with narrower spreads provided by majors internet brokers,
countless numbers of investors have been attracted to participate in day to day forex trading.
Methods used by individual investors to analyze the forex markets and make trading decisions
include fundamental analysis and technical analysis. In view of the enormous trading volume
(way beyond all stock markets of the world, forex markets trade about US$ 4 trillion per trading
day), we believe the forex market is a perfect place (some consider the forex market as the
closest example of a perfect market condition described in economics) to apply technical
analysis to enhance the trading profitability.
Importance of chart analysis in currency and commodity trading
Basically, there are two major types of analyzing methods in predicting price or
movement of currency and commodities in the forex market, i.e. Fundamental analysis and
Technical analysis / chart analysis. Fundamental analysis involves the studies of the economic
conditions of the country, for example the balance of trade, current account, GDP,
unemployment rates and inflation index, government monetary and fiscal policies, interest rates,
even social and political forces. Some investors rely on their analyses on these economic
indicators, news and announcements to set their trading strategies.
In short, technical analysis is not only an effective method in price-forecasting process
helping traders to predict future market directions, it is also an indispensable analysis technique
in order to find clear and precise timing and level of entry and exit in day to day trading,
therefore, chart analysis or technical analysis is a very valuable principle in formulating trading
strategies.
COMMODITIES TRADING Commodities trading are a sophisticated form of investing. It is similar to stock trading but
instead of buying and selling shares of companies, an investor buys and sells commodities. Like stocks,
commodities are traded on exchanges where buyers and sellers can work together to either get the
products they need or to make a profit from the fluctuating prices.
Types of Commodities traded in Future Exchanges Energy: Crude Oil, Natural Gas, Coal, Bio fuel, etc.
Metals: Gold, Silver, Platinum, Copper, Steel, etc.
Grains: Wheat, Soybean, Oat, Corn, Rice, etc.
Soft’s: Coffee, Cocoa, Sugar, Cotton, etc.
Others: Timber, CPO, Cattle, Livestock, etc.
Advantages of commodity trading Leverage.
Commission Costs
Liquidity
Ability to go short
No Time Decay
ISSN 2321-0354
Page 91
www.icm
rr.or
g
90
Volume 1, Issue 1 (March, 2013)
INTERCONTINENTAL JOURNAL OF FINANCE RESEARCH REVIEW
Peer
Rev
iew
ed Jo
urna
l of I
nter
-Con
tinen
tal M
anag
emen
t Res
earc
h Co
nsor
tium
http
://w
ww
.icm
rr.o
rg
Disadvantages of commodity trading Leverage:
It can be a double edged sword. Low margin requirements can encourage poor money management,
leading to excessive risk taking. Not only are profits enhanced but so are losses.
Speed of trading:
Traditionally commodities are pit traded and in order to trade a speculator would need to contact a broker
by telephone to place the order who then transmits that order to the pit to be executed. This can take some
take and the risk of slippage occurring can be high. Online futures trading can help to reduce this time by
providing the client with a direct link to an electronic exchange.
Online Commodity Trading Commodity trading online makes the collection of commodity information, up to date prices,
weather forecasts, and commodity charts so much more convenient to access.
Exchange Rate
Currencies are traded in pairs and exchanged one against the other when traded, the rate at which
they are exchanged is called the exchange rate.
Spread It is the difference between BUY and SELL, or BID and ASK. In other words, this is the
difference between the market maker's "selling" price (to its clients) and the price the market
maker "buys" it from its clients.
Margin in Forex Trading Online trading providers need collateral to ensure that the investor can pay in the event of a loss.
The collateral is called the "margin" is also known as minimum security in Foreign exchange
markets. In practice, it is a deposit to the trader's account that is intended to cover any currency
trading losses in the future.
The Role of Foreign Exchange Markets in the Global Marketplace
Exchange Rate
The value of one currency relative to another currency as the number of units of
one currency required to purchase one unit of the other currency.
Foreign-Currency-Denominated Financial Instrument
A financial asset, such as a bond, a stock, or a bank deposit, whose value is
denominated in the currency of another nation
1.2 STATEMENT OF THE PROBLEM
Before investing in any type of investment avenues awareness about the particular sector is
very important for the investor. Now days the Indian share market and the commodity market
play the vital role in Indian economy so the awareness about the forex trading does not reach the
public. The investor not having that much awareness about the investment opportunity and
maximum risk and returns in gold and crude oil in the online forex trading and market analyzing
strategies to invest their fund at right time at right price. So it is necessary to educate the
investors about the forex trading and market analyzing strategies which might be useful for them
ISSN 2321-0354
Page 92
www.icm
rr.or
g
91
Volume 1, Issue 1 (March, 2013)
INTERCONTINENTAL JOURNAL OF FINANCE RESEARCH REVIEW
Peer
Rev
iew
ed Jo
urna
l of I
nter
-Con
tinen
tal M
anag
emen
t Res
earc
h Co
nsor
tium
http
://w
ww
.icm
rr.o
rg
to predict the future price. In this context, the researcher makes an attempt to analyse the
technical tools which supports for the price of gold and crude oil movements.
1.3 OBJECTIVES OF THE STUDY To analysis the day to day price movement for gold futures and crude oil futures.
To analyze the risk and return of gold and crude oil futures.
To ascertain the effectiveness of technical tools supporting for the price movement of gold and
crude oil futures.
1.4 SCOPE OF THE STUDY
The study may produce the valuable information's to the investors to manage their
portfolio.
The suggestions are helpful for the investors to make decisions in order to predict the
market status in the future.
It will educate and create awareness to the investors about the CFD market in forex trading
with regards different types of tools to predict the future price of the gold and crude oil.
The systematic analysis of the technical indicators and chart analysis will produce the best
combination of returns among gold and crude oil.
1.5 RESEARCH METHODOLOGY
Research methodology is a way to systematically solve the research problems. It is
necessary for the research to know not only the research methods but also the research
methodology
2. RESEARCH DESIGN
The research design is the conceptual structure with in which research will be conducted.
Research design is a frame work or blueprint for conducting the research. It is a logical and a
systematic planning and directing a piece of research. The researcher must prepare a detailed
plan before research is undertaken. Both primary data and secondary data were used in this
research. Design includes an outline of what the researcher will do from writing the hypothesis
and its operational implications of the final analysis of the data.
TYPES OF DATA USED
The source of the data collection is secondary in nature. The secondary data are collected
from historical data price of Jakarta Futures Exchange in Indonesia in the websites of the
exchange other links.
Period of the study is for 5year from 2007 to 2011.
ISSN 2321-0354
Page 93
www.icm
rr.or
g
92
Volume 1, Issue 1 (March, 2013)
INTERCONTINENTAL JOURNAL OF FINANCE RESEARCH REVIEW
Peer
Rev
iew
ed Jo
urna
l of I
nter
-Con
tinen
tal M
anag
emen
t Res
earc
h Co
nsor
tium
http
://w
ww
.icm
rr.o
rg
TOOLS USED FOR INTERPRETATION Chart Analysis
Relative Strength Index
Williams Percent Range
Standard Deviation
LIMITATION OF THE STUDY:
The study was undertaken based on two commodities and its price movement.
The study ignores all other fundamental analysis which affects the price movements.
The study does not consider the investors decision towards their investment.
The study does not consider various uncertainty and risk patterns involved in the online forex
trading
The study ignores various disk dealing methodology practices in the market.
3. REVIEW OF LITERATURE
Gulati and Mody (1982)1, on international gold price movements, discussed the impact of
inflationary expectations, exchange rate fluctuations and changes in interest rates on gold prices.
Gulati and Mody studied the gold price movements during the ‘72-‘82 decade. In their work,
they noted that the gold prices and petroleum prices moved in the same direction. While studying
the effect of exchange rate behavior on gold prices, Gulati amd Mody noted real gold price
increased and decreased with the rise and fall of exchange rate fluctuations. Their study
concluded that interest rates did not have a significant weakening effect on gold price, and that
gold prices rise only if there develops some international economic crisis that would violently
disturb the global exchange rates, but this rise in prices would only be temporary. This
Conclusion was strongly affirmed when the world was hit by the Global Financial Crisis of
2008-2009 onwards, during which the gold price had raised to an all-time high of US$1,215 per
ounce on 15th December, 2009.
Sherman (1983) and Baker and Van-Tassel (1985)2
2documented that the gold prices
depend on future inflation rates. Kaufmann and winters (1989) reported that the price of gold is
based on changes in the US rate of inflation.
Kim and Loungani (1992)3 3even supported the view that these oil shocks have been an
important source of economic fluctuations over the past three decades. Therefore, analyzing oil
volatility is of practical importance to financial market participants. Traditionally, it is assumed
that the time series data follows a smooth and continuous process; however the presence of
jumps implies that diffusion models are erroneously specified statistically.
1 Gulati and Mody (1982), “Impact on International Gold Price Movement‖, Journal of
Economics and Management, Vol. 10, pp. 650-678. 1999 2 Sherman (1983) and Baker and Van-Tassel (1985), ―Implications of Gold Price‖, Journal of
International Management, Vol. 23, pp. 256-365. 1985 3 Kim and Loungani (1992), ―Oil Volatility Impact on Financial Market‖
ISSN 2321-0354
Page 94
www.icm
rr.or
g
93
Volume 1, Issue 1 (March, 2013)
INTERCONTINENTAL JOURNAL OF FINANCE RESEARCH REVIEW
Peer
Rev
iew
ed Jo
urna
l of I
nter
-Con
tinen
tal M
anag
emen
t Res
earc
h Co
nsor
tium
http
://w
ww
.icm
rr.o
rg
Blose (1996)4
4compared gold fund returns with the returns on gold bullion. He found
that all the mutual funds have a greater standard deviation than gold Bullion, indicating that the
total risk for the funds is greater than for gold. Gold Bullion has a significantly negative beta, but
the R2 value was low. (0.014). He concluded that the market has a very little, if any, impact on
both gold bullion and gold mutual funds. If an investor (for the purpose of diversification) is
looking for an asset which is largely uncorrelated with the market gold or any of the mutual
funds will serve that purpose; however gold may be marginally better in this regard than the
mutual funds.
Sjaastad and Scacciavillani (1996)5
5reported that gold is a store of value against
inflation. Lawrence (2003) indicated that no significant correlations exist between gold returns
and changes in certain macroeconomic variables such as inflation, gross domestic products
(GDP), and interest rates. Gold also plays a useful role in diversifying risk (see Sherman, 1983;
Kaufman and Winters, 1989; Chua, et al. , 1990; Davidson et al., 2003), as well as being an
attractive investment in its own right.
Johnson and Soenen (1997) and Egan and Peters (2001)66
show that gold has a high
negative correlation with equity indices. Lawrence (2003) pointed out that gold returns are less
correlated with equity returns and bond indices than returns of other commodities.
Christie-David et al. (2000)77
in his research examined the macroeconomic news
releases on gold prices. Christie-David et al. (2000) found that gold responds strongly to CPI
news announcements, in addition to the unemployment rate, GDP, and PPI. Future gold prices
responded strongly to the release of capacity utilization information but do not respond strongly
to federal deficit announcements.
Cai et al. (2001)8
8indicated that the largest returns were due to the following
occurrences: central bank sales, interest rates, oil prices, inflation rates, US unemployment rates,
Asian financial crisis, and political tension in South Africa. Recently, gold has been showing
signs of becoming a more mainstream asset in many portfolios around the world. This could
result in a higher off take for gold products, but on the negative side, it could also imply that its
correlation with other financial assets has increased.
Barsky and Kilian (2004)9 have revealed some significant findings on the effect of oil
prices‘ fluctuations and the resulting effects on the macro economy. Barsky and Kilian, while
commenting on Hamilton‘s(1988) sectoral shifts model – that explained how and oil price shock
would lower real GDP – mentioned that an increase in oil price will resulting reduced purchases
of fuel – goods such as automobiles. Such purchases may have large dollar value relative to the
gasoline – cost. This demand shift results in sectoral reallocation of labor.
Adibe (2009) 9in his research work have discussed the gold‘s importance and relevance
to the macro economy. According to Adibe and Fei, in order to fully understand its the gold-rates
fluctuations and its current status, one cannot totally disregard its history associated with the
4 Blose (1996), ―Comparative Analysis on Gold versus Mutual Fund‖
5 Sjaastad and Scacciavillani (1996), ―Gold Price Movements Against Inflation‖
6 Johnson and Soenen (1997) and Egan and Peters (2001), ― Comparative Analysis On Gold
Against Other Commodities‖ 7 Christie-David et al. (2000), ―Impact of Gold Price Responds to Indices‖
8 Cai(2001), ―Analysis of Gold Price returns‖
9 Adibe (2009), ―Fluctuations of Gold with Relevance to Macro Economy‖
ISSN 2321-0354
Page 95
www.icm
rr.or
g
94
Volume 1, Issue 1 (March, 2013)
INTERCONTINENTAL JOURNAL OF FINANCE RESEARCH REVIEW
Peer
Rev
iew
ed Jo
urna
l of I
nter
-Con
tinen
tal M
anag
emen
t Res
earc
h Co
nsor
tium
http
://w
ww
.icm
rr.o
rg
world economy. A widely used ornamental metal used in rituals, jewelries and decorations. Its
unique chemical characteristics - highly dense, superior malleability and lasting shine - and its
rarity all contribute towards Gold being the most sought after commodity in almost all
cultures.Fie10
in his study concluded that as opposed to the widespread belief about the gold‘s
mysterious behaviour during economic and inflationary trends – and gold widely regarded as a
negative beta asset, having inverse price fluctuation as compared to the economic trends – their
study revealed that gold is a zero – beta asset. Their study also disproved gold‘s use as an
inflation hedge in the short – term. Adibe and Fei further revealed of gold and the value of US
Dollar.
Barsky and Kilian11
also mention in his research that conventional wisdom may suggest
that exogenous political events in the Middle East region drive the major rises in oil prices. In
their conclusion, Barsky and Kilian said that exogenous political events are just one of the
several factors that may affect the driving of oil prices. They also concluded that oil price shocks
may not necessarily be pivotal, although the timing of increased oil prices and recessionary
trends in the economy coincide with one another.
4. DATA ANALYSIS AND INTERPRETATION
TABLE NO 4.1
THE TABLE SHOWING RELATIVE STRENGTH INDEX GOLD
10
Fie, ―Gold Price Movements During Economic And Inflationary Trends‖ 11
Barsky and Kilian, ―Impact of Oil price movement During Political Events‖
DATE
RSI FOR
GOLD
CLOSING PRICE OF
GOLD
2008.03.01 88.44180135 915.6
2008.04.01 77.70848258 877
2008.05.01 70.93105184 886.7
2008.06.01 72.27989619 925.3
2008.07.01 73.54986189 913.4
2008.08.01 74.37156891 830.25
2008.09.01 65.32994924 870.2
2008.10.01 66.73971269 723.38
2008.11.01 53.36330005 816.28
2008.12.01 54.73766842 879.18
2009.01.01 55.30990318 926.93
2009.02.01 58.82818589 944.63
2009.03.01 57.07429181 919
2009.04.01 49.51766257 888.1
2009.05.01 43.95682431 979.07
2009.06.01 54.30322589 926.2
2009.07.01 53.27240801 952.52
2009.08.01 54.28314852 951.15
2009.09.01 51.76781147 1007.35
2009.10.01 56.05792915 1044.9
2009.11.01 64.70547936 1179.32
ISSN 2321-0354
Page 96
www.icm
rr.or
g
95
Volume 1, Issue 1 (March, 2013)
INTERCONTINENTAL JOURNAL OF FINANCE RESEARCH REVIEW
Peer
Rev
iew
ed Jo
urna
l of I
nter
-Con
tinen
tal M
anag
emen
t Res
earc
h Co
nsor
tium
http
://w
ww
.icm
rr.o
rg
2009.12.01 68.75045493 1095.05
2010.01.01 74.39579915 1080.72
2010.02.01 69.35361105 1116.22
2010.03.01 68.07313428 1112.97
2010.04.01 65.21724905 1179.2
2010.05.01 67.77557176 1215.9
2010.06.01 72.12765323 1242.05
2010.07.01 76.56763695 1181.1
2010.08.01 65.88011507 1247.2
2010.09.01 74.71740537 1308.32
2010.10.01 76.00344959 1358.55
2010.11.01 77.7899045 1386.01
2010.12.01 76.88353733 1420.75
2011.01.01 76.79093307 1332.55
2011.02.01 71.28899705 1411.07
2011.03.01 86.00876568 1431.9
2011.04.01 88.69280355 1561.8
2011.05.01 90.30475097 1535.5
2011.06.01 87.26704902 1499.75
2011.07.01 81.21420389 1625.6
2011.08.01 83.46551956 1825.66
2011.09.01 86.59853347 1623.17
2011.10.01 75.02808326 1714.62
2011.11.01 75.61168987 1746.05
2011.12.01 74.92535616 1564.1
ISSN 2321-0354
Page 97
www.icm
rr.or
g
96
Volume 1, Issue 1 (March, 2013)
INTERCONTINENTAL JOURNAL OF FINANCE RESEARCH REVIEW
Peer
Rev
iew
ed Jo
urna
l of I
nter
-Con
tinen
tal M
anag
emen
t Res
earc
h Co
nsor
tium
http
://w
ww
.icm
rr.o
rg
INTERPRETATION
From the above chart it can be it is inferred that RSI still in the overbought zone .it price of the
gold futures is moving down and it is about to brake 1500$ . RSI generate sell signal.
TABLE NO 4.2
THE CHART SHOWING RELATIVE STRENGTH INDEX FOR CRUDE OIL
DATE
CLOSING PRICE OF
CRUDE OIL
RSI FOR
CRUDE OIL
2008.03.01 101.58 78.4942
2008.04.01 114.55 78.3717
2008.05.01 127.75 80.68076
2008.06.01 140.05 82.55533
2008.07.01 124.11 84.62755
2008.08.01 115.59 74.50467
2008.09.01 101.91 68.13434
2008.10.01 67.94 59.17649
2008.11.01 55.15 48.14446
2008.12.01 42.61 42.01823
2009.01.01 41.6 34.055586
2009.02.01 44.2 35.19704
2009.03.01 48.84 33.22773
2009.04.01 50.78 36.24191
2009.05.01 66.53 32.58788
2009.06.01 70.3 39.17207
2009.07.01 69.05 35.50606
2009.08.01 69.58 29.14001
2009.09.01 70.32 22.67122
2009.10.01 76.93 26.35189
2009.11.01 77.35 32.71329
2009.12.01 79.59 37.54058
2010.01.01 72.75 58.71615
2010.02.01 79.65 64.45466
2010.03.01 83.24 83.52643
2010.04.01 86 86.0083
2010.05.01 74.41 86.04691
2010.06.01 75.25 69.69044
2010.07.01 78.89 69.1681
2010.08.01 71.64 61.94896
2010.09.01 79.82 51.21377
2010.10.01 81.35 58.66731
2010.11.01 83.67 59.32203
2010.12.01 91.38 60.31525
2011.01.01 92.05 60.97857
ISSN 2321-0354
Page 98
www.icm
rr.or
g
97
Volume 1, Issue 1 (March, 2013)
INTERCONTINENTAL JOURNAL OF FINANCE RESEARCH REVIEW
Peer
Rev
iew
ed Jo
urna
l of I
nter
-Con
tinen
tal M
anag
emen
t Res
earc
h Co
nsor
tium
http
://w
ww
.icm
rr.o
rg
2011.02.01 97 61.12625
2011.03.01 106.66 62.65814
2011.04.01 113.67 73.68348
2011.05.01 102.6 73.72385
2011.06.01 95.09 62.22531
2011.07.01 95.88 55.41523
2011.08.01 88.8 64.67934
2011.09.01 78.69 58.53597
2011.10.01 92.57 49.8835
2011.11.01 100.39 61.31718
2011.12.01 98.87 61.166
CHART NO 4.2
THE CHART SHOWING RELATIVE STRENGTH INDEX
FOR CRUDE OIL
INTERPRETATION
From the chart it can be inferred that, RSI for crude oil does not generate a clear signal.
Since it is around 60% gain .we can expected the price will come down. Investor has to wait for
clear signal either to buy or sell.
ISSN 2321-0354
Page 99
www.icm
rr.or
g
98
Volume 1, Issue 1 (March, 2013)
INTERCONTINENTAL JOURNAL OF FINANCE RESEARCH REVIEW
Peer
Rev
iew
ed Jo
urna
l of I
nter
-Con
tinen
tal M
anag
emen
t Res
earc
h Co
nsor
tium
http
://w
ww
.icm
rr.o
rg
Williams‘ Percent Range
Williams‘ Percent Range Technical Indicator (%R) is a dynamic technical indicator, which
determines whether the market is overbought/oversold. Williams‘ %R is very similar to the Stochastic
Oscillator. The only difference is that %R has an upside down scale and the Stochastic Oscillator has
internal smoothing. To show the indicator in this upside down fashion, one places a minus symbol before
the Williams Percent Range values (for example -30%). One should ignore the minus symbol when
conducting the analysis.
Indicator values ranging between 80 and 100% indicate that the market is oversold. Indicator
values ranging between 0 and 20% indicate that the market is overbought.As with all overbought/oversold
indicators, it is best to wait for the security‘s price to change direction before placing your trades. For
example, if an overbought/oversold indicator is showing an overbought condition, it is wise to wait for
the security‘s price to turn down before selling the security.An interesting phenomenon of the Williams
Percent Range indicator is its uncanny ability to anticipate a reversal in the underlying security‘s price.
The indicator almost always forms a peak and turns down a few days before the security‘s price peaks and
turns down. Likewise, Williams Percent Range usually creates a trough and turns up a few days before
the security‘s price turns up.
CALCULATION
Below is the formula of the %R indicator calculation, which is very similar to the Stochastic Oscillator
formula: %R = (HIGH(i-n)-CLOSE)/(HIGH(i-n)-LOW(i-n))*100
Where:
CLOSE — is today‘s closing price;
HIGH(i-n) — is the highest high over a number (n) of previous periods;
LOW (i-n) — is the lowest low over a number (n) of previous periods.
TABLE NO 4.3
THE TABLE SHOWING WILLIAMS PERCENTAGE FOR GOLD (2008)
DATE CLOSING PRICE OF
GOLD
%R FOR
GOLD
2008.02.01 925.35 -13.53735133
2008.03.01 976.1 -14.06074241
2008.04.01 915.75 -29.14635671
2008.05.01 873 -40.50481686
2008.06.01 886.8 -36.997026
2008.07.01 925.25 -27.22350728
2008.08.01 913.5 -30.43767767
2008.09.01 833.45 -50.93861244
2008.10.01 871.25 -44.61985875
2008.11.01 728.98 -86.38835891
ISSN 2321-0354
Page 100
www.icm
rr.or
g
99
Volume 1, Issue 1 (March, 2013)
INTERCONTINENTAL JOURNAL OF FINANCE RESEARCH REVIEW
Peer
Rev
iew
ed Jo
urna
l of I
nter
-Con
tinen
tal M
anag
emen
t Res
earc
h Co
nsor
tium
http
://w
ww
.icm
rr.o
rg
2008.12.01 815.83 -61.65674744
2009.01.01 885.85 -41.71768659
2009.02.01 924.5 -30.71162115
2009.03.01 948.03 -24.01116268
2009.04.01 918.9 -32.3062904
2009.05.01 888.12 -36.17296897
2009.06.01 976.1 -9.037073592
2009.07.01 926.32 -24.39084572
2009.08.01 952.2 -16.40861144
2009.09.01 950.95 -21.3429746
2009.10.01 1007.37 -16.24987162
2009.11.01 1041.82 -29.8256538
2009.12.01 1179.35 -8.910928713
2010.01.01 1097.55 -26.52131803
2010.02.01 1080.75 -34.25383149
2010.03.01 1119.15 -29.61426794
2010.04.01 1112.95 -31.32863266
2010.05.01 1179.3 -18.18749025
2010.06.01 1215.72 -12.81798103
2010.07.01 1242.1 -6.372698748
2010.08.01 1181.5 -23.19995557
2010.09.01 1247.22 -17.7968519
2010.10.01 1308.27 -17.88542258
2010.11.01 1358.75 -14.9902957
2010.12.01 1386.04 -11.52356276
2011.01.01 1418.45 -3.234564071
2011.02.01 1332.45 -25.47057607
2011.03.01 1411.02 -9.047630855
2011.04.01 1431.87 -28.36671485
2011.05.01 1566.45 -2.030489643
2011.06.01 1535.6 -9.610383413
2011.07.01 1500.04 -27.83255892
2011.08.01 1605.55 -40.56001483
2011.09.01 1825.71 -12.75316117
2011.10.01 1617.9 -44.2765715
2011.11.01 1714.6 -33.5419681
2011.12.01 1746.07 -28.53063556
ISSN 2321-0354
Page 101
www.icm
rr.or
g
100
Volume 1, Issue 1 (March, 2013)
INTERCONTINENTAL JOURNAL OF FINANCE RESEARCH REVIEW
Peer
Rev
iew
ed Jo
urna
l of I
nter
-Con
tinen
tal M
anag
emen
t Res
earc
h Co
nsor
tium
http
://w
ww
.icm
rr.o
rg
CHART NO 4.3
THE CHART SHOWING WILLIAMS SPERCENTAGE FOR GOLD
INTERPRETATION
From the above chart it can be inferred the Williams percentage or expect to generate a sell
signal for gold futures.
TABLE NO 4.4
THE TABLE SHOWING WILLIAMS PERCENTAGE FOR CRUDE OIL
DATE
CLOSING PRICE
OF CRUDE OIL %R FOR CRUDE
OIL
2008.02.01 101.7 -2.462485571
2008.03.01 101.58 -16.43809882
2008.04.01 114.55 -8.610792193
2008.05.01 127.75 -9.815785935
2008.06.01 140.05 -4.246591869
2008.07.01 124.11 -28.24509221
ISSN 2321-0354
Page 102
www.icm
rr.or
g
101
Volume 1, Issue 1 (March, 2013)
INTERCONTINENTAL JOURNAL OF FINANCE RESEARCH REVIEW
Peer
Rev
iew
ed Jo
urna
l of I
nter
-Con
tinen
tal M
anag
emen
t Res
earc
h Co
nsor
tium
http
://w
ww
.icm
rr.o
rg
2008.08.01 115.59 -40.72203989
2008.09.01 101.91 -57.99040646
2008.10.01 67.94 -92.31746765
2008.11.01 55.15 -93.14710611
2008.12.01 42.61 -93.34752528
2009.01.01 41.6 -94.24339188
2009.02.01 44.2 -91.93720064
2009.03.01 48.84 -87.82153628
2009.04.01 50.78 -86.10076282
2009.05.01 66.53 -72.1305659
2009.06.01 70.3 -68.78658861
2009.07.01 69.05 -69.8953344
2009.08.01 69.58 -69.42522618
2009.09.01 70.32 -62.32612883
2009.10.01 76.93 -49.06832298
2009.11.01 77.35 -37.6070901
2009.12.01 79.59 -5.058697972
2010.01.01 72.75 -22.88465478
2010.02.01 79.65 -8.846074166
2010.03.01 83.24 -1.40874249
2010.04.01 86 -2.572683539
2010.05.01 74.41 -31.63869694
2010.06.01 75.25 -32.53666486
2010.07.01 78.89 -28.82820601
2010.08.01 71.64 -53.88869685
2010.09.01 79.82 -33.39342046
2010.10.01 81.35 -26.49842271
2010.11.01 83.67 -24.62380301
2010.12.01 91.38 -2.611490558
2011.01.01 92.05 -5.285171103
2011.02.01 97 -17.51381215
2011.03.01 106.66 -0.678562453
2011.04.01 113.67 -1.042109741
2011.05.01 102.6 -25.59798573
2011.06.01 95.09 -41.35543433
2011.07.01 95.88 -41.77522632
2011.08.01 88.8 -59.01044031
ISSN 2321-0354
Page 103
www.icm
rr.or
g
102
Volume 1, Issue 1 (March, 2013)
INTERCONTINENTAL JOURNAL OF FINANCE RESEARCH REVIEW
Peer
Rev
iew
ed Jo
urna
l of I
nter
-Con
tinen
tal M
anag
emen
t Res
earc
h Co
nsor
tium
http
://w
ww
.icm
rr.o
rg
2011.09.01 78.69 -81.95642306
2011.10.01 92.57 -51.49409312
2011.11.01 100.39 -36.15153036
2011.12.01 98.87 -39.96487707
CHART NO 4.4
THE CHART SHOWING WILLIAMS PERCENTAGE FOR AND CRUDE OIL
INTERPRETATION
From the above chart it can be inferred the Williams percentage or does not generate a
clear buy or sell signal.
Standard Deviation
Standard Deviation — value of the market volatility measurement. This indicator describes the
range of price fluctuations relative to simple moving average. So, if the value of this indicator is high, the
market is volatile, and prices of bars are rather spread relative to the moving average. If the indicator
value is low, the market can described as having a low volatility, and prices of bars are rather close to the
moving average.
ISSN 2321-0354
Page 104
www.icm
rr.or
g
103
Volume 1, Issue 1 (March, 2013)
INTERCONTINENTAL JOURNAL OF FINANCE RESEARCH REVIEW
Peer
Rev
iew
ed Jo
urna
l of I
nter
-Con
tinen
tal M
anag
emen
t Res
earc
h Co
nsor
tium
http
://w
ww
.icm
rr.o
rg
TABLE NO 4.5
THE TABLE SHOWING COMPARISION OF STANDARD DEVIATION FOR GOLD
AND CRUDE OIL (2007)
DATE
CLOSING
PRICE
OF GOLD
DEVIATION
SQUARE
MONTHLY
RETURN
CLOSING
OF
CRUDE
OIL
DEVIATION
SQUARE
MONTHLY
RETURN
2007.01.01 652.58 2770.443225
57.95 288.0374694
2007.02.01 669.05 1307.907225 2.523828 61.73 174.0200694 6.522865
2007.03.01 663.5 1740.141225 -0.82953 65.68 85.40840278 6.398834
2007.04.01 678.05 737.937225 2.145859 65.58 87.26673611 -0.15225
2007.05.01 660.35 2012.868225 -2.61043 64.25 113.8844694 -2.02806
2007.06.01 649.05 3154.507225 -1.71121 70.45 19.99580278 9.649805
2007.07.01 663.95 1702.800225 2.295663 77.93 9.050069444 10.617459
2007.08.01 672.65 1060.479225 1.31034 73.9 1.043802778 -5.17131
2007.09.01 742.65 1401.379225 10.406601 81.6 44.60013611 10.419486
2007.10.01 795.6 8169.448225 7.129873 95.13 408.3767361 16.580882
2007.11.01 781.95 5888.260225 -1.71569 88.78 192.0534028 -6.66452
2007.12.01 833.2 16380.16023 6.554128 96.08 447.6750694 8.222573
SD 4.17 SD 7.39
AVERAGE
MONTHLY
RETURN
2.31
AVERAGE
MONTHLY
RETURN
4.94
((Source: Secondary data: Harvest Futures Consultants India (P) ltd)
INTERPRETATION
The above table 4.5 explains that the standard deviation for gold was $62(2007) (i.e.8.81%) and
for crude oil $12.50(2007) (i.e.16.67%).Therefore market volatility for Crude oil (16.67%) was
higher than the gold (8.81%). The average monthly return of crude oil futures is higher than gold
futures.
\
ISSN 2321-0354
Page 105
www.icm
rr.or
g
104
Volume 1, Issue 1 (March, 2013)
INTERCONTINENTAL JOURNAL OF FINANCE RESEARCH REVIEW
Peer
Rev
iew
ed Jo
urna
l of I
nter
-Con
tinen
tal M
anag
emen
t Res
earc
h Co
nsor
tium
http
://w
ww
.icm
rr.o
rg
TABLE NO 4.6
THE TABLE SHOWING COMPARISION OF STANDARD DEVIATION FOR GOLD
AND CRUDE OIL (2008)
(Source: Secondary data: Harvest Futures Consultants India (P) ltd)
INTERPRETATION
The above table 4.6 shows that the standard deviation for gold was $62.18 (i.e.7.08%)
and for crude oil $28.58(i.e.28.96%).Therefore market volatility for Crude oil (28.96%) was
higher than the gold (7.08%). The average monthly return of crude oil futures is higher than gold
futures
DATE
CLOSING
PRICE OF
GOLD
DEVIATION
SQUARE
STANDARD
DEVIATION
CLOSING
PRICE
OF
CRUDE
OIL
DEVIATION
SQUARE
STANDARD
DEVIATION
2008.01.01 925.95 2295.687511
91.38 53.48484444
2008.02.01 973.2 9056.060011 5.102867 101.7 9.040044444 11.2935
2008.03.01 915.6 1411.004011 -5.91862 101.58 8.332844444 -0.11799
2008.04.01 877 1.074677778 -0.0421581 114.55 251.4338778 12.768261
2008.05.01 886.7 75.05334444 1.106043 127.75 844.2898778 11.523352
2008.06.01 925.3 2233.822678 0.0435322 140.05 1710.373878 9.62818
2008.07.01 913.4 1250.565344 -1.28607 124.11 646.0069444 -11.38165
2008.08.01 830.25 2283.565511 -9.10335 115.59 285.4973444 -7.37088
2008.09.01 870.2 61.41334444 0.04590899 101.91 10.34694444 -11.83493
2008.10.01 723.38 23918.68454 -16.87198 67.94 945.7675111 -33.33333
2008.11.01 816.28 3813.885878 12.842489 55.15 1896.021878 -18.82543
2008.12.01 879.18 1.307211111 7.705689 42.61 3145.340278 -22.73799
SD 8.075 SD 15.782
AVERAGE
MONTHLY
RETURN
-0.579
AVERAGE
MONTHLY
RETURN
-5.489
ISSN 2321-0354
Page 106
www.icm
rr.or
g
105
Volume 1, Issue 1 (March, 2013)
INTERCONTINENTAL JOURNAL OF FINANCE RESEARCH REVIEW
Peer
Rev
iew
ed Jo
urna
l of I
nter
-Con
tinen
tal M
anag
emen
t Res
earc
h Co
nsor
tium
http
://w
ww
.icm
rr.o
rg
TABLE NO 4.7
THE TABLE SHOWING COMPARISION OF STANDARD DEVIATION FOR GOLD (Source: Secondary data: Harvest Futures Consultants India (P) ltd)
INTERPRETATION The above table 4.7 observed that the standard deviation for gold was $80.82(i.e.8.20%)
and for crude oil $13.00(i.e.20.39%). Therefore market volatility for Crude oil (20.39%) was
higher than the gold (8.20%). The average monthly return of crude oil futures is higher than gold
futures
DATE
CLOSING
PRICE
OF GOLD
DEVIATION
SQUARE
STANDARD
DEVIATION
CLOSING
PRICE
OF
CRUDE
OIL
DEVIATION
SQUARE
STANDARD
DEVIATION
2009.01.01 926.93 3316.416136
41.6 490.8809507
2009.02.01 944.63 1591.079136 1.909529 44.2 382.4306174 6.25
2009.03.01 919 4292.652003 -2.71323 48.84 222.482084 10.497738
2009.04.01 888.1 9296.495003 -3.36235 50.78 168.3722507 3.972154
2009.05.01 979.07 29.68433611 11.031415 66.53 7.696000694 31.016148
2009.06.01 926.2 3401.028003 -5.40002 70.3 42.82611736 5.666617
2009.07.01 952.52 1023.893336 2.841719 69.05 28.02820069 -1.77809
2009.08.01 951.15 1113.445669 -0.14383 69.58 33.92091736 0.767893
2009.09.01 1007.35 521.2850028 5.908637 70.32 43.08828403 1.063524
2009.10.01 1044.9 3645.945669 3.727602 76.93 173.5586674 9.399886
2009.11.01 1179.32 37947.68934 12.864389 77.35 184.8013674 0.545951
2009.12.01 1095.05 12217.24934 -7.14564 79.59 250.720834 2.895928
SD 6.418 SD 9.010
AVERAGE
MONTHLY
RETURN 1.774
AVERAGE
MONTHLY
RETURN 6.390
ISSN 2321-0354
Page 107
www.icm
rr.or
g
106
Volume 1, Issue 1 (March, 2013)
INTERCONTINENTAL JOURNAL OF FINANCE RESEARCH REVIEW
Peer
Rev
iew
ed Jo
urna
l of I
nter
-Con
tinen
tal M
anag
emen
t Res
earc
h Co
nsor
tium
http
://w
ww
.icm
rr.o
rg
TABLE NO 4.8
THE TABLE SHOWING COMPARISION OF STANDARD DEVIATION FOR GOLD
AND CRUDE OIL (2010)
(Source: Secondary data: Harvest Futures Consultants India (P) ltd)
INTERPRETATION
The above table 4.8 formulates that the standard deviation for gold was $370.48
(i.e.29.94%) and for crude oil $5.54(i.e.6.94%).Therefore market volatility for Gold (29.94%)
was higher than the Crude oil (6.94%). The average monthly return of gold futures is higher than
crude oil future
DATE
CLOSING
PRICE
OF GOLD
DEVIATION
SQUARE
STANDARD
DEVIATION
CLOSING
PRICE
OF
CRUDE
OIL
DEVIATION
SQUARE
STANDARD
DEVIATION
2010.01.01 1080.72 24553.58418
72.75 50.23265625
2010.02.01 1116.22 14688.43002 3.84847 79.65 0.03515625 9.484536
2010.03.01 1112.97 15486.76543 -0.29116 83.24 11.57700625 4.507219
2010.04.01 1179.2 3389.083251 5.950744 86 37.97640625 3.315714
2010.05.01 1215.9 462.931084 3.11228 74.41 29.45775625 -13.47674
2010.06.01 1242.05 21.47550069 2.15067 75.25 21.04515625 1.128881
2010.07.01 1181.1 3171.473084 -4.90721 78.89 0.89775625 4.837209
2010.08.01 1247.2 95.72991736 5.596478 71.64 67.19900625 -9.19001
2010.09.01 1308.32 5027.400851 4.900577 79.82 0.00030625 11.418202
2010.10.01 1358.55 14673.48633 3.839275 81.35 2.28765625 1.916813
2010.11.01 1386.01 22080.22637 2.021273 83.67 14.68805625 2.851875
2010.12.01 1420.75 33611.41667 2.506475 91.38 133.2293063 9.214772
SD 3.067 SD 7.600
AVERAGE
MONTHLY
RETURN 2.611
AVERAGE
MONTHLY
RETURN 2.364
ISSN 2321-0354
Page 108
www.icm
rr.or
g
107
Volume 1, Issue 1 (March, 2013)
INTERCONTINENTAL JOURNAL OF FINANCE RESEARCH REVIEW
Peer
Rev
iew
ed Jo
urna
l of I
nter
-Con
tinen
tal M
anag
emen
t Res
earc
h Co
nsor
tium
http
://w
ww
.icm
rr.o
rg
TABLE NO 4.9
THE TABLE SHOWING COMPARISION OF STANDARD DEVIATION FOR GOLD
AND CRUDE OIL (2011)
(Source: Secondary data: Harvest Futures Consultants India (P) ltd)
INTERPRETATION
The above table clears that the standard deviation for gold was $479.63 (i.e.30.49%) and for
crude oil $8.50(i.e.8.78%).Therefore market volatility for Gold (30.49%) was higher than the
Crude oil (8.78%). The average monthly return of crude oil futures is higher than gold futures.
DATE
CLOSING
PRICE
OF GOLD
DEVIATION
SQUARE
STANDARD
DEVIATION
CLOSING
PRICE
OF
CRUDE
OIL
DEVIATION
SQUARE
STANDARD
DEVIATION
2011.01.01 1332.55 57646.80951 92.05 23.09603403
2011.02.01 1411.07 26107.28851 5.892462 97 0.020784028 5.380435
2011.03.01 1431.9 19809.85876 1.476185 106.66 96.12168403 9.958763
2011.04.01 1561.8 117.6682562 9.071863 113.67 282.7162007 6.572286
2011.05.01 1535.5 1379.936756 -1.68395 102.6 32.99545069 -9.73872
2011.06.01 1499.75 5314.045506 -2.32823 95.09 3.118167361 -7.31969
2011.07.01 1625.6 2803.967256 8.391399 95.88 0.952250694 0.830792
2011.08.01 1825.66 64015.32516 12.306841 88.8 64.89645069 -7.38423
2011.09.01 1623.17 2552.523006 -11.09133 78.69 329.9975007 -11.38514
2011.10.01 1714.62 20156.19076 5.634037 92.57 18.36836736 17.638836
2011.11.01 1746.05 30068.42701 1.833059 100.39 12.49033403 8.447661
2011.12.01 1564.1 73.05975625 -10.42066 98.87 4.056867361 -1.5141
SD 7.635 SD 9.366
AVERAGE
MONTHLY
RETURN 1.734
AVERAGE
MONTHLY
RETURN 1.044
ISSN 2321-0354
Page 109
www.icm
rr.or
g
108
Volume 1, Issue 1 (March, 2013)
INTERCONTINENTAL JOURNAL OF FINANCE RESEARCH REVIEW
Peer
Rev
iew
ed Jo
urna
l of I
nter
-Con
tinen
tal M
anag
emen
t Res
earc
h Co
nsor
tium
http
://w
ww
.icm
rr.o
rg
5. FINDING Both RSI and Williams percentage or indicate that there will be fall in the price of the gold in the
near futures.
Both RSI and Williams percentage or indicate that there will be fall in the price of the crude oil in
the near futures.
The standard deviation for gold was $6 in 2007 and for crude oil it was $12.50 in
2007.Therefore market volatility for Crude oil was higher than the gold .
The standard deviation for gold was $62.18 in 2008 and for crude oil it was $28.58 in 2008
.Therefore market volatility for Crude oil was higher than the gold.
The standard deviation for gold was $80.82 in 2009 and for crude oil it was $13.00 in
2008.Therefore market volatility for Crude oil was higher than the gold .
The standard deviation for gold was $370.48 in 2010 and for crude oil it was $5.54 in
2010.Therefore market volatility for Gold was higher than the Crude oil .
The standard deviation for gold was $479.63 in 2011 and for crude oil $8.50 in 2011.Therefore
market volatility for Gold was higher than the Crude oil .
The average monthly return of crude oil futures is higher than the average monthly return of
crude oil futures in all years of study.
6. SUGGESTION
Investor can buy gold / crude oil when RSI is in over sold zone .(ie bellow 20% line ) and sell
when RSI in over bought zone ( ie above 80% line ).
Investor can sell crude oil futures and gold futures as a fall in price is expected in near future.
A single indictor is not enough for arriving at a selling or buying decision. A combination of
Technical Analysis indicators is required for more accurate decisions.
Even though Technical Analysis itself is enough for making decisions in commodity market ,
simultaneous usage of both Fundamental and Technical Analysis will reduce errors in forecasting
future Prices.
7. CONCLUSION It is observed as a result of the study that most of the individuals are unaware of forex
market in India. One of the reasons for the study is mainly done is the forex market is right choice for the
investors to invest in the commodity. Investor not being active in investing in forex market is lack of
awareness about the various instruments. The study shows that Technical Analysis indicators can give a
fair idea about future price movements in commodity market. It is easy for anybody to do Technical
Analysis because of the easy availability of information.The study shows that historical prices have an
impact on future gold and crude oil prices. So past trend can be used for predicting the trend of the future
prices. And it is came to know that the investor may go for trade in gold while comparing to crude oil
because crude oil is having lots of uncertainty and risk involved. Crude oil will suitable only for those
investors who is willing to take more risk In reality only minorities of technicians can consistently and
accurately determine future prices. However, even if you are unable to accurately forecast prices,
technical analysis can be used to consistently reduce your risks and improve your equities in the market.
Commodity market is often considered as the main engine deriving the economic situation of the world.
Mainly if the price of crude oil is going up means the economic growth of the world is moving upwards.
ISSN 2321-0354
Page 110
www.icm
rr.or
g
109
Volume 1, Issue 1 (March, 2013)
INTERCONTINENTAL JOURNAL OF FINANCE RESEARCH REVIEW
Peer
Rev
iew
ed Jo
urna
l of I
nter
-Con
tinen
tal M
anag
emen
t Res
earc
h Co
nsor
tium
http
://w
ww
.icm
rr.o
rg
8. BIBLIOGRAPHY
Books referred JOHN J MURPHY, TRADE SECRETS, (2001) charting made easy, MetaStock Professional
Equis International, Inc.
EDWARD V.MELLAR, SECRETS OF HIGH-YIELD FOREX TRADING Fourth Edition, SPS
Publishing.
C.R.KOTHARI, RESEARCH METHODOLOGY, (2009) methods and Techniques second
Edition, New Age International Publisher.
KATHY LIEN,THE LITTLE BOOK OF CURRENCY TRADING, How to Make Big Profits In
The World of Forex, SKP Publishers House Pvt,Ltd.,
Websites: www.hif-india.com
www.hicfx.com
www.forexfactory.com
www.forexlive.com
ISSN 2321-0354
Page 111
www.icm
rr.or
g
110
Volume 1, Issue 1 (March, 2013)
INTERCONTINENTAL JOURNAL OF FINANCE RESEARCH REVIEW
Peer
Rev
iew
ed Jo
urna
l of I
nter
-Con
tinen
tal M
anag
emen
t Res
earc
h Co
nsor
tium
http
://w
ww
.icm
rr.o
rg
A STUDY ON FLUCTUATIONS IN INDIAN STOCK MARKET
JEGADEESAN.M
SCHOOL OF MANAGEMENT, CARE BUSINESS SCHOOL, TRICHY
ABSTRACT
Stock exchanges to some extent play an important role as indicators, reflecting the
performance of the country's economic state of health. Stock market is a place where securities
are bought and sold. It is exposed to a high degree of volatility; prices fluctuate within minutes
and are determined by the demand and supply of stocks at a given time. Stockbrokers are the
ones who buy and sell securities on behalf of individuals and institutions for some commission.
Technical analysis is the most useful and consistent approach to trading in the markets. Simply
put, technical analysis is the art and science of putting stock information on a chart in the form
of various kinds of bars and detecting different patterns indicators to assess the market
direction. While a lot of people know at least a little about technical analysis, very few
really know how to use it. Technical analysis is not an astrological science for predicting prices
and market direction. The main function of technical analysis is to show the current demand-
supply position of the market, or the particular stock, define risk and reward of each particular
trade, technical analysis is not an end in itself; the end is its effective use for profitable trading.
Keywords: financial statements, stock, futures contract, currency
1. INTRODUCTION TO STUDY
Stock exchanges to some extent play an important role as indicators, reflecting the
performance of the country's economic state of health. Stock market is a place where securities
are bought and sold. It is exposed to a high degree of volatility; prices fluctuate within minutes
and are determined by the demand and supply of stocks at a given time. Stockbrokers are the
ones who buy and sell securities on behalf of individuals and institutions for some commission.
The Securities and Exchange Board of India (SEBI) is the authorized body, which
regulates the operations of stock exchanges, banks and other financial institutions. The past
performances in the capital markets especially the securities scam by Harshad Mehta has led to
tightening of the operations by SEBI.
A Peer Reviewed International Journal
IJFRR
INTERCONTINENTAL JOURNAL OF FINANCE RESEARCH REVIEW
ISSN 2321-0354
Page 112
www.icm
rr.or
g
111
Volume 1, Issue 1 (March, 2013)
INTERCONTINENTAL JOURNAL OF FINANCE RESEARCH REVIEW
Peer
Rev
iew
ed Jo
urna
l of I
nter
-Con
tinen
tal M
anag
emen
t Res
earc
h Co
nsor
tium
http
://w
ww
.icm
rr.o
rg
In addition the International trading and investment exposure has made it imperative to
better operational efficiency. With the view to improve, discipline and bring greater
transparency in this sector, constant efforts are being made and to a certain extent
improvements have been made. As the condition of capital markets are constantly improving, it
has started drawing attention of lot more people than before. On the career related aspects,
professionals have opportunities to choose from for a wide range of jobs available in a number
of organizations in this sector and one can expect to have good times ahead of him.
EQUITY SHARE
The percentage of economic interest in benefit derived from an operation
Share which entitles the holder to claim all there. The opposite of equity share is
preference share
In the wake of the introduction of new economic policy in the middle of the year 1991,
the India capital market has witnessed a tremendous growth. There was an increase in investor
interest during the nineties and an equity culture emerged in the country. To experience sustained
growth statutory legislation has helped the capital market. Foreign Exchange Regulation act is
one such legislation in this direction.
TECHNICAL ANALYSIS
Technical analysis is the most useful and consistent approach to trading in the markets.
Simply put, technical analysis is the art and science of putting stock information on a chart in the
form of various kinds of bars and detecting different patterns indicators to assess the market
direction. While a lot of people know at least a little about technical analysis, very few
really know how to use it. Technical analysis is not an astrological science for predicting prices
and market direction. The main function of technical analysis is to show the current demand-
supply position of the market, or the particular stock, define risk and reward of each particular
trade, technical analysis is not an end in itself; the end is its effective use for profitable trading.
CHARTS
Charts are the working tools of the analyst. They have been developed in a multitude of
forms and style to represent graphically almost anything and everything that take places in the
market, or to plot an ―index‖ derived there form. They may be monthly charts on which an
entire month‘s trading record is condensed into a singles entry, or weekly, daily, hourly,
transaction,‖ point and figure‖ candlestick etc.
They may be constructed an arithmetic, logarithmic, or square-root scale, or projected as
―oscillators‖ they may delineate moving averages, proportion of trading volume to prices
movement, averages price of ―most active‖ issues odd-lot transactions the short interest and an
infinitude of others relations, ratios, and indexes-all technically in the sense that they are derived,
directly or indirectly, forms what has actually been transacted on the exchange.
ISSN 2321-0354
Page 113
www.icm
rr.or
g
112
Volume 1, Issue 1 (March, 2013)
INTERCONTINENTAL JOURNAL OF FINANCE RESEARCH REVIEW
Peer
Rev
iew
ed Jo
urna
l of I
nter
-Con
tinen
tal M
anag
emen
t Res
earc
h Co
nsor
tium
http
://w
ww
.icm
rr.o
rg
TRADING
The Indian context a traders is a person who buys and sells shares at relatively shorter
interval to earn profit. The traders are not averse to going long or short on the market or
individuals stock derivatives. Three types of traders are in market,
A day traders, who buy, sell and square up his positions during the same day.
A swing traders who trade the various up and down swings i.e., from one pivot to
another, or
A position trader who hold long and short positions for periods ranging from several
weeks.
INVESTORS
Then there are the investors who buy and hold stocks for years. These investors generally
do not trade the swings of the market and make buying decisions based on fundamentals and
market news. Investors generally lose except when there are secular bull markets. When the
market moves in smaller swings, however, these investors often lose their investment because
they often buy at market peaks. According To technical analyst long-term investors are the
people who finance the trader‘s profit.
SPECULATION
Contrary to what many people believe, speculation is not gambling. Speculation is the
skill of analyzing data and taking positions on the various market situations to profits from
favorable price movements. In the stock market arena, this activity is also called trading.
2. OBJECTIVES OF THE STUDY
To study about the past history of Nifty index movement.
To study the factors which are making Indian stock market volatile.
To furnish institutional material relevant for understanding the environment in which stock
market fluctuation are occurring.
SCOPE OF THE STUDY
Nifty movement is mainly depending upon economy of the country.
Every small news will affect the Nifty movement
This study can be used by investors, traders and other professionals as a supplement
to their own research.
ISSN 2321-0354
Page 114
www.icm
rr.or
g
113
Volume 1, Issue 1 (March, 2013)
INTERCONTINENTAL JOURNAL OF FINANCE RESEARCH REVIEW
Peer
Rev
iew
ed Jo
urna
l of I
nter
-Con
tinen
tal M
anag
emen
t Res
earc
h Co
nsor
tium
http
://w
ww
.icm
rr.o
rg
LIMITATIONS OF THE STUDY
The prime limitation of the study is size of the sample. The sample consists only Nifty
index data. A larger sample including more number of scripts would be a right choice. Since the
sample script‘s were selected randomly from the specified only Nifty index, it is considered that
the above sample would be sufficient for the purpose of analysis.
Market condition leads to wrong prediction of analysis. All the analysis results come
correct only when analysis goes with market trend.
3. RESEARCH METHODOLOGY
Methods of data collection and the various charting tools applied are discussed here.
RESEARCH DESIGN
A research design is the arrangement of conditions for collection and analysis of data in a
manner that aims to combine relevance to the research purpose with economy in procedure.
Analytical research design is adopted in this project. The main characteristic of this
method is that the researcher has no control over the variable. In this method the facts or
information are used which are already available, and analyze these to make a critical evolution
of the material. The index data chosen from the NSE India site.
No. Of Years : 10 year
Index : Nifty
Year taken for study : 2000-2010
METHODS OF DATA COLLECTION
SECONDARY DATA
The study is based on secondary data. The secondary data are those which have already
been collected by someone else and which have already been passed through the statistical
process. The methods of collecting secondary data are published data or unpublished data. It
takes short time and relatively low cost. In addition to secondary data, primary data through
company report, pamphlets, discussion with company officials,etc have also been collected for
the study.
TOOLS USED FOR ANALYSIS
Moving average
4. DATA ANALYSIS AND INTERPRETATION
4.1.1 RESISTENCE AND SUPPORT LEVEL
Resistance Level
In simple words the meaning of resistance is opposition. As the name indicates, it
opposes the share price going in upper direction. It is the level where share price may stop before
continuing its upper journey.
ISSN 2321-0354
Page 115
www.icm
rr.or
g
114
Volume 1, Issue 1 (March, 2013)
INTERCONTINENTAL JOURNAL OF FINANCE RESEARCH REVIEW
Peer
Rev
iew
ed Jo
urna
l of I
nter
-Con
tinen
tal M
anag
emen
t Res
earc
h Co
nsor
tium
http
://w
ww
.icm
rr.o
rg
But if the buying starts from all sides then no resistance come into picture the resistance
level is just broken and share price will continue its upward journey. To break the resistance
level volumes also play a major role.
If the share price moves above the resistance level with huge support of volumes then it is
considered as confirmed up trend.
Once the resistance is broken then the share moves till its next resistance level or go in
consolidation (share movement with very less price variation) phase and then after getting
appropriate buying with good support of volumes then it tries to break its next resistance level
and will proceed and this continues.
The major bullish resistance is considered as 200 DMA (daily moving average) As long
as the share or index is trading above this level then it is considered as bullish or if share or index
moves from bottom and breaks this level then further upside is confirmed and on the opposite
side if the 200 DMA is broken from above then the down trend will continue and this is what
happened with Nifty and Sensex when they broke their 200 DMA in January 2008. Market has
seen more than 60% fall after the broke of 200 DMA support level.
Resistance broken will act as support level (in case of moving average method)
Trade with Support and Resistance
Support Level
As the name indicates it provides support for share price to prevent it from falling further.
If the share price starts falling then it is expected that it may take halt at its support level but if
the selling and especially short selling is taking place then no support will comes into picture.
If the selling pressure is from all sides then it may or may not take halt or wait near its
support level and will continue its downward journey till it finds next support level.
4.1.2 MOVING AVERAGE
The market indices do not rise or fall in straight line. The upward and downward
movements are interrupted by counter moves. The underlying trend is studied by smoothing of
the data. To smooth the data moving average technique is used.
The word ―moving‖ means that the body of the data moves ahead to include the recent
observation. If it is six months moving averages.
STOCK PRICES AND STOCK PRICES MOVING AVERAGE
Stock prices and stock prices moving average buy and sell signals are provided by the
moving averages. Moving averages are used along with the price of the scrip. The stock price
may intersect the moving average at a particular point. Downward penetration of the rising
average indices the possibility of a further falls. Upward penetration of a falling average would
indicate the possibility of the further rise and gives the buy signal
ISSN 2321-0354
Page 116
www.icm
rr.or
g
115
Volume 1, Issue 1 (March, 2013)
INTERCONTINENTAL JOURNAL OF FINANCE RESEARCH REVIEW
Peer
Rev
iew
ed Jo
urna
l of I
nter
-Con
tinen
tal M
anag
emen
t Res
earc
h Co
nsor
tium
http
://w
ww
.icm
rr.o
rg
SIMPLE MOVING AVERAGE
In financial applications a simple moving average (SMA) is the unweighted mean of the
previous n datum points. However, in science and engineering the mean is normally taken from
an equal number of data either side of a central value. This ensures that variations in the mean
are aligned with the variations in the data rather than being shifted in time. An example of a
simple unweighted running mean for a 10-day sample of closing price is the mean of the
previous 10 days' closing prices, as illustrated in the chart below. The formula is
CHART NO 1
200 DAYS MOVING AVERAGE
JAN 2001 TO AUGUST 2002
CHART NO 1.1
SIMPLE MOVING AVERAGE
OCTOBER 2001 TO FEB 2002
ISSN 2321-0354
Page 117
www.icm
rr.or
g
116
Volume 1, Issue 1 (March, 2013)
INTERCONTINENTAL JOURNAL OF FINANCE RESEARCH REVIEW
Peer
Rev
iew
ed Jo
urna
l of I
nter
-Con
tinen
tal M
anag
emen
t Res
earc
h Co
nsor
tium
http
://w
ww
.icm
rr.o
rg
CHART NO 1.2
SIMPLE MOVING AVERAGE
APRIL 2002 TO JULY 2002
INTERPRETATION
The National Stock Exchange (NSE) Index (S&P CNX Nifty) also suffered a similar
slump during this period. The decline in equity prices in leading stock markets abroad following
the terrorist attacks on the USA on September 11, 2001 led to further squeezing of the stock
indices at home. The Sensex dropped to 2600 on September 21, 2001, registering a fall of more
than one thousand points from 3604 on the eve of the current financial year. The measures taken
by both the Government and the regulatory authorities in the wake of the September 11 crisis,
backed by improvement in investor sentiment abroad, facilitated significant recovery in the stock
market.
Except for September 2001, the net FII investment was positive during the first ten
months of the current year. Net FII investment amounted to US$1,295 million during April
2001-January 2002 compared to US$1,379 million during the corresponding previous period.
The uncertainty and panic resulting from the terrorist attacks on the USA led to sudden increase
in sales, which exceeded purchases by about 16 per cent. As a result net investment by FIIs
declined by US$113 million in September 2001.
ISSN 2321-0354
Page 118
www.icm
rr.or
g
117
Volume 1, Issue 1 (March, 2013)
INTERCONTINENTAL JOURNAL OF FINANCE RESEARCH REVIEW
Peer
Rev
iew
ed Jo
urna
l of I
nter
-Con
tinen
tal M
anag
emen
t Res
earc
h Co
nsor
tium
http
://w
ww
.icm
rr.o
rg
CHART NO 2
SIMPLE MOVING AVERAGE
AUGUST 2002 TO MARCH 2004
INTERPRETATION
The daily average return in the Nifty was the highest in the year 2003–04. Strong
economic fundamentals exhibited in the fall in interest rates, strong GDP growth rate, increase in
foreign exchange reserves and exports of Indian companies doubled the Nifty and the Sensex in
the first three quarters. Further, the large expenditure by the Government on infrastructure sector
and the reform process enhanced the morale and motivation levels of Corporate India which in
turn boosted the stock market returns.
ISSN 2321-0354
Page 119
www.icm
rr.or
g
118
Volume 1, Issue 1 (March, 2013)
INTERCONTINENTAL JOURNAL OF FINANCE RESEARCH REVIEW
Peer
Rev
iew
ed Jo
urna
l of I
nter
-Con
tinen
tal M
anag
emen
t Res
earc
h Co
nsor
tium
http
://w
ww
.icm
rr.o
rg
CHART NO 3
SIMPLE MOVING AVERAGE
DECEMBER 2004 TO SEPTEMBER 2005
INTERPRETATION
There was a decline in the return in the year 2004–2005. As the index value of the Nifty
sharply came down from 1892.45 and 5925.58 respectively on 23rd
April 2004, to 1388.75 and
4505.16 respectively in May, 2004, a lower circuit breaker was applied on the NSE for the first
time.
This brought a total halt to all trading and the fund flow to stock market from the retail
investors and the Foreign Institutional Investors dwindled. They were net sellers in May, 2004 by
2005; India‘s growth story was well established. Money started pouring in from everywhere. All
these factors boost the Indian stock market scaled high. Two things have happened in this period
to push the market to uncharted territory. One is a robust inflow of foreign money, as more and
more FIIs have rushed to pump money into the Indian market.
CHART NO 4
SIMPLE MOVING AVERAGE
JULY 2006 TO APRIL 2007
ISSN 2321-0354
Page 120
www.icm
rr.or
g
119
Volume 1, Issue 1 (March, 2013)
INTERCONTINENTAL JOURNAL OF FINANCE RESEARCH REVIEW
Peer
Rev
iew
ed Jo
urna
l of I
nter
-Con
tinen
tal M
anag
emen
t Res
earc
h Co
nsor
tium
http
://w
ww
.icm
rr.o
rg
INTERPRETATION
Again there was a decline in the market return in end the year 2006-2007. Global crude
oil prices were surging yet again and had touched $78 a barrel due to the tensions in West Asia
and the hurricanes from the Atlantic into the US east coast of the year further surged in crude
prices and oil production and refinery output were disrupted in the affected area.
The RBI had also done its bit in doing the same in India and a further movement in that
direction cannot but had an adverse impact on the stock market. FII flows in 2006, at about $8.5
billion (around Rs 38,000 crore), were lower by 20 per cent than in 2005. But this was due to the
markets tanking in May and June. Pharma, ferrous metals, FMCG, oil and gas, and auto
components did perform well in that year. The year 2007 saw Indian stock markets scaling new
peaks.
CHART NO 5
SIMPLE MOVING AVERAGE
MARCH 2008 TO DECEMBER 2008
INTERPRETATION
In 2008, a series of bank and insurance company failures triggered a financial crisis that
effectively halted global credit markets and required unprecedented government intervention. Lehman
Brothers declared bankruptcy on September 14th after failing to find a buyer.
In fact, by September 17, 2008, more public corporations had filed for bankruptcy in the U.S.
than in all of 2007. These failures caused a crisis of confidence that made banks reluctant to lend money
amongst themselves, or for that matter, to anyone.
The crisis has its roots in real estate and the subprime lending crisis. Commercial and residential
properties saw their values increase precipitously in a real estate boom that began in the 1990s and
increased uninterrupted for nearly a decade.
Increases in housing prices coincided with the investment and banking industry lowering lending
standards to market mortgages to unqualified buyers allowing them to take out mortgages while at the
same time government deregulation blended the lines between traditional investment banks and mortgage
lenders.
ISSN 2321-0354
Page 121
www.icm
rr.or
g
120
Volume 1, Issue 1 (March, 2013)
INTERCONTINENTAL JOURNAL OF FINANCE RESEARCH REVIEW
Peer
Rev
iew
ed Jo
urna
l of I
nter
-Con
tinen
tal M
anag
emen
t Res
earc
h Co
nsor
tium
http
://w
ww
.icm
rr.o
rg
Most of the foreign countries investment came from U.S countries. Indian IT companies
outsourcing from U.S. it haS been affected to Indian economy.
CHART NO 6
SIMPLE MOVING AVERAGE
OCTOBER 2009 TO JULY 2010
CHART NO 6.1
SIMPLE MOVING AVERAGE
APRIL 2010 TO MAY 2010
INTERPRETATION
Standard & Poor‘s India outlook downgrade was expected. What is disturbing — the government
managed to do that in less than two years. It was in March 2010 that India was upgraded to ‗stable‘ —
and now it‘s down to ‗negative‘. It was not because the government took a wrong step but because it did
not take any step at all. And if this continues, the economy will be confronted with a crisis.
Ratings agencies are not taken seriously, more so by governments. Surely, ratings are not a
precise science; it is more a matter of judgment. But no one likes being downgraded even when it is
deserved. Last year when the U.S. was downgraded from AAA to AA-plus, U.S. officials called the
assessment ‗hasty‘.
ISSN 2321-0354
Page 122
www.icm
rr.or
g
121
Volume 1, Issue 1 (March, 2013)
INTERCONTINENTAL JOURNAL OF FINANCE RESEARCH REVIEW
Peer
Rev
iew
ed Jo
urna
l of I
nter
-Con
tinen
tal M
anag
emen
t Res
earc
h Co
nsor
tium
http
://w
ww
.icm
rr.o
rg
In 2010, the Indian economy was growing at 8.4 percent. That growth also helped the exchequer
to mop up more tax revenue and bring the fiscal deficit down to 4.7 percent, with public debt at 62.4
percent of GDP. The balance of payments was sound with current ratio at 2.9 percent which was fully
covered by foreign investment and external commercial borrowings, leaving a surplus for the RBI to pile
up foreign exchange reserves.
That excitement ended abruptly. By the last quarter of 2011, growth slumped to 6.1 percent. That
was accompanied by a serious imbalance in the income and expenditure of the government and the
country‘s receipts and payments of foreign exchange.
S&P cannot be blamed if it reminds us that the economy is precariously poised. The government
and the RBI know that well. But managing the economy is now more about managing the coalition. That
is difficult because the different partners are not on the same wavelength. But keeping the partners
amused, as has been done so far, will only invite a crisis.
EFFECT OF FLUCTUATION ON INDIAN STOCK MARKET
The economy is as sound as it was in the boom time. The companies are as profitable as
they were a few days ago. Yet, the market crashed because the Government tried to instill some
sort of regulation in it. As I wrote in my last article that a major portion of the money being
invested into the share market is coming from FIIs (Foreign Institutional Investors).
The cause of concern for the Government was that in this major share of FIIs, more than
half was in the form of hot money being invested into the market by anonymous investors who
pump money into the market by utilizing the Participatory Note (PN) facility. All those foreign
investors who are not registered with the SEBI (Stock Exchange Board of India), the regulatory
body for stocks in India, cannot directly deal in buying/selling of sticks.
So they took a sort of permission from registered FIIs by buying Participatory Notes (PN)
from them in exchange of dollars, which ultimately allows them trade in the market. Though, this
concept of allowing anonymous investors in the market broaden the reach of the market, it also
ensure free entry of dollars into Indian economy as well as increase the percentage of hot money
in the market. The hot money is that kind of money which is invested only for a short time to
make some quick buck. It is not invested with a long term mindset.
Since the continuous inflow of dollar into Indian economy is making the Indian currency
(Rupee) stronger and thus making the export costlier, the government was looking for some way
to curb this inflow of dollars. Making the availability of Participatory Notes some difficult for
foreign investors was one step Government thought would help control the inflow of dollars. So
a few days ago the SEBI contemplated on a draft policy to make the issuing of PN difficult for
FIIs.
This was the step which gave a jolt to the buying spree of FIIs. As people found that it
would be difficult to trade in the market in future owing to non-availability of PN, they started
exiting form the market by selling their stock.
The market fell more than a 1000 point in a few hours and had to shut down for some
time. Ultimately the Government had to rush in to alleviate the growing concern of Investors by
Stating that it would not control the issuing of PN to investors. This news will from the Business
Standard give you some detail of this exercise done by the Government. As of now the market is
still fluctuating and is yet to be stabilized.
ISSN 2321-0354
Page 123
www.icm
rr.or
g
122
Volume 1, Issue 1 (March, 2013)
INTERCONTINENTAL JOURNAL OF FINANCE RESEARCH REVIEW
Peer
Rev
iew
ed Jo
urna
l of I
nter
-Con
tinen
tal M
anag
emen
t Res
earc
h Co
nsor
tium
http
://w
ww
.icm
rr.o
rg
Owing to stock market boom, there is another very interesting situation being faced by
Reserve Bank of India (RBI) (the leading central bank which decides various economic policies
here just like the Federal Reserve Bank of US.) The investment being made by FIIs in Indians
are market has resulted in to a huge inflow of dollars into the economy.
The profits margin of these industries have reduced as it mostly depend on current value
of dollar. There is a pressure on Government to manage the appreciation of rupee to favor
exporters. Ironically, this can only be done if Government put some break on the inflow of
dollars by FIIs which will actually mean putting a break on stock market boom. (It actually
happened some days ago as I described above) Government certainly wants to spoil the party
that is going on in the stock market. However, the continued depreciation of dollar is also a cause
of deep concern which needs to be addressed.
The last but not the least is the overvaluation of many stocks in the market. Some experts
have opined that market is trading at 22 to 23 times of actual earning and no one can justify these
valuations. In nutshell if I am to summarize this boom of stock market, I must say that this boom
is not going to last forever as it is dependent on some very volatile factors that may change in the
times to come. As I explained in my earlier article, a increase in interest rate in US may reverse
this flow of FIIs. Or we may see emergence of a new market with great potential on some other
place on earth. All these things, if happen, can put a break on this boom.
Stock markets & recession
The economy and the stock market are closely related. The stock markets reflect the
buoyancy of the economy. In the US, a recession is yet to be declared by the Bureau of
Economic Analysis, but investors are a worried lot. The Indian stock markets also crashed due to
a slowdown in the US economy.
The Sensex crashed by nearly 13 per cent in just two trading sessions in January. The
markets bounced back after the US Fed cut interest rates. However, stock prices are now at low
ebb in India with little cheer coming to investors.
When the global economy has been cooling down, and the financial sector in particular
has been heading from one cold shower to the next, it was inevitable that stock markets around
the world would start catching the chill.
The way in which Asian stock prices responded last week to the fall of the Dow Jones
and Nasdaq indices by 4 per cent, hitting a 10-month low, has also punctured a hole in the
decoupling argument (which said Asia would not be hit by an America-based problem) that had
become fashionable in recent weeks.
Investors around the world have taken note of the fact that the broad-based S&P 500
index is at a 16-month low, along with European stocks. And investors seem to have little faith
in the Bush rescue plan's ability to ward off a recession in the US.
Indian markets worst hit
It is interesting that Indian markets were hit the most, among all Asian markets. This may
have been because the correction in the overheated Chinese stock market began some weeks ago.
Investors will also have noticed that the third-quarter corporate numbers show significant
deceleration in both sales and profit growth, when compared to the same quarter a year earlier.
When coupled with the data showing that the export target for the year will be missed by
a wide margin, and that the industrial sector has suffered a sharp slowdown, it was inevitable that
stock prices would have to come off their dizzy highs.
ISSN 2321-0354
Page 124
www.icm
rr.or
g
123
Volume 1, Issue 1 (March, 2013)
INTERCONTINENTAL JOURNAL OF FINANCE RESEARCH REVIEW
Peer
Rev
iew
ed Jo
urna
l of I
nter
-Con
tinen
tal M
anag
emen
t Res
earc
h Co
nsor
tium
http
://w
ww
.icm
rr.o
rg
What began with profit-booking and unwinding of long positions cascaded on Friday into
a 3.5 per cent decline in the Sensex. Foreign institutional investors had moved to the sidelines in
the secondary markets even earlier, and FIIs have been net sellers to the tune of Rs 2,200 crore
(Rs 22 billion) in January. Also relevant was the Reliance Power IPO, which pulled in a record
amount of application money (Rs 1,15,000 crore (Rs 1,150 billion)).
Even if a third or a fourth of that was being garnered by sale of stocks, it is a large
enough sum for the market to go into correction mode. There is no doubt that valuations had
become expensive. Even after the 10 per cent correction from the market's peak, the Sensex
trades at a trailing P/E multiple of 24.5, which is not cheap in anyone's book.
Impact of a US recession on India
A slowdown in the US economy is bad news for India. Indian companies have major
outsourcing deals from the US. India's exports to the US have also grown substantially over the
years. The India economy is likely to lose between 1 to 2 percentage points in GDP growth in the
next fiscal year. Indian companies with big tickets deals in the US would see their profit margins
shrinking.
The worries for exporters will grow as rupee strengthens further against the dollar. But
experts note that the long-term prospects for India are stable. A weak dollar could bring more
foreign money to Indian markets. Oil may get cheaper brining down inflation. A recession could
bring down oil prices to $70.
Between January 2001 and December 2002, the Dow Jones Industrial Average went
down by 22.7 per cent, while the Sensex fell by 14.6 per cent. If the fall from the record highs
reached is taken, the DJIA was down 30 per cent in December 2002 from the highs it hit in
January 2000. In contrast, the Sensex was down 45 per cent.
The whole of Asia would be hit by a recession as it depends on the US economy. Asia is
yet to totally decouple itself (or be independent) from the rest of the world, say experts.
Black Monday saw bloodbath on Dalal Street as the Indian stock markets crashed by over
1430 points in afternoon trade (the market has since then recovered somewhat), reminding
investors that there is no one-way bet on the stock market.
5. FINDINGS Stock market fluctuates based on changes in the external environment.
Stock market is all about predicting future prices of stocks and earning returns.
Stock market is very sensitive to news flows.
It is based on ―high risk and high return.‖
Comparatively stock market is less risky than the other market and generates more
money for the economy One, who has good knowledge in stock market, can survive in the market and generates profits or
good returns whether the market is up or down.
Investors should not invest on the basis of rumors they must observe the market
condition or trends in Indian economy and then invest If they want to generate good
return.
ISSN 2321-0354
Page 125
www.icm
rr.or
g
124
Volume 1, Issue 1 (March, 2013)
INTERCONTINENTAL JOURNAL OF FINANCE RESEARCH REVIEW
Peer
Rev
iew
ed Jo
urna
l of I
nter
-Con
tinen
tal M
anag
emen
t Res
earc
h Co
nsor
tium
http
://w
ww
.icm
rr.o
rg
6. SUGGESSTIONS
In addition to the moving average analysis of stock prices, investors shall consider the
following indicators before making an investment decision:
Earnings and valuations of individual stocks based on fundamental analysis.
Inflation and bank rates prevailing and the directions in which they are expected to more.
Global risk.
Oil prices movements as a resulting of geopolitical dynamics.
Changes in regulatory, policy issues and the nature of impact (positive / negative) of such
changes on the industry sector/stock.
7. CONCLUSION
The following points that emerged from the study shall be and significance to investors
and policy makers:
Investors It is suggested that long term investors should not invest into panic market, as it would lead
investors to lose their wealth.
It must be remembered that long-term investors should go for frontline (Sensex /Nifty 50) stocks,
which helps to keep their income regular and steady.
It is also suggested that investors should take into consideration following aspects before
investing into script of the
1. Long term growth prospects of the company
2. Financial positions of the company
3. Liquidity position
4. Dividend policy
5. Past performance of the company
Brokers
1. Brokers should separate their personnel portfolio from High Net worth Individuals (HNI).
2. Brokers should not exceed their trading limit in terms of upper and lower limit.
3. Brokers should not leverage extensively as it may result in margin calls and subsequent
distress sale of the stocks pledged
8. BIBLIOGRAPHY
Text books
The Stock Market-The Stock Market - Rik W.Hafer, Scott E. Hein, R. W.Hafer work
Package no. 6, 7 & 8
Investment Analysis and portfolio management-M Raghunathan, Madhumati page
No. 23,24,26,28,200,209
Journals and magazines
JARN, Published Feb 2009
Business today
Business standard
ISSN 2321-0354
Page 126
www.icm
rr.or
g
125
Volume 1, Issue 1 (March, 2013)
INTERCONTINENTAL JOURNAL OF FINANCE RESEARCH REVIEW
Peer
Rev
iew
ed Jo
urna
l of I
nter
-Con
tinen
tal M
anag
emen
t Res
earc
h Co
nsor
tium
http
://w
ww
.icm
rr.o
rg
Websites: www.tdd.ltslnewsStock_ExchangesStock.htm
www.stockmarkets.com
www.bseindia.com
http://econ.worldbank.org
www.icai.org
http://en.wikipedia.org -
www.tradingstock.com
The economics times
ISSN 2321-0354