22
Interdependence of Preferential Economic Policies across Subjects Peter Egger* & Georg Wamser * ETH Zürich, CEPR Workshop on PTAs and the WTO: A New Era WTO, November 04, 2010
| Date post: | 17-Dec-2015 |
| Category: |
Documents |
| Upload: | abner-stone |
| View: | 219 times |
| Download: | 0 times |

Interdependence of Preferential Economic Policies across
Subjects
Peter Egger* & Georg Wamser
* ETH Zürich, CEPR
Workshop on PTAs and the WTO: A New Era
WTO, November 04, 2010
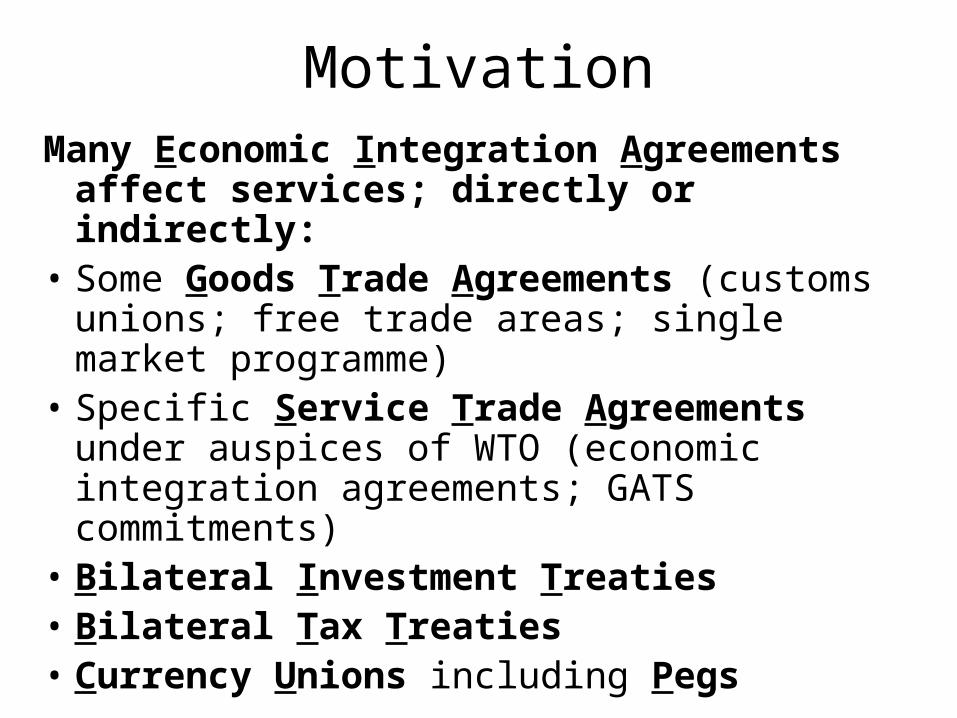
MotivationMany Economic Integration Agreements
affect services; directly or indirectly:• Some Goods Trade Agreements (customs
unions; free trade areas; single market programme)
• Specific Service Trade Agreements under auspices of WTO (economic integration agreements; GATS commitments)
• Bilateral Investment Treaties• Bilateral Tax Treaties• Currency Unions including Pegs
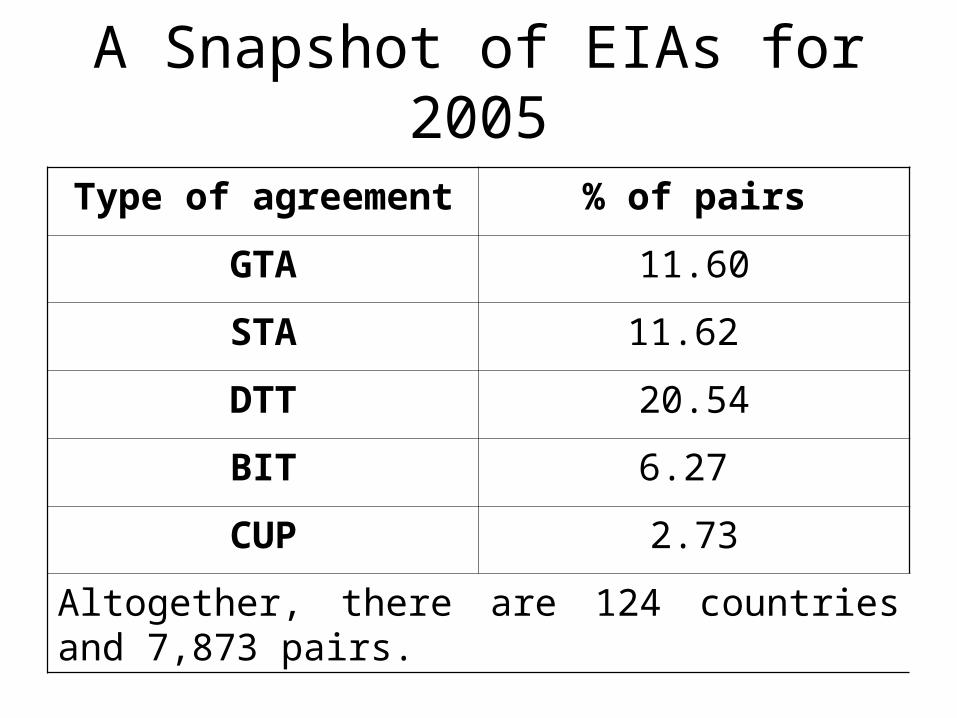
A Snapshot of EIAs for 2005
Type of agreement % of pairs
GTA 11.60
STA 11.62
DTT 20.54
BIT 6.27
CUP 2.73
Altogether, there are 124 countries and 7,873 pairs.

A Snapshot of EIAs for 2005Countries with/and
GTA STA BIT DTT CUP None
GTA
STA 5.5
BIT 1.9 1.6
DTT 6.0 4.4 5.3
CUP 0.9 0.9 0.4 1.4
None 3.8 5.5 0.5 10.1 1.2 66.5

What’s Behind That Simple TableReality is a jungle of EIAs
(Spaghetti Bowl in 5-dimensional space):25=32 combinations possible
The following ones are most frequent:
Agreements Frequency (All Years?2005)GTA
STA
B I T
DTT
CUP
# of pairs % of all EIAs
0 0 0 0 0 5,238 66.53
0 0 1 0 0 800 10.16
0 1 0 0 0 429 5.45
1 0 0 0 0 300 3.81
0 0 1 1 0 257 3.26

Questions
• Determinants of each type of EIA (economic fundamentals)?
• How is membership correlated given fundamentals?
• What are consequences of EIAs and their combination?
• Which outcomes are affected?
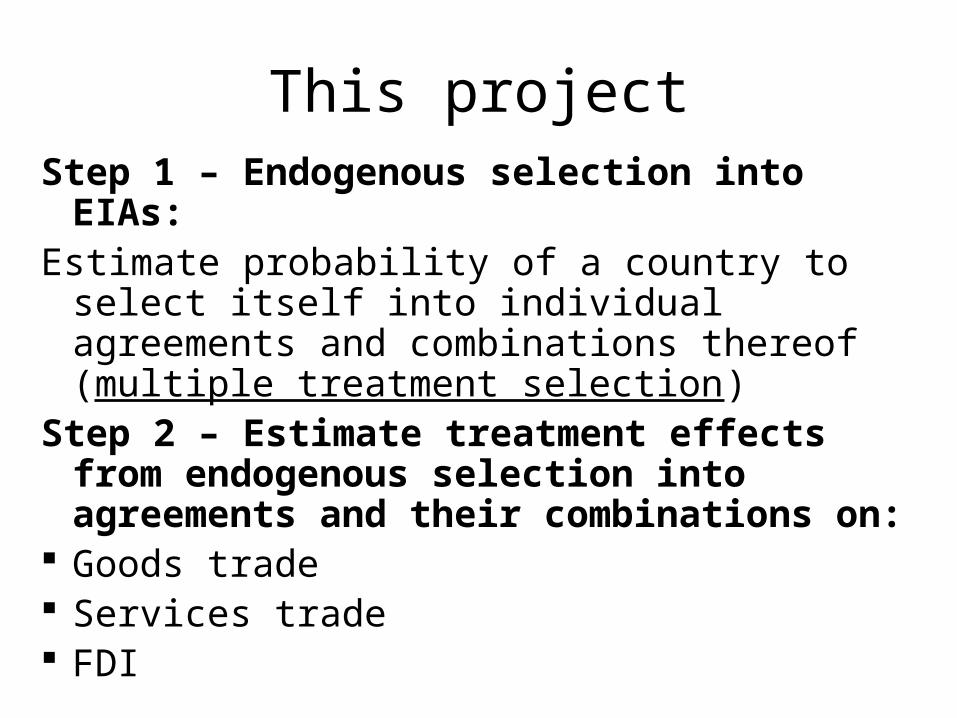
This projectStep 1 – Endogenous selection into EIAs:Estimate probability of a country to select itself
into individual agreements and combinations thereof (multiple treatment selection)
Step 2 – Estimate treatment effects from endogenous selection into agreements and their combinations on:
Goods trade Services trade FDI
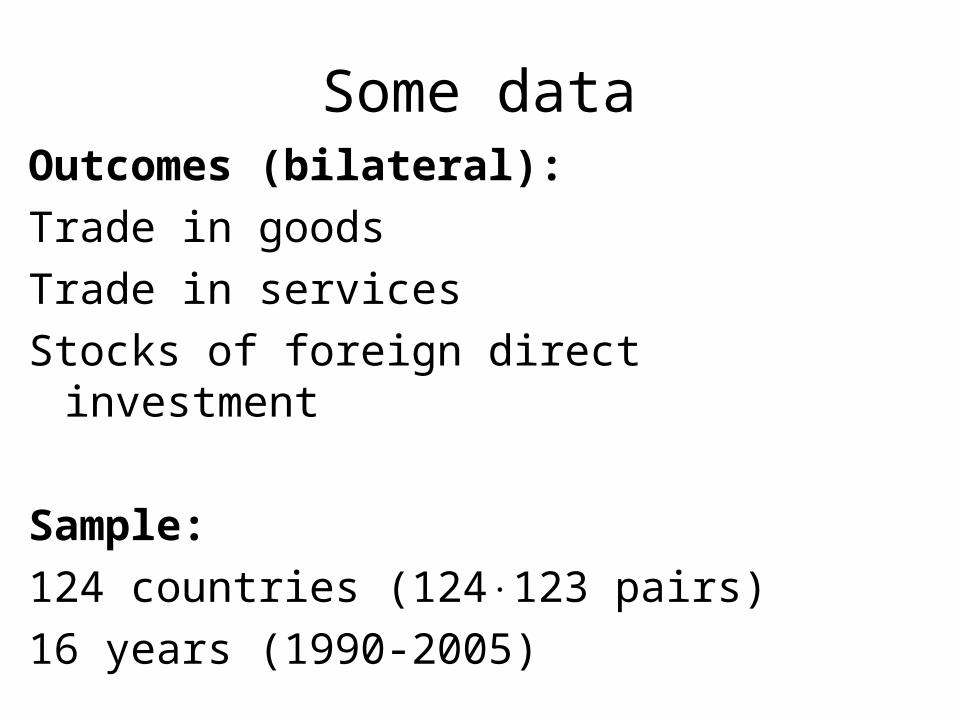
Some dataOutcomes (bilateral):
Trade in goods
Trade in services
Stocks of foreign direct investment
Sample:
124 countries (124123 pairs)
16 years (1990-2005)

Goods Trade Inside and OutsideCountries with/and
GTA STA BIT DTT CUP None else
GTA
STA 4.7598.2
BIT 5.94100
6.22100
DTT 5.6799.4
6.1799.3
5.5798.8
CUP 5.8098.8
7.2098.3
5.72100
6.4299.6
None else
1.2889.0
-.08789.5
4.8196.4
4.1298.2
1.2597.2
-.37771.6
Means: log exports (top) and % of exports>0 (bottom).

Service Trade Inside and OutsideCountries with/and
GTA STA BIT DTT CUP None else
GTA
STA 5.9317.3
BIT 4.3332.0
4.7226.7
DTT 5.7320.9
5.9024.3
4.0923.9
CUP 6.1036.5
6.1049.0
3.4129.4
5.4833.2
None else
3.110.52
00
4.1410.6
4.429.5
2.344.4
2.260.97
Means: log exports (top) and % of exports>0 (bottom).
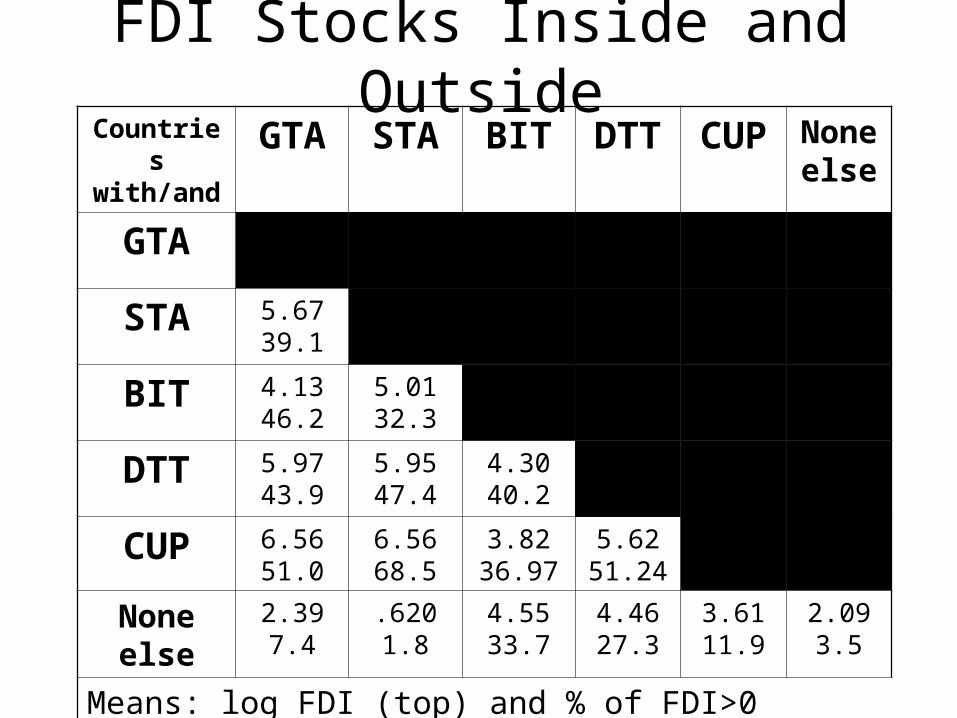
FDI Stocks Inside and OutsideCountries with/and
GTA STA BIT DTT CUP None else
GTA
STA 5.6739.1
BIT 4.1346.2
5.0132.3
DTT 5.9743.9
5.9547.4
4.3040.2
CUP 6.5651.0
6.5668.5
3.8236.97
5.6251.24
None else
2.397.4
.6201.8
4.5533.7
4.4627.3
3.6111.9
2.093.5
Means: log FDI (top) and % of FDI>0 (bottom).

Summary Statistics for OutcomeOutcome Mean Std.Dev. Pairs
Goods trade (US$) .751 4.12 98,899
P(goods trade>0) .779 .415 127,019
Service trade (US$) 4.00 2.34 3,548
P(service trade>0) .083 .169 120,964
FDI stocks (US$) 3.76 3.53 10,538
P(FDI stocks>0) .083 .276 126,859
Values are expressed in logs.

Correlation Coefficients for Outcome
Outcome (binary) (G) (S) (F)
Goods trade (G) 1.00 - -
Service trade (S) 0.14 1.00 -
FDI stocks (F) 0.10 0.16 1.00
Outcome (logs) (G) (S) (F)
Goods trade (G) 1.00 - -
Service trade (S) 0.84 1.00 -
FDI stocks (F) 0.81 0.78 1.00
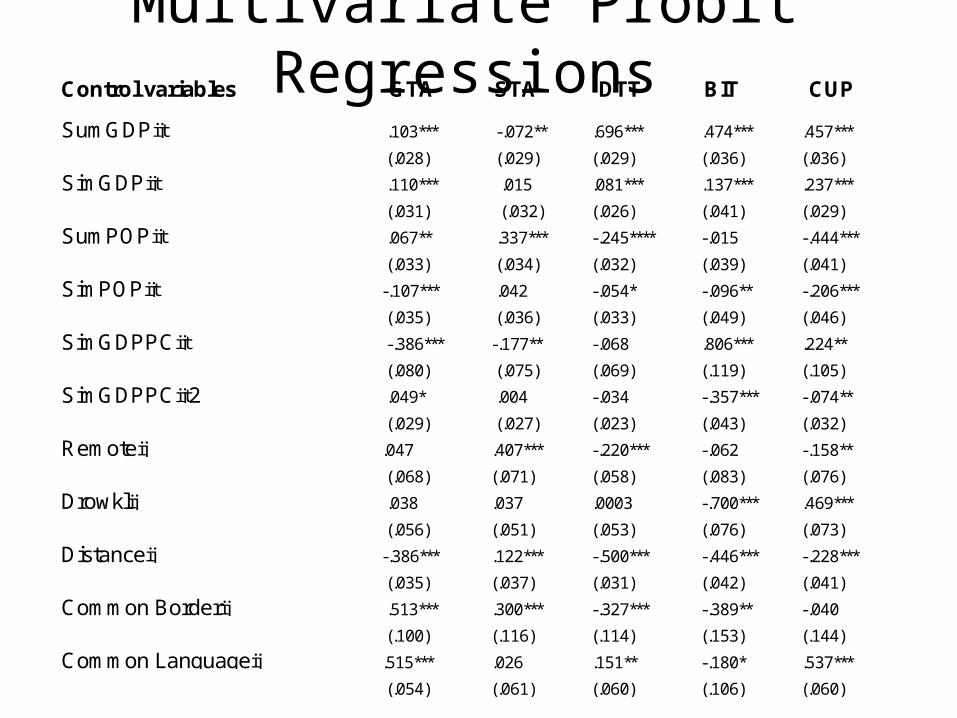
Multivariate Probit RegressionsControl variables GTA STA DTT BIT CUP
SumGDPijt .103*** -.072** .696*** .474*** .457***
(.028) (.029) (.029) (.036) (.036)
SimGDPijt .110*** .015 .081*** .137*** .237***
(.031) (.032) (.026) (.041) (.029)
SumPOPijt .067** .337*** -.245**** -.015 -.444***
(.033) (.034) (.032) (.039) (.041)
SimPOPijt -.107*** .042 -.054* -.096** -.206***
(.035) (.036) (.033) (.049) (.046)
SimGDPPCijt -.386*** -.177** -.068 .806*** .224**
(.080) (.075) (.069) (.119) (.105)
SimGDPPCijt2 .049* .004 -.034 -.357*** -.074**
(.029) (.027) (.023) (.043) (.032)
Remoteij .047 .407*** -.220*** -.062 -.158**
(.068) (.071) (.058) (.083) (.076)
Drowklij .038 .037 .0003 -.700*** .469***
(.056) (.051) (.053) (.076) (.073)
Distanceij -.386*** .122*** -.500*** -.446*** -.228***
(.035) (.037) (.031) (.042) (.041)
Common Borderij .513*** .300*** -.327*** -.389** -.040
(.100) (.116) (.114) (.153) (.144)
Common Languageij .515*** .026 .151** -.180* .537***
(.054) (.061) (.060) (.106) (.060)
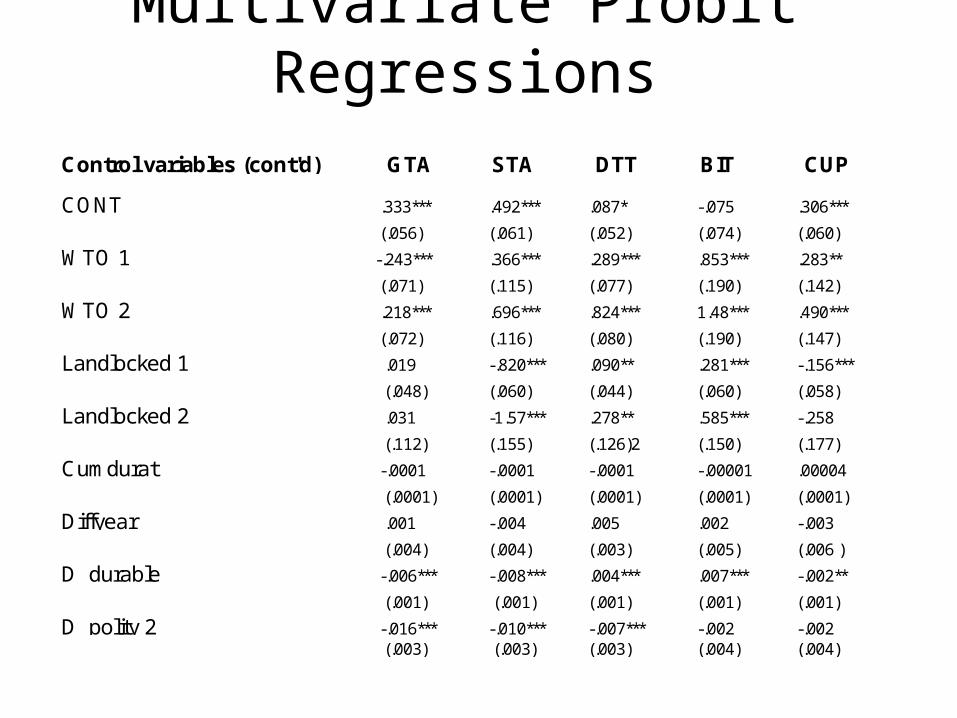
Multivariate Probit Regressions
Control variables (cont'd) GTA STA DTT BIT CUP
CONT .333*** .492*** .087* -.075 .306***
(.056) (.061) (.052) (.074) (.060)
WTO 1 -.243*** .366*** .289*** .853*** .283**
(.071) (.115) (.077) (.190) (.142)
WTO 2 .218*** .696*** .824*** 1.48*** .490***
(.072) (.116) (.080) (.190) (.147)
Landlocked 1 .019 -.820*** .090** .281*** -.156***
(.048) (.060) (.044) (.060) (.058)
Landlocked 2 .031 -1.57*** .278** .585*** -.258
(.112) (.155) (.126)2 (.150) (.177)
Cumdurat -.0001 -.0001 -.0001 -.00001 .00004
(.0001) (.0001) (.0001) (.0001) (.0001)
Diffyear .001 -.004 .005 .002 -.003
(.004) (.004) (.003) (.005) (.006 )
D_durable -.006*** -.008*** .004*** .007*** -.002**
(.001) (.001) (.001) (.001) (.001)
D_polity 2 -.016*** -.010*** -.007*** -.002 -.002 (.003) (.003) (.003) (.004) (.004)
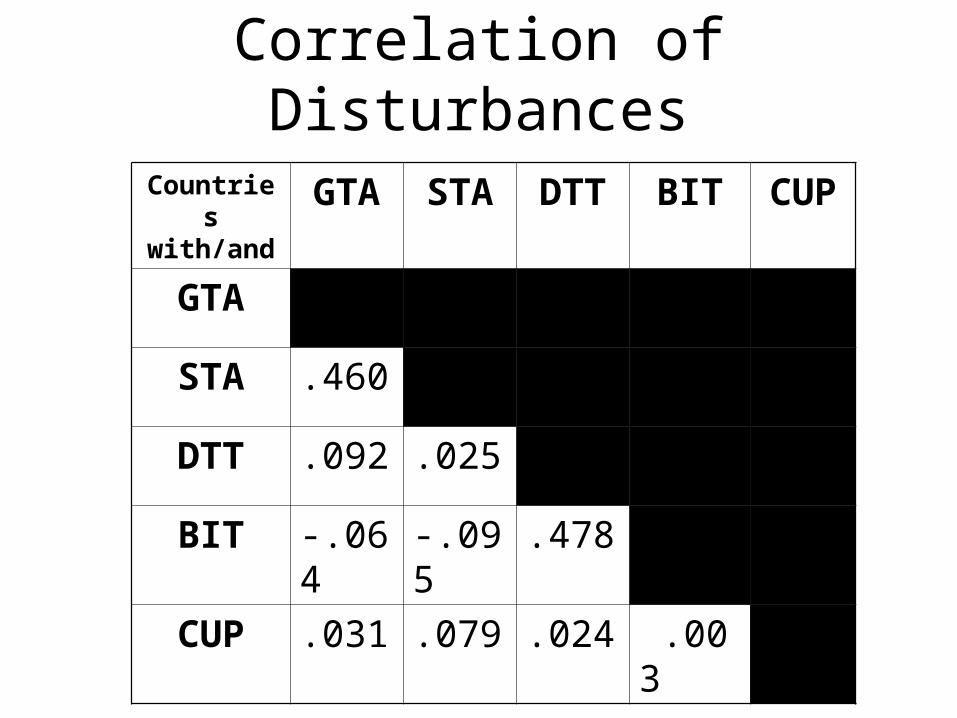
Correlation of Disturbances
Countries with/and
GTA STA DTT BIT CUP
GTA
STA .460
DTT .092 .025
BIT -.064 -.095 .478
CUP .031 .079 .024 .003
Outline of work for the summerEstimation of treatment effects on outcome
by propensity score matching:
For goods trade, services trade, FDI stocks each:
• Propensity of positive outcome (ext. margin)
• Log level (int. margin)
Using propensity score matching for multiple treatments (and estimated propensities from multivariate probit)

Estimating ATTs
32 EIA combinations (treatments) possible
More than an economist can digest and more than the econometrician can estimate:
Of the 32 ATTs, 10 are based on more than 1,000 units both in the treatment and control group
Next table focuses on the ATTs of the most frequent combinations of “pills taken”
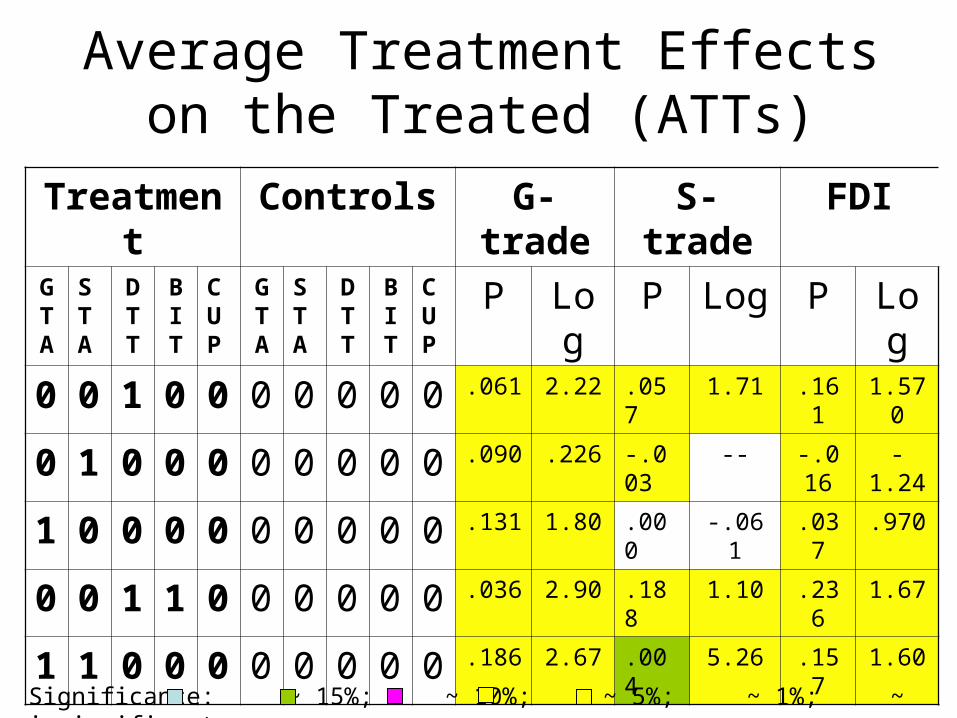
Average Treatment Effects on the Treated (ATTs)
Treatment Controls G-trade S-trade FDI
GTA
STA
DT T
B I T
CUP
GTA
STA
DT T
B I T
CUP
P Log P Log P Log
0 0 1 0 0 0 0 0 0 0 .061 2.22 .057 1.71 .161 1.570
0 1 0 0 0 0 0 0 0 0 .090 .226 -.003 -- -.016 -1.24
1 0 0 0 0 0 0 0 0 0 .131 1.80 .000 -.061 .037 .970
0 0 1 1 0 0 0 0 0 0 .036 2.90 .188 1.10 .236 1.67
1 1 0 0 0 0 0 0 0 0 .186 2.67 .004 5.26 .157 1.60
Significance: ~ 15%; ~ 10%; ~ 5%; ~ 1%; ~ insignificant.

Foregone Trade and FDISuppose every pair would use all modes
corresponds to Average Treatment Effect (ATE) of “11110” relative to “00000”
World effects (for average/randomly drawn pair) of
Margin G-trade S-trade FDI
Extensive .120 .474 .269
Intensive 4.44 1.46 2.53

Conclusions
• Estimated effects pertain to long run
• Short run (conditional on initial state) is also accessible
• In general: standard errors larger for intensive margin than for extensive margin (less observations).
• Int.marg. effects relatively large but– Estimates pertain mainly to DC-with-LDC.– Have large standard errors.
Conclusions
• Clearly: more is better forboth ext. and int. margin of outcome
• Ext.-margin of S-trade and FDI depend more on BIT and DTT than on GTA and STA
• Policy makers who want to stimulate a mix of G-trade, S-trade, and FDI will have to pursue a mix of GTA-STA and BIT-DTT


