InterEnerStatInterEnerStat MeetingMeetingHarmonisationHarmonisation of Definitions of Energy Products and Flowsof Definitions of Energy Products and Flowsgygy
IEA, Paris, 28IEA, Paris, 28--30 October 200830 October 2008
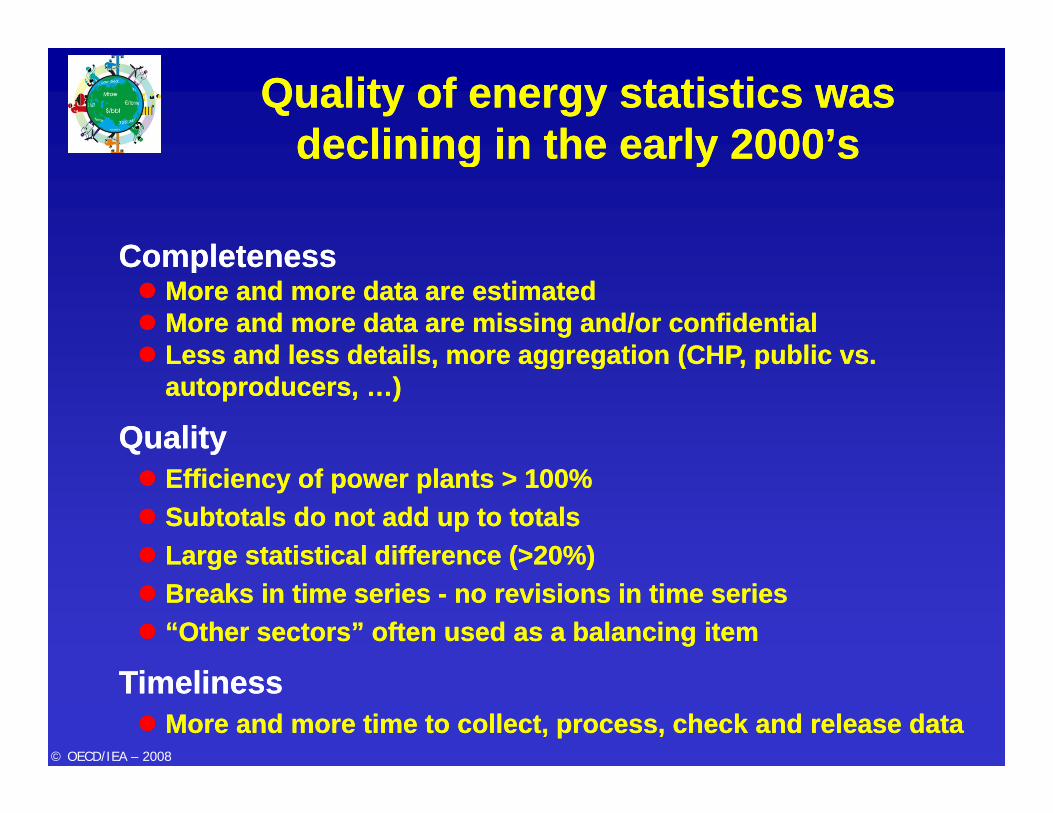
Quality of energy statistics was Quality of energy statistics was declining in the early 2000’sdeclining in the early 2000’sdeclining in the early 2000 sdeclining in the early 2000 s
CompletenessCompletenessCompletenessCompletenessMore and more data are estimatedMore and more data are estimatedMore and more data are missing and/or confidentialMore and more data are missing and/or confidentialLess and less details more aggregation (CHP public vsLess and less details more aggregation (CHP public vsLess and less details, more aggregation (CHP, public vs. Less and less details, more aggregation (CHP, public vs. autoproducersautoproducers, …), …)
QualityQualityEfficiency of power plants > 100%Efficiency of power plants > 100%Subtotals do not add up to totalsSubtotals do not add up to totalsLarge statistical difference (>20%)Large statistical difference (>20%)Large statistical difference (>20%)Large statistical difference (>20%)Breaks in time series Breaks in time series -- no revisions in time seriesno revisions in time series“Other sectors” often used as a balancing item“Other sectors” often used as a balancing item
TimelinessTimelinessMore and more time to collect, process, check and release dataMore and more time to collect, process, check and release data
Completeness: More and More EstimatesCompleteness: More and More EstimatesQuality: Frequent Breaks in Time SeriesQuality: Frequent Breaks in Time SeriesCompleteness: More and More EstimatesCompleteness: More and More EstimatesSupply and Consumption for Heat (TJ) - Tables 3 and 4
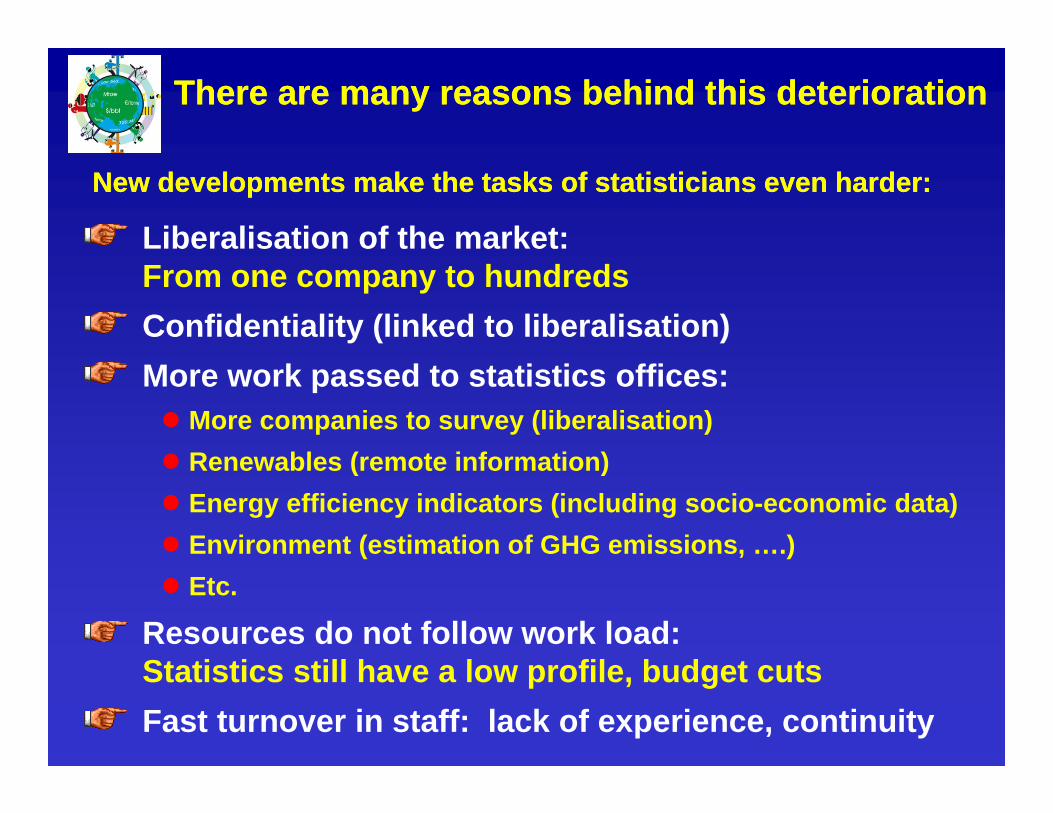
There are many reasons behind this deteriorationThere are many reasons behind this deterioration
Liberalisation of the market:
New developments make the tasks of statisticians even harder:New developments make the tasks of statisticians even harder:
From one company to hundredsConfidentiality (linked to liberalisation)More work passed to statistics offices:
More companies to survey (liberalisation)Renewables (remote information)Renewables (remote information)Energy efficiency indicators (including socio-economic data)Environment (estimation of GHG emissions, ….)Etc.
Resources do not follow work load:St ti ti till h l fil b d t tStatistics still have a low profile, budget cutsFast turnover in staff: lack of experience, continuity
A Need to Act and ReactA Need to Act and React
At the policy maker Level
Th th h id thThey are the ones who provide the resources
At the end of the day, they are the ones who will be ff i f th l k f d lit d tsuffering from the lack of good quality data
At the technical level
Statisticians often lack resources
A need to compensate fast turnover p
The JODI initiative is certainly the best example of what working together could do in improving
g g p gtransparency and data quality and in raising profile of statistics and statisticians
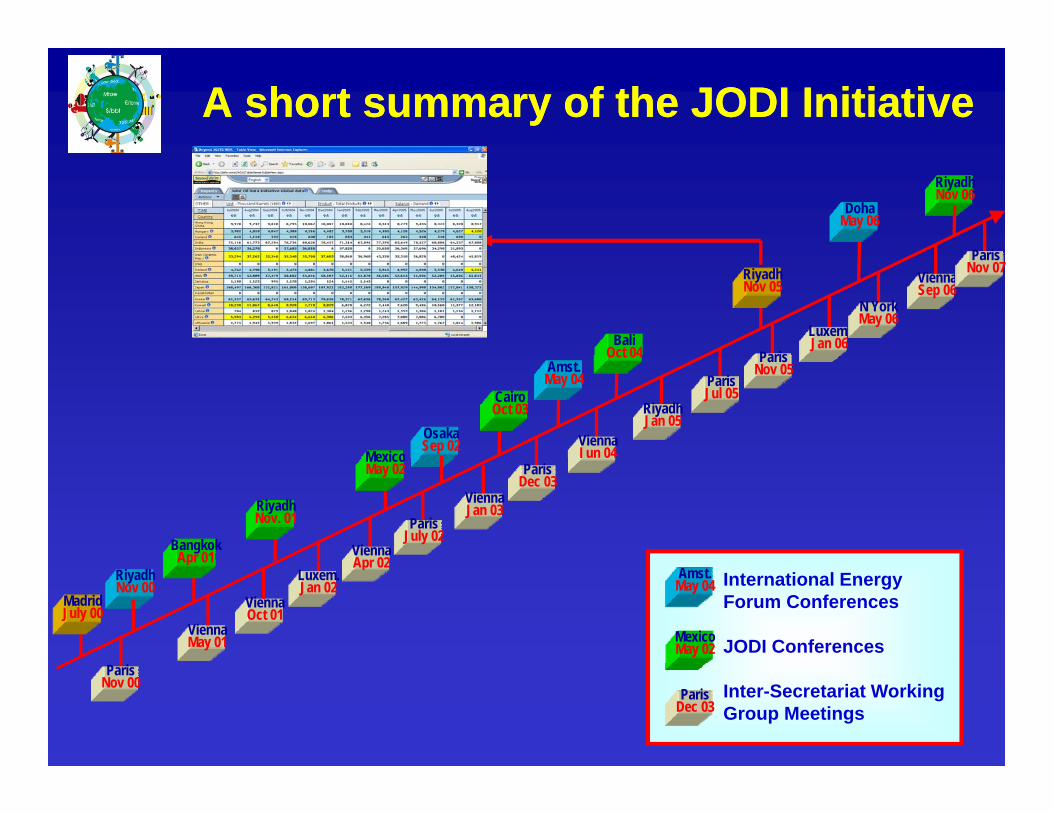
A short summary of the A short summary of the JODI InitiativeJODI InitiativeRiyadhNov 06
DohaMay 06
Paris
Paris
Luxem.Jan 06
ViennaSep 06
N YorkMay 06
RiyadhNov 05
BaliOct 04
ParisNov 07
Amst.May 04
MexicoOsakaSep 02 Vienna
Jun 04
ParisNov 05
RiyadhJan 05
ParisJul 05Cairo
Oct 03
Oct 04
RiyadhNov. 01
MexicoMay 02
ViennaApr 02
BangkokApr 01
ViennaJan 03
ParisJuly 02
ParisDec 03
International Energy Forum Conferences
JODI ConferencesViennaMay 01
ViennaOct 01
Luxem.Jan 02
Apr 02
MadridJuly 00
Apr 01RiyadhNov 00
Amst.May 04
MexicoMay 02
Inter-Secretariat Working Group Meetings
ParisNov 00
ParisDec 03
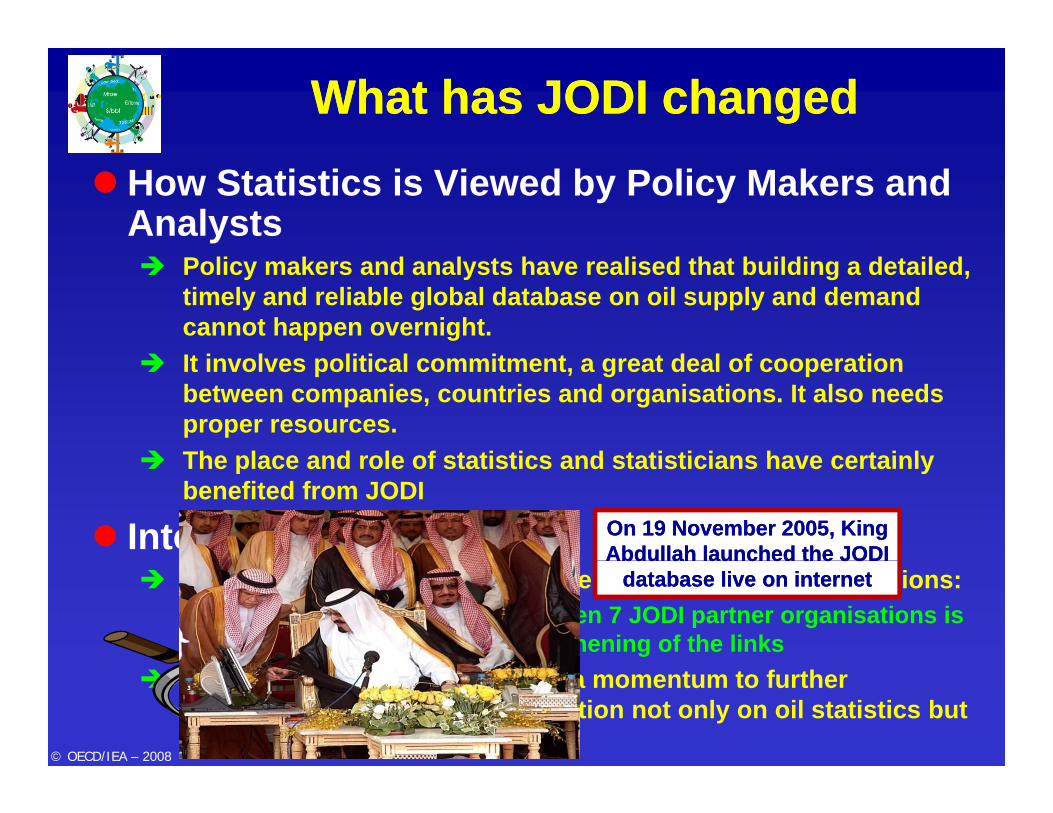
What has JODI changedWhat has JODI changedHow Statistics is Viewed by Policy Makers and Analysts
Policy makers and analysts have realised that building a detailed, timely and reliable global database on oil supply and demand cannot happen overnight.It i l liti l it t t d l f tiIt involves political commitment, a great deal of cooperation between companies, countries and organisations. It also needs proper resources.The place and role of statistics and statisticians have certainlyThe place and role of statistics and statisticians have certainly benefited from JODI
International Cooperation On 19 November 2005, King On 19 November 2005, King Abdullah launched the JODIAbdullah launched the JODI
JODI has contributed to strengthen links between organisations:The strong cooperation between 7 JODI partner organisations is a great example of the strengthening of the links
Abdullah launched the JODI Abdullah launched the JODI database live on internetdatabase live on internet
An Inter Secretariat Working Group (An Inter Secretariat Working Group (InterEnerStatInterEnerStat))
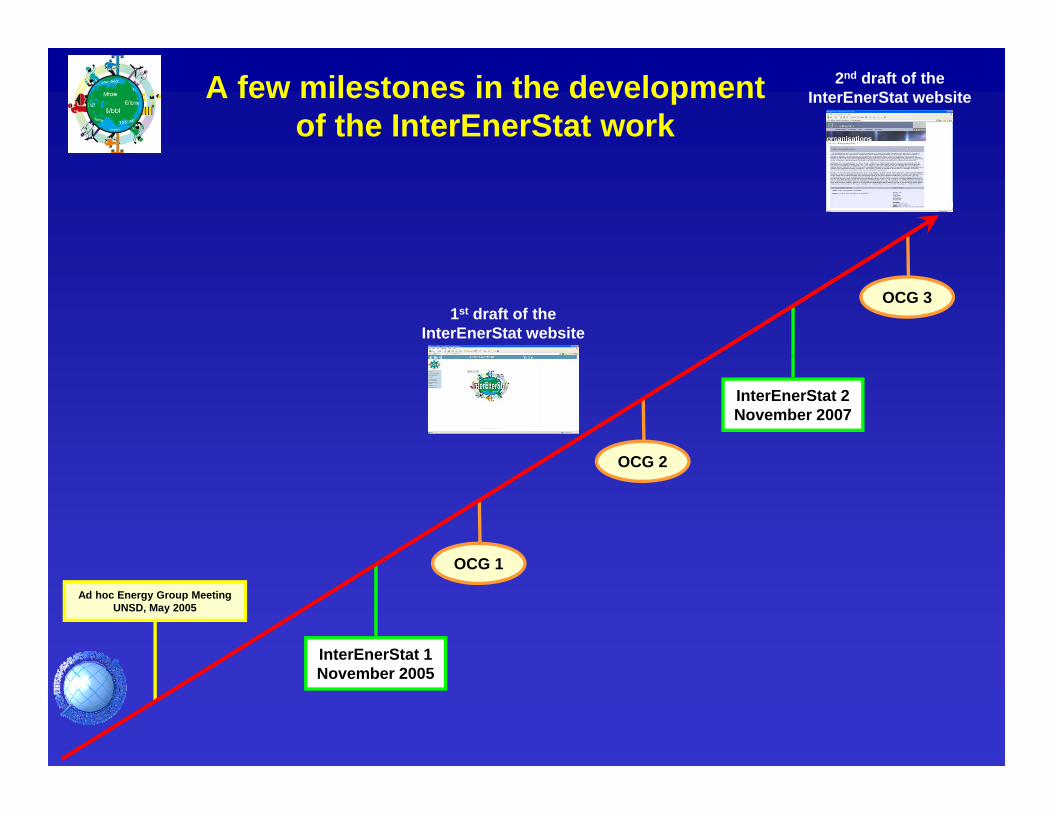
A few milestones in the developmentof the InterEnerStat work
2nd draft of the InterEnerStat website
OCG 31st draft of the
InterEnerStat website
InterEnerStat 2November 2007
OCG 2
OCG 1
OCG 2
InterEnerStat 1
OCG 1
Ad hoc Energy Group MeetingUNSD, May 2005
November 2005
The 1st InterEnerStat Workshop
Date: 22-23 November 2005Date: 22 23 November 2005
Place: International Energy Agency, Paris
Participants: 24 major regional and internationalParticipants: 24 major regional and international organisations. Both data providers (IEA, UNSD, OPEC, Eurostat, APEC, FAO) and users (IMF, UNFCCC,…)
Objectives:To hear from each organisation what they do, what are To hear from each organisation what they do, what are their problems and their expectation for more their problems and their expectation for more coco--operationoperation
To pave the way for more harmonisation and forTo pave the way for more harmonisation and forTo pave the way for more harmonisation and for To pave the way for more harmonisation and for strengthening bilateral and international costrengthening bilateral and international co--operationoperation
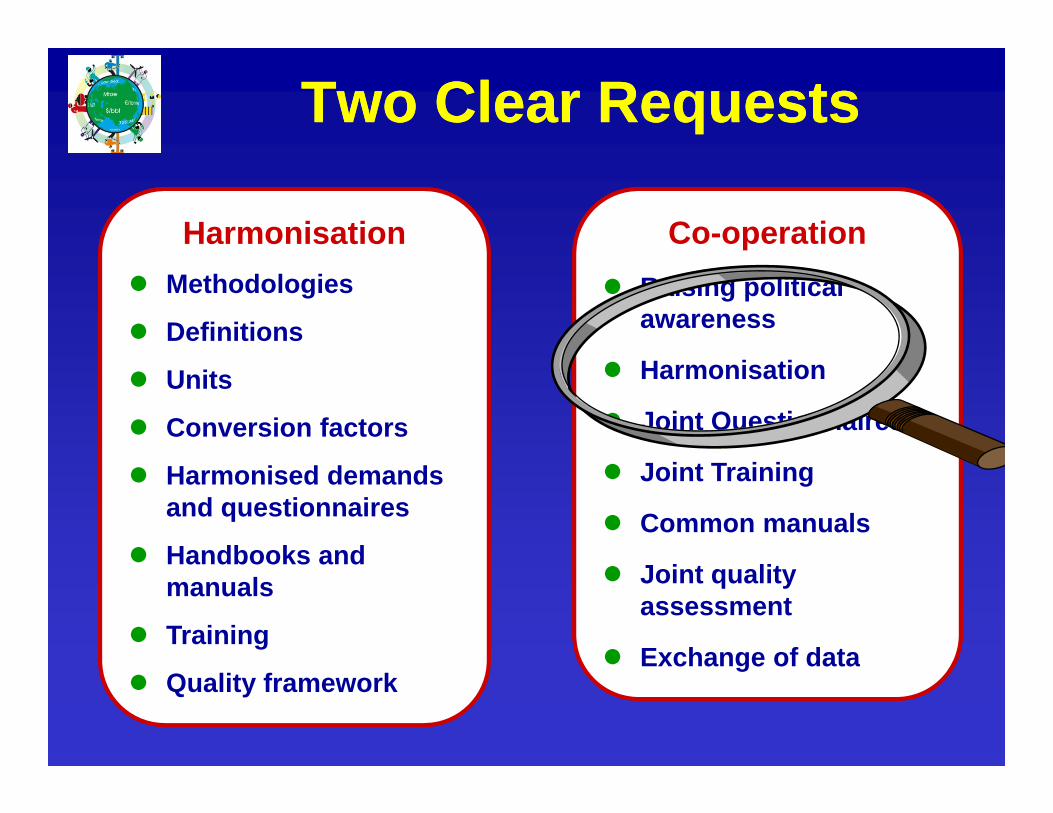
Two Clear RequestsTwo Clear Requests
Harmonisation Co-operationMethodologies
DefinitionsRaising political awareness
Units
Conversion factors
Harmonisation
Joint Questionnaires
Harmonised demands and questionnaires
Handbooks and
Joint Training
Common manualsHandbooks and manuals
Training
Joint quality assessment
Exchange of dataQuality framework
Exchange of data
Priority was to collecting basic information on each organisation in terms of statistics collecting and use
Short presentation of each organisation
Definition of flows used by organisationsLinks to databases by organisations
Key reference documents and manuals
Definition of products used by organisations
Main units used in energy statistics
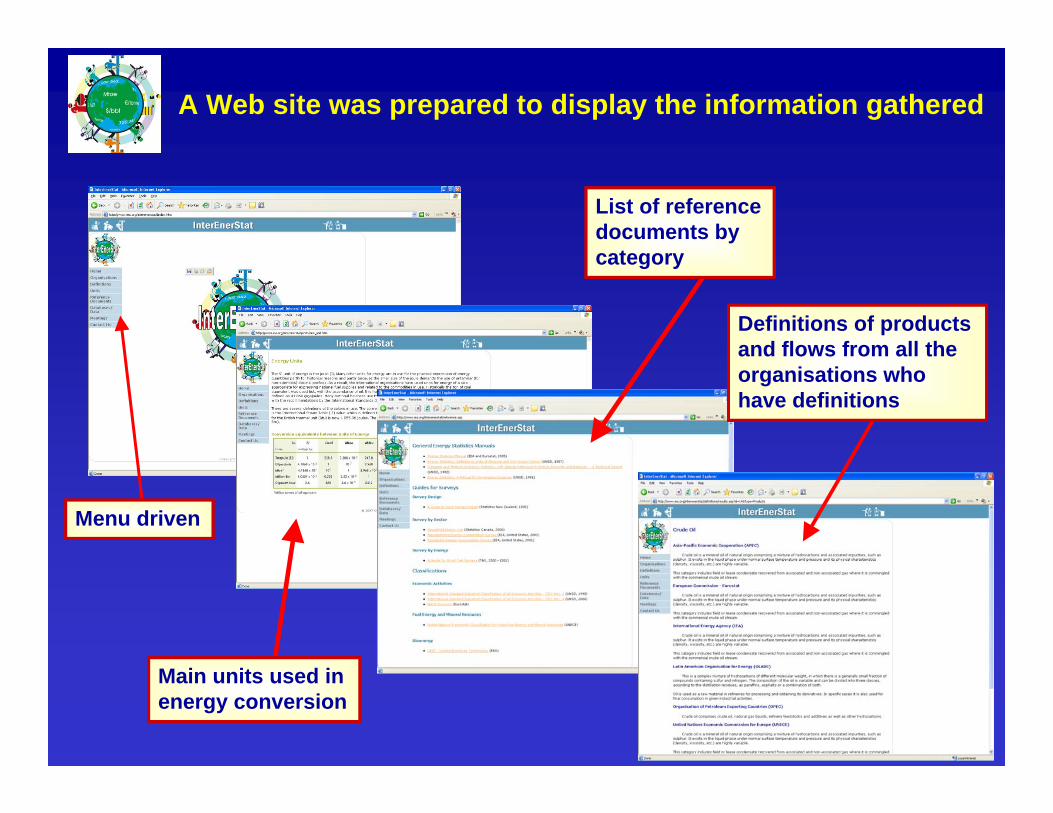
A Web site was prepared to display the information gathered
List of reference documents by
tcategory
Definitions of products and flows from all theand flows from all the organisations who have definitions
Menu driven
Main units used in energy conversion
The 2The 2ndnd InterEnerStatInterEnerStat WorkshopWorkshop1919--20 November 2007, IEA, Paris20 November 2007, IEA, Paris, ,, ,
Comment on the websiteActivities to improve energy statisticsStrategy towards harmonisation
A new A new InterEnerStatInterEnerStat website was then designed to website was then designed to take into account the comments receivedtake into account the comments received
The The WebsiteWebsite
The 2nd InterEnerStatworkshop highlighted that a lot of work took/takes place intook/takes place in each organisation and between organisations Harmonisation
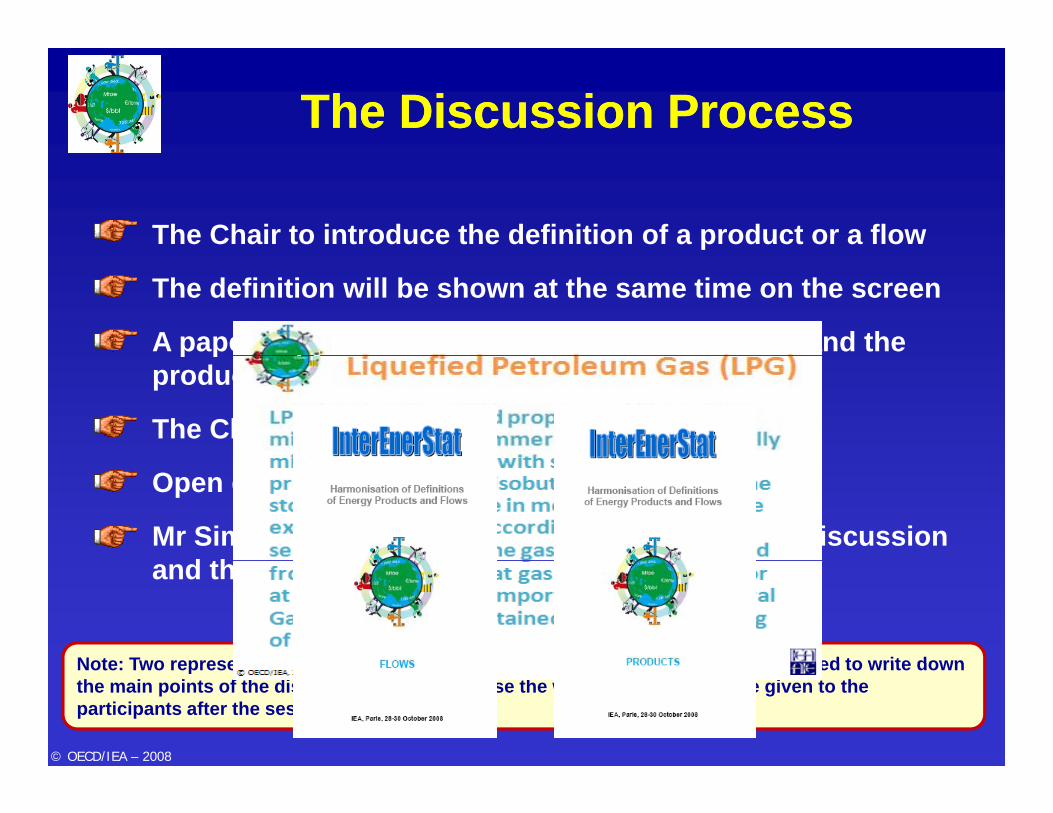
Note: Two representatives of the Energy Statistics Division of the IEA have been asked to write down the main points of the discussion in order to ease the writing of a report to be given to the participants after the sessions or the meeting.
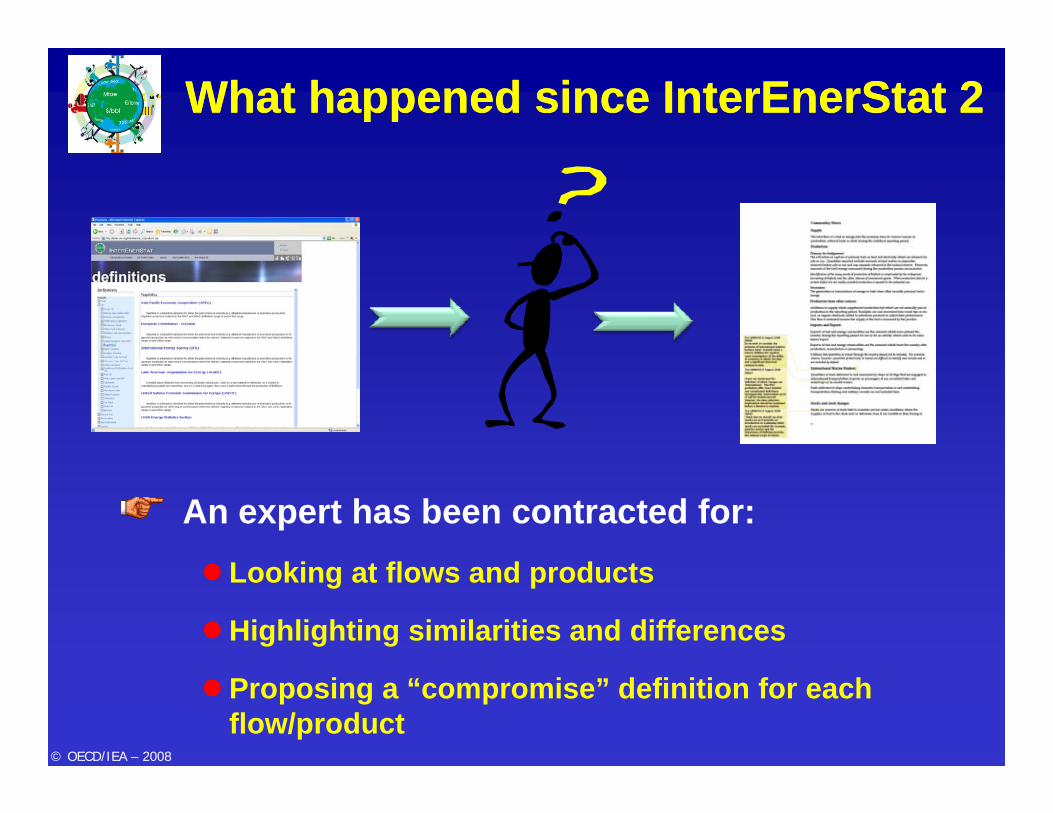
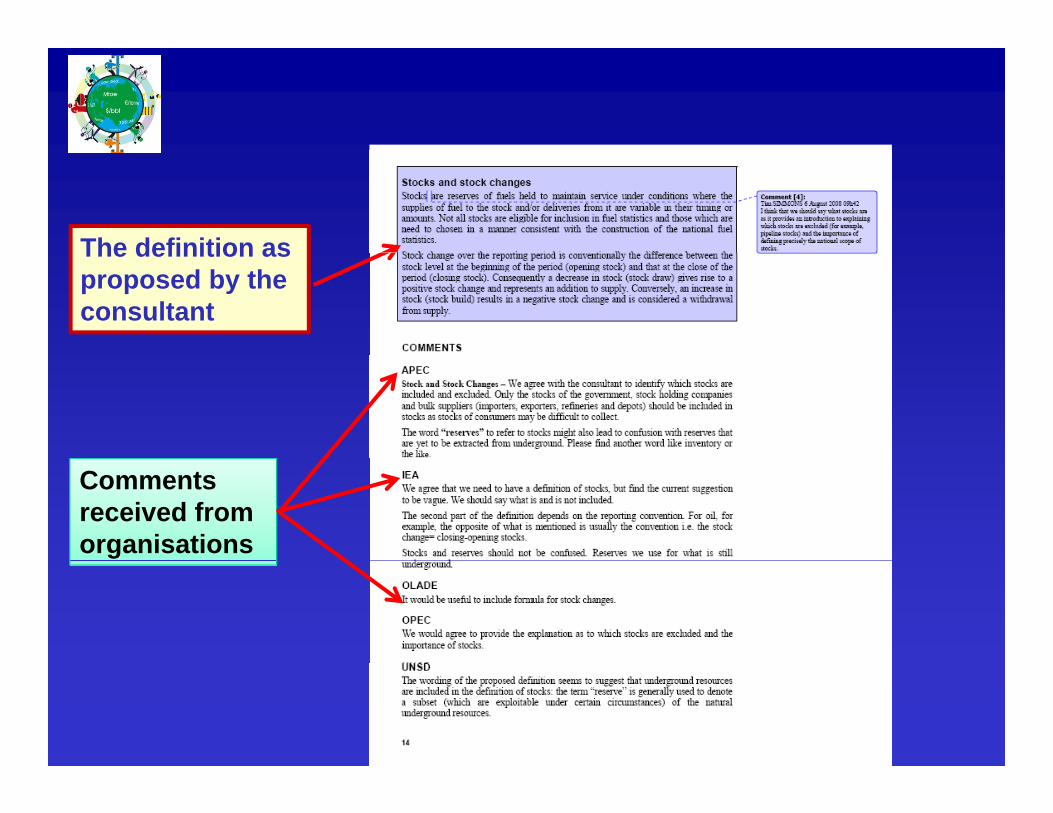
The definition asThe definition as proposed by the consultant
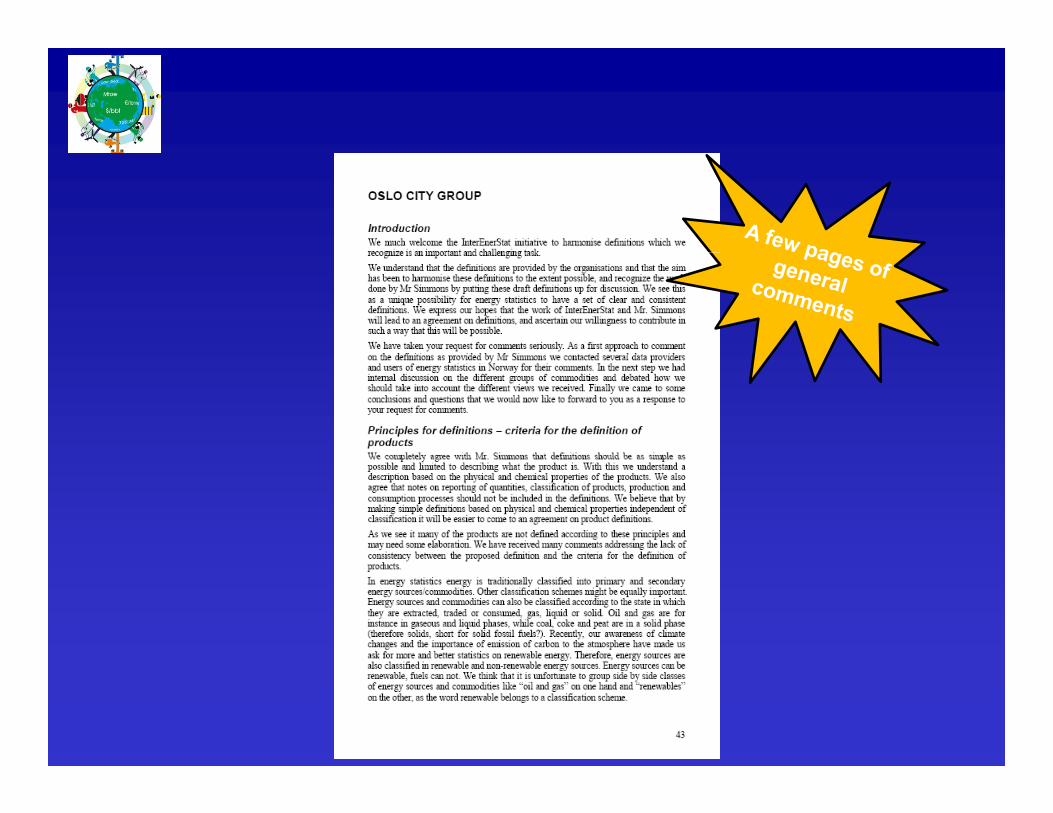
Comments received from organisations
A few words A few words on what could be nexton what could be nextThe IEA to prepare and disseminate a report with the main points to take into account in redrafting the definitions
The organisations to have a few days to look at the document to correct what needs to be corrected and to comment
The Consultant to take into account all the comments received inThe Consultant to take into account all the comments received in the workshop, possibly amended by later corrections and comments in order to propose a second draft of the definitions
Th IEA i l h d f d fi i i f fi iThe IEA to re-circulate the second set of definitions for fine-tuning comments
It is well understood that these definitions will only be guidelines y gto help organisations to arrive to a common understanding of what is a covered by a particular flow or a particular product.
It is also well understood that no organisation needs to change its
It is also well understood that no organisation needs to change its current definitions to adopt the common definitions which could result from this work
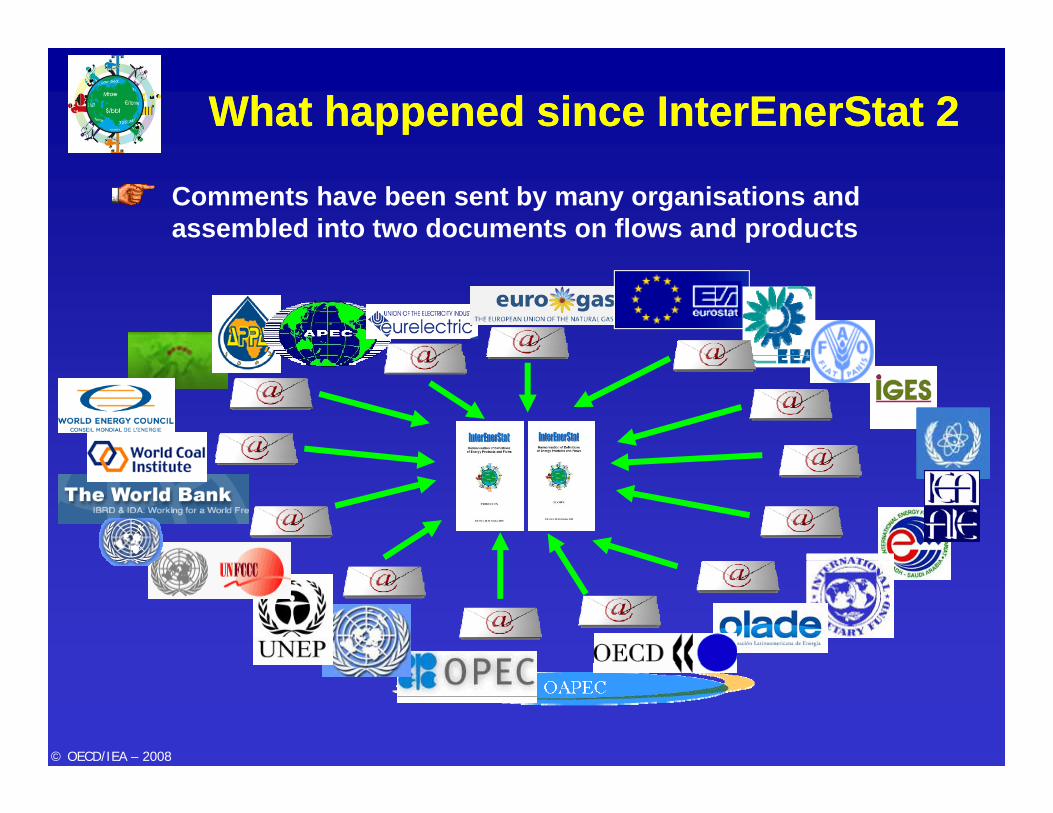
Two documents (flows and products) sent to organisationsTwo documents (flows and products) sent to organisations
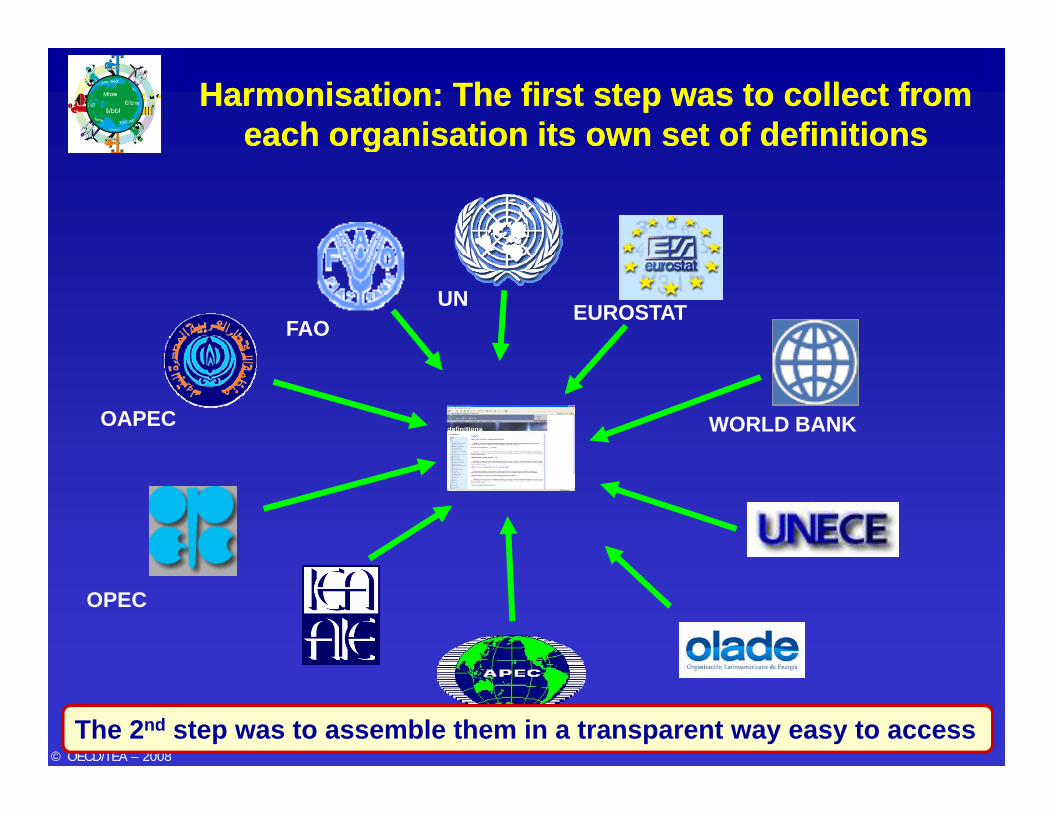
HarmonisationHarmonisation: The first step was to collect from : The first step was to collect from each each organisationorganisation its own set of definitionsits own set of definitionsgg