Bank Cantrade NV, PO Box 231, 1000 AE Amsterdam, The Netherlands Summary Cees J. Prins Our thinking about interest rates is often hardly structured. What determines our of the future is often dictated by the news of the day. Because of this a more structured approach by means of simple models estimated by statistical techniques using adequate timeseries should give more reliable forecasts. This paper presents some money and capital market interest rates models for the United States, Germany and the Netherlands. These models can be used for scenario's and forecasts. Interest Rate Models for some Financial Markets Scenarios and Forecasting Résumé Modèles de Taux pour Quelques Marchés Financiers; Scénarios et Prévisions 267 Notre réflexion sur les taux d'intérêts est souvent mal structurée. Ce qui détermine notre vision du futur eat souvent dicté par les nouvelles du jour. C'est pourquoi, une approche plus structurée au moyen de modèles simples estimés par des techniques statistiques utilisant des séries chronologiques adéquates devrait donner des prévisions plus fiables. Cet article présente des modèles de taux du marché monétaire et du marché des capitaux pour les Etats- Unis, l'Allemagne et les Pays- Bas. Ces modèles peuvent être utilisés pour des scénarios et des prévisions.
Transcript
Bank Cantrade NV, PO Box 231, 1000 AE Amsterdam, The Netherlands
Summary
Cees J. Prins
Our thinking about interest rates is often hardly structured. What determines our view of the future is often dictated by the news of the day. Because of this a more structured approachby means of simple models estimated by statistical techniques using adequate timeseries should give more reliable forecasts. This paper presents some money and capital market interest rates models for the United States, Germany and the Netherlands. These models canbe used for scenario's and forecasts.
Interest Rate Models for some Financial Markets Scenarios and Forecasting
Résumé
Modèles de Taux pour Quelques Marchés Financiers; Scénarios et Prévisions
267
Notre réflexion sur les taux d'intérêts est souvent mal structurée. Ce qui détermine notre vision du futur eat souvent dicté par les nouvelles du jour. C'est pourquoi, une approche plus structurée au moyen de modèles simples estimés par des techniques statistiques utilisant des séries chronologiques adéquates devrait donner des prévisions plus fiables. Cet article présente des modèles de taux du marché monétaire et du marché des capitaux pour les Etats-Unis, l'Allemagne et les Pays- Bas. Ces modèles peuvent être utilisés pour des scénarios et des prévisions.
Richard Kwan
2nd AFIR Colloquium 1991, 1: 267-287
Aim of the Interest Rate Model
International money and capital markets are subject to many influen-
ces. Psychological factors often play an important part, so that these
markets tend very much to overreact. It is not uncommon for the market
to be 'directionless' - awaiting a new impetus. For instance, the
market typically waits for the weekly publication of macro-economic
figures. And quite frequently, a factor which is of no importance one
week appears to be crucial the next. And this is how it is that time
after time we can read in reliable financial newspapers that 'Inves-
tors were dominated by fears of inflation' one day, and the next day
that 'Investors are becoming convinced that inflation will be less
serious than expected'.
It would therefore appear useful to introduce a structured approach to
our thinking about interest rates. Precisely what factors produced
what effect in the relevant past? That is the question which has to be
answered, and in doing so it is important that we consistently use the
same checkist of important factors so as not to vary them from time to
time. Such an approach ought to enable us to introduce a little
structure into our thinking, and it may even become possible to give
an answer to 'what if' questions. The ultimate aim must be to design a
mechanism which will allow us to say something about the future.
268
The first version of the model presented here was developed almost ten
years ago. Over the years, the model has been refined and re-estima-
ted, and was initially also published in several different forms. 1)
Each year, the model is used for a seminar for institutional investors
in the Netherlands at which a four-quarter forecast is presented. An
important limitation as regards the perfection of the theoretical
framework of the model on the one hand and, on the other hand, the
data used (quarterly figures instead of monthly ones) and the
estimation techniques used (least squares method) is the fact that all
the determinants used must be variables for which a forecast can be
made and that the model must remain simple. This means that, to apply
the model, it is only necessary to make use of existing external
sources, if so desired. An implication of all this, however, is that
all kinds of refinements which might be theoretically desirable cannot
be applied.
1) C.J. Prins, Enkele determinaten van de rente-ontwikkeling in Nederland (A number of determinants of interest rate movements in the Netherlands - in Dutch), Economisch Statistische Berichten, August 1983. Id., De rente in 1986 (Interest rates in 1986 - in Dutch), Econo- mische Statistische Berichten, February, '86. Id., De rente in 1987 (Interest rates in 1987 - in Dutch), Econo- mische Statistische Berichten, February, '87.
269
Theoretical Background
Looking into the future, in other words, does not necessarily have to
rely on reading tea leaves or examining the residues of other more or
less appetising products. Recourse to a simple checklist of important
factors can tell us a great deal about future developments. And there
is no reason why it should not be possible to make predictions about
interest rates in the same way.
Let us consider what such a simple checklist of influential factors
looks like in the case of the capital market interest rate. We shall
not concern ourselves at this stage with the possibility of
international interdependences, so as to keep things perfectly simple
and transparent. In broad terms, our conceptual model might look
something like this:
The influence of inflation on interest rates is well known and quite
plausible. The interest rate is the price of the means of exchange -
270
money - and if the general level of prices rises, then the price of
the means of exchange will also rise at the same rate. However, it is
probable that people look beyond inflation in the current year. In
other words, it will be necessary to make an estimation of future
inflation.
One of the first to draw attention to this problem was Irving Fisher,
who explaned the nominal interest rate (r) in terms of the expected
inflation rate (E(Pc)) and the real interest rate (taken to be con-
stant): (i).
r = i + E(Pc)
This simple expression also forms the basis of the models developed
here for an number of countries.
A practical problem arises in assessing the expected inflation. It
will be necessary however to estimate the inflation for the mutarity
of the loan. The expected inflation is strongly related to a certain
period. It is not easy to get information about the expected
inflation. Information can be obtained from the past and from surveys
among experts.
Two elements are of extreme importance. First the inflation of the
past. We can use for this the inflation trend during a certain well
defined period. It is however uncertain whether this trend will also
be the future trend or not. One can be more certain about the future
developments of inflation when the volatility is lower. For this
reason the expected inflation uses both elements and can hence be
quantified as follows:
271
The expected inflation in period "t" equals the trendvalue of
Inflation over a period of 10 quarters plus the volatility of this
inflation measured by the standard deviation over the same period of
10 quarters.
The inflation expectation E(Pc) has a special attribute. In general
the actual inflation is closely followed but only an increase of
inflation is clearly visible in both trend and standard deviation. A
decline in inflation however comes out in a decline in the trend
value, but also in an increase of the standard deviation. This
reaction to a decrease in inflation depicts clearly the wait and see
attitude in the real world. Figure 1. shows this very clearly for the
rise in inflation in the United States between 1978 and 1980 and
afterwards for the sharp decrease in inflation. The former is closely
followed by the inflation expectation the latter with a time lag.
Figure 1: Inflation as a percentage per annum and inflation expecta-
tion in the USA, 1972-1990.
272
Figure 2 shows that the inflation expectation formulated in this way
can provide a good explanation for the movements in the capital market
interest rate. That this is particularly apparent in Germany is not
strange in view of the traumatic experiences of inflation in Germany
in the 1930s.
Figure 2: Capital market interest rates and inflation expectation in
Germany 1972 - 1990.
The influence of monetary actions and the influence of the money
market interest rate are somewhat vague and rather confused. Let us
take the money market interest rate to begin with. If the short
interest rate is higher than the long interest rate, then obviously
many people are going to prefer to invest funds for shorter terms
rather than longer terms. If we can get an attractive interest rate
for a period of a few months and expect higher interest rates in the
longer term, the effect will be similar. And for lower interest rates
273
at the short end of the market and a substantial differential between
long and short interest rates, the opposite will apply.
Now, the chief monetary authority in the Netherlands, De Nederlandsche
Bank, is mainly able to control short term interest rates. By means of
its ‘small monetary policy’, de Nederlandsche Bank attempts to control
the value of the guilder via the money market and/or the foreign
exchange market (which we have yet to consider).
Affecting the capital market directly is the ‘large monetary policy’,
through which the Central Bank controls the growth in lending. How-
ever, this mechanism was only used to exert influence on the capital
market in the years 1977 - 1981. The incidental influences arising out
of the use of the interest rate weapon to moderate exchange rate
fluctuations must be seen as a special influence among the various
incidental influences. In countries like the USA and Germany, the
monetary authorities have a variety of ways of influencing interest
rates (both long and short term). The influence of the short term
interest rate on the capital market interest rate is shown in figure 3
for both the Netherlands (left) and Germany (right).
Figure 3: Influence of the money market interest rates on the capital
markets in the Netherlands and Germany, 1980 - 1990.
274
International Connections
In practice, the hypothesis that it should be possible to make
projections on the basis of foreign influences cannot be
substantiated. Furthermore, with the growing integration of
international capital markets, interest rates in the world are
becoming increasingly closely interrelated. It is possible to apply
statistical tests to determine the extent to which this is so. For a
dozen countries (USA, Germany, The Netherlands, Japan, UK, Australia,
Sweden, Italy Canada, France Switzerland and Belgium), an analysis was
made of the interrelationships on the basis of quarterly data over an
extended period commencing 1970 and using Principal Components
Analysis. The question was whether a common pattern could be detected
in the interest rates of these countries and what degree of
correlation would be found. The answer to this question was given by
establishing, for each of the various subperiods, what percentage of
the total variance was accounted for by the Principal Component.
The table clearly shows that the international connections have grown
much stronger. For instance, the correlation between the Netherlands
and Germany on the one hand and the USA on the other was particularly
weak to begin with, and Japan also played hardly any part in
international interest rate movements. This picture changed
dramatically in the course of the 1970s. Given these changes, the
obvious answer is to use a relatively short estimation period for
these countries. For the USA, however, as a large independent money
and capital market, this is not necessary. A study of the desirability
of a simultaneous system of interest rate equations for the USA, Japan
and Germany did not, incidentally, yield the desired result.
Incidentally, apart from Switzerland, the odd man out in the
international picture is the UK. For these two countries, the
principal component is only capable of accounting for 10 - 20% of the
specific variance on average.
275
Looking at specific correlations, the most obvious is that between
Germany and the Netherlands. Less obvious is that between Japan and
the Netherlands. For the whole of the period under study, out of all
the countries involved, the Netherlands in fact shows the closest
correlation with Japanese interest rates. And there is only a marginal
change in this situation over the years. There are no fundamental
reasons as to why this should be so, however.
Table 1: The international connection between capital market interest
rates in the twelve countries.
Period Percentage of variance accounted
for by the first principal component
1970 - 1990 (II) 55,5%
1973 - 1990 (II) 52,8%
1976 - 1990 (II) 64,3%
1978 - 1990 (II) 70,4%
1980 - 1990 (II) 74,4%
The Essentials of the Model
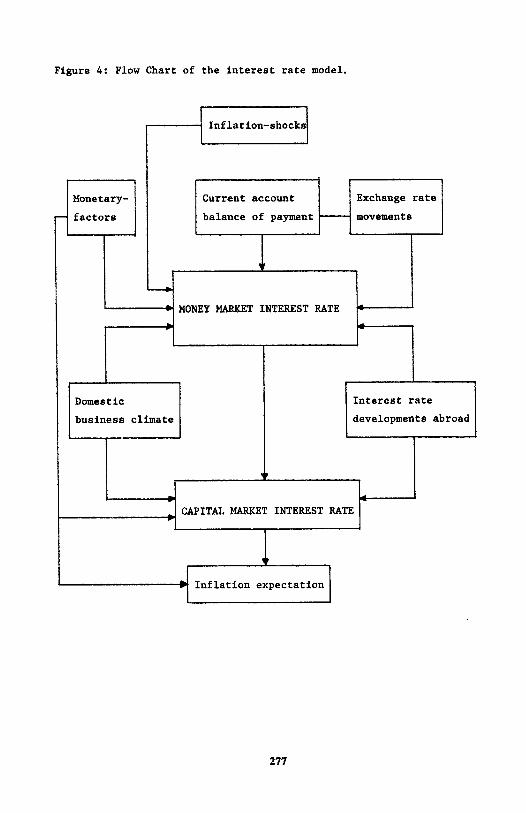
If, in addition to the national (closed) form of the model previously
discussed, we also introduce the international element, we see that
the whole thing becomes far more complicated. This is because the
basic form of the model applies in the case of each country that is
particularly exposed to developments abroad. The flow chart of the
basic model takes the following form, although it should be pointed
out that additional specific factors will need to be included for
various countries.
276
Figure 4: Flow Chart of the interest rate model.
277
In the following graphs, we examine a number of significant
relationships for the various countries in greater detail. As regards
the money market interest rate, the effect of German interest rates on
those in the Netherlands is shown in figure 5. The earlier conclusion
concerning the connection between these two interest rates is again
obvious.
Figure 5: Honey market interest rates in the Netherlands and Germany.
However, figure 6. which includes foreign interest rates, made up of
the German capital market interest rate (75%) and the US capital
market interest rate (25%), shows that this influence extends beyond
the money market. Figure 6 also shows that the influence of German
interest rates on those in the Netherlands is becoming increasingly
strong whilst the influence of American interest rates is becoming
less and less significant.
278
Figure 6: Capital market interest rates in the Netherlands and foreign
influences.
The Interest Rate Structure in the United States
The Money Market Interest Rate
It was found not to be a simple matter to construct an acceptable
model for the money market interest rate (R t S, US ) which was capable of
giving good results over a sufficiently long period. A Koyck
distributed lag was therefore introduced by using the value of the
dependant variable delayed by one period as the determinant. The state
of the economy is reflected in two variables, capacity utilisation
(CAP t ) and the quarterly growth in GNP, G GNP
, which was annualised. t Considerable importance was then also attached to the liquidity ratio
(λ t ), which was included in an asymptotic relation. The constant of
0.45 was arrived at by trial and error in steps of 0.025. A dummy for
the extremely tight money market policy in the fourth quarter of 1980
completes the picture:
279
The t-values are given in brackets. The sign is correct in all cases
and the coefficients all have adequate significance. The overall
goodness of fit is reasonable.
The Capital Market Interest Rate
The most important variable determining the capital market interest
rate in the USA (R t L,US
) is the money market interest rate with a time
lag of one period (R t-1 S, VS
). The "twin-deficits" i.e. the budget
deficit as a percentage of GNP (BUD.DEF. t ) and the surplus/deficit on
the current account of the balance of payments expressed in the same
manner (CUR.ACC. t ) play their expected parts. And again we find the
previously used variable for the state of the economy,
growth in GNP (G t GNP
). The inflation expectation (E(Pc t )
earlier along with the dummy variable for the money market
1980 completes the model:
quarterly
discussed
policy in
The goodness of fit achieved is again reasonable, and all
coefficients have the right sign and adequate significance.
280
Evaluation of the Results for the USA
Correlation of the actual interest rate movements with the ex-post
predictions reveals that the turning points in both the money market
interest rate and the capital market interest rate are not always
accurately predicted. There is a tendency for the turning points to be
predicted one quarter late.
Figure 7: Correlation of model and actual interest rates for the USA
Money Market interest rate Capital Market interest rate
The graphs do show, however, that the model does not simply produce a
systematic trace of the actual movements. The trend is generally well
predicted. In the case of the money market interest rate, the
deviation of the estimate is fairly large in relative terms,
especially in the early 70s. The estimation result does not, however,
improve with the shortening of the estimation period. When interest
rates were at their peak (in the early 80s), the deviation of the
estimate is also highest, but this is a normal phenomenon.
281
The Interest Rate Structure in Germany
The Money Market Interest Rate
To determine the money market interest rate (R t S,WG
) a structure very
similar to that for the United States was used. Again, a Koyck-type
distributed lag system was applied. For Germany, a specific business
climate index (BC t ) was constructed, made up of the standardised
values for the business climate in manufacturing industry, the capa-
city utilisation factor, the number of unfilled job vacancies and
total industrial output. The quarterly inflation figures were also
included (Pc t WG,QU ). In addition, it was assumed that the American
money market interest rate had a significant effect. The ultimately
preferred form taken by the model was as follows:
The variables again all have the correct sign and adequate signifi-
cance. The overall goodness of fit is good, although the goodness of
fit at the beginning of the estimation period in particular leaves
something to be desired. For this reason, the whole series was re-esti-
mated apart from the first five sets of figures. The result, measured
in terms of the correlation coefficient (R 2 ), then showed a substan-
tial improvement, although there was hardly any change in the value of
the coefficients. The results of this shortening of the estimation
period show this.
282
As can be seen from the above equation, there was a substantial
improvement in the significance of the variables in particular. To a
limited extent, however, the model continues, to have a tendency to run
one month behind the actual movements as regards predicting the
turning points.
The Capital Market Interest Rate
In addition to the inflation expectation (E(Pc t )), the short interest
rate (R t ) was also included as a potential explanatory variable.
In the case of the German capital market interest rate, the influence
of the quarterly movement in the dollar was also estimated (US$ t ).
Also tested was whether the capital market interest rate in the United
States plays a significant part. In the fourth quarter, German
reunification had a substantial impact on the capital markets in
Europe. The extent to which this aspect pushed up interest rates was
tested by including a dummy variable with a declining influence over
time. The steepness of this decline was determined by trial and error
in steps of 0,05. The coëfficient indicates that this initial
influence amounts to 1,4%. The model ultimately adopted had the
following form:
n = 1 for 1989 fourth quarter etc.
283
S,WG
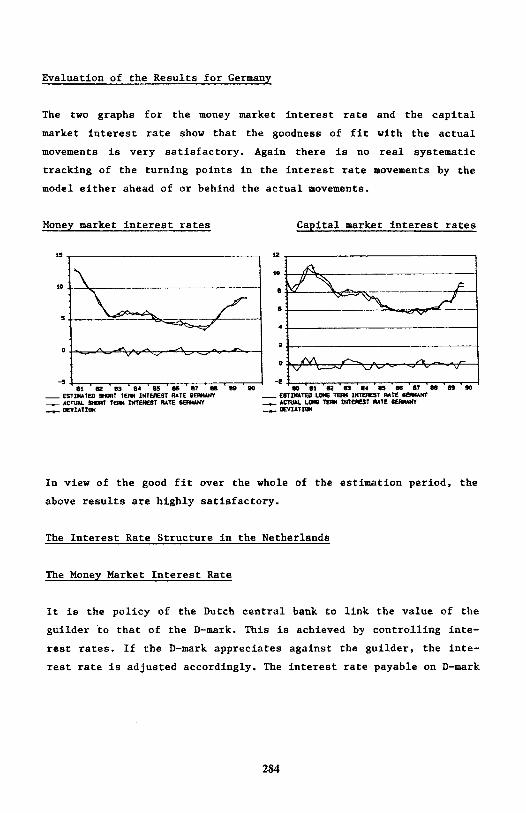
Evaluation of the Results for Germany
The two graphs for the money market interest rate and the capital
market interest rate show that the goodness of fit with the actual
movements is very satisfactory. Again there is no real systematic
tracking of the turning points in the interest rate movements by the
model either ahead of or behind the actual movements.
Money market interest rates Capital market interest rates
In view of the good fit over the whole of the estimation period, the
above results are highly satisfactory.
The Interest Rate Structure in the Netherlands
The Money Market Interest Rate
It is the policy of the Dutch central bank to link the value of the
guilder to that of the D-mark. This is achieved by controlling inte-
rest rates. If the D-mark appreciates against the guilder, the inte-
rest rate is adjusted accordingly. The interest rate payable on D-mark
284
credit balances appears to play a crucial role in this regard.
Obviously, however, the state of the Dutch economy also exerts an
independent influence. The money market interest rate in the
Netherlands (R t
S, NL ) is accordingly made up of the money market
interest rate in Germany (R t S, WG
) with a lag of six weeks and the
business climate in the Netherlands (BC t NL ). This latter variable is
in turn made up of four elements: capacity utilisation of capital
goods, retail sales at constant prices, consumer credit at constant
prices and the business climate indicator for manufacturing industry
in Germany with a timelag of one period and corrected for trends. The
complete model has the following form:
R 2 = 0, 94
D.W. = 1, 43
The Dutch interest rate is determined almost entirely by the interest
rate in Germany, the only essentially Dutch variable being the
business climate indicator. And Germany even plays an important part
in this indicator too.
The Capital Market Interest Rate
In the preceding versions of this model, the relationship between the
capital market interest rate in the United States and that in Germany
was determined by trial and error so as to create a new variable of
the foreign capital market interest rate (R t L, F
). Over the years,
there has been quite a shift in these relationships. Initially, US
interest rates dominated the picture whereas, today, their influence
is only a third of that of Germany interest rates. As is the case with
other countries, too we again find the previously defined term for the
expected inflation level (E(Pc t )). The model has the following form:
285
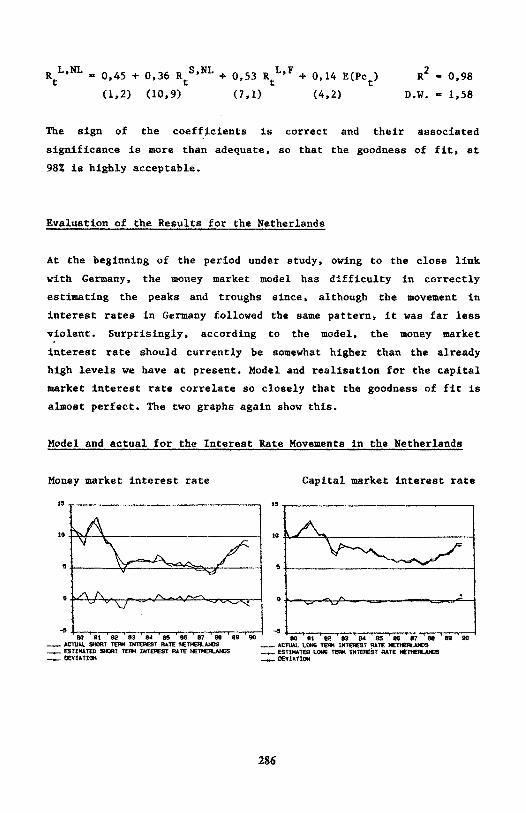
Model and actual for the Interest Rate Movements in the Netherlands
At the beginning of the period under study, owing to the close link
with Germany, the money market model has difficulty in correctly
estimating the peaks and troughs since, although the movement in
interest rates in Germany followed the same pattern, it was far less
violent. Surprisingly, according to the model, the money market
interest rate should currently be somewhat higher than the already
high levels we have at present. Model and realisation for the capital
market interest rate correlate so closely that the goodness of fit is
almost perfect. The two graphs again show this.
Evaluation of the Results for the Netherlands
The sign of the coefficients is correct and their associated
significance is more than adequate, so that the goodness of fit, at
98% is highly acceptable.
Money market interest rate Capital market interest rate
286
The turning points in the interest rate movements are generally well
predicted by the model.
Conclusion
It is possible to analyse interest rates in a number of countries
using relatively simple methods and to develop a set of tools which
are capable of answering 'what if' questions. Although the basic
structure of the model in the various countries is fairly simple, the
figure below shows how the underlining interdependence can
nevertheless complicate matters.
By means of this instrument forecasts can be made for interest-rate
developments as well as to answers what- if questions. Finally it is